Embed Size (px)
Citation preview

Re‐evaluation of Maximum Fuel Temperature of the HTTR at Normal Operation
Hirofumi OHASHI
Nuclear Hydrogen and Heat Application Research CenterJapan Atomic Energy Agency (JAEA)
IAEA Technical Meeting on on Re‐evaluation of Maximum Operating Temperatures and Accident Conditions for High Temperature Reactor Fuel and Structural Materials, 10‐12 July 2012, Vienna, Austria

Outline
1. HTTR overview
2. Evaluation of HTTR fuel temperature at design stage Evaluation method Evaluation results
3. Re‐evaluation of fuel temperature 1st modification using the operation data of the rise‐
to‐power test up to 850oC 2nd modification using new analysis model 3rd modification using the 950˚C operation data
4. Related future tests using HTTR
5. Summary1

High Temperature Engineering Test Reactor (HTTR)
Major specificationFuel Low enriched UO2
Uranium enrichment 3~10wt% (avg. 6wt%)Core PrismaticFuel assembly Pin‐in‐blockModerator GraphitePrimary coolant HeliumThermal power 30 MWInlet temperature 395COutlet temperature 850oC / 950C (Max.)Primary coolant pressure 4 MPaPrimary coolant flow rate 12.4 / 10.2 kg/s
Containment vessel
Reactor pressure vessel
Intermediate heat
exchanger(IHX)
Hot‐ gas duct
HTTR
Fuel Rods Graphite Block
First criticality : 1998 Full power operation (850oC/30 MWt): 2001 950oC operation at full power: 2004 50‐days continuous operation at high outlet
temperature (950oC/30MWt) : 2010
2

Structure of Fuel Assembly
3
Fuel compact Fuel rod Fuel assembly
26mm
39mm
8mm
Coated fuel particle
920μmLow density PyC
SiCHigh density PyC
Fuel kernel,600μm
34mm
Graphite sleeve
Fuel compact
PlugDowel pin
Dowel socket360mm
Fuel handing hole
580mm
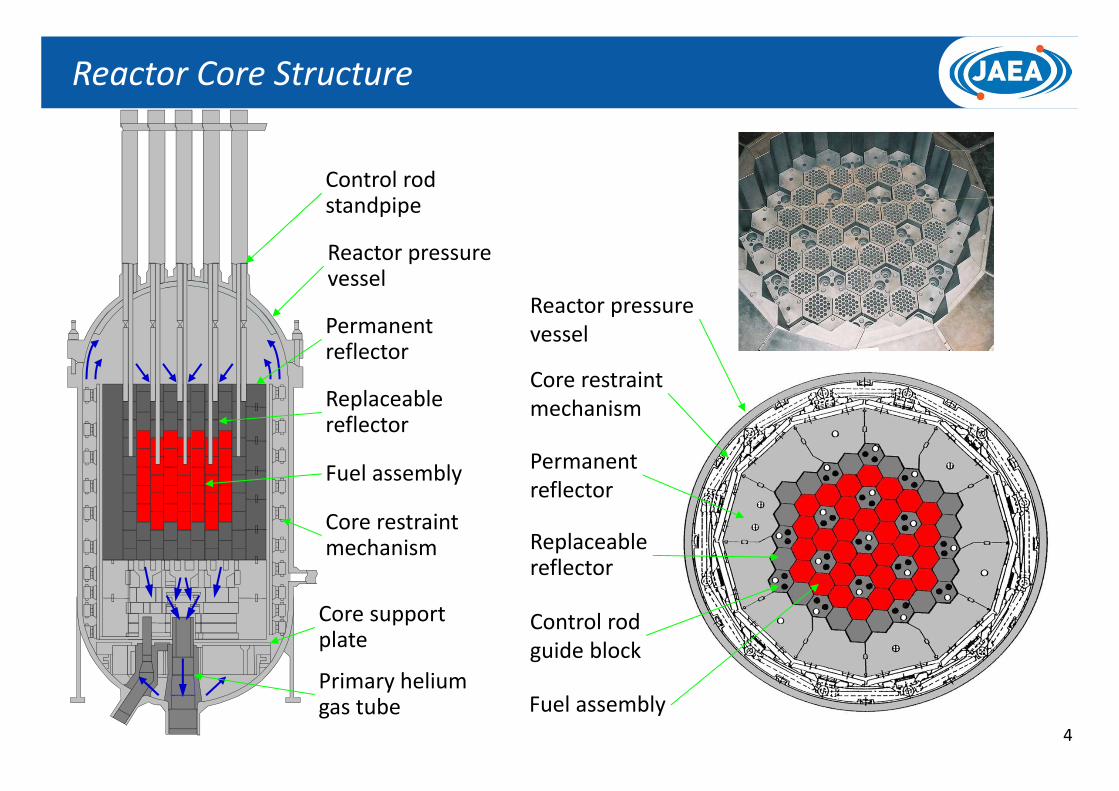
Reactor pressurevessel
Core supportplate
Primary heliumgas tube
Core restraintmechanism
Fuel assembly
Replaceablereflector
Permanentreflector
Control rodstandpipe
Control rodguide block
Permanentreflector
Reactor pressurevessel
Core restraintmechanism
Fuel assembly
Replaceablereflector
Reactor Core Structure
4

Evaluation Method of HTTR Fuel Temperature
FLOWNETIn‐vessel thermal and hydraulic
analysis code
Fuel, control rod, core component, core internal structure design data
Power density and neutron fluence distributions
Nuclear design code
TEMDIMFuel temperature analysis code
Coolant flow rate and coolant temperature distribution
Fuel temperature
(1)
(2)
(3)
5

Top shieldingReplaceable reflector
Fuel assembly
Replaceable reflectorHot plenum
: Gap between each block: Control rod column flow path : Fuel channel
In‐vessel Thermal and Hydraulic Analysis Code “FLOWNET”
6
One‐dimensional model using nodes and branches The flow channels are represented by node, and the nodes are connected by branch. The heat transfer between the branches are taking into account. Flow paths: the main coolant flow, the bypass flow in the inter‐column gaps, the leakage flow through the
permanent reflectors and the cross flow in the horizontal interface gaps of the hexagonal graphite blocks
Ref: S. Saito et al., “Design of High Temperature Engineering Test Reactor (HTTR)”, JAERI 1332 (1994).

: Fuel temperature (℃)
: Coolant inlet temperature (℃)
: Temperature rising (℃)
: Hot spot factor (‐)
: Random factor (e.g., manufacturing tolerances, uncertainties on physical properties) (‐)
: Systematic factor (e.g. total reactor power, coolant flow rate, inlet coolant temperature )(‐)
Gap
Graphite sleeve
Fuel compact
Annular flow path
Fuel rod
Graphite block
Coolant
Coolant
A
A‐Acrosssection
Estimatedpoint
NT
N1T
ginT
A
N2T N
5TN4TN
3T
5
1iii
Gasin
FUEL ∆TFTT
Fundamental equation
n(i)
1j
m(i)
1k
2ki,ji,i fr1fsF
FUELTGasinT
iFi∆T
ji,fs
ki,fr
Fuel Temperature Analysis Code “TEMDIM”
7
Two dimensional cylindrical model based on the power distribution including local power peaking, coolant flow distribution including
redistribution in the fuel column and hot spot factors
i= 1 : Coolant temperature rising2 : Film temperature rising3 : Temperature rising in graphite sleeve4 : Fuel compact‐graphite sleeve gap temperature rising5 : Temperature rising in fuel compact

Hot plenum
(Unit : %) Outlet Inlet
Top plenum 98.9
Control rod
coo
ling channe
l
Fuel coo
ling channe
l
Inne
r colum
n gap
100 100
5.5
5.5
5.5
5.7
7.2
8.8
8.2
7.1
99.30.7
0.4
92.2
92.1
91.6
88.4
88.8
90.1
91.4
1.3
1.4
1.8
3.7
1.7
1.2
1.0
0.4Plenumblock
Replaceablereflector
Fuelblock
Replaceablereflector
Uppershield
Evaluation Result of Fuel Temperature at Design Stage
8
Ref: D. Tochio et al., “Evaluation of Fuel Temperature on High Temperature Test Operation at the High Temperature Gas‐Cooled Reactor ‘HTTR’”, Trans. At. Energy Soc. Japan, 5 [1], p.57‐67(2006).
The effective flow rate for the fuel cooling is about 88% of total flow.
Remains are the leakage flow through the permanent reflectors, flow in the control rod cooling channel, and the bypass flow in the inner column gap.

Evaluation Result of Fuel Temperature at Design Stage
Nominal temp.Maximum temp.
Core Center
12931475
13051474
13021476
12931475
13211492
12951476
13021476
13051474
13211492
12951476
13021476
Temperature limits of HTTR fuel Anticipated operation occurrence: 1600 ˚C Normal Operation : 1495˚C
9
400 600 800 1000 1200 1400 1600Temperature (oC)
(maximum)Compact inner surface (nominal)
1
2
3
4
5
Vertical position
at a fu
el colum
n
(Top)
(Bottom)
Sleeve outer surface
Coolant
Graphite block
Ref: D. Tochio et al., “Evaluation of Fuel Temperature on High Temperature Test Operation at the High Temperature Gas‐Cooled Reactor ‘HTTR’”, Trans. At. Energy Soc. Japan, 5 [1], p.57‐67(2006).
Vertical temp. distribution for the fuel where the maximum fuel temp. appeared.
Horizontal temp. distribution

Re‐evaluation of HTTR Fuel Temperature
(1) 1st modification using the operation data of the rise‐to‐power test up to 850˚C Validation of power and helium flow distributions Revision of operating conditions (e.g., core inlet coolant temperature) Revision of hot spot factors
(2) 2nd modification using new analysis model Detailed mesh model
(3) 3rd modification using the 950˚C operation data in 2004 Revision of core inlet coolant temperature and core coolant flow rate
10

Power den
sity (W
/cc)
0.50
0.75
1.00
F1 F2 F3,F4 F5Column number
1.25
CalculatedMeasured
CenterF4
F5 F2
F4
F1
F3
F5
F1
F3
F2
Power distribution
T/C for core inlet coolant temp.
Center region
Outside region(6 points)
T/C for hot plenum coolant temp.
Coolant tem
perature risin
g (oC)
440
450
460
470
480
490
Center region Outside region
MeasuredCalculated
Flow distribution
Validation of Evaluation Results using HTTR data Estimated power and helium flow distributions were validated using the operation data of the rise‐to‐power test up to 850oC.
Ref: D. Tochio et al., “Evaluation of Fuel Temperature on High Temperature Test Operation at the High Temperature Gas‐Cooled Reactor ‘HTTR’”, Trans. At. Energy Soc. Japan, 5 [1], p.57‐67(2006). 11
The gross gamma ray from the fuel assemblies was measured by GM counter

Design Revised Reasons
Operation day 440 EFPD 160 EFPD Operating condition at 1st 950oC operation
Core inlet coolant temperature 415oC 409oC Operation data
Core coolant flow rate 10.2 kg/s 10.1 kg/s Re‐evaluation of heat and mass balance using operation data
Control rod position 2610 mm 2900 mm Operation data
Systematic factors
Factor for thermalpower
Coolant temp. rise 2.5% 0% No effect of the thermal power error on the coolant temp. rise
Others 2.5% 2.0% Calibration result of thermal power
Factor for axial power distribution 4.0% 0% Measurement results of power
distribution
Factor for flow
distribution
Coolant temp. rise 4.0% 2.0% Re‐evaluation of flow distribution using operation data Film temp. rise 3.2% 1.6%
1st Modification: Modification of Calculation ConditionsBoundary conditions concerning to the operating conditions, and hot spot factors (i.e., systematic factors) were revised using the operation data up to 850oC operation.
12Ref: D. Tochio et al., “Evaluation of Fuel Temperature on High Temperature Test Operation at the High Temperature Gas‐Cooled Reactor ‘HTTR’”, Trans. At. Energy Soc. Japan, 5 [1], p.57‐67(2006).

Hot plenum
(Unit : %) Outlet Inlet
Top plenum 99.6
Control rod
coo
ling channe
l
Fuel coo
ling channe
l
Inne
r colum
n gap
100 100
6.2
6.2
6.2
6.2
6.3
6.0
5.2
5.0
99.20.2
0.2
90.5
90.4
90.2
89.6
90.3
91.4
92.9
1.7
1.7
1.9
2.4
2.1
2.1
0.9
0.5Plenumblock
Replaceablereflector
Fuelblock
Replaceablereflector
Uppershield
1st Modification: Re‐evaluation Result of Fuel Temperature
13
Hot plenum
(Unit : %) Outlet Inlet
Topplenum 98.9
Control rod
coo
ling channe
l
Fuel coo
ling channe
l
Inne
r colum
n gap
100 100
5.5
5.5
5.5
5.7
7.2
8.8
8.2
7.1
99.30.7
0.4
92.2
92.1
91.6
88.4
88.8
90.1
91.4
1.3
1.4
1.8
3.7
1.7
1.2
1.0
0.4Plenumblock
Replaceablereflector
Fuelblock
Replaceablereflector
Uppershield
Design stage 1st modificationFlow distribution
Ref: D. Tochio et al., “Evaluation of Fuel Temperature on High Temperature Test Operation at the High Temperature Gas‐Cooled Reactor ‘HTTR’”, Trans. At. Energy Soc. Japan, 5 [1], p.57‐67(2006).

14
1st Modification: Re‐evaluation Result of Fuel Temperature
13101452
13071463
12911434
13101452
12861431
13111453
13021476
13071463
12861431
13111452
12911434
Nominal temp.Maximum temp.
Core Center
Estimated maximum fuel temperature was decreased from 1492oC at design stage to 1463oC by the re‐evaluation using the operation data.
Fuel temperature
Nominal temp.Maximum temp.
Core Center
12931475
13051474
13021476
12931475
13211492
12951476
13021476
13051474
13211492
12951476
13021476
Design stage 1st modification
Ref: D. Tochio et al., “Evaluation of Fuel Temperature on High Temperature Test Operation at the High Temperature Gas‐Cooled Reactor ‘HTTR’”, Trans. At. Energy Soc. Japan, 5 [1], p.57‐67(2006).

1st Modification: Re‐evaluation Result of Fuel Temperature
(maximum)Compact inner surface (nominal)
400 600 800 1000 1200 1400 1600Temperature (oC)
1
2
3
4
5Vertical position
at a
fuel colum
n
(Top)
(Bottom)
Sleeve outer surface
Coolant
Graphite block
Design stage 1st modification
Temperature distribution
15
400 600 800 1000 1200 1400 1600Temperature (oC)
1
2
3
4
5
Vertical position
at a
fuel colum
n(maximum)
Compact inner surface (nominal)
Sleeve outer surface
(Top)
(Bottom)
Coolant
Graphite block
Ref: D. Tochio et al., “Evaluation of Fuel Temperature on High Temperature Test Operation at the High Temperature Gas‐Cooled Reactor ‘HTTR’”, Trans. At. Energy Soc. Japan, 5 [1], p.57‐67(2006).

Each fuel block is divided into 6 triangular‐meshes for the models of nuclear design andthe fuel temperature analysis.
One fuel rod is represented by the triangular‐mesh of the fuel temperature analysis model .
The rector power calculated by the nucleardesign is allocated for each mesh of the fueltemperature analysis model using the peakingfactor.
The reactor power is multiplied by the hotspot factor to take into account theheterogeneous effect of the nuclear designmodel (i.e., power: +7%).
Allocated rector power×hot spot factor
2nd Modification: Modification of Analysis Model
Old model
16
The hot spot factor related to the heterogeneous effect of the nuclear design model is eliminated by using detailed mesh.
New model

1/6‐divided‐block model Each fuel rod model
Horizontal
Vertical
1
2
3
4
Fuel rod
4 meshes 14 meshes
1234567891011121314
Old model New model
2nd Modification: Modification of Analysis Model
17Ref: D. Tochio et al., “Evaluation of Fuel Temperature on High Temperature Test Operation at the High Temperature Gas‐Cooled Reactor ‘HTTR’”, Trans. At. Energy Soc. Japan, 5 [1], p.57‐67(2006).

FLOWNETIn‐vessel thermal and hydraulic
analysis code
Fuel, control rod, core component, core internal structure design data
Power density and neutron fluence distributions
Nuclear design code
TEMDIMFuel temperature analysis code
Coolant flow rate distribution
(1)
(2)
(4)
MVPContinuous energy Monte Carlo code
Power distribution for each fuel rod
(3)
Fuel temperature
Added
2nd Modification: Modified Evaluation Method
18

12611382
12561368
13141428
12511372
12211330
12651387
13021476
12581371
12141322
12551377
13031417
13101452
13071463
12911434
13101452
12861431
13111453
13021476
13071463
12861431
13111452
12911434
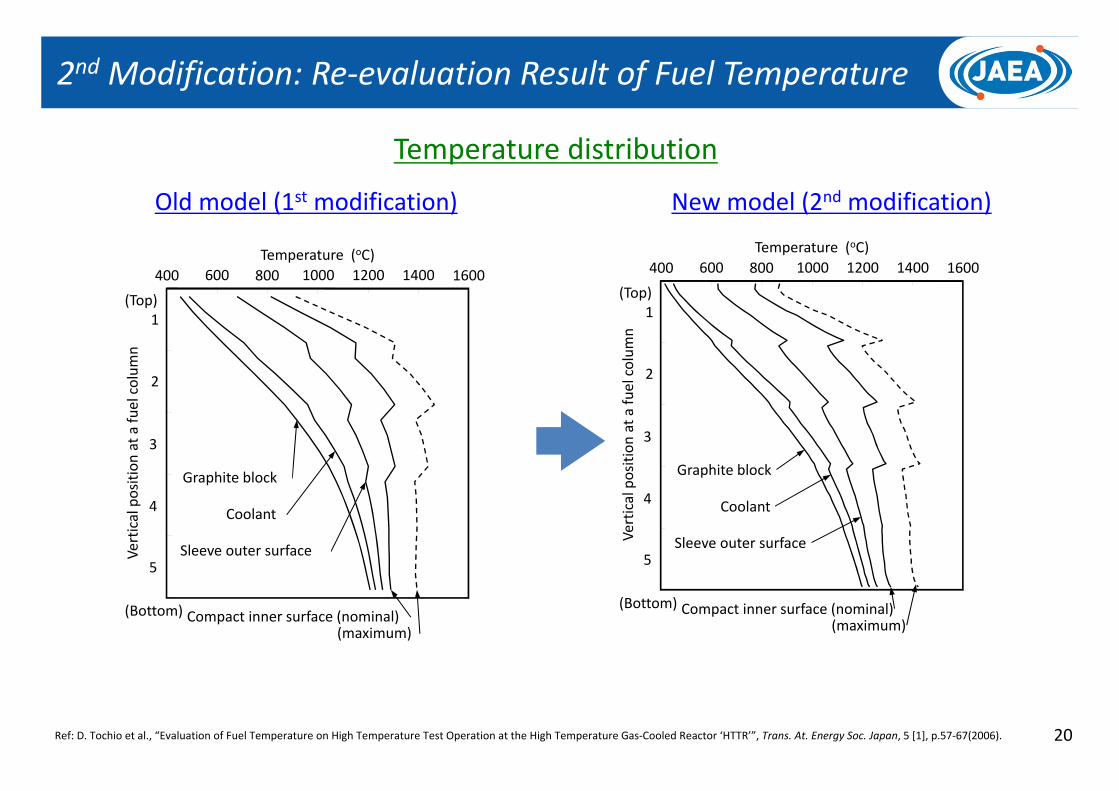
Old model (1st modification) New model (2nd modification)
Old model New model Temp. difference
Maximum fuel temp. 1463oC 1428oC ‐35oC
Core average fuel temp. 1178oC 1018oC ‐160oC
Nominal temp.Maximum temp.
2nd Modification: Re‐evaluation Result of Fuel Temperature
19
Fuel temperature
Ref: D. Tochio et al., “Evaluation of Fuel Temperature on High Temperature Test Operation at the High Temperature Gas‐Cooled Reactor ‘HTTR’”, Trans. At. Energy Soc. Japan, 5 [1], p.57‐67(2006).
2nd Modification: Re‐evaluation Result of Fuel Temperature
20
400 600 800 1000 1200 1400 1600Temperature (oC)
1
2
3
4
5
Vertical position
at a
fuel colum
n(maximum)
Compact inner surface (nominal)
Sleeve outer surface
(Top)
(Bottom)
Coolant
Graphite block
400 600 800 1000 1200 1400 1600Temperature (oC)
1
2
3
4
5
Vertical position
at a
fuel colum
n
(maximum)Compact inner surface (nominal)
Sleeve outer surface
(Top)
(Bottom)
Coolant
Graphite block
Old model (1st modification) New model (2nd modification)
Temperature distribution
Ref: D. Tochio et al., “Evaluation of Fuel Temperature on High Temperature Test Operation at the High Temperature Gas‐Cooled Reactor ‘HTTR’”, Trans. At. Energy Soc. Japan, 5 [1], p.57‐67(2006).

3rd Modification: Re‐evaluation Result of Fuel Temperature
21
Analysis result(2nd modification)
Operation data at 950oC operation in 2004
Coolant temp. (oC)
Core inlet
Center region 399 396
Outside region 405 402
Core outlet
Center region 984 991
Outside region 952 954
Temperature rising
Center region 585 595
Outside region 547 551
Maximum fuel temp. (oC) 1,428Analysis result using operation
data (3rd modification)1,435
Ref: D. Tochio et al., “Evaluation of Fuel Temperature on High Temperature Test Operation at the High Temperature Gas‐Cooled Reactor ‘HTTR’”, Trans. At. Energy Soc. Japan, 5 [1], p.57‐67(2006).

Fuel Temperature Measurement (Future Test)
22
Objectives To develop the fuel temperature measuring technique for the prismatic HTGR To upgrade the core design technology for the prismatic HTGR
Methods Temperature monitors using 22 kinds of melting wire in temperature range 600 ‐1390oC Irradiation performance of the melt‐wire temperature monitor has been confirmed by
JMTR capsule irradiation test. Temperature monitors will be inserted into the fuel assembly to measure temperature
distribution of the HTTR core.
Melt‐wire temperature monitor
Monitors will be stacked into hole under the dowel pin of the fuel assembly
Fuel assembly
HTTR
Ref: Y. Tachibana et al., “Test Plan using the HTTR for Commercialization of GTHTR300C”, JAEA‐Technology 2009‐063 (2009).
Melt‐wire temp. monitor
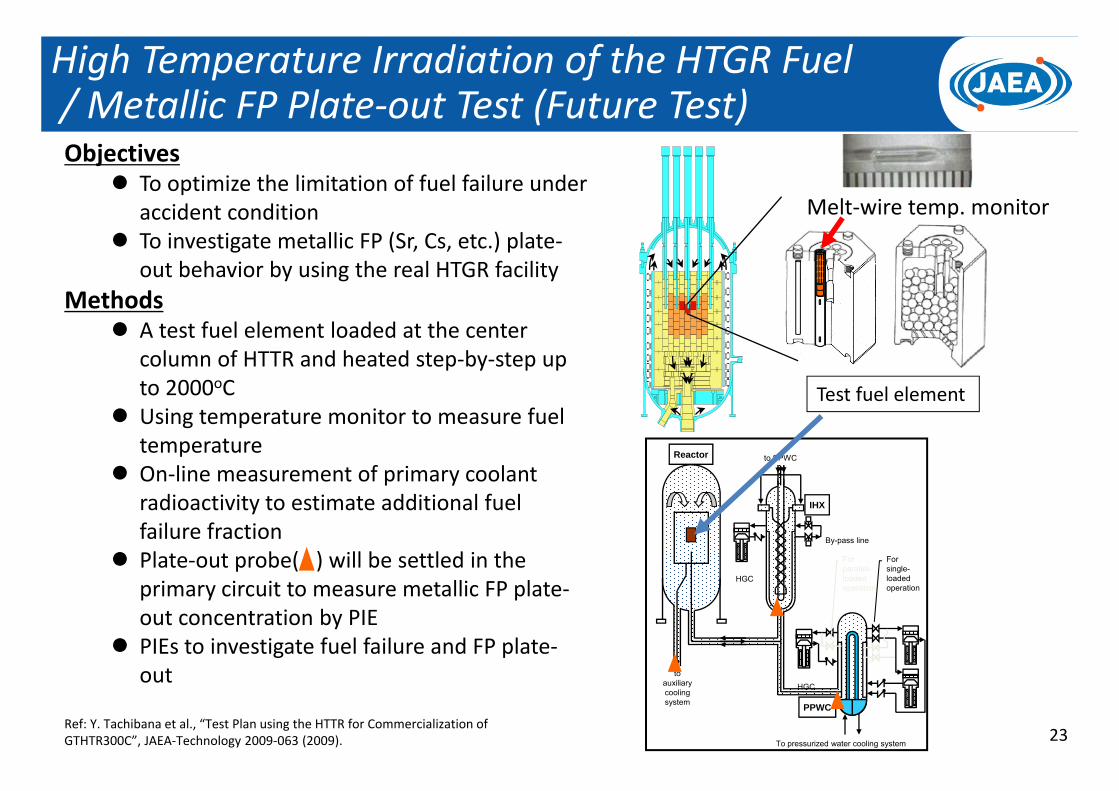
High Temperature Irradiation of the HTGR Fuel/ Metallic FP Plate‐out Test (Future Test)Objectives
To optimize the limitation of fuel failure under accident condition
To investigate metallic FP (Sr, Cs, etc.) plate‐out behavior by using the real HTGR facility
Methods A test fuel element loaded at the center
column of HTTR and heated step‐by‐step up to 2000oC
Using temperature monitor to measure fuel temperature
On‐line measurement of primary coolant radioactivity to estimate additional fuel failure fraction
Plate‐out probe( ) will be settled in the primary circuit to measure metallic FP plate‐out concentration by PIE
PIEs to investigate fuel failure and FP plate‐out to
auxiliarycoolingsystem
Reactor
PPWC
IHX
to SPWC
By-pass line
HGC
HGC
Forsingle-loadedoperation
Forparallel-loadedoperation
To pressurized water cooling system23
Test fuel element
Ref: Y. Tachibana et al., “Test Plan using the HTTR for Commercialization of GTHTR300C”, JAEA‐Technology 2009‐063 (2009).

Summary
24
HTTR fuel temperature was re‐evaluated using the HTTR operating data and new analysis model.
The summary of the re‐evaluation results of the maximum fuel temperature is the following: Design stage : 1492oC 1st modification using 850˚C operation data : 1463oC 2nd modification new analysis model : 1428oC 3rd modification using 950˚C operation data : 1435oC
We are planning to measure the HTTR fuel temperature using the melt‐wire temperature monitor.


![1 Principle of Low-temperature Fuel Cells Using an Ionic ... · temperature fuel cell (LTFC), such as a proton exchange membrane fuel cell (PEMFC) or an alkaline fuel cell (AFC) [1–5]](https://img.pdfslide.net/doc/110x75/60471c1ed7264309596b5ab0/1-principle-of-low-temperature-fuel-cells-using-an-ionic-temperature-fuel-cell.jpg)