Embed Size (px)
DESCRIPTION
Citation preview

Design of Clinical Trials for Development of Molecularly
Targeted Drugs
Richard Simon, D.Sc.National Cancer Institute
linus.nci.nih.gov/brb


Objectives of Phase I Trials
• Develop dose/schedule• Determine whether the drug inhibits the
targeted pathway
Dose/Schedule
• Ideal is to have a drug and target so specific for cancer cells that the drug can be delivered repeatedly at doses that completely shut down the de-regulated pathway without toxicity to normal cells
• Because most current targets are not specific to cancer cells, most targeted drugs are toxic

Dose/Schedule
• Few examples of drugs whose effectiveness at inhibiting target decreases with dose after maximum
• Optimizing dose for maximum inhibition of target is difficult due to assay variability and need for tumor biopsies
• Titrating dose to achieve a pre-specified plasma concentration at which target is inhibited in pre-clinical systems is more feasible

Dose/Schedule
• Determining dose just below MTD which can be delivered repeatedly is often the most practical approach
• Accrue an additional cohort of patients at that selected dose to determine whether the target is inhibited

Components of a Phase I Design
• Starting dose• Dose increments• Patients per cohort• Decision rules for dose assignment• Intra-patient dose modification rules• Stopping rule• Method of analysis

Conventional Phase I Designs
• Starting dose 1/10th LD10 in most sensitive species
• Modified Fibonacci dose steps– 100%, 67%, 50%, 40%, 33%, 33%, …
• Cohorts of 3-6 new patients per dose level• Define MTD as highest dose with <33% DLT• Use first course information only• Use DLT vs non-DLT dichotomy• No intra-patient dose escalation

Enter 3 patients
0/3 1/3 >1/3
1/6 >1/6
Enter 3 patientsat same dose
Escalate dose fornext cohort
MTDexceeded

Limitations of Conventional Phase I Trial Designs
• Many patients may be treated at very low doses
• Trial may take a long time to complete
• Limited information yield

Accelerated titration designs for phase I clinical trials in
oncologyR Simon, B Freidlin L Rubinstein et al.J National Cancer Institute 89:1138-47,
1997.

Cohort Escalation Designs1 Cohorts of 3 new patients per dose level with 40%
dose increments. If 1 of 3 experience DLT in firstcourse, expand to cohort of 6
2 Cohorts of 1 new patient per dose level. When firstinstance of first course DLT or second instance of firstcourse grade 2 toxicity is observed, revert to design 1.
3 Same as design 2 except that double dose steps areused during accelerated stage.
4 Cohorts of 1 new patient per dose level and doubledose steps. When first instance of any course DLT orsecond instance of any course grade 2 toxicity isobserved, revert to design 1.

Within Patient Escalation Options
A No within patient dose escalation
B Escalate if grade 0-1 toxicity at previous course.
De-escalate if grade 3+ toxicity at previous course.
Do not assign dose at which 2 previous pts have experienced 3+ toxicity at that course or earlier.

Testing the 8 DesignsWe fit the model to 20 phase I trials, relating to:
Flavone acetic acid (5)Piroxantrone (2)Chloroquinoxaline sulfonamide (2)Pyrazoloacridine (1)Cyclopentenylcytosine (1)Fostriecin (2)9-Aminocamptothecin (2)Penclomedine (2)
For each trial, we performed 1000 simulations for each of the 8 designs, usingthe model.
We compiled the results to compare the performances of the 8 designs.

Model Relating Toxicity to Dose
( )log
=dose for i'th patient in course j
=cumulative dose up to course j for patient i
=cumulative toxicity parameter=patient specific effect=course specific random variation
ij ij ij i ij
ij
ij
i
ij
Y d D
d
D
α β ε
αβε
= + + +

Model Relating Toxicity to Dose
Yij = log (dij + αDij) + βi + εijYij < K1 grade 0-1 toxicityK1 < Yij < K2 grade 2 toxicityK2 < Yij < K3 grade 3 toxicityYij > K3 grade 4 toxicity

Estimates of Parameters for 20 Clinical Trials
Drug α (K1-lnd0)ln1.4
(K2-K1)/ln1.4
(K3-K2)/ln1.4
σβ σε
Flavone acetic acid
0 16.2 6.9 35 no grade 4 0.26 1.9
Flavone acetic acid
0 16.1 8.4 29 no grade 4 2.9 0.85
Flavone acetic acid
0 4.4 2.4 0.95 0.47 0.59
Flavone acetic acid
0.24 8.0 2.9 2.2 0 0.83
Flavone acetic acid
0 18.5 6.4 20 no grade 4 0.006 2.8
Piroxantrone 0.08 8.4 2.7 2.3 1.03 0.42
Piroxantrone 0 16.4 13.3 no grade 3+
9.5 no grade 3+ 0 1.8
Chloroquinoxaline
0.04 17.3 2.6 1.6 0.88 0.87
Chloroquinoxaline
0 13.7 4.6 2.9 0.62 0.90
Pyrazinediazohydroxide
2.5 12.0 4.1 5.8 1.3 1.5
Pyrazine 0.24 6.6 1.3 0.53 0.002 0.65
Pyrazine 0.02 4.6 0.53 0.56 0.001 0.18
Pyrazoloacrine 0.04 8.9 1.0 1.3 0.24 0.32
Cyclopentomyl 0 4.4 0.83 0.18 0.21 0.27
Fostriecin 0.04 3.5 3.6 4.5 1.06 0.54
Fostriecin 0 6.3 7.2 18 no grade 4 0.58 1.6
9-AC 0 6.4 0.48 0.39 0.24 0.11
9-AC 0 6.0 0.51 1.1 0.35 0.27
Penclomadine 0.05 6.0 3.7 15 no grade 4 0.68 0.81
Penclomadine 0 5.8 2.0 17 no grade 4 0.43 0.53

Patients and Cohorts D istribution for 8 Designs
0
5
10
15
20
25
30
35
40
T otalpatients
C ohorts
Ave
rage
: 20
Tria
ls
D es ign 1AD esign 1BD esign 2AD esign 2BD esign 3AD esign 3BD esign 4AD esign 4B

T o xic ity D istrib u tio n fo r 8 D esig n s
0
0.1
0.2
0.3
0.4
0.5
0.6
0.7
No
toxi
city
Mild
toxi
city
DLT
Una
ccep
t.to
xici
ty
Per
cent
of p
atie
nts
D es ign 1AD es ign 1BD es ign 2AD es ign 2BD es ign 3AD es ign 3BD es ign 4AD es ign 4B

T o xic ity D istrib u tio n fo r 8 D esig n s
0
5
10
15
20
25
No
toxi
city
Mild
toxi
city
DLT
Una
ccep
t.to
xici
ty
Num
ber o
f pat
ient
s
D es ign 1AD es ign 1BD es ign 2AD es ign 2BD es ign 3AD es ign 3BD es ign 4AD es ign 4B

Accelerated Titration Designs• Reduces patient under-treatment
– 1 patient per dose level– intra-patient dose escalation
• Reduces number of patients – 1 patient per dose level– dose doubling until toxicity
• Improves information yield– cumulative toxicity– inter-patient variability

Software Available
• S+ function to fit model to phase I data– Point and interval estimates of parameters– Graphical representation of dose/response
• Excel spreadsheet and macro for quality control of dose level assignment and maintenance of dose/toxicity data
• Available at http://linus.nci.nih.gov/~brb

Phase I Designs Using Biological Endpoint
• Dose giving plasma concentration at which target is inhibited in animal model
• Titration within patients
• Optimizing dose for target inhibition in tumor or surrogate tissue

Korn et al Phase I Design for Finding Biologically Active Dose
Buolamwini & Adjei, Novel Anticancer Drug Protocols, Humana 2003
• Treat one patient per dose level until one biological response is seen
• After the first response, treat cohorts of 3-6 patients per dose– With 0-1 responses in 3 patients, escalate dose for next cohort– With 2-3 responses in 3 patients, expand cohort to 6 patients– With 5-6 responses, end– With <5 responses, escalate dose for next cohort

Phase I Determination ofMinimum Biologically Active Dose
Probability of Biological Response
Number of Patients Treated at Dose
Probability of No Biological Responses
0.20 11 0.09
0.25 9 0.08
0.30 7 0.08
0.40 5 0.08
0.50 4 0.06

• Trying to determine whether there is a dose-response relationship is a phase III objective.
• Using more than two dose levels to determine an OBD is even more ambitious.

Traditional Phase II Trials
• Estimate the proportion of tumors that shrink by 50% or more when the drug is administered either singly or in combination to patients with advanced stage tumors of a specific primary site

Objectives of Phase II Trials of Targeted Agents
• Determine whether there is a population of patients for whom the drug demonstrates sufficient anti-tumor activity to warrant a phase III trial
• Optimize the regimen in which the drug will be used in the phase III trial
• Optimize the target population for the phase III trial
• Develop tumor classifier for identifying target population and assay for reproducibly reading classifier

Endpoints for Phase II
• Tumor shrinkage• Inhibition of target pathway
– Ideally established in phase I• Time to progression or proportion of
patients without progression at a specified time

Optimal two-stage designs for phase II clinical trials
R SimonControlled Clinical Trials 10:1-10, 1989.

Optimal Two-Stage Phase II Designs
• Enter n1 patients• If response rate ≤ r1/n1 reject drug• Otherwise, enter n2 additional patients• If response rate ≤ r2/(n1+n2) reject drug

Optimal Two-Stage Phase II Designs
• Given p0 p1 α and β• Find n1 n2 r1 r2 to minimize
– E(sample size | p0)– n1 + n2
• Pr(reject drug | p0) ≥ 1- α• Pr(reject drug | p1) ≤ β• otsd.zip software at Statlib or
linus.nci.nih.gov/brb• On-line program at BRB website

Optimal Single Arm Two-Stage Design of Tumor Shrinkage
• To distinguish 5% (p0) response rate from 25% (p1) response rate with 10% false positive and false negative error rates:– Accrue 9 patients. Stop if no responses– If at least 1 response in first 9, continue accrual to 24
patients total• “Accept” treatment if at least 3/24 responses
• For regimens with 5% true response rate, the probability of stopping after 9 patients is 63%


Patient Accrual in Phase II
• If the phase II trial for a particular primary site is not enriched for patients thought responsive to the drug, an initial stage of 10-15 patients may contain very few responsive patients. – Single stage design of 25-30 patients may be better
• Accrual of separate cohort of 25-30 patients whose tumors express target gives best chance to evaluate drug

Non-randomized Phase II Designs of Combinations
• Babe Ruth designs• Difficult to interpret
– Phase II designs with phase III objectives• Thall-Simon Bayesian phase IIb designs
using explicit controls to specify prior for control response rate

• Thall, PF, and Simon, R. Incorporating historical control data in planning phase II clinical trials. Stat. in Med. 9:215-228, 1990.
• Thall, P F and Simon R. A Bayesian approach to establishing sample size and monitoring criteria for phase II clinical trials. Controlled Clinical Trials 15:463-481, 1994.
• Thall, PF, Simon R. and Estey E. Bayesian designs for Clinical trials with multiple outcomes.Statistics in Medicine 14:357-379, 1995
• Thall PF, Simon R, Estey E: A new statistical strategy for monitoring safety and efficacy in single-arm clinical trials. Journal of Clinical Oncology 14:296-303, 1996.

Using Time to Progression as Endpoint in Phase II Trials
• Requires comparison to distribution of progression times for patients not receiving drug
• Proportion of patients without progression at a specified time also requires comparison for evaluation
• Historical control vs randomized comparison

Time to Progression Endpoint
• It is difficult to reliably evaluate time to progression endpoint without a randomized control group
• With historical controls, specific controls should be used for whom comparability of prognosis and surveillance for progression can be established

Number of Patients on Experimental Treatment to have 80% Power for
Detecting 15% Absolute Increase (α=.05) in PFS vs Historical Controls
Number of Historical Controls
90% Control Progression at
landmark t
80% Control Progression at
landmark t20 >1000 >1000
30 223 >1000
40 108 285
50 80 167
75 58 101
100 50 83
200 42 65

Randomized Phase II Designs
• Randomized screening designs for selecting among new regimens
• Randomized discontinuation design• Phase 2.5 design• Phase 2/3 design

Randomized Phase II Screening Designs Using Biological Response
• For evaluating multiple new drugs or regimens to select most promising for further evaluation– Arm with greatest observed response rate is selected regardless
of how small the difference is– Not for comparing a new drug/regimen to control
• Randomization better ensurs uniform patient selection and evaluation
• Can be viewed as parallel optimum two-stage designs with randomization. Each arm evaluated as activity level >p1 or <p0

Patients per Arm for 2-arm Randomized Selection Design Assures Correct Selection When True Response Probabilites Differ by
10%
Response Probability of Inferior Rx
85% Probability of Correct Selection
90% Probability of Correct Selection
5% 20 29
10% 28 42
20% 41 62
40% 54 82

Randomized Selection Design With Binary Endpoint
• K treatment arms• n patients per arm• Select arm with highest observed
response rate• pi = true response probability for i’th arm• pi = pgood with probability γ, otherwise pbad
• With N total patients, determine K and n to maximize probability of finding a good rx

Probability of Selecting a Good Treatment When pbad=0.1, pgood=0.5 and γ=0.1
n K Probability
5 20 0.626
10 10 0.590
15 7 0.511
20 5 0.414
25 4 0.344

Probability of Selecting a Good Treatment When pbad=0.1, pgood=0.3 and γ=0.1
n K Probability
5 20 0.319
10 10 0.375
15 7 0.383
20 5 0.341
25 4 0.309

Phase 2.5 Trial Design for Comparing New Regimen to Control Using PFS Endpoint
• Simon R et al. Clinical trial designs for the early clinical development of therapeutic cancer vaccines. Journal of Clinical Oncology 19:1848-54, 2001
• Korn EL et al. Clinical trial designs for cytostatic agents: Are new approaches needed? Journal of Clinical Oncology 19:265-272, 2001

Phase 2.5 Trial Design
• Randomization to chemotherapy alone or with new drug
• Endpoint is progression free survival regardless of whether it is a validated surrogate of survival
• One-sided significance level can exceed .05 for analysis and sample size planning

Number of Events Required for Randomized Trial With Time to Event Endpoint
( )
2
2ln
=hazard ratio or ratio of medians
k kE α β
δ
δ
⎛ ⎞+= ⎜ ⎟
⎝ ⎠
For α=0.05, β=0.20, δ=1.67 (40% reduction in hazard),E=47 events are required
For α=0.10, 35 events For α=0.05, β=0.20, δ=1.5, (33% reduction in hazard),
E=75 events are requiredFor α=0.10, 55 events

Total Sample SizeRandomized Phase 2.5
2 years accrual, 1.5 years followup
Improvement in median
PFS
Hazard Ratio α=.05 α=.10 α=.20
4 → 6 months 1.5 216 168 116
6 → 9 months 1.5 228 176 120
4 → 8 months 2 76 60 40
6→12 months 2 84 64 44

Randomized Discontinuation Design (RDD)(Ratain et al.)
• The RDD starts all patients on the drug• Patients with early progression go off study• Patients with objective response continue on the
drug• Other patients are randomized to continue the
drug or stop administration and be observed• PFS from time of randomization is the endpoint

Randomized discontinuation design vs. upfront randomization
First stage -16 weeks, second stage - 16 weeks, progression is defined as a 120% increase from baseline.Overall sample size chosen to have 50 patients per arm in stage 2
Randomized discontinuation design Upfront randomizationFirst stage SD
rate at 16 weeksSecond stage PD rate at 32
weeksCAI/placebo
Power secondstage
PD rates at 32 weeks
CAI/placebo
Power
0 333 .30 .73/.73 .05 .92/.92 .05
.1 290 .345 .70/.735 .056 .90/.92 .09
.2 250 .40 .67/.74 .12 .87/.92 .25
.3 216 .47 .63/75 .245 .83/.92 .51
.4 184 .54 .59/.76 .44 .78/.92 .77
.5 160 .63 .53/.76 .69 .70/.92 .94
.6 138 .73 .45/.77 .90 .60/.92 .99
CAIEffect
OverallSample
size

Comparison of Designs Under Modified Model of Treatment EffectTreatment is assumed to have no effect for patients with rapidly growing tumors; ie
tumors which would grow untreated by more than cutoff % at 16 weeks
Randomized discontinuation design Upfront randomizationFirst stage SD
rate at 16 weeks
Second stage PD rate
at 32 weeks
CAI/placebo
Power secondstage
PD rates at 32 weeks
CAI/placebo
Power
.4 20% 184 .54 .59/.76 .44 .78/.92 .77
.4 17% 184 .54 .59/.76 .44 .81/.92 .60
.4 13% 184 .54 .59/.76 .44 .85/.92 .32
.6 30% 138 .73 .45/.77 .89 .60/92 .99
.6 23% 138 .73 .45/.77 .89 .64/92 .97
.6 20% 138 .73 .45/.77 .89 .70/92 .90
.6 15% 138 .73 .45/.77 .89 .81/92 .49
CAIEffect
Cutoff OverallSample size

Randomized Discontinuation Design (RDD)
• The RDD can facilitate observing an effect of the drug on PFS compared to a standard randomized phase 2.5 design– The RDD requires a large sample size – The RDD is not a phase III trial because it
does not establish the clinical utility of administering the drug to the patient compared to not administering it

Phase II/III Design
• Randomized trial comparing regimen containing new drug to control regimen
• Perform interim analysis comparing treatments using PFS (progression-free survival) endpoint
• If ppfs<p* then continue trial to evaluate phase III endpoint
• Otherwise, terminate trial

• Conducting a phase III trial in the traditional way with tumors of a specified site/stage/pre-treatment category may result in a false negative trial– Unless a sufficiently large proportion of the
patients have tumors driven by the targeted pathway

• Positive results in phase III trials may be driven by a subset of patients whose tumors are driven by the targeted pathway– Such trials may result in treatment of the
majority with very expensive drugs for the benefit of the minority

• It is important to characterize in phase II studies which tumors are most likely to be sensitive to the drug

Strategies for Development of Genomic Classifiers
• Type of Classifier– Single gene or protein based on knowledge of therapeutic target
• HER2 amplification• EGFR mutation or amplification
– Empirically determined based on correlating gene expression or genotype to patient outcome after treatment.
• When to develop Classifier– During phase II
– After failed phase III trial or after broad indication drug approval

Single gene or protein based on knowledge of therapeutic target
• Often there will be several assays that can be used
• Phase II development is a good time to establish which assay should be used in phase III
• The assay to be used for either selecting patients for phase III trial or for testing hypotheses in the phase III trial should be determined before starting the phase III trial

• Refining the target based single gene or protein assay to use in phase III can be accomplished either from traditional single arm phase II trials with response endpoint or from randomized phase 2.5 trials with PFS endpoint

Guiding Principle
• The data used to develop the classifier must be distinct from the data used to test hypotheses about treatment effect in subsets determined by the classifier– Developmental studies are exploratory– Studies on which treatment effectiveness
claims are to be based should be definitive hypothesis testing studies based on completely pre-specified classifiers

Development of Empirical Gene Expression Based Classifier
• 20 phase II responders are needed to compare to non-responders in order to develop signature for predicting response– Dobbin KK, Simon RM. Sample size planning
for developing classifiers using high dimensional DNA microarray data, Biostatistics (In Press); available at http://linus.nci.nih.gov

Summary
• Phase I trials of molecularly targeted agents should generally be based on determining a dose that can be delivered repeatedly over time with acceptable toxicity and then evaluating whether the targeted pathway is inhibited at that dose
• Phase II trials are most efficient if anti-tumor effect can be evaluated in individual tumors rather than use of PFS

Summary
• Phase II trials should include establishment and refinement of classifiers of which tumors are most likely to respond
• Such classifiers should be completely specified prior to launching of phase III trials
• Phase III trials should incorporate prospectively specified plans for the utilization of biomarker classifiers of patients with sensitive tumors

Moving from Correlative Studies to Predictive Medicine
Richard Simon, D.Sc.Chief, Biometric Research Branch
National Cancer Institutehttp://linus.nci.nih.gov/brb
Biomarker
• “Any biological measurement that provides actionable information regarding disease progression, pharmacology, or safety that can be used as a basis for decision making in drug development.”– J. Boguslavsky

• “I don’t know what ‘clinical validation’ [of a biomarker] means. The first thing you have to do is define a purpose for the biomarker. Validation is all about demonstrating fitness for purpose.”– Dr. Stephen Williams, Pfizer

“Biomarkers”
• Surrogate endpoints– A measurement made on a patient before,
during and after treatment to determine whether the treatment is working
• Predictive classifier– A measurement made before treatment to
predict whether a particular treatment is likely to be beneficial

Surrogate Endpoints
• It is extremely difficult to properly validate a biomarker as a surrogate for clinical outcome. It requires a series of randomized trials with both the candidate biomarker and clinical outcome measured

Cardiac Arrhythmia SupressionTrial
• Ventricular premature beats was proposed as a surrogate for survival
• Antiarrythmic drugs supressed ventricular premature beats but killed patients at approximately 2.5 times that of placebo
• It is rare that we understand disease pathophysiology well enough to argue that a biomarker is self evidently a proper surrogate endpoint for clinical utility
• It is often more difficult and time consuming to properly “validate” an endpoint as a surrogate than to use the clinical endpoint in phase III trials
• The time frame for validating a surrogate is inconsistent with the time frame for initiating a pivotal study

Surrogate Endpoints
• It is often more difficult to properly “validate” a surrogate than to use the clinical endpoint in phase III trials

Using Intermediate Endpoints Not Established as Surrogates of Clinical Benefit
• Biomarkers can be useful in phase I/II studies and need not be validated as surrogates for clinical outcome
• Unvalidated surrogates can also be used for early termination of phase III trials. The trial should continue accrual and follow-up to evaluate true endpoint if treatment effect on partial surrogate is sufficient

Biomarkers for Treatment Selection
• Oncologists need improved tools for selecting treatment for individual patients
• Most cancer treatments benefit only a minority of patients to whom they are administered
• Being able to predict which patients are likely to benefit would save patients from unnecessary toxicity, inconvenience and enhance their chance of receiving a drug that helps them
• The current over treatment of patients results in a major expense for individuals and society

Oncology Needs Predictive Markersnot Prognostic Factors
• Most prognostic factors are not used because they are not therapeutically relevant
• Most prognostic factor studies use a convenience sample of patients for whom tissue is available. Generally the patients are too heterogeneous to support therapeutically relevant conclusions

Pusztai et al. The Oncologist 8:252-8, 2003
• 939 articles on “prognostic markers” or “prognostic factors” in breast cancer in past 20 years
• ASCO guidelines only recommend routine testing for ER, PR and HER-2 in breast cancer
• “With the exception of ER or progesterone receptor expression and HER-2 gene amplification, there are no clinically useful molecular predictors of response to any form of anticancer therapy.”

Predictive Classifiers
• Most cancer treatments benefit only a minority of patients to whom they are administered– Particularly true for molecularly targeted drugs
• Being able to predict which patients are likely to benefit would – save patients from unnecessary toxicity, and enhance
their chance of receiving a drug that helps them– Help control medical costs

“If new refrigerators hurt 7% of customers and failed to work for
another one-third of them, customers would expect refunds.”
BJ Evans, DA Flockhart, EM Meslin Nature Med 10:1289, 2004

• Clinical trial for patients with breast cancer, without nodal or distant metastases, Estrogen receptor positive tumor– 5 year survival rate for control group (surgery
+ radiation + Tamoxifen) expected to be 90%– Size trial to detect 92% survival in group
treated with control modalities plus chemotherapy

Treating the Many for the Benefit of the Few
• Acceptable to industry• Acceptable to statisticians
– Broad eligibility• Uncertainty principle
– Avoid subset analysis• “Do it but don’t believe it”
• Convenient for treating physician• Not so good for patients or for their health
budget


• “Hypertension is not one single entity, neither is schizophrenia. It is likely that we will find 10 if we are lucky, or 50, if we are not very lucky, different disorders masquerading under the umbrella of hypertension. I don’t see how once we have that knowledge, we are not going to use it to genotype individuals and try to tailor therapies, because if they are that different, then they’re likely fundamentally … different problems…”– George Poste

Conventional Broad Eligibility Phase III Trials May Result In
• Large trials with false negative results because the proportion of patients who benefit is too small to provide adequate statistical power
• Statistically significant outcome that results in subsequent treatment of many patients who don’t benefit

• Targeted clinical trials can be much more efficient than untargeted clinical trials, if we know who to target

• In new drug development, the role of a classifier is to select a target population for treatment– The focus should be on evaluating the new
drug in a population defined by a predictive classifier, not on “validating” the classifier

• FDA criteria for validation of surrogate endpoints should not be applied to predictive classifiers

There Should Be No Requirement For
• Demonstrating that the classifier or any of its components are “validated biomarkers of disease status”
• Ensuring that the individual components of the classifier are correlated with patient outcome or effective for selecting patients for treatment
• Demonstrating that repeating the classifier development process on independent data results in the same classifier

One Should Require That
• The classifier be reproducibly measurable
• The classifier in conjunction with the medical product has clinical utility

Biomarker validation vspharmacogenomic classifier utilization
• Adoption of a pharmacogenomic classifier to restrict the use of a treatment in wide use should be based on adequate validation of the classifier– Validation means demonstrating that the classifier
leads to better clinical outcome• In new drug development, the role of a classifier
is to select a target population for treatment – The focus should be on evaluating the new drug, not
on validating the classifier

Developmental Strategy (I)
• Develop a diagnostic classifier that identifies the patients likely to benefit from the new drug
• Develop a reproducible assay for the classifier• Use the diagnostic to restrict eligibility to a
prospectively planned evaluation of the new drug
• Demonstrate that the new drug is effective in the prospectively defined set of patients determined by the diagnostic

Using phase II data, develop predictor of response to new drugDevelop Predictor of Response to New Drug
Patient Predicted Responsive Patient Predicted Non-Responsive
Off StudyNew Drug Control

Evaluating the Efficiency of Strategy (I)
• Simon R and Maitnourim A. Evaluating the efficiency of targeted designs for randomized clinical trials. Clinical Cancer Research10:6759-63, 2004.
• Maitnourim A and Simon R. On the efficiency of targeted clinical trials. Statistics in Medicine 24:329-339, 2005.
• reprints and interactive sample size calculations at http://linus.nci.nih.gov/brb

Pharmacogenomic Model for Two Treatments With Binary Response
•Molecularly targeted treatment E•Control treatment C•γ Proportion of patients that express target•pc control response probability•response probability for E patients who express target is (pc + δ1)•Response probability for E patients who do not express target is (pc + δ0)

Approximations
• Observed response rate ~ N(p,p(1-p)/n)
• pe(1-pe) ~ pc(1-pc)

Two Clinical Trial Designs
• Un-targeted design– Randomized comparison of E to C without
screening for expression of molecular target
• Targeted design– Assay patients for expression of target– Randomize only patients expressing target

Number of Randomized Patients Required
• Type I error α• Power 1-β for obtaining significance
21 12( )c c e e
e c
k kn p q p q
p pα β− −+⎛ ⎞
= + ⎜ ⎟−⎝ ⎠

• For targeted design – pe=pc+δ1
– pe-pc= δ1
• For un-targeted design– pe=(1-γ)(pc+δ0)+γ(pc+δ1)– pe-pc= γ δ1+(1- γ) δ1

Randomized Ratio(normal approximation)
• RandRat = nuntargeted/ntargeted
• δ1= rx effect in marker + patients• δ0= rx effect in marker - patients• γ =proportion of marker + patients• If δ0=0, RandRat = 1/ γ 2
• If δ0= δ1/2, RandRat = 4/(γ +1)2
2
1
1 0(1 )RandRat δ
γδ γ δ⎛ ⎞
≈ ⎜ ⎟+ −⎝ ⎠

Randomized Rationuntargeted/ntargeted
Proportion Assay Positive
No Treatment Benefit for Assay Negative
Patients
Treatment Benefit for Assay Negative
Patients is Half That for Assay Positive
Patients
0.75 1.78 1.31
0.5 4 1.78
0.25 16 2.56

Screened Ratio
γAssay +
δ0=0 δ0= δ1/2
0.75 1.33 0.98
0.5 2 0.89
0.25 4 0.64

Imperfect Assay Sensitivity & Specificity
• λsens=sensitivity – Pr[assay+ | target expressed]
• λspec=specificity– Pr[assay- | target not expressed]

Proportion of Assay Positive Patients That Express Target
1 (1 )(1 )sens
sens spec
w γλγλ γ λ
=+ − −
λsens λspec γ w10.9 0.9 0.75 0.96
0.9 0.9 0.5 0.9
0.9 0.9 0.25 0.75
0.9 0.9 0.10 0.50

Randomized Ratio
• RandRat = nuntargeted/ntargeted
2
1 1 1 0
1 0
(1 )(1 )
w wRandRat δ δγδ γ δ
⎛ ⎞+ −= ⎜ ⎟+ −⎝ ⎠

Randomized Ratiosensitivity=specificity=0.9γ
Express targetδ0=0 δ0= δ1/2
0.75 1.29 1.26
0.5 1.8 1.6
0.25 3.0 1.96
0.1 25.0 1.86

Screened RatioImperfect Assay
• Nuntargeted = nuntargeted
targetedtargeted (1 )(1 )
ScreenRat [ (1 )(1 )] andratsens spec
sens spec
nN
R
γλ γ λ
γλ γ λ
=+ − −
= + − −

Screened Ratiosensitivity=specificity=0.9γ
Express targetδ0=0 δ0= δ1/2
0.75 0.9 0.88
0.5 0.9 0.80
0.25 0.9 0.59
0.1 4.5 0.33

• For Trastuzumab, even a relatively poor assay enabled conduct of a targeted phase III trial which was crucial for establishing effectiveness
• Recent results with Trastuzumab in early stage breast cancer show dramatic benefits for patients selected to express Her-2

Comparison of Targeted to Untargeted DesignSimon R, Development and Validation of Biomarker Classifiers for Treatment Selection, JSPI
Treatment Hazard Ratio for Marker Positive Patients
Number of Events for Targeted Design
Number of Events for Traditional Design
Percent of Patients Marker Positive
20% 33% 50%
0.5 74 2040 720 316

Interactive Software for Evaluating a Targeted Design
• http://linus.nci.nih.gov/brb/


Developmental Strategy (II)
Develop Predictor of Response to New Rx
Predicted Non-responsive to New Rx
Predicted ResponsiveTo New Rx
ControlNew RX Control
New RX

Developmental Strategy (II)
• Do not use the diagnostic to restrict eligibility, but to structure a prospective analysis plan.
• Compare the new drug to the control overall for all patients ignoring the classifier.– If poverall≤ 0.04 claim effectiveness for the eligible
population as a whole• Otherwise perform a single subset analysis
evaluating the new drug in the classifier + patients– If psubset≤ 0.01 claim effectiveness for the classifier +
patients.

Key Features of Design (II)
• The purpose of the RCT is to evaluate treatment T vs C overall and for the pre-defined subset; not to re-evaluate the components of the classifier, or to modify or refine the classifier

Sample Size Planning for Design II
1. Size for standard power (e.g. 0.9) for detecting usual treatment effect d (e.g. 15%) at significance level 0.04
2. Size for standard power (e.g. 0.9) for detecting treatment effect in subset of size d / proportion positive
3. Size as in 1 but extend accrual of classifier positive patients if overall test is non-significant

Developmental Strategy (IIb)
• Do not use the diagnostic to restrict eligibility, but to structure a prospective analysis plan.
• Compare the new drug to the control for classifier positive patients – If p+>0.05 make no claim of effectiveness– If p+≤ 0.05 claim effectiveness for the classifier
positive patients and• Continue accrual of classifier negative patients and
eventually test treatment effect at 0.05 level

Sample size Planning for IIb
• Accrue classifier positive and negative patients until there are sufficient classifier positive patients for standard power at significance level 0.05 for detecting large treatment effect D
• If treatment is found effective in classifier + patients, continue accrual of negative patients for standard power at significance level 0.05 for detecting usual size treatment effect d representing minimal useful clinical utility

The Roadmap
1. Develop a completely specified genomic classifier of the patients likely to benefit from a new drug
2. Establish reproducibility of measurement of the classifier
3. Use the completely specified classifier to design and analyze a new clinical trial to evaluate effectiveness of the new treatment with a pre-defined analysis plan.

Guiding Principle
• The data used to develop the classifier must be distinct from the data used to test hypotheses about treatment effect in subsets determined by the classifier– Developmental studies are exploratory– Studies on which treatment effectiveness
claims are to be based should be definitive studies that test a treatment hypothesis in a patient population completely pre-specified by the classifier

Use of Archived Samples• From a non-targeted “negative” clinical
trial to develop a binary classifier of a subset thought to benefit from treatment
• Test that subset hypothesis in a separate clinical trial– Prospective targeted type (I) trial– Prospective type (II) trial– Using archived specimens from a second
previously conducted clinical trial

Development of Genomic Classifiers
• Single gene or protein based on knowledge of therapeutic target
• Single gene or protein culled from set of candidate genes identified based on imperfect knowledge of therapeutic target
• Empirically determined based on correlating gene expression to patient outcome after treatment

Development of Genomic Classifiers
• During phase II development or
• After failed phase III trial using archived specimens.
• Adaptively during early portion of phase III trial.
Development of Empirical Gene Expression Based Classifier
• 20-30 phase II responders are needed to compare to non-responders in order to develop signature for predicting response– Dobbin KK, Simon RM. Sample size planning
for developing classifiers using high dimensional DNA microarray data, Biostatistics (In Press); available at http://linus.nci.nih.gov

Development of Empirical Gene Expression Based Classifier
• A signature of response to the new drug may not represent a signature of preferential benefit from a regimen containing the new drug versus a control regimen

Adaptive Signature DesignAn adaptive design for generating and
prospectively testing a gene expression signature for sensitive patients
Boris Freidlin and Richard SimonClinical Cancer Research 11:7872-8, 2005

Adaptive Signature DesignEnd of Trial Analysis
• Compare E to C for all patients at significance level 0.04– If overall H0 is rejected, then claim
effectiveness of E for eligible patients– Otherwise

• Otherwise:– Using only the first half of patients accrued during the
trial, develop a binary classifier that predicts the subset of patients most likely to benefit from the new treatment E compared to control C
– Compare E to C for patients accrued in second stage who are predicted responsive to E based on classifier
• Perform test at significance level 0.01• If H0 is rejected, claim effectiveness of E for subset defined
by classifier

Treatment effect restricted to subset. 10% of patients sensitive. Sensitivity genes are uncorrelated. 400 patients, 10,000 genes
0
20
40
60
80
K=3 K=10 K=20
Number of sensitivity genes
Pow
er
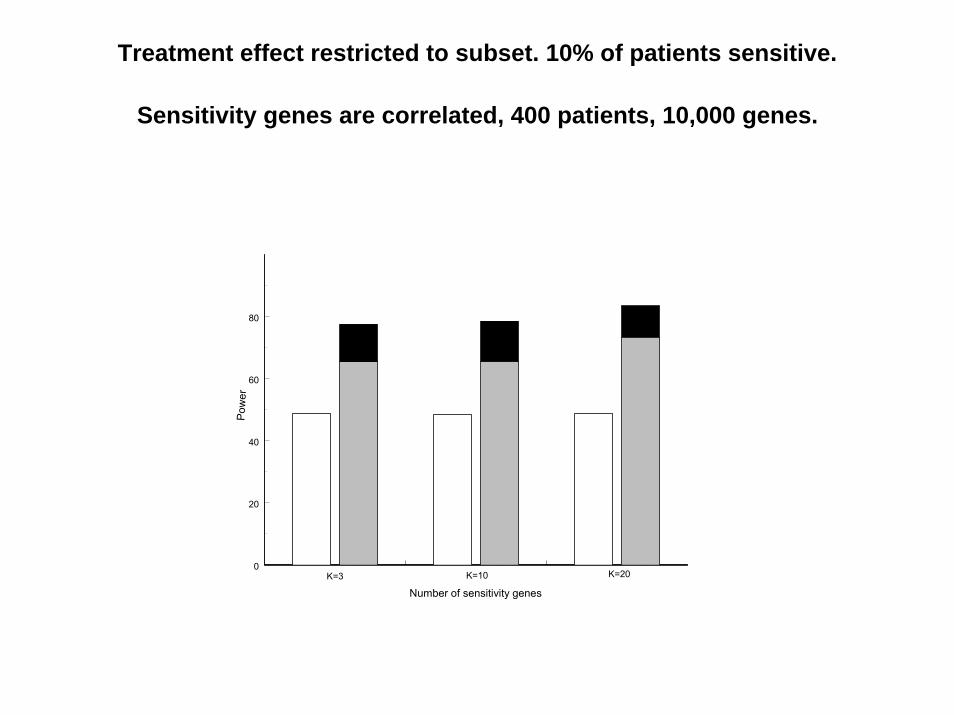
Treatment effect restricted to subset. 10% of patients sensitive.
Sensitivity genes are correlated, 400 patients, 10,000 genes.
0
20
40
60
80
K=3 K=10 K=20
Pow
er
Number of sensitivity genes

Treatment effect restricted to subset.10% of patients sensitive, 10 sensitivity genes, 10,000 genes, 400
patients.
Test Power
Overall .05 level test 46.7
Overall .04 level test 43.1
Sensitive subset .01 level test(performed only when overall .04 level test is negative)
42.2
Overall adaptive signature design 85.3

Overall treatment effect, no subset effect.10,000 genes, 400 patients.
Test Power
Overall .05 level test 74.2
Overall .04 level test 70.9
Sensitive subset .01 level test 1.0
Overall adaptive signature design 70.9
Validation of Predictive Classifiers for Use with Available Treatments
• Should establish that the classifier is robust, reproducibly measurable and has clinical utility
• Studies of predictive classifiers should be viewed as either developmental or validation studies

Studies Developing Gene Expression Profile Classifiers
Should be Viewed as Analogous to Phase II Trials Requiring
Phase III Validation

Developmental Studies
• Develop classifier that either predicts outcome of patients receiving specified treatment or control treatment
• Uses split-sample validation or cross-validation to estimate predictive accuracy of classifier

Split-Sample Evaluation
• Training-set– Used to select features, select model type, determine
parameters and cut-off thresholds• Test-set
– Withheld until a single model is fully specified using the training-set.
– Fully specified model is applied to the expression profiles in the test-set to predict class labels.
– Number of errors is counted– Ideally test set data is from different centers than the
training data and assayed at a different time

spec
imen
s
log-expression ratios
full data set
Non-Cross-Validated Prediction
1. Prediction rule is built using full data set.2. Rule is applied to each specimen for class
prediction.
training set
test set
spec
imen
s
log-expression ratios
Cross-Validated Prediction (Leave-One-Out Method)1. Full data set is divided into training and
test sets (test set contains 1 specimen).2. Prediction rule is built from scratch
using the training set.3. Rule is applied to the specimen in the
test set for class prediction. 4. Process is repeated until each specimen
has appeared once in the test set.

• Cross validation is only valid if the test set is not used in any way in the development of the model. Using the complete set of samples to select genes violates this assumption and invalidates cross-validation.
• With proper cross-validation, the model must be developed from scratch for each leave-one-out training set. This means that feature selection must be repeated for each leave-one-out training set.
– Simon R, Radmacher MD, Dobbin K, McShane LM. Pitfalls in the analysis of DNA microarray data. Journal of the National Cancer Institute 95:14-18, 2003.
• The cross-validated estimate of misclassification error is an estimate of the prediction error for model fit using specified algorithm to full dataset

Myth
• Split sample validation is superior to LOOCV or 10-fold CV for estimating prediction error


• Both split-sample validation and cross-validation represent internal validation

Limitations to Internal Validation
• Sample handling and assay conduct are performed under controlled conditions that do not incorporate real world sources of variability
• Developmental studies are generally small• Predictive accuracy is generally not clinical
utility

External Validation• From different clinical centers• Specimens assayed at different time from
training data• Reproducibility of assay for individual tumors
demonstrated to clinical reference laboratory standards
• Positive and negative samples collected in the same way
• Study addresses clinical utility of using the genomic classifier compared to using standard practice guidelines

Myth
• Development of good predictive classifiers is not possible with >1000 genes and <100 cases or requires huge sample sizes
• Predictive models should be reproducible on independent data

• Much of the conventional wisdom of statistical analysis is focused on inference, not on prediction
• Demonstrating statistical significance of prognostic factors is not the same as demonstrating predictive accuracy
• Predictive models should predict accurately for independent data; the model itself need not be reproducibly derivable on independent data
• Most statistical methods were not developed for prediction problems and particularly not for prediction problems with >10,000 variables and <100 cases


Sample Size Planning References
• K Dobbin, R Simon. Sample size determination in microarray experiments for class comparison and prognostic classification. Biostatistics 6:27-38, 2005
• K Dobbin, R Simon. Sample size planning for developing classifiers using high dimensional DNA microarray data. Biostatistics (In Press)

Clinical Targeting of Treatment to Cancer Patient Based on Tumor
Expression Profile in Broad Clinical Use

Limited by Appropriate Therapeutic Decision Contexts
• Patients whose prognosis is so good without chemotherapy that it can be withheld
• Multiple effective teatments exist and need guidance in choosing among them
• Multiple palliative treatments exist

Limited by Appropriate Therapeutic Decision Contexts
• Patients whose prognosis is so good without chemotherapy that it can be withheld– Unwillingness of physicians to withhold
treatment even if it’s chance for benefiting the patient is low

Limited by Appropriate Therapeutic Decision Contexts
• Potentially curative treatment for life threatening disease with no good alternative therapy– Not many curative treatments– Can rarely be sure that NPV is perfect

Developing Predictive Classifiers for Use with Existing Treatments
• Lack of financial incentives• Difficulty in performing prospective
validation studies that establish clinical utility
• Difficulty in establishing assay robustness and need for research-commercial partnership
• Limitations in practicality of existing platforms
Genomic Approach to Diagnostic/Prognostic Marker Development
• Select therapeutically relevant population– Node negative, ER+, well staged breast cancer
patients who have received Tam alone and have long follow-up
• Perform genome wide expression profiling• Develop multi-gene/protein predictor of outcome• Obtain internal estimate of prediction accuracy• Adapt platform to clinical application• Establish assay reproducibility• Conduct prospective study to establish clinical
utility

Validation StudyNode negative Breast Cancer
• Prospective study design• Samples collected and assayed from patients with node
negative ER+ breast cancer who will receive TAM• Apply single, fully specified multi-gene predictor of
outcome to samples and categorize each patient as good or poor prognosis
• Categorizing each patient with regard to practice standards as requiring or not requiring chemotherapy
• Randomizing patients predicted to be poor prognosis by classifier for whom practice standards do not recommend chemotherapy
• Are long-term outcomes for randomized patients


Hazard Ratio for Marker + Patients Number of Events Required
0.5 74
0.67 200
Approximate number of events required for 80% power with 5% two-sided log-rank test for comparing arms of design shown in Figure 3. Only marker + patients are randomized. Treatment hazard ratio for marker + patients is shown in first column. Time-to-event distributions are exponential and all patients are followed to failure.


Proportion of Patients Marker + Approximate Number of Events Required
20% 5200
33% 1878
50% 820
Approximate number of events required for 80% power with 5% two-sided log-rank test for comparing arms of design shown in Figure 1. Randomized arms are mixtures of marker – and marker + patients. Hazard ratio for marker – patients is 1 for the two treatment groups and 0.67 for marker + patients. All patients are followed to failure.

Validation StudyNode negative Breast Cancer
• Prospective study design• Samples collected and assayed from patients
with node negative ER+ breast cancer receiving TAM
• Identify patients predicted to be very good prognosis on TAM alone using the single, fully specified multi-gene predictor of outcome
• Were long-term outcomes for patients in good prognosis group sufficiently good to have warranted withholding chemotherapy?

Validation StudyNode negative Breast Cancer
• Prospective study plan for use of archived specimens in a prospective clinical trial
• Samples collected and archived from patients who received Tam alone in prospective clinical trial
• Identify patients predicted to be very good prognosis on TAM alone using the single, fully specified multi-gene predictor of outcome developed externally to the trial
• Were long-term outcomes for patients in good prognosis group sufficiently good to have warranted withholding chemotherapy?

Assay Limitations of DNA Microarray Expression Profiling
• Need for fresh/frozen tumor• Expression influenced by sample handling• Assay variation among times and
laboratories
• Some of the sources of assay variability will be controlled within a study but will limit the ability to accurately classify samples collected outside of study conditions

Validation Study for Identifying Node Positive Patients Who Benefit from a
Specific Regimen• Standard treatment C• New treatment E• Predictor based on previous data for identifying
patients who benefit from E but not C• Randomized study of E vs C• Measure markers on all patients• Compare E vs C separately within groups
predicted to benefit from E and those not predicted to benefit from E
• Two clinical trials worth of patients

Conclusions• New technology and biological knowledge make
it increasingly feasible to identify which patients are most likely to benefit from a specified treatment
• “Predictive medicine” is feasible but does not mean “personalized treatment”
• Targeting treatment can greatly improve the therapeutic ratio of benefit to adverse effects– Smaller clinical trials needed– Treated patients benefit– Economic benefit for society

Conclusions
• Achieving the potential of new technology requires paradigm changes in focus and methods of “correlative science.”
• Achieving the potential of new technology requires paradigm changes in partnerships among industry, academia, and government.
• Effective interdisciplinary research requires increased emphasis on cross education of laboratory, clinical and statistical scientists

Conclusions
• Prospectively specified analysis plans for phase III data are essential to achieve reliable results– Biomarker analysis does not mean
exploratory analysis except in developmental studies
– Biomarker classifiers used in phase III evaluations should be completely specified based on previous developmental studies

Simon R, Korn E, McShane L, Radmacher M, Wright G, Zhao Y. Design and analysis of DNA microarrayinvestigations, Springer-Verlag, 2003.
Radmacher MD, McShane LM, Simon R. A paradigm for class prediction using gene expression profiles. Journal of Computational Biology 9:505-511, 2002.
Simon R, Radmacher MD, Dobbin K, McShane LM. Pitfalls in the analysis of DNA microarray data. Journal of the National Cancer Institute 95:14-18, 2003.
Dobbin K, Simon R. Comparison of microarray designs for class comparison and class discovery, Bioinformatics 18:1462-69, 2002; 19:803-810, 2003; 21:2430-37, 2005; 21:2803-4, 2005.
Dobbin K and Simon R. Sample size determination in microarray experiments for class comparison and prognostic classification. Biostatistics 6:27-38, 2005.
Dobbin K, Shih J, Simon R. Questions and answers on design of dual-label microarrays for identifying differentially expressed genes. Journal of the National Cancer Institute 95:1362-69, 2003.
Wright G, Simon R. A random variance model for detection of differential gene expression in small microarrayexperiments. Bioinformatics 19:2448-55, 2003.
Korn EL, Troendle JF, McShane LM, Simon R.Controlling the number of false discoveries. Journal of Statistical Planning and Inference 124:379-08, 2004.
Molinaro A, Simon R, Pfeiffer R. Prediction error estimation: A comparison of resampling methods. Bioinformatics 21:3301-7,2005.

Simon R. Using DNA microarrays for diagnostic and prognostic prediction. Expert Review of Molecular Diagnostics, 3(5) 587-595, 2003.
Simon R. Diagnostic and prognostic prediction using gene expression profiles in high dimensional microarray data. British Journal of Cancer 89:1599-1604, 2003.
Simon R and Maitnourim A. Evaluating the efficiency of targeted designs for randomized clinical trials. Clinical Cancer Research 10:6759-63, 2004.
Maitnourim A and Simon R. On the efficiency of targeted clinical trials. Statistics in Medicine 24:329-339, 2005.
Simon R. When is a genomic classifier ready for prime time? Nature Clinical Practice – Oncology 1:4-5, 2004.
Simon R. An agenda for Clinical Trials: clinical trials in the genomic era. Clinical Trials 1:468-470, 2004.
Simon R. Development and Validation of Therapeutically Relevant Multi-gene Biomarker Classifiers. Journal of the National Cancer Institute 97:866-867, 2005.
Simon R. A roadmap for developing and validating therapeutically relevant genomic classifiers. Journal of Clinical Oncology 23(29), 2005.
Freidlin B and Simon R. Adaptive signature design. Clinical Cancer Research 11:7872-8, 2005.
Simon R. Guidelines for the design of clinical studies for development and validation of therapeutically relevant biomarkers and biomarker classification systems. In Biomarkers in Breast Cancer, Hayes DF and Gasparini G, Humana Press, pp 3-15, 2005.
Simon R and Wang SJ. Use of genomic signatures in therapeutics development in oncology and other diseases. The Pharmacogenomics Journal, 2006.