Embed Size (px)
Citation preview
Re-offending of adults: new measures of re-offending2000-2005 England and Wales Ministry of Justice Statistics bulletin Published 9 May 2008

Re-offending of adults: new measures of re-offending 2000-2005
Executive summary
Adult re-offending between the 2000 and 2005 cohorts showed: • The frequency rate fell 11.4% from 189.4 to 167.9 re-offences per 100
offenders (Figure A and Table 1);
• The number of re-offences classified as most serious (severe) increased 12.5% from 0.78 to 0.88 re-offences per 100 offenders (Table 1);
• The proportion of offenders re-offending (actual yes/no rate) decreased by 4.9% (2.1 percentage points) from 43.7% to 41.6% (Table 1).
Figure A: Frequency of re-offending per 100 offenders for 2000, 2002, 2003, 2004 and 2005 cohorts
0
50
100
150
200
250
2000 Q1 2001 Q1 2002 Q1 2003 Q1 2004 Q1 2005 Q1Year
Freq
uenc
y of
re-o
ffend
ing
(per
100
offe
nder
s)
No
data
for 2
001
Q1
N.B. Data is not available for 2001 due to a problem with archived data on community sentences. Since it will not substantially increase knowledge on the current progress on re-offending, no resources have been allocated to fix this problem.
Table 1: Frequency, severity and actual (yes/no) one-year re-offending rates, 2000, 2002, 2003, 2004 and 2005 cohorts
Rate (per 100 offenders)
% change from 2000
Rate (per 100 offenders)
% change from 2000
% re-offending
% change from 2000
2000 Q1 189.4 0.0% 0.78 0.0% 43.7% 0.0%2002 Q1 214.6 13.3% 0.89 14.4% 45.9% 4.9%2003 Q1 207.5 9.5% 0.89 13.9% 45.8% 4.9%2004 Q1 183.3 -3.2% 0.85 8.8% 43.3% -0.9%2005 Q1 167.9 -11.4% 0.88 12.5% 41.6% -4.9%
YearActual (yes/no)Frequency Severity
1

Re-offending of adults: new measures of re-offending 2000-2005
Contents
Page
Introduction 3
Results 5
Appendix A: Statistical tables 16
Appendix B: Glossary of terms 25
Appendix C: Measuring re-offending 28
Appendix D: Data quality statement 32
Appendix E: Statistical modelling 35
Appendix F: Coefficients of the 2005 statistical model 39
Appendix G: List of most serious (severe) offences 41
Appendix H: References 46
Appendix I: PSA 2000-2006 – 2005 cohort results 47
Explanatory notes 48
2
Re-offending of adults: new measures of re-offending 2000-2005
Introduction
This report contains results on two new measures of re-offending (frequency and severity) for adults (those aged 18 and over). These new measures, in addition to the existing actual (yes/no) rate of re-offending, allow a wider understanding of re-offending. The results cover adults released from custody or commencing a community sentence in the first quarters of 2000, 2002, 2003, 2004 and 2005. The use of the 1st quarter data (January – March) arises from the administrative effort required to match criminal records and enables results to be more timely without compromising reliability and comparability.
All measures in this report summarise data obtained from the Police National Computer (PNC) on whether or not an offender is proven to have re-offended during a one-year follow up period, as well as how many and the seriousness of re-offences committed.
The previously published two-year actual (yes/no) measure of the proportion of the cohort re-offending, compared to the rate expected, was and remains useful information, but in terms of being able to better understand what works in reducing re-offending, this measure only allows the assessment of whether or not an offender was proven to have re-offended. It does not take account of how many re-offences an offender may have committed (in terms of number of crimes and community safety, an offender who commits one re-offence of burglary is different to an offender who commits five re-offences of burglary), and it also does not differentiate between the type of re-offence being committed (for example, whilst the yes/no measure would show both a theft and a murder as being the same, it is clearly of a very different impact to society).
The new measure of frequency of re-offending will show the number of re-offences being committed, enabling a better understanding of the impacts of programmes and interventions which do not just lead to complete desistance by offenders, but may also reduce the volume of re-offences offenders commit.
Additionally, the introduction of a rate of the most serious re-offences committed (severity rate) will enable the monitoring of re-offences classified as most serious. These are the re-offences that cause the most harm to society, despite being a small subset of the overall volume of re-offences committed.
As a further development to make the re-offending data timelier, the follow up period for adult re-offending has been reduced from 2 years to 1 year, which also brings it into line with the measurement period for juvenile re-offending.
For more details on how re-offending is calculated please see Appendix C or consult the PSA Delivery Agreement 23 entitled ‘Making Communities Safer’.
3
Re-offending of adults: new measures of re-offending 2000-2005
Explanation of new re-offending measures Each new measure answers one of the following questions:
Q: How much proven re-offending actually occurs?
Frequency rate The actual number of re-offences the cohort committed during the one-year follow-up period which resulted in a conviction at court. The actual proven one-year frequency re-offending rate is produced by calculating the number of proven re-offences per 100 offenders. For added information, the number of proven re-offences per 100 re-offenders is also available in the statistical tables in Appendix A.
Q: How many of the re-offences committed are considered to be the most serious re-offences?
Severity rate The actual number of the most serious1 re-offences the cohort committed during the one-year follow-up period which resulted in a conviction at court. As with the frequency rate, the severity rate is produced by calculating the number of proven severe re-offences per 100 offenders, and is therefore a subset of the frequency rate.
Q: What proportion of offenders actually re-offend?
Actual (yes/no) rate The actual number of offenders in the cohort re-offending at least once during the one-year follow-up period, where the re-offence resulted in a conviction at court. The actual (yes/no) proven re-offending rate is presented in this report as a percentage of the total number of offenders in the cohort.
Q: What proportion of offenders are predicted to re-offend?
Predicted (yes/no) rate The predicted one-year (yes/no) re-offending rate is different from the other three measures in the sense that it does not come from actual proven re-offences, but from a statistical model created for the new baseline year of 2005. The basic principle behind the predicted rate is that it enables control over re-offending rates for changes in offender characteristics.
Further details on these rates can be found in the Glossary of Terms (Appendix B) along with other useful definitions of technical terms.
1 Most serious offences are offences involving death (e.g. murder), serious violence against the person (e.g. grievous bodily harm) and some sexual offences. For the full list of most serious offences please consult Appendix G at the end of this report.
4

Re-offending of adults: new measures of re-offending 2000-2005
Results
This section presents more detailed results of the overall figures for the new re-offending rates by different breakdowns of offenders in the cohort. Information is presented on:
• The overall re-offending rate (page 6);
− Frequency;
− Severity;
− Actual and predicted (yes/no);
− Time to first re-offence;
− Total number of offenders in the cohort;
• Gender (page 10);
• Age (page 10);
• Index offence group (page 11);
• Previous offending history (page 12);
• Index disposal (page 13);
• Ethnicity (page 14); and,
• Actual and predicted two-year (yes/no) rate from PSA 2000-2006 (page 15).
The main data tables can be found in Appendix A from page 16 onwards.
5

Re-offending of adults: new measures of re-offending 2000-2005
Overall one-year re-offending rates Between the 2000 and 2005 cohorts:
• The frequency rate fell 11.4% from 189.4 to 167.9 re-offences per 100 offenders (Table 2);
• The number of re-offences classified as the most serious (severe) increased 12.5% from 0.78 to 0.88 re-offences per 100 offenders (Table 2);
• The proportion of offenders re-offending (actual yes/no rate) decreased by 4.9% (2.1 percentage points) from 43.7% to 41.6% (Table 2);
• These measures do not take changes in the offender’s characteristics into account. Thus, over the 2000 to 2005 time period it is possible that the mix of offenders in a given cohort makes them more or less likely to re-offend.
Table 2: Frequency, severity and actual (yes/no) one-year re-offending rates, 2000, 2002, 2003, 2004 and 2005 cohorts
Rate (per 100 offenders)
% change from 2000
Rate (per 100 offenders)
% change from 2000
% re-offending
% change from 2000
2000 Q1 44,586 189.4 0.0% 0.78 0.0% 43.7% 0.0%2002 Q1 44,592 214.6 13.3% 0.89 14.4% 45.9% 4.9%2003 Q1 45,115 207.5 9.5% 0.89 13.9% 45.8% 4.9%2004 Q1 47,481 183.3 -3.2% 0.85 8.8% 43.3% -0.9%2005 Q1 44,323 167.9 -11.4% 0.88 12.5% 41.6% -4.9%
YearActual (yes/no)Frequency SeverityNumber of
offenders in cohort
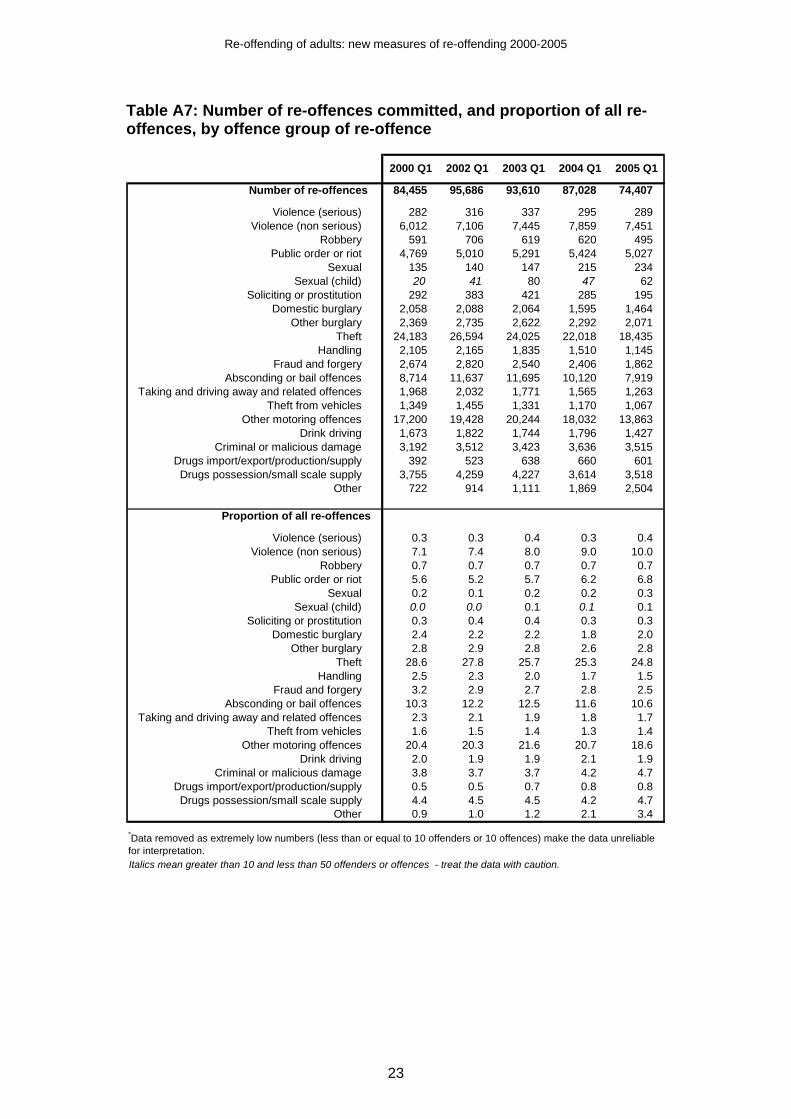
Frequency rate The reduction in frequency rate of 11.4% between 2000 and 2005 cohorts compared to the reduction of 4.9% in actual (yes/no) re-offending shows how some offenders do not desist entirely, but commit fewer re-offences. The actual number of proven re-offences committed from the 2005 cohort was 74,407, down from 84,455 from the 2000 cohort. This occurred despite a similar size cohort of around 44,500. In the 2005 cohort, the three most frequent groups of re-offences committed were theft, other motoring and absconding or bail offences, making up 24.8%, 18.6% and 10.6% re-offences committed respectively (Table A7 and Figure B). These are the same top three offence groups in the 2000 cohort, with 28.6%, 20.4% and 10.3% of all re-offences committed respectively.
6

Re-offending of adults: new measures of re-offending 2000-2005
Figure B: Number of re-offences committed by the 2005 cohort, by offence group of re-offence
0 2,000 4,000 6,000 8,000 10,000 12,000 14,000 16,000 18,000 20,000
Sexual (child)
Soliciting or prostitution
Sexual
Violence (serious)
Robbery
Drugs supply
Theft from vehicles
Handling
Taking and driving away
Drink driving
Domestic burglary
Fraud/Forgery
Other burglary
Other
Criminal or malicious damage
Drug possession
Public order
Violence (non serious)
Absconding/Bail offences
Other motoring offences
Theft
Number of re-offences
Severity rate The number of the most serious re-offences committed by the cohorts increased slightly from 3472 for the 2000 cohort to 388 for the 2005 cohort, resulting in an increase of 12.5% in the number of serious re-offences committed per 100 offenders3. 24% of the serious re-offences committed for the 2005 cohort fell into the category of sexual, a higher proportion than the 17% for the 2000 cohort. The majority of the serious re-offences committed fall under the violence group. Additionally, the majority of the most serious re-offences were committed by offenders who had never before committed a most serious offence (80% in 2005).
The small numbers of most serious re-offences committed (388 out of 74,407 for the 2005 cohort) places a limitation on any robust breakdown analysis of the severity rate. Therefore, no interpretations will be drawn out about the impact of offender characteristics on the severity rate.
Actual and predicted (yes/no) For the 2005 cohort the actual one-year (yes/no) rate was 41.6%. This number was 2.1 percentage points lower than the 2000 cohort (43.7%). 2 Calculated as follows: (severity rate) x (total number of offenders in cohort) / 100
3 The Sexual Offences Act 2003 introduced a large number of new offences which resulted in changes in the coverage of many of the serious sexual offences we are monitoring; as a result the figures for severity for 2004 onwards may not be comparable with those before 2004.
7
Re-offending of adults: new measures of re-offending 2000-2005
Whilst the predicted rate based on the 2005 cohort has been developed to control for changes in offender characteristics and therefore the likelihood of re-offending (in the yes/no measure) from 2005, it can be applied back to the 2000 dataset to show the change between 2000 and 2005 in the actual (yes/no) rate after controlling for changes in offender characteristics. This gives a reduction in actual (yes/no) re-offending controlling for changes in offender characteristics of 7.6%. This compares to a reduction in re-offending of 7.4% over the same period when measuring using the old methodology (see Appendix I for more detail).
There are no predicted rates for the frequency or severity of re-offending, as yet, due to the complex nature of the variables being considered, but work continues in this area.
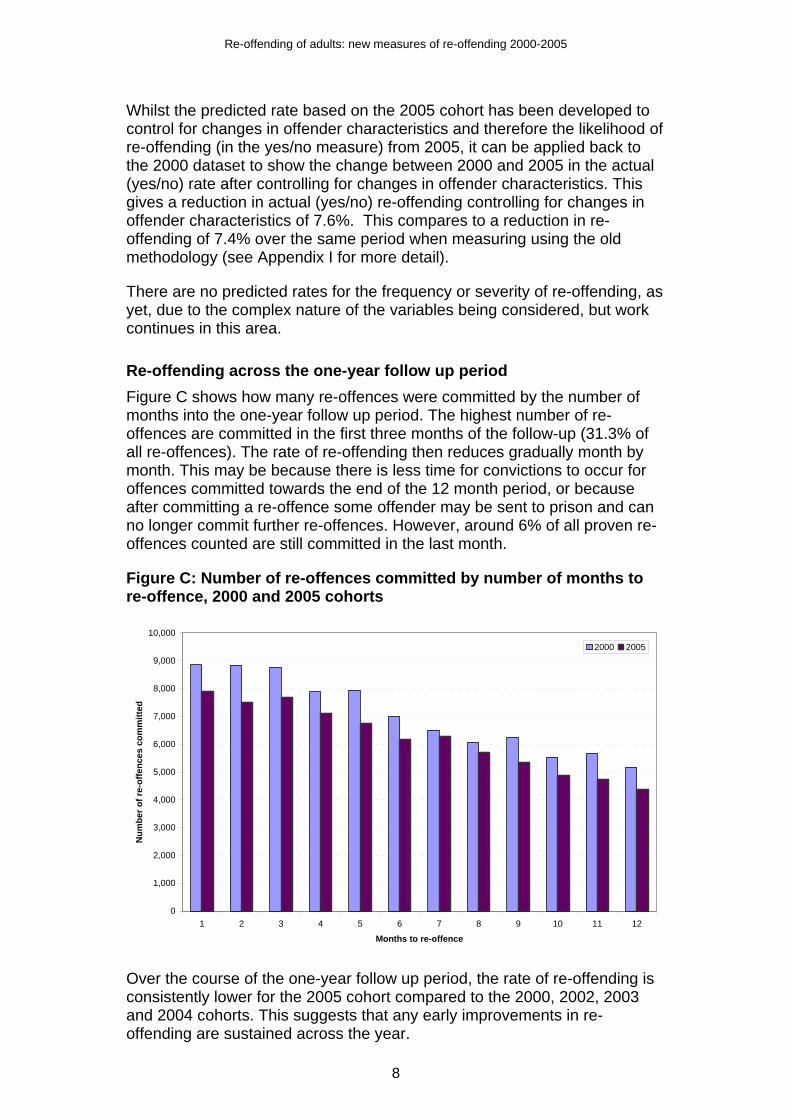
Re-offending across the one-year follow up period Figure C shows how many re-offences were committed by the number of months into the one-year follow up period. The highest number of re-offences are committed in the first three months of the follow-up (31.3% of all re-offences). The rate of re-offending then reduces gradually month by month. This may be because there is less time for convictions to occur for offences committed towards the end of the 12 month period, or because after committing a re-offence some offender may be sent to prison and can no longer commit further re-offences. However, around 6% of all proven re-offences counted are still committed in the last month.
Figure C: Number of re-offences committed by number of months to re-offence, 2000 and 2005 cohorts
0
1,000
2,000
3,000
4,000
5,000
6,000
7,000
8,000
9,000
10,000
1 2 3 4 5 6 7 8 9 10 11 12
Months to re-offence
Num
ber o
f re-
offe
nces
com
mitt
ed
2000 2005
Over the course of the one-year follow up period, the rate of re-offending is consistently lower for the 2005 cohort compared to the 2000, 2002, 2003 and 2004 cohorts. This suggests that any early improvements in re-offending are sustained across the year.
8

Re-offending of adults: new measures of re-offending 2000-2005
Figure D shows (for those offenders who re-offend) the average number of days it takes for an offender to commit their first re-offence by their index offence for the 2000 and 2005 cohorts. It should not be assumed that offenders re-offend in the same category as their original offence (see section “Re-offending by index offence group” for more detail). Offenders convicted of theft take the shortest number of days to re-offend for both 2000 and 2005, whilst in 2005 offenders convicted of drugs supply took the longest number of days to re-offend. There were also increases in the average time to re-offend in the drugs supply and robbery categories from 2000 to 2005.
Figure D: Average number of days before re-offending took place by index offence group, 2000 and 2005 cohorts
0 20 40 60 80 100 120 140 160 180 200
Theft
Other
Theft from vehicles
HandlingOther burglary
Absconding/Bail offences
Taking and driving away
Criminal or malicious damageTotal
Fraud/Forgery
Sexual
Public orderOther motoring offences
Violence (non serious)
Drug possession
Domestic burglaryDrink driving
Violence (serious)
Robbery
Drugs supply
Average time to re-offence (days)
2000 2005
Total
Total number of offenders in the cohort The total number of offenders decreased from 47,481 in the 2004 cohort to 44,323 in the 2005 cohort. The total number of offenders in the cohort had been increasing since 2000 from 44,586. The decrease between the 2004 and 2005 cohorts has been mainly driven by a reduction of 6.6% in male offenders.
Figures on the total number of re-offences and number of serious re-offences committed by the cohorts cannot be aggregated up to full year figures because there is no evidence that the first quarter is representative of the full year. However, if simply multiplied by a factor of 4, it is likely that in 2005 the total number of offenders is around 180,000, the total number of re-offences is around 300,000 and the total number of serious re-offences is around 1,550. However, these numbers are unlikely to be this large because the same offender will appear more than once across the year.
9
Re-offending of adults: new measures of re-offending 2000-2005
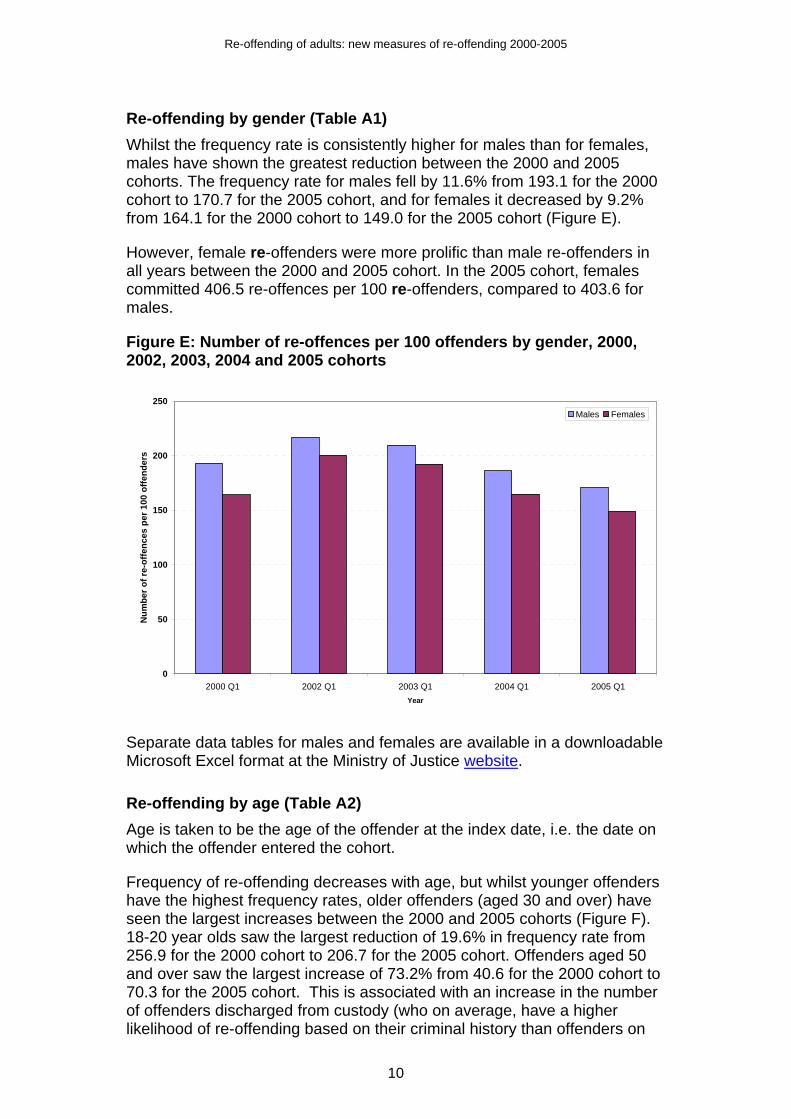
Re-offending by gender (Table A1) Whilst the frequency rate is consistently higher for males than for females, males have shown the greatest reduction between the 2000 and 2005 cohorts. The frequency rate for males fell by 11.6% from 193.1 for the 2000 cohort to 170.7 for the 2005 cohort, and for females it decreased by 9.2% from 164.1 for the 2000 cohort to 149.0 for the 2005 cohort (Figure E).
However, female re-offenders were more prolific than male re-offenders in all years between the 2000 and 2005 cohort. In the 2005 cohort, females committed 406.5 re-offences per 100 re-offenders, compared to 403.6 for males.
Figure E: Number of re-offences per 100 offenders by gender, 2000, 2002, 2003, 2004 and 2005 cohorts
0
50
100
150
200
250
2000 Q1 2002 Q1 2003 Q1 2004 Q1 2005 Q1Year
Num
ber o
f re-
offe
nces
per
100
offe
nder
s
Males Females
Separate data tables for males and females are available in a downloadable Microsoft Excel format at the Ministry of Justice website.
Re-offending by age (Table A2) Age is taken to be the age of the offender at the index date, i.e. the date on which the offender entered the cohort.
Frequency of re-offending decreases with age, but whilst younger offenders have the highest frequency rates, older offenders (aged 30 and over) have seen the largest increases between the 2000 and 2005 cohorts (Figure F). 18-20 year olds saw the largest reduction of 19.6% in frequency rate from 256.9 for the 2000 cohort to 206.7 for the 2005 cohort. Offenders aged 50 and over saw the largest increase of 73.2% from 40.6 for the 2000 cohort to 70.3 for the 2005 cohort. This is associated with an increase in the number of offenders discharged from custody (who on average, have a higher likelihood of re-offending based on their criminal history than offenders on
10

Re-offending of adults: new measures of re-offending 2000-2005
community sentences) for offenders aged over 50 from 14 for the 2000 cohort to 267 for the 2005 cohort4.
Although older offenders are much less likely to re-offend than younger offenders, the number of re-offences committed per re-offender has become much more constant across all age groups between the 2000 cohort (range between 311.8 to 469.1) and the 2005 cohort (range between 380.8 to 413.9).
Figure F: Number of re-offences per 100 offenders by age, 2000 and 2005 cohorts
0
50
100
150
200
250
300
18 - 20 21 - 24 25 - 29 30 - 34 35 - 39 40 - 49 50+
Age
Num
ber o
f re-
offe
nces
per
100
offe
nder
s
2000 2005
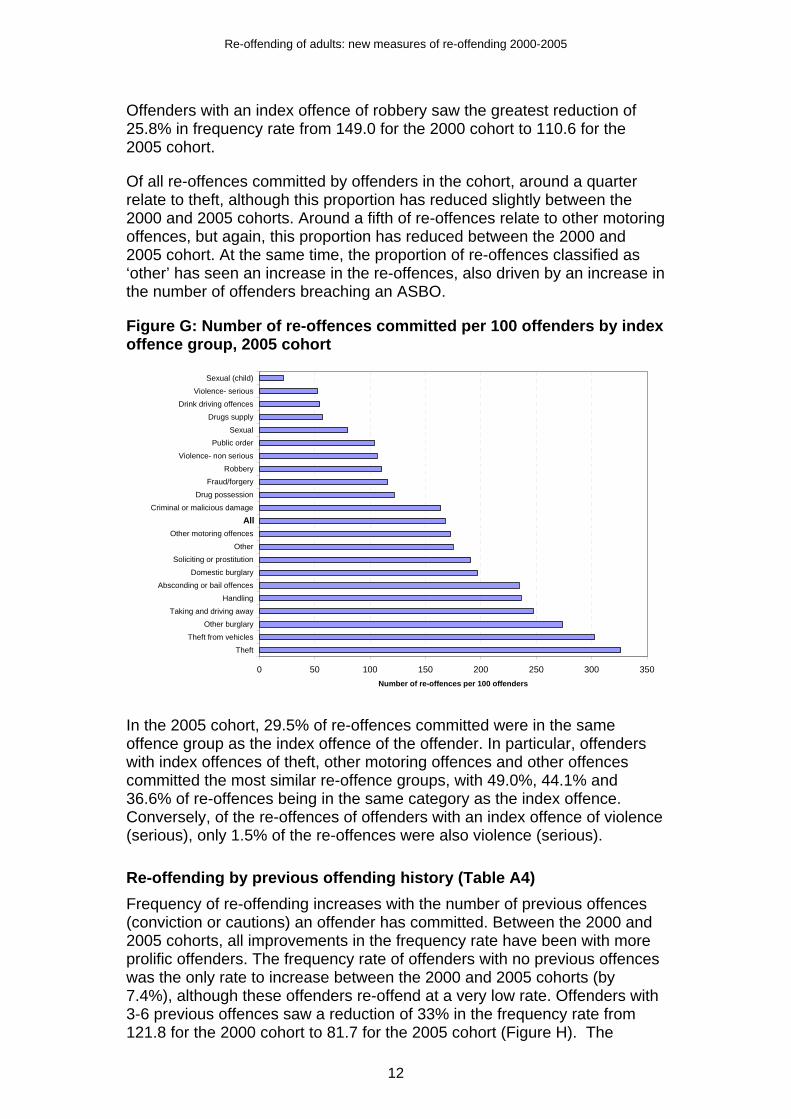
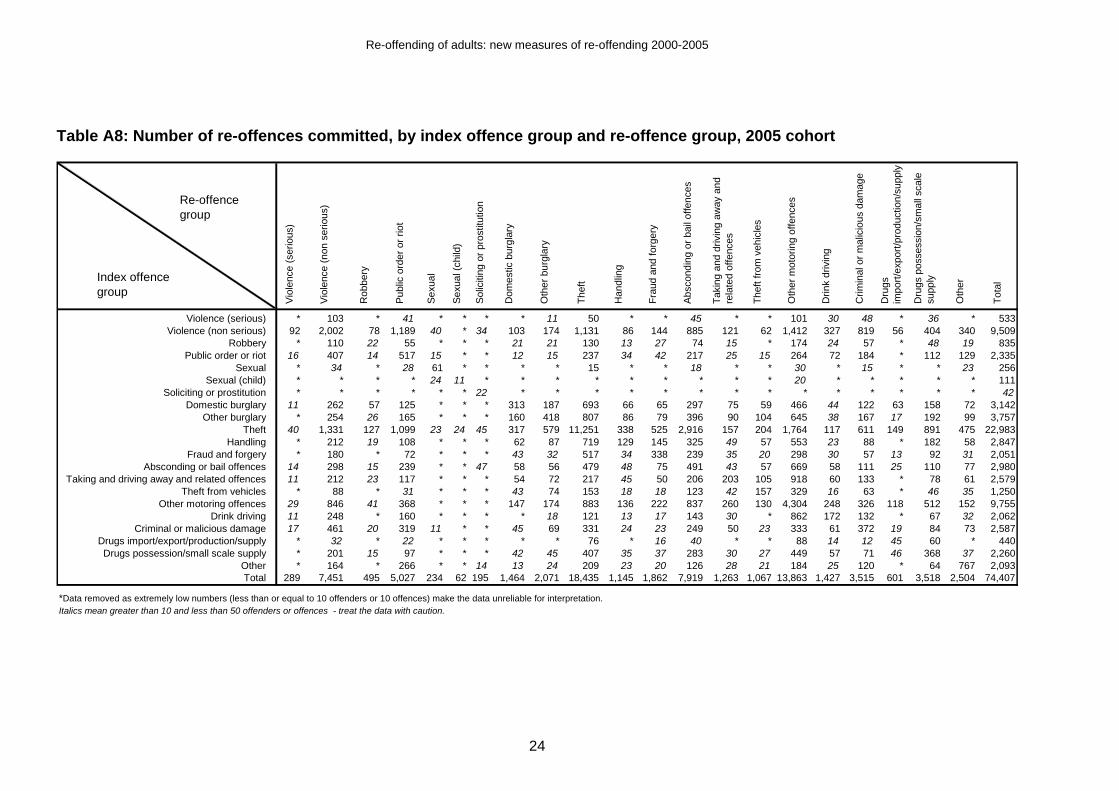
Re-offending by index offence group (Tables A3, A7 and A8) Offenders with the highest frequency rates for the 2005 cohort had index offences falling into the categories of theft (326.4), theft from vehicles (302.7) and other burglary (273.8) (Figure G). This has changed slightly from the 2000 cohort when the offence groups with the highest frequency rates were theft (342.6), theft from vehicles (332.3) and taking and driving away and related offences (318.6).
Offenders with an index offence classified as ‘other’ have seen a large increase of 128.7% in frequency rate from 76.5 for the 2000 cohort to 175.0 for the 2005 cohort. This has been driven by the increase in the number of offenders in the cohort re-offending by breaching an Anti-Social Behaviour Order (ASBO), increasing from 22 re-offences in 2000 to 1,797 re-offences in 20055. Offenders who receive ASBOs have characteristics which make them likely to re-offend such as a long criminal history.
4 Other cohort values are: 2002 = 114; 2003 = 134; and, 2004 = 206.
5 Other cohort values are: 2002 = 119; 2003 = 396; and, 2004 = 1,140.
11
Re-offending of adults: new measures of re-offending 2000-2005
Offenders with an index offence of robbery saw the greatest reduction of 25.8% in frequency rate from 149.0 for the 2000 cohort to 110.6 for the 2005 cohort.
Of all re-offences committed by offenders in the cohort, around a quarter relate to theft, although this proportion has reduced slightly between the 2000 and 2005 cohorts. Around a fifth of re-offences relate to other motoring offences, but again, this proportion has reduced between the 2000 and 2005 cohort. At the same time, the proportion of re-offences classified as ‘other’ has seen an increase in the re-offences, also driven by an increase in the number of offenders breaching an ASBO.
Figure G: Number of re-offences committed per 100 offenders by index offence group, 2005 cohort
0 50 100 150 200 250 300 350
Theft
Theft from vehiclesOther burglary
Taking and driving away
HandlingAbsconding or bail offences
Domestic burglary
Soliciting or prostitutionOther
Other motoring offences
Criminal or malicious damage
Drug possession
Fraud/forgeryRobbery
Violence- non serious
Public orderSexual
Drugs supplyDrink driving offences
Violence- serious
Sexual (child)
Number of re-offences per 100 offenders
All
In the 2005 cohort, 29.5% of re-offences committed were in the same offence group as the index offence of the offender. In particular, offenders with index offences of theft, other motoring offences and other offences committed the most similar re-offence groups, with 49.0%, 44.1% and 36.6% of re-offences being in the same category as the index offence. Conversely, of the re-offences of offenders with an index offence of violence (serious), only 1.5% of the re-offences were also violence (serious).
Re-offending by previous offending history (Table A4) Frequency of re-offending increases with the number of previous offences (conviction or cautions) an offender has committed. Between the 2000 and 2005 cohorts, all improvements in the frequency rate have been with more prolific offenders. The frequency rate of offenders with no previous offences was the only rate to increase between the 2000 and 2005 cohorts (by 7.4%), although these offenders re-offend at a very low rate. Offenders with 3-6 previous offences saw a reduction of 33% in the frequency rate from 121.8 for the 2000 cohort to 81.7 for the 2005 cohort (Figure H). The
12

Re-offending of adults: new measures of re-offending 2000-2005
proportion of offenders in the cohort with no proven previous offences was 11.8% for 2005 down from 12.6% in 2000.
Figure H: Number of re-offences per 100 offenders by number of previous offences, 2000, 2002, 2003, 2004 and 2005 cohorts
0
50
100
150
200
250
300
350
400
2000 Q1 2002 Q1 2003 Q1 2004 Q1 2005 Q1Year
Num
ber o
f re-
offe
nces
per
100
offe
nder
s
No previous offences 1-2 previous offences 3-6 previous offences7-10 previous offences 11+ previous offences
N.B. Previous offences for adults include both court convictions and cautions.
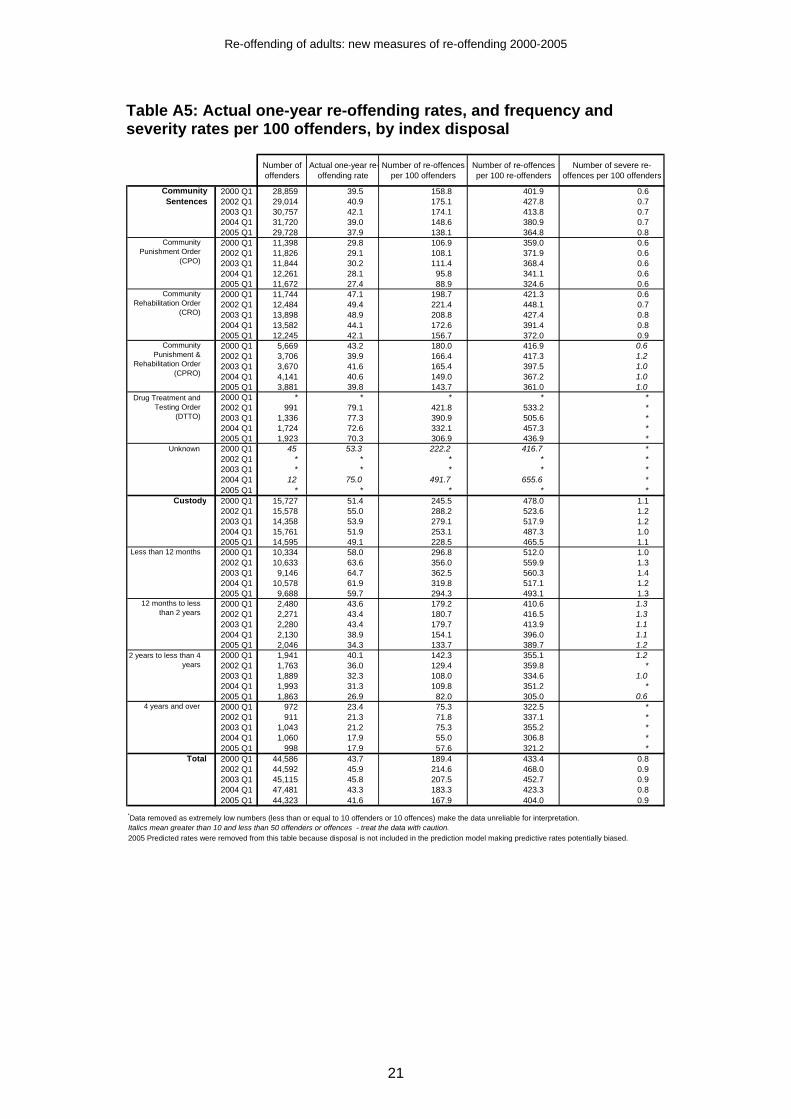
Re-offending by index disposal (Table A5) Frequency rates by disposal should not be compared to assess changes in effectiveness of sentences, as there is no control for known differences in offender characteristics or other factors that affect re-offending. Analysis within type of disposal is made difficult due to the changing use of these disposals over time.
Offenders commencing community sentences have lower frequency rates than offenders discharged from prison. However, this may reflect the fact that offenders discharged from prison are more likely to re-offend based on their characteristics. For the 2005 cohort, the frequency rate for offenders discharged from custody was 228.5, a reduction of 6.9% from 245.5 for the 2000 cohort (within this, offenders discharged from sentences of less than 12 months had a frequency rate of 294.3 in the 2005 cohort, slightly lower than the 2000 cohort value of 296.8). Offenders commencing community sentences had a frequency rate of 138.1 for the 2005 cohort, a reduction of 13.0% from 158.8 for the 2000 cohort. A reduction in frequency rate has been seen across all types of community sentence. The largest improvement has been seen in Drug Treatment and Testing Orders (DTTOs) which have fallen from 421.8 for the 2002 cohort to 306.9 for the 2005 cohort (27.2%) (Figure I).
For offenders discharged from custody, the frequency rate reduces as the length of sentence increases. All sentence lengths have seen reductions between the 2000 and 2005 cohorts, with offenders discharged from sentences of 2-4 years seeing the largest improvement of 42.4%. In the 2005 cohort, offenders with a sentence length of less than one year had a
13
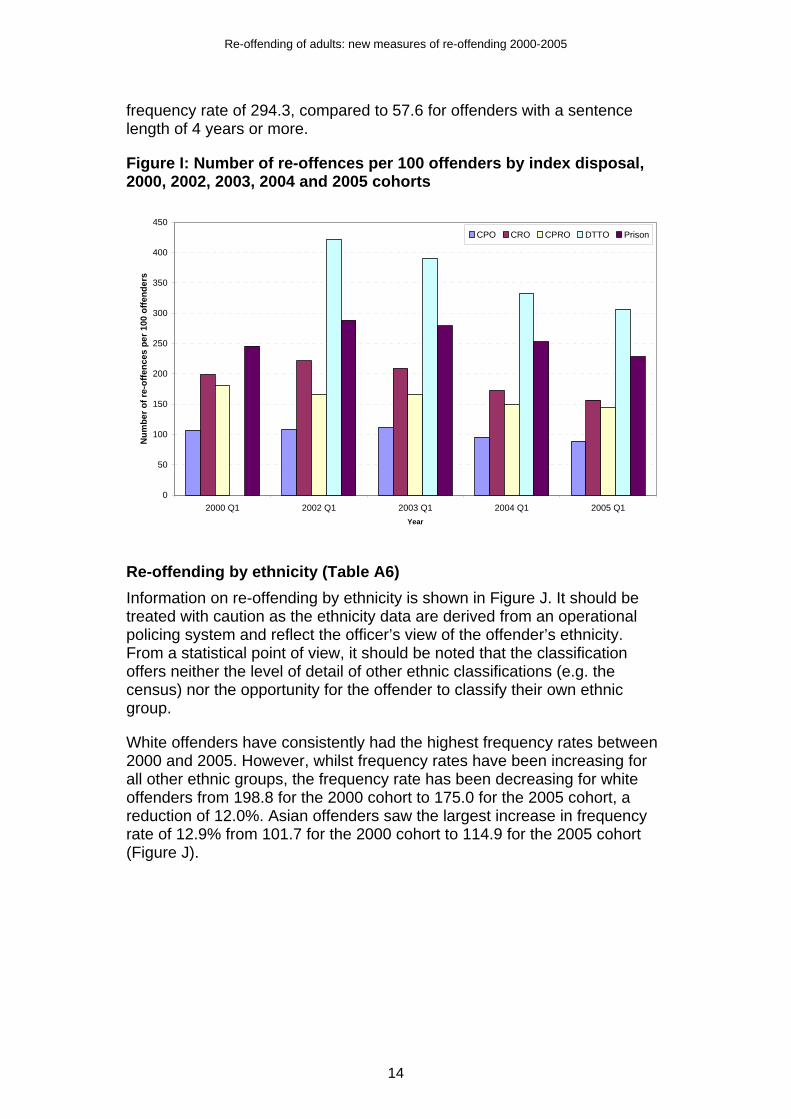
Re-offending of adults: new measures of re-offending 2000-2005
frequency rate of 294.3, compared to 57.6 for offenders with a sentence length of 4 years or more.
Figure I: Number of re-offences per 100 offenders by index disposal, 2000, 2002, 2003, 2004 and 2005 cohorts
0
50
100
150
200
250
300
350
400
450
2000 Q1 2002 Q1 2003 Q1 2004 Q1 2005 Q1Year
Num
ber o
f re-
offe
nces
per
100
offe
nder
s
CPO CRO CPRO DTTO Prison
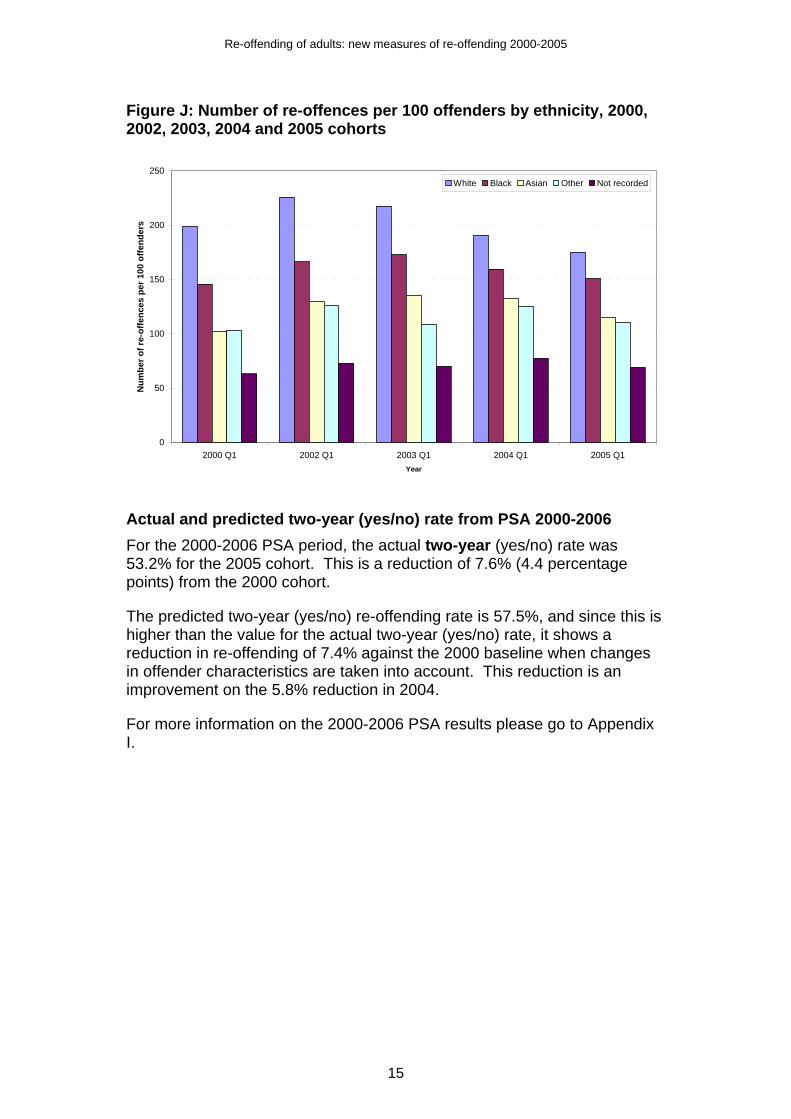
Re-offending by ethnicity (Table A6) Information on re-offending by ethnicity is shown in Figure J. It should be treated with caution as the ethnicity data are derived from an operational policing system and reflect the officer’s view of the offender’s ethnicity. From a statistical point of view, it should be noted that the classification offers neither the level of detail of other ethnic classifications (e.g. the census) nor the opportunity for the offender to classify their own ethnic group.
White offenders have consistently had the highest frequency rates between 2000 and 2005. However, whilst frequency rates have been increasing for all other ethnic groups, the frequency rate has been decreasing for white offenders from 198.8 for the 2000 cohort to 175.0 for the 2005 cohort, a reduction of 12.0%. Asian offenders saw the largest increase in frequency rate of 12.9% from 101.7 for the 2000 cohort to 114.9 for the 2005 cohort (Figure J).
14
Re-offending of adults: new measures of re-offending 2000-2005
Figure J: Number of re-offences per 100 offenders by ethnicity, 2000, 2002, 2003, 2004 and 2005 cohorts
0
50
100
150
200
250
2000 Q1 2002 Q1 2003 Q1 2004 Q1 2005 Q1Year
Num
ber o
f re-
offe
nces
per
100
offe
nder
s
White Black Asian Other Not recorded
Actual and predicted two-year (yes/no) rate from PSA 2000-2006 For the 2000-2006 PSA period, the actual two-year (yes/no) rate was 53.2% for the 2005 cohort. This is a reduction of 7.6% (4.4 percentage points) from the 2000 cohort.
The predicted two-year (yes/no) re-offending rate is 57.5%, and since this is higher than the value for the actual two-year (yes/no) rate, it shows a reduction in re-offending of 7.4% against the 2000 baseline when changes in offender characteristics are taken into account. This reduction is an improvement on the 5.8% reduction in 2004.
For more information on the 2000-2006 PSA results please go to Appendix I.
15

Re-offending of adults: new measures of re-offending 2000-2005
Appendix A: Statistical tables
Table A1: Actual and predicted one-year re-offending rates, and frequency and severity rates per 100 offenders, by gender
Number of offenders
Actual one-year re-offending rate
2005 Predicted one-year re-
offending rate
Number of re-offences per 100
offenders
Number of re-offences per 100
re-offenders
Number of severe re-offences per 100 offenders
Males 2000 Q1 38,926 44.7 41.4 193.1 432.0 0.92002 Q1 38,798 46.7 42.6 216.7 464.2 1.02003 Q1 39,352 46.6 42.7 209.7 450.5 1.02004 Q1 41,347 44.0 42.7 186.0 422.5 0.92005 Q1 38,631 42.3 42.3 170.7 403.6 1.0
Females 2000 Q1 5,660 36.8 34.5 164.1 445.4 *2002 Q1 5,794 40.3 36.1 200.4 497.4 0.42003 Q1 5,763 40.9 36.9 192.3 470.6 0.32004 Q1 6,134 38.4 37.5 164.8 429.2 *2005 Q1 5,692 36.7 36.7 149.0 406.5 0.2
Total 2000 Q1 44,586 43.7 40.6 189.4 433.4 0.82002 Q1 44,592 45.9 41.7 214.6 468.0 0.92003 Q1 45,115 45.8 42.0 207.5 452.7 0.92004 Q1 47,481 43.3 42.1 183.3 423.3 0.82005 Q1 44,323 41.6 41.6 167.9 404.0 0.9
*Data removed as extremely low numbers (less than or equal to 10 offenders or 10 offences) make the data unreliable for interpretation.Italics mean greater than 10 and less than 50 offenders or offences - treat the data with caution.Separate tables for males and females are also available in a downloadable Microsoft Excel format at the Ministry of Justice website.
16

Re-offending of adults: new measures of re-offending 2000-2005
Table A2: Actual and predicted one-year re-offending rates, and frequency and severity rates per 100 offenders, by age
Number of offenders
Actual one-year re-offending rate
2005 Predicted one-year re-
offending rate
Number of re-offences per 100
offenders
Number of re-offences per 100
re-offenders
Number of severe re-offences per 100 offenders
18 - 20 2000 Q1 10,449 54.8 49.6 256.9 469.1 1.22002 Q1 9,410 54.6 50.5 264.9 485.3 1.42003 Q1 8,848 55.0 50.9 250.9 456.5 1.72004 Q1 8,778 51.4 50.8 219.3 426.3 1.42005 Q1 8,117 50.0 50.0 206.7 413.1 1.4
21 - 24 2000 Q1 8,670 49.7 43.4 225.2 453.4 0.92002 Q1 9,343 51.5 45.1 255.0 494.7 1.02003 Q1 9,503 51.2 45.6 240.8 470.3 0.92004 Q1 9,604 46.6 45.2 203.3 435.9 1.12005 Q1 8,636 45.0 45.0 183.1 406.6 1.1
25 - 29 2000 Q1 9,042 46.5 42.6 200.6 431.7 0.72002 Q1 8,620 49.7 44.6 240.1 482.8 0.82003 Q1 8,558 49.2 44.8 227.8 463.3 0.82004 Q1 8,983 46.8 45.2 203.9 435.4 0.72005 Q1 8,209 45.3 45.3 187.5 413.9 0.8
30 - 34 2000 Q1 6,879 39.6 38.2 156.1 393.7 0.72002 Q1 6,796 44.0 40.2 195.7 444.8 0.72003 Q1 6,984 46.0 41.5 206.0 447.9 0.72004 Q1 7,572 43.7 42.2 185.6 424.9 0.72005 Q1 6,897 41.2 41.2 165.7 402.5 0.7
35 - 39 2000 Q1 4,642 32.2 33.3 115.7 359.6 0.52002 Q1 4,838 37.2 35.1 151.1 406.5 0.62003 Q1 5,196 37.9 35.9 160.9 424.4 0.52004 Q1 5,635 38.5 37.3 153.9 399.4 0.52005 Q1 5,385 37.3 37.3 143.4 384.2 0.5
40 - 49 2000 Q1 3,929 23.1 24.9 87.7 380.1 0.32002 Q1 4,395 27.9 26.9 113.2 405.1 0.52003 Q1 4,679 28.7 27.7 118.2 411.2 0.42004 Q1 5,371 30.1 28.8 116.7 388.4 0.62005 Q1 5,461 29.5 29.5 112.5 380.8 0.5
50+ 2000 Q1 975 13.0 14.6 40.6 311.8 *2002 Q1 1,190 16.0 15.9 54.6 342.1 *2003 Q1 1,347 15.9 15.6 56.3 354.2 *2004 Q1 1,538 17.2 16.8 61.3 355.8 *2005 Q1 1,618 17.8 17.8 70.3 395.1 *
Total 2000 Q1 44,586 43.7 40.6 189.4 433.4 0.82002 Q1 44,592 45.9 41.7 214.6 468.0 0.92003 Q1 45,115 45.8 42.0 207.5 452.7 0.92004 Q1 47,481 43.3 42.1 183.3 423.3 0.82005 Q1 44,323 41.6 41.6 167.9 404.0 0.9
*Data removed as extremely low numbers (less than or equal to 10 offenders or 10 offences) make the data unreliable for interpretation.Italics mean greater than 10 and less than 50 offenders or offences - treat the data with caution.
17

Re-offending of adults: new measures of re-offending 2000-2005
Table A3 (Part 1): Actual and predicted one-year re-offending rates, and frequency and severity rates per 100 offenders, by index offence group
Number of offenders
Actual one-year re-
offending rate
2005 Predicted one-year re-
offending rate
Number of re-offences per 100
offenders
Number of re-offences per 100
re-offenders
Number of severe re-offences per 100 offenders
Violence (serious) 2000 Q1 1,183 23.0 17.4 68.5 297.8 1.52002 Q1 1,082 24.3 19.0 78.8 324.3 1.12003 Q1 1,162 21.7 18.8 64.5 297.2 2.02004 Q1 1,150 18.5 19.0 54.3 293.0 *2005 Q1 1,013 19.5 19.5 52.6 269.2 *2000 Q1 6,528 32.3 31.3 108.2 335.3 1.12002 Q1 6,673 34.2 32.2 124.5 364.2 1.02003 Q1 7,101 35.0 32.7 123.9 354.3 0.92004 Q1 8,176 34.0 33.4 114.8 337.7 1.02005 Q1 8,934 33.4 33.4 106.4 318.2 1.3
Robbery 2000 Q1 764 41.6 29.9 149.0 357.9 2.12002 Q1 715 39.6 29.7 141.3 356.9 *2003 Q1 815 40.9 30.4 147.7 361.6 *2004 Q1 843 38.0 31.5 126.8 334.1 *2005 Q1 755 32.2 32.2 110.6 343.6 *
Public order or riot 2000 Q1 2,096 32.7 29.0 114.5 350.4 1.22002 Q1 2,097 32.6 29.5 120.8 370.9 1.32003 Q1 2,145 35.9 30.8 129.6 360.9 1.22004 Q1 2,243 32.6 31.0 119.0 364.8 1.52005 Q1 2,248 31.1 31.1 103.9 333.6 1.0
Sexual 2000 Q1 251 21.9 22.8 102.8 469.1 *2002 Q1 262 20.6 23.7 61.1 296.3 *2003 Q1 261 19.5 23.4 56.7 290.2 *2004 Q1 268 21.3 24.5 76.5 359.6 *2005 Q1 320 26.3 26.2 80.0 304.8 *
Sexual (child) 2000 Q1 378 10.3 9.4 28.8 279.5 *2002 Q1 388 12.4 9.4 30.7 247.9 *2003 Q1 439 10.0 8.5 51.9 518.2 *2004 Q1 552 8.3 8.1 20.1 241.3 *2005 Q1 512 8.2 8.2 21.7 264.3 *2000 Q1 17 29.4 29.6 82.4 280.0 *2002 Q1 30 56.7 38.7 183.3 323.5 *2003 Q1 18 38.9 37.5 338.9 871.4 *2004 Q1 * * * * * *2005 Q1 22 50.0 39.6 190.9 381.8 *
Domestic burglary 2000 Q1 2,432 59.9 51.1 243.4 406.5 1.02002 Q1 1,813 61.6 52.3 257.4 418.2 1.22003 Q1 2,002 58.0 52.7 236.1 407.1 1.22004 Q1 1,994 54.3 53.0 214.4 394.7 0.82005 Q1 1,594 53.8 53.8 197.1 366.2 0.8
Other burglary 2000 Q1 1,852 61.3 58.1 273.6 446.0 0.72002 Q1 1,665 64.3 59.6 306.6 476.7 0.92003 Q1 1,666 67.2 60.7 324.4 483.0 1.32004 Q1 1,668 64.7 61.8 283.1 437.6 1.12005 Q1 1,372 62.4 62.4 273.8 438.9 0.9
Theft 2000 Q1 7,763 65.5 61.4 342.6 522.8 0.62002 Q1 8,915 68.9 62.9 386.1 560.6 0.82003 Q1 8,059 68.5 64.2 378.3 551.9 0.72004 Q1 8,088 66.7 64.9 338.1 507.0 0.82005 Q1 7,041 65.9 65.9 326.4 495.6 0.7
Handling 2000 Q1 2,187 54.4 51.1 252.4 464.2 0.72002 Q1 1,684 58.6 51.9 300.1 512.1 0.72003 Q1 1,647 57.2 53.4 287.9 503.4 0.62004 Q1 1,446 55.1 53.6 255.9 464.4 *2005 Q1 1,205 54.9 54.9 236.3 430.1 0.8
*Data removed as extremely low numbers (less than or equal to 10 offenders or 10 offences) make the data unreliable for interpretation.Italics mean greater than 10 and less than 50 offenders or offences - treat the data with caution.It should be noted that any re-offences committed by offenders are not necessarily of the same offence type as the index offence group.
Violence (non serious)
Soliciting or prostitution
18
Re-offending of adults: new measures of re-offending 2000-2005
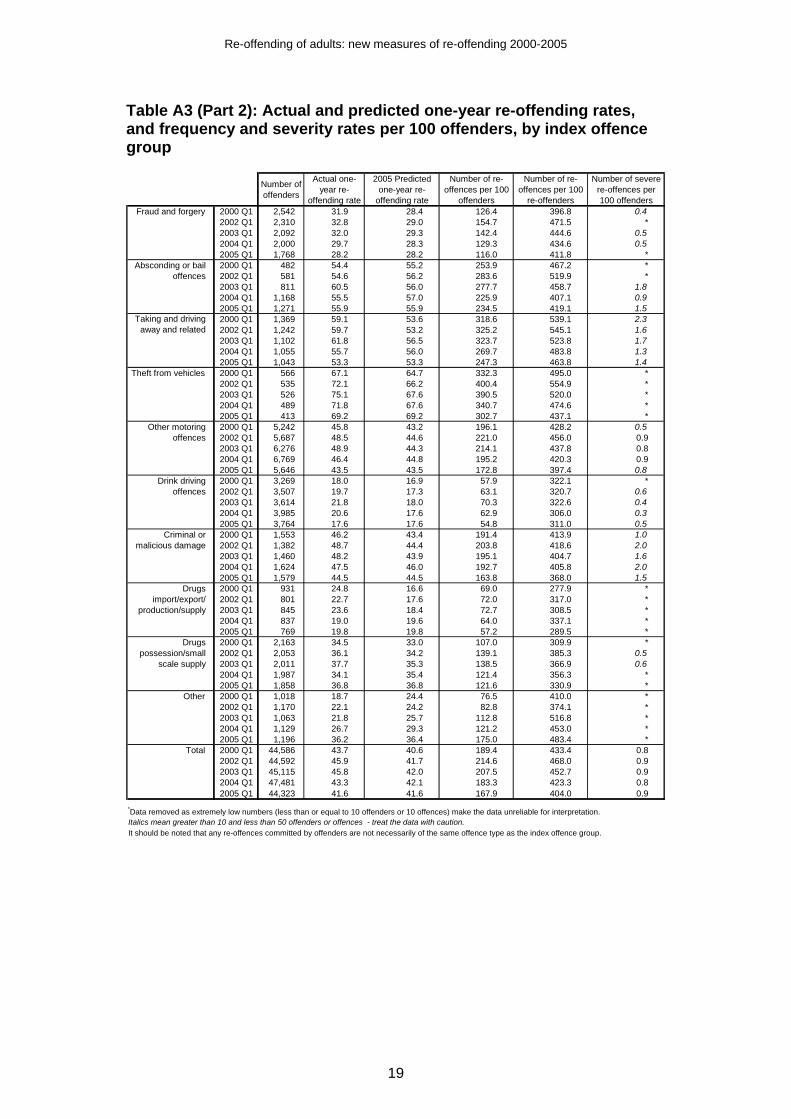
Table A3 (Part 2): Actual and predicted one-year re-offending rates, and frequency and severity rates per 100 offenders, by index offence group
Number of offenders
Actual one-year re-
offending rate
2005 Predicted one-year re-
offending rate
Number of re-offences per 100
offenders
Number of re-offences per 100
re-offenders
Number of severe re-offences per 100 offenders
Fraud and forgery 2000 Q1 2,542 31.9 28.4 126.4 396.8 0.42002 Q1 2,310 32.8 29.0 154.7 471.5 *2003 Q1 2,092 32.0 29.3 142.4 444.6 0.52004 Q1 2,000 29.7 28.3 129.3 434.6 0.52005 Q1 1,768 28.2 28.2 116.0 411.8 *2000 Q1 482 54.4 55.2 253.9 467.2 *2002 Q1 581 54.6 56.2 283.6 519.9 *2003 Q1 811 60.5 56.0 277.7 458.7 1.82004 Q1 1,168 55.5 57.0 225.9 407.1 0.92005 Q1 1,271 55.9 55.9 234.5 419.1 1.52000 Q1 1,369 59.1 53.6 318.6 539.1 2.32002 Q1 1,242 59.7 53.2 325.2 545.1 1.62003 Q1 1,102 61.8 56.5 323.7 523.8 1.72004 Q1 1,055 55.7 56.0 269.7 483.8 1.32005 Q1 1,043 53.3 53.3 247.3 463.8 1.4
Theft from vehicles 2000 Q1 566 67.1 64.7 332.3 495.0 *2002 Q1 535 72.1 66.2 400.4 554.9 *2003 Q1 526 75.1 67.6 390.5 520.0 *2004 Q1 489 71.8 67.6 340.7 474.6 *2005 Q1 413 69.2 69.2 302.7 437.1 *2000 Q1 5,242 45.8 43.2 196.1 428.2 0.52002 Q1 5,687 48.5 44.6 221.0 456.0 0.92003 Q1 6,276 48.9 44.3 214.1 437.8 0.82004 Q1 6,769 46.4 44.8 195.2 420.3 0.92005 Q1 5,646 43.5 43.5 172.8 397.4 0.82000 Q1 3,269 18.0 16.9 57.9 322.1 *2002 Q1 3,507 19.7 17.3 63.1 320.7 0.62003 Q1 3,614 21.8 18.0 70.3 322.6 0.42004 Q1 3,985 20.6 17.6 62.9 306.0 0.32005 Q1 3,764 17.6 17.6 54.8 311.0 0.52000 Q1 1,553 46.2 43.4 191.4 413.9 1.02002 Q1 1,382 48.7 44.4 203.8 418.6 2.02003 Q1 1,460 48.2 43.9 195.1 404.7 1.62004 Q1 1,624 47.5 46.0 192.7 405.8 2.02005 Q1 1,579 44.5 44.5 163.8 368.0 1.52000 Q1 931 24.8 16.6 69.0 277.9 *2002 Q1 801 22.7 17.6 72.0 317.0 *2003 Q1 845 23.6 18.4 72.7 308.5 *2004 Q1 837 19.0 19.6 64.0 337.1 *2005 Q1 769 19.8 19.8 57.2 289.5 *2000 Q1 2,163 34.5 33.0 107.0 309.9 *2002 Q1 2,053 36.1 34.2 139.1 385.3 0.52003 Q1 2,011 37.7 35.3 138.5 366.9 0.62004 Q1 1,987 34.1 35.4 121.4 356.3 *2005 Q1 1,858 36.8 36.8 121.6 330.9 *
Other 2000 Q1 1,018 18.7 24.4 76.5 410.0 *2002 Q1 1,170 22.1 24.2 82.8 374.1 *2003 Q1 1,063 21.8 25.7 112.8 516.8 *2004 Q1 1,129 26.7 29.3 121.2 453.0 *2005 Q1 1,196 36.2 36.4 175.0 483.4 *
Total 2000 Q1 44,586 43.7 40.6 189.4 433.4 0.82002 Q1 44,592 45.9 41.7 214.6 468.0 0.92003 Q1 45,115 45.8 42.0 207.5 452.7 0.92004 Q1 47,481 43.3 42.1 183.3 423.3 0.82005 Q1 44,323 41.6 41.6 167.9 404.0 0.9
*Data removed as extremely low numbers (less than or equal to 10 offenders or 10 offences) make the data unreliable for interpretation.Italics mean greater than 10 and less than 50 offenders or offences - treat the data with caution.It should be noted that any re-offences committed by offenders are not necessarily of the same offence type as the index offence group.
Criminal or malicious damage
Drugs import/export/
production/supply
Drugs possession/small
scale supply
Absconding or bail offences
Other motoring offences
Drink driving offences
Taking and driving away and related
19

Re-offending of adults: new measures of re-offending 2000-2005
Table A4: Actual and predicted one-year re-offending rates, and frequency and severity rates per 100 offenders, by number of previous offences
Number of offenders
Actual one-year re-offending rate
2005 Predicted one-year re-
offending rate
Number of re-offences per 100
offenders
Number of re-offences per 100
re-offenders
Number of severe re-offences per 100 offenders
2000 Q1 5,603 7.8 10.2 19.0 243.1 *2002 Q1 5,431 8.6 10.2 22.0 254.8 0.22003 Q1 5,166 8.0 9.7 20.8 259.9 *2004 Q1 5,345 8.3 9.6 21.8 264.0 *2005 Q1 5,213 8.2 9.4 20.4 247.9 0.32000 Q1 5,487 21.7 21.3 62.6 287.9 0.42002 Q1 5,050 21.2 20.8 64.8 304.8 0.62003 Q1 4,992 20.9 19.9 61.3 292.9 0.52004 Q1 5,108 18.3 19.4 51.4 280.4 0.32005 Q1 4,916 17.4 19.4 44.6 257.2 0.42000 Q1 6,854 34.8 31.2 121.8 350.6 0.72002 Q1 6,681 34.9 30.3 125.4 359.7 0.62003 Q1 6,641 33.4 29.5 108.2 323.6 0.52004 Q1 7,087 30.4 28.9 94.1 309.6 0.52005 Q1 6,553 28.7 28.3 81.7 284.5 0.72000 Q1 4,610 43.9 38.6 164.7 374.8 0.72002 Q1 4,561 43.3 38.6 172.5 398.0 1.12003 Q1 4,603 42.4 37.4 158.5 374.3 1.02004 Q1 4,769 39.1 36.8 133.4 340.9 0.82005 Q1 4,358 38.4 36.4 126.0 327.9 0.92000 Q1 22,032 61.0 56.4 290.5 476.1 1.12002 Q1 22,869 63.8 57.8 327.8 513.6 1.22003 Q1 23,713 63.5 58.0 316.3 498.4 1.22004 Q1 25,172 60.2 58.2 278.9 463.1 1.22005 Q1 23,283 58.3 58.1 259.0 444.1 1.2
Total 2000 Q1 44,586 43.7 40.6 189.4 433.4 0.82002 Q1 44,592 45.9 41.7 214.6 468.0 0.92003 Q1 45,115 45.8 42.0 207.5 452.7 0.92004 Q1 47,481 43.3 42.1 183.3 423.3 0.82005 Q1 44,323 41.6 41.6 167.9 404.0 0.9
*Data removed as extremely low numbers (less than or equal to 10 offenders or 10 offences) make the data unreliable for interpretation.Italics mean greater than 10 and less than 50 offenders or offences - treat the data with caution.
Greater than 10 offences
No previous offences
Between 1 and 2 offences
Between 3 and 6 offences
Between 7 and 10 offences
20
Re-offending of adults: new measures of re-offending 2000-2005
Table A5: Actual one-year re-offending rates, and frequency and severity rates per 100 offenders, by index disposal
Number of offenders
Actual one-year re-offending rate
Number of re-offences per 100 offenders
Number of re-offences per 100 re-offenders
Number of severe re-offences per 100 offenders
2000 Q1 28,859 39.5 158.8 401.9 0.62002 Q1 29,014 40.9 175.1 427.8 0.72003 Q1 30,757 42.1 174.1 413.8 0.72004 Q1 31,720 39.0 148.6 380.9 0.72005 Q1 29,728 37.9 138.1 364.8 0.82000 Q1 11,398 29.8 106.9 359.0 0.62002 Q1 11,826 29.1 108.1 371.9 0.62003 Q1 11,844 30.2 111.4 368.4 0.62004 Q1 12,261 28.1 95.8 341.1 0.62005 Q1 11,672 27.4 88.9 324.6 0.62000 Q1 11,744 47.1 198.7 421.3 0.62002 Q1 12,484 49.4 221.4 448.1 0.72003 Q1 13,898 48.9 208.8 427.4 0.82004 Q1 13,582 44.1 172.6 391.4 0.82005 Q1 12,245 42.1 156.7 372.0 0.92000 Q1 5,669 43.2 180.0 416.9 0.62002 Q1 3,706 39.9 166.4 417.3 1.22003 Q1 3,670 41.6 165.4 397.5 1.02004 Q1 4,141 40.6 149.0 367.2 1.02005 Q1 3,881 39.8 143.7 361.0 1.02000 Q1 * * * * *2002 Q1 991 79.1 421.8 533.2 *2003 Q1 1,336 77.3 390.9 505.6 *2004 Q1 1,724 72.6 332.1 457.3 *2005 Q1 1,923 70.3 306.9 436.9 *
Unknown 2000 Q1 45 53.3 222.2 416.7 *2002 Q1 * * * * *2003 Q1 * * * * *2004 Q1 12 75.0 491.7 655.6 *2005 Q1 * * * * *
Custody 2000 Q1 15,727 51.4 245.5 478.0 1.12002 Q1 15,578 55.0 288.2 523.6 1.22003 Q1 14,358 53.9 279.1 517.9 1.22004 Q1 15,761 51.9 253.1 487.3 1.02005 Q1 14,595 49.1 228.5 465.5 1.12000 Q1 10,334 58.0 296.8 512.0 1.02002 Q1 10,633 63.6 356.0 559.9 1.32003 Q1 9,146 64.7 362.5 560.3 1.42004 Q1 10,578 61.9 319.8 517.1 1.22005 Q1 9,688 59.7 294.3 493.1 1.32000 Q1 2,480 43.6 179.2 410.6 1.32002 Q1 2,271 43.4 180.7 416.5 1.32003 Q1 2,280 43.4 179.7 413.9 1.12004 Q1 2,130 38.9 154.1 396.0 1.12005 Q1 2,046 34.3 133.7 389.7 1.22000 Q1 1,941 40.1 142.3 355.1 1.22002 Q1 1,763 36.0 129.4 359.8 *2003 Q1 1,889 32.3 108.0 334.6 1.02004 Q1 1,993 31.3 109.8 351.2 *2005 Q1 1,863 26.9 82.0 305.0 0.6
4 years and over 2000 Q1 972 23.4 75.3 322.5 *2002 Q1 911 21.3 71.8 337.1 *2003 Q1 1,043 21.2 75.3 355.2 *2004 Q1 1,060 17.9 55.0 306.8 *2005 Q1 998 17.9 57.6 321.2 *
Total 2000 Q1 44,586 43.7 189.4 433.4 0.82002 Q1 44,592 45.9 214.6 468.0 0.92003 Q1 45,115 45.8 207.5 452.7 0.92004 Q1 47,481 43.3 183.3 423.3 0.82005 Q1 44,323 41.6 167.9 404.0 0.9
*Data removed as extremely low numbers (less than or equal to 10 offenders or 10 offences) make the data unreliable for interpretation.Italics mean greater than 10 and less than 50 offenders or offences - treat the data with caution.2005 Predicted rates were removed from this table because disposal is not included in the prediction model making predictive rates potentially biased.
12 months to less than 2 years
2 years to less than 4 years
Community Punishment &
Rehabilitation Order (CPRO)
Community Sentences
Community Rehabilitation Order
(CRO)
Drug Treatment and Testing Order
(DTTO)
Community Punishment Order
(CPO)
Less than 12 months
21

Re-offending of adults: new measures of re-offending 2000-2005
Table A6: Actual and predicted one-year re-offending rates, and frequency and severity rates per 100 offenders, by ethnicity
Number of offenders
Actual one-year re-offending rate
2005 Predicted one-year re-
offending rate
Number of re-offences per 100
offenders
Number of re-offences per 100
re-offenders
Number of severe re-offences per 100 offenders
White 2000 Q1 39,385 45.2 41.4 198.8 439.9 0.82002 Q1 38,597 47.3 42.8 226.0 477.6 0.92003 Q1 38,666 47.2 43.1 217.6 460.6 0.92004 Q1 40,591 44.4 43.2 190.5 429.0 0.82005 Q1 37,678 42.7 42.7 175.0 410.0 0.9
Black 2000 Q1 2,657 39.9 41.2 145.7 364.9 0.92002 Q1 3,160 41.9 40.3 166.3 397.1 1.22003 Q1 3,500 43.9 40.4 172.9 394.1 1.12004 Q1 3,763 41.4 40.6 159.6 385.2 1.42005 Q1 3,431 41.3 41.3 151.0 365.9 1.3
Asian 2000 Q1 1,551 28.8 31.5 101.7 353.0 0.82002 Q1 1,843 35.4 33.2 129.5 365.4 *2003 Q1 1,931 34.2 33.5 134.9 394.1 0.62004 Q1 2,016 35.3 33.4 132.3 375.1 0.72005 Q1 2,011 32.7 32.7 114.9 351.1 *
Other 2000 Q1 182 28.6 37.9 102.7 359.6 *2002 Q1 210 37.1 38.9 126.2 339.7 *2003 Q1 286 29.4 33.8 108.7 370.2 *2004 Q1 310 35.5 34.5 125.5 353.6 *2005 Q1 322 34.5 34.5 110.2 319.8 *
Not Recorded 2000 Q1 811 15.2 15.5 63.0 415.4 *2002 Q1 782 17.0 15.5 73.0 429.3 *2003 Q1 732 17.6 15.8 70.2 398.4 *2004 Q1 801 18.7 17.9 77.5 414.0 *2005 Q1 881 16.7 16.7 69.0 413.6 *
Total 2000 Q1 44,586 43.7 40.6 189.4 433.4 0.82002 Q1 44,592 45.9 41.7 214.6 468.0 0.92003 Q1 45,115 45.8 42.0 207.5 452.7 0.92004 Q1 47,481 43.3 42.1 183.3 423.3 0.82005 Q1 44,323 41.6 41.6 167.9 404.0 0.9
*Data removed as extremely low numbers (less than or equal to 10 offenders or 10 offences) make the data unreliable for interpretation.Italics mean greater than 10 and less than 50 offenders or offences - treat the data with caution.
22
Re-offending of adults: new measures of re-offending 2000-2005
23
Table A7: Number of re-offences committed, and proportion of all re-offences, by offence group of re-offence
Number of re-offences 84,455 95,686 93,610 87,028 74,407
Violence (serious) 282 316 337 295 289Violence (non serious) 6,012 7,106 7,445 7,859 7,451
Robbery 591 706 619 620 495Public order or riot 4,769 5,010 5,291 5,424 5,027
Sexual 135 140 147 215 234Sexual (child) 20 41 80 47 62
Soliciting or prostitution 292 383 421 285 195Domestic burglary 2,058 2,088 2,064 1,595 1,464
Other burglary 2,369 2,735 2,622 2,292 2,071Theft 24,183 26,594 24,025 22,018 18,435
Handling 2,105 2,165 1,835 1,510 1,145Fraud and forgery 2,674 2,820 2,540 2,406 1,862
Absconding or bail offences 8,714 11,637 11,695 10,120 7,919Taking and driving away and related offences 1,968 2,032 1,771 1,565 1,263
Theft from vehicles 1,349 1,455 1,331 1,170 1,067Other motoring offences 17,200 19,428 20,244 18,032 13,863
Drink driving 1,673 1,822 1,744 1,796 1,427Criminal or malicious damage 3,192 3,512 3,423 3,636 3,515
Ta
Italic
*Datafor in
2005 Q12000 Q1 2002 Q1 2003 Q1 2004 Q1
Drugs import/export/production/supply 392 523 638 660 601Drugs possession/small scale supply 3,755 4,259 4,227 3,614 3,518
Other 722 914 1,111 1,869 2,504
Proportion of all re-offences
Violence (serious) 0.3 0.3 0.4 0.3 0.4Violence (non serious) 7.1 7.4 8.0 9.0 10.0
Robbery 0.7 0.7 0.7 0.7 0.7Public order or riot 5.6 5.2 5.7 6.2 6.8
Sexual 0.2 0.1 0.2 0.2 0.3Sexual (child) 0.0 0.0 0.1 0.1 0.1
Soliciting or prostitution 0.3 0.4 0.4 0.3 0.3Domestic burglary 2.4 2.2 2.2 1.8 2.0
Other burglary 2.8 2.9 2.8 2.6 2.8Theft 28.6 27.8 25.7 25.3 24.8
Handling 2.5 2.3 2.0 1.7 1.5Fraud and forgery 3.2 2.9 2.7 2.8 2.5
Absconding or bail offences 10.3 12.2 12.5 11.6 10.6king and driving away and related offences 2.3 2.1 1.9 1.8 1.7
Theft from vehicles 1.6 1.5 1.4 1.3 1.4Other motoring offences 20.4 20.3 21.6 20.7 18.6
Drink driving 2.0 1.9 1.9 2.1 1.9Criminal or malicious damage 3.8 3.7 3.7 4.2 4.7
Drugs import/export/production/supply 0.5 0.5 0.7 0.8 0.8Drugs possession/small scale supply 4.4 4.5 4.5 4.2 4.7
Other 0.9 1.0 1.2 2.1 3.4
s mean greater than 10 and less than 50 offenders or offences - treat the data with caution.
removed as extremely low numbers (less than or equal to 10 offenders or 10 offences) make the data unreliable terpretation.
Re-offending of adults: new measures of re-offending 2000-2005
24
Viol
ence
(ser
ious
)
Viol
ence
(non
ser
ious
)
Rob
bery
Publ
ic o
rder
or r
iot
Sexu
al
Sexu
al (c
hild
)
Solic
iting
or p
rost
itutio
n
Dom
estic
bur
glar
y
Oth
er b
urgl
ary
Thef
t
Han
dlin
g
Frau
d an
d fo
rger
y
Absc
ondi
ng o
r bai
l offe
nces
Taki
ng a
nd d
rivin
g aw
ay a
nd
rela
ted
offe
nces
Thef
t fro
m v
ehic
les
Oth
er m
otor
ing
offe
nces
Drin
k dr
ivin
g
Crim
inal
or m
alic
ious
dam
age
Dru
gs
impo
rt/ex
port/
prod
uctio
n/su
pply
Dru
gs p
osse
ssio
n/sm
all s
cale
su
pply
Oth
er
Tota
l
Violence (serious) * 103 * 41 * * * * 11 50 * * 45 * * 101 30 48 * 36 * 533Violence (non serious) 92 2,002 78 1,189 40 * 34 103 174 1,131 86 144 885 121 62 1,412 327 819 56 404 340 9,509
Robbery * 110 22 55 * * * 21 21 130 13 27 74 15 * 174 24 57 * 48 19 835Public order or riot 16 407 14 517 15 * * 12 15 237 34 42 217 25 15 264 72 184 * 112 129 2,335
Sexual * 34 * 28 61 * * * * 15 * * 18 * * 30 * 15 * * 23 256Sexual (child) * * * * 24 11 * * * * * * * * * 20 * * * * * 111
Soliciting or prostitution * * * * * * 22 * * * * * * * * * * * * * * 42Domestic burglary 11 262 57 125 * * * 313 187 693 66 65 297 75 59 466 44 122 63 158 72 3,142
Other burglary * 254 26 165 * * * 160 418 807 86 79 396 90 104 645 38 167 17 192 99 3,757Theft 40 1,331 127 1,099 23 24 45 317 579 11,251 338 525 2,916 157 204 1,764 117 611 149 891 475 22,983
Handling * 212 19 108 * * * 62 87 719 129 145 325 49 57 553 23 88 * 182 58 2,847Fraud and forgery * 180 * 72 * * * 43 32 517 34 338 239 35 20 298 30 57 13 92 31 2,051
Absconding or bail offences 14 298 15 239 * * 47 58 56 479 48 75 491 43 57 669 58 111 25 110 77 2,980Taking and driving away and related offences 11 212 23 117 * * * 54 72 217 45 50 206 203 105 918 60 133 * 78 61 2,579
Theft from vehicles * 88 * 31 * * * 43 74 153 18 18 123 42 157 329 16 63 * 46 35 1,250Other motoring offences 29 846 41 368 * * * 147 174 883 136 222 837 260 130 4,304 248 326 118 512 152 9,755
Drink driving 11 248 * 160 * * * * 18 121 13 17 143 30 * 862 172 132 * 67 32 2,062Criminal or malicious damage 17 461 20 319 11 * * 45 69 331 24 23 249 50 23 333 61 372 19 84 73 2,587
Drugs import/export/production/supply * 32 * 22 * * * * * 76 * 16 40 * * 88 14 12 45 60 * 440Drugs possession/small scale supply * 201 15 97 * * * 42 45 407 35 37 283 30 27 449 57 71 46 368 37 2,260
Other * 164 * 266 * * 14 13 24 209 23 20 126 28 21 184 25 120 * 64 767 2,093Total 289 7,451 495 5,027 234 62 195 1,464 2,071 18,435 1,145 1,862 7,919 1,263 1,067 13,863 1,427 3,515 601 3,518 2,504 74,407
*Data removed as extremely low numbers (less than or equal to 10 offenders or 10 offences) make the data unreliable for interpretation.Italics mean greater than 10 and less than 50 offenders or offences - treat the data with caution.
Re-offence group
Index offence group
Table A8: Number of re-offences committed, by index offence group and re-offence group, 2005 cohort
Re-offending of adults: new measures of re-offending 2000-2005
Appendix B: Glossary of terms
Disposal types
Index disposal
The index disposal of the offender is either the type of community sentence the offender started, or custody, for an offender released from prison, in the 1st quarter of the relevant year. This is the disposal an offender receives for its index offence.
Community sentences
• Community punishment order (CPO) – the offender is required to undertake unpaid community work.
• Community rehabilitation order (CRO) – a community sentence which may have additional requirements such as residence, probation centre attendance or treatment for drug, alcohol or mental health problems.
• Community punishment and rehabilitation order (CPRO) – a community sentence consisting of probation supervision alongside community punishment, with additional conditions like those of a community rehabilitation order.
• Drug treatment and testing order (DTTO) – a community sentence targeted at offenders with drug misuse problems.
Custody
The offender is awarded a sentence to be served in prison. If the offender was given a sentence of over 12 months, or was aged under 22 on release, the offender is supervised by the Probation Service on release. It is important to note that the sentence length awarded will not be the full time served. See chapter 10 of Offender Management Caseload Statistics 2006 for more information.
Criminal Justice Act 2003 (CJA03)
For offences committed on or after 4th April 2005, the new Community Order replaced all existing community sentences for adults. The Act also introduced a new Suspended Sentence Order for offences which pass the custody threshold. It also changed the release arrangements for prisoners. See chapters 3 and 10 of Offender Management Caseload Statistics 2006 for more information.
Index offence The index offence is the offence the offender commits in order to be serving either the prison or community sentence for which they entered the relevant cohort.
25

Re-offending of adults: new measures of re-offending 2000-2005
Offence group There are around 3,000 offence codes on the Police National Computer. These have been classified into 21 groups: violence (non serious), violence (serious), robbery, public order or riot, sexual, sexual (child), soliciting or prostitution, domestic burglary, other burglary, theft, handling, fraud and forgery, absconding or bail offences, taking and driving away and related offences, theft from vehicles, other motoring offences, drink driving offences, criminal or malicious damage, drugs import/export/ production/supply and drugs possession/small scale supply and other. The classification adopted owes much to original work done by Taylor (1999) and enhancements developed by Lancaster University. Additionally, violence has been split into two separate groups of violence (serious) and violence (non serious).
Proven re-offending
An offender is said to have committed a proven re-offence if the offender receives a conviction at court for the re-offence. For the purposes of the statistics in this report, the re-offence must have been committed within the one-year follow up period, and the conviction must follow either within that one-year follow-up, or in a further 6 months, which is to allow time for the offence to be proven at court.
Public Service Agreement 23 (Comprehensive Spending Review 2007) Public Service Agreements (PSA) set out government commitments and the outcomes the Government wants to achieve in spending period (2008-2011). PSA 23 is entitled Make Communities Safer. Priority Action 4 of the PSA 23 is to reduce re-offending through the improved management of offenders and contains indicators on reducing re-offending. For more information on PSA 23 please visit the HM Treasury website.
Re-offending measures
• Actual (yes/no) rate – The actual number of offenders re-offending at least once during the one-year follow-up period, where the re-offence resulted in a conviction at court. The actual (yes/no) re-offending rate is presented in this report as a percentage of the total number of offenders in the cohort.
• Frequency rate – The actual number of re-offences the cohort committed during the one-year follow-up period which resulted in a conviction at court. The actual proven one-year frequency re-offending rate is produced by calculating the number of proven re-offences per 100 offenders. For added information, the number of proven re-offences per 100 re-offenders is also available in the statistical tables in Appendix A.
• Predicted (yes/no) rate – The predicted one-year (yes/no) re-offending rate is different from the other three measures in the sense that it does not come from actual proven re-offences, but from a statistical model created for the new baseline year of 2005.
26

Re-offending of adults: new measures of re-offending 2000-2005
This rate is presented as the percentage of the offenders who are estimated to re-offend in a given year after changes in offender characteristics have been controlled for. There is no predicted rate for the frequency or severity of re-offending, as yet, due to the complex nature of the variables being considered, but work continues in this area.
The predicted one-year (yes/no) re-offending rate helps to put the actual proven one-year (yes/no) re-offending rate into context and establish, in our case, whether there is a real change from 2005, just as the examination pass rate in a school will be related to its intake. For example, given the characteristics of offenders in any particular year, the predicted rate would give us an expected re-offending rate that can be compared with the actual proven one-year (yes/no). If the predicted (or expected) re-offending rate is higher than the actual proven rate, then we judge that there has been a reduction in re-offending when the offender characteristics have been taken into account. The usual way of reporting this is as a percentage change of the predicted rate: (actual - predicted) / (predicted).
• Severity rate – The actual number of the most serious6 re-offences the cohort committed during the one-year follow-up period which resulted in a conviction at court. As with the frequency rate, the severity rate is produced by calculating the number of proven severe re-offences per 100 offenders, and is therefore a subset of the frequency rate. For the full list of most serious offences please consult Appendix G.
6 Most serious offences are offences involving death (e.g. murder), serious violence against the person (e.g. grievous bodily harm) and some sexual offences. For the full list of most serious offences please consult Appendix G at the end of this report.
27

Re-offending of adults: new measures of re-offending 2000-2005
Appendix C: Measuring re-offending
Introduction Every known measure of re-offending has its drawbacks. Measures associated with using official records of re-offending or reconviction have been particularly well documented (see Lloyd et al., 1994, for example) and include the fact that they under-record actual offending behaviour and that they are partly determined by decisions on the part of criminal justice practitioners. However, other measures (e.g. self-report, re-arrest rates) also have disadvantages. For example, self-report studies rely upon respondents being honest about their offending behaviour and re-arrests may not be subsequently convicted.
Measuring re-offending We have now expanded the range of re-offending measures from the previous PSA 2000-2006 period from an actual and predicted (yes/no) re-offending rate, by adding two new measures: frequency of re-offending per 100 offenders and number of most serious re-offences per 100 offenders.
The inclusion of the frequency rate enables us to measure progress on the number of re-offences committed by the cohort and not only whether they re-offended or not, as in the current actual (yes/no) measure. The rate of most serious re-offending allows a wider understanding of the type of re-offending occurring. These two additional measures are likely to provide a better and more reliable picture of re-offending, and may allow a better understanding of the impact of offender management.
Process Under PSA 23 (see Appendix B for more information) the starting point for the re-offending indicators is to take all offenders discharged from custody or commencing community sentences (aged 18+ at discharge or commencement) in the 1st quarter of a year. Offenders’ criminal behaviour is then tracked over the following one year. Any offence committed in this one-year period which is proven by a court conviction (either in the one-year period, or in a further six months) counts as proven re-offending. This enables us to calculate the frequency of re-offending, the number of most serious re-offences and the actual (yes/no) re-offending rate.
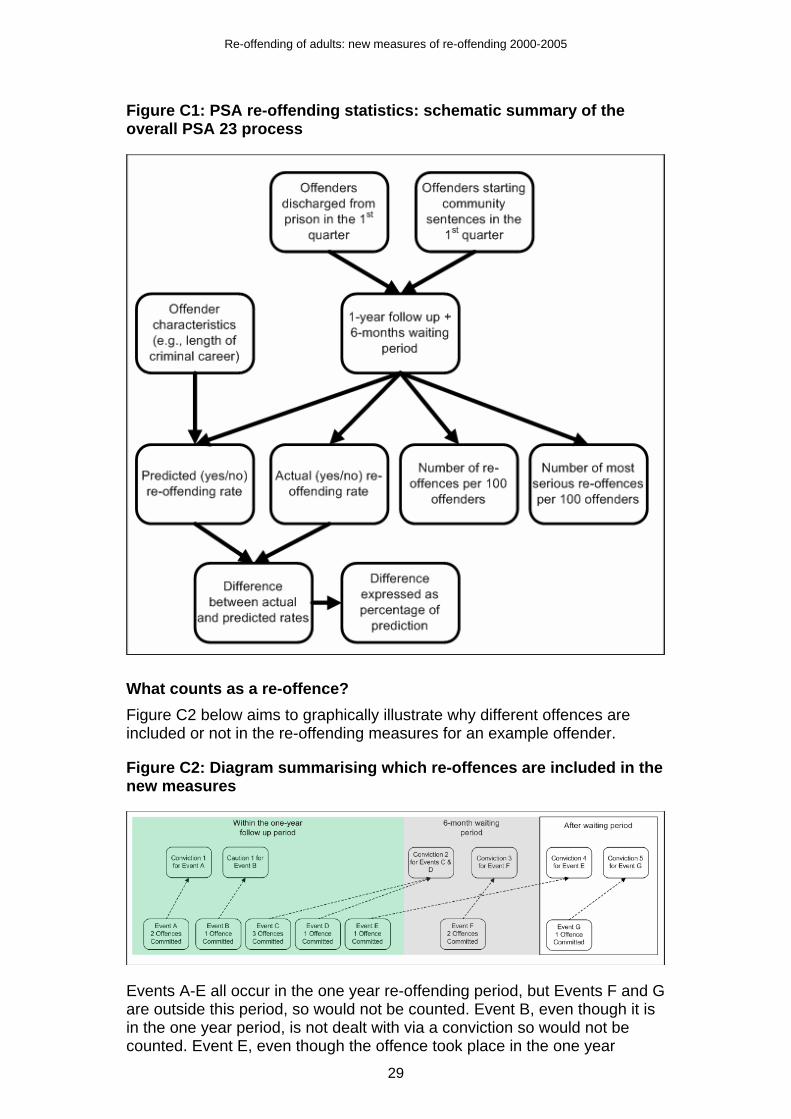
Separately, the predicted (yes/no) re-offending rate is calculated through a statistical model of the 2005 cohort using the actual re-offending rate and offender characteristics like gender, age and criminal history (see Appendix E for more information). The predicted rate is then compared to the actual (yes/no) rate. This difference is best expressed as a percentage of the predicted rate. Figure C1 describes the entire PSA 23 process.
28
Re-offending of adults: new measures of re-offending 2000-2005
Figure C1: PSA re-offending statistics: schematic summary of the overall PSA 23 process
What counts as a re-offence? Figure C2 below aims to graphically illustrate why different offences are included or not in the re-offending measures for an example offender.
Figure C2: Diagram summarising which re-offences are included in the new measures
Events A-E all occur in the one year re-offending period, but Events F and G are outside this period, so would not be counted. Event B, even though it is in the one year period, is not dealt with via a conviction so would not be counted. Event E, even though the offence took place in the one year
29

Re-offending of adults: new measures of re-offending 2000-2005
period, would not be counted, as the conviction did not occur within either the one year period, or the further six month waiting period. The offender has therefore committed 6 proven re-offences that would be counted (2 for event A, 3 for event C and 1 for event D).
Multiple Offender Entries (MOEs) An MOE is an individual offender who, after entering the cohort, commits a re-offence and is discharged from prison or commences a community sentence within the same 1st quarter period in a given year. MOEs are excluded from our analysis.
Figure C3: Example of an offender with Multiple Offender Entries
Figure C3 illustrates an example of an MOE. If MOEs were not excluded this offender would appear three times in our cohort – released once from custody and starting two community sentences within the same 1st quarter. Additionally, for the frequency measure, this offender would have committed at least 3 re-offences after the first time it entered the cohort, at least 2 offences after the second time and at least 1 offence after the last community sentence at the end of the quarter. By excluding MOEs the offender would be included in the cohort only from its release from custody and with at least 3 re-offences – this would avoid double counting of re-offences. For the sake of consistency this has been applied to all measures in this report.
Therefore, any offender discharged from prison or commencing a community sentence more than once within the first quarter of the same year is considered to be an MOEs and only their first discharge from prison or commencement of a community sentence is considered to be the index offence with all other offences counted as re-offences.
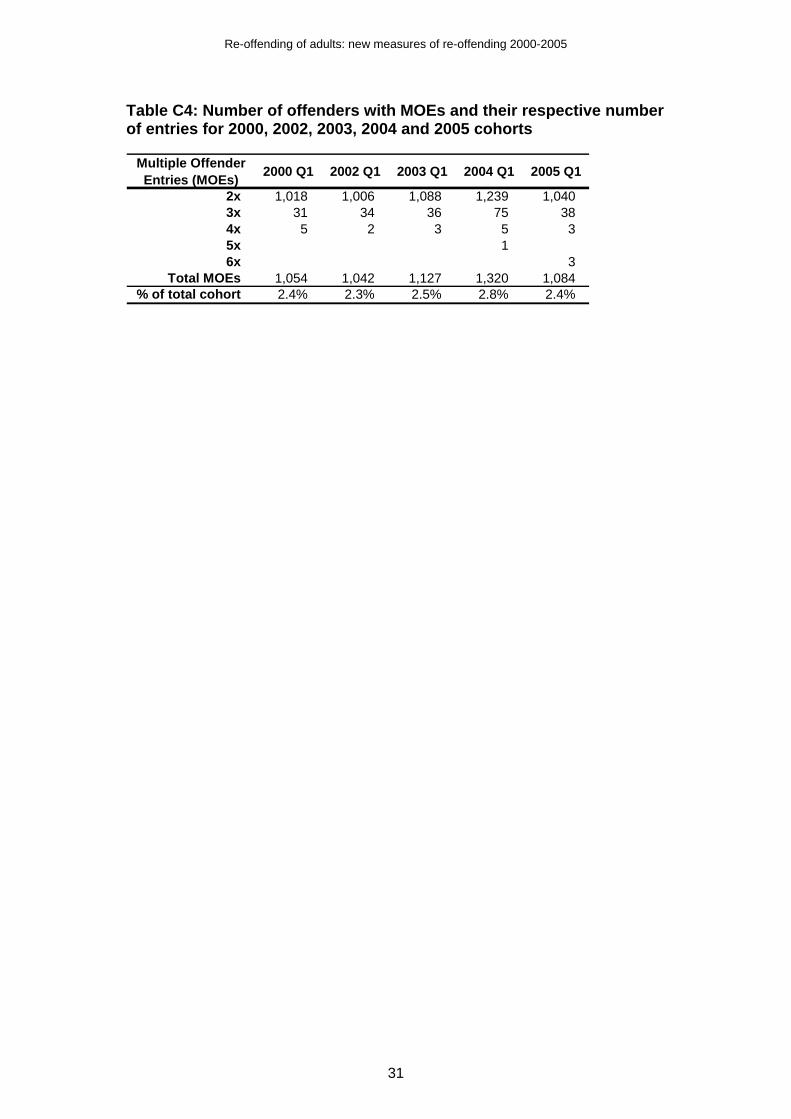
Table C4 shows the number of offenders who are MOEs and their respective number of entries. Most MOE offenders appear twice in the cohort and the number of MOEs has been constant, at around 2.5% of the entire cohort of offenders, since 2000.
30
Re-offending of adults: new measures of re-offending 2000-2005
Table C4: Number of offenders with MOEs and their respective number of entries for 2000, 2002, 2003, 2004 and 2005 cohorts
Multiple Offender Entries (MOEs) 2000 Q1 2002 Q1 2003 Q1 2004 Q1 2005 Q1
2x 1,018 1,006 1,088 1,239 1,0403x 31 34 36 75 384x 5 2 3 55x 16x 3
Total MOEs 1,054 1,042 1,127 1,320 1,084% of total cohort 2.4% 2.3% 2.5% 2.8% 2.4%
3
31
Re-offending of adults: new measures of re-offending 2000-2005
Appendix D: Data quality statement
Summary The data underpinning the results are felt to be broadly robust. Considerable work has been carried out ensuring data quality, and the data have been used for research publications. Scrutiny of the data source continues in order to ensure the data remains reliable.
Risks to data quality The National Audit Office (NAO) has identified six risk factors in its review of the reporting of PSA targets (NAO, 2005). The following commentary addresses these.
1. Complexity of data collection
The data required for the PSA 23 target involve a range of data sources (prison data, community sentence data, and the criminal records) from a range of agencies (individual prisons and probation areas, and different police forces). These figures have been derived from the police’s administrative I.T. system, which, as with any large scale recording system, is subject to possible errors with data entry and processing. Additionally, the Ministry of Justice copy of the Police National Computer (PNC) is continually being revised as police add and amend information, so figures published in this report are likely to change slightly with time.
2. Complexity of data processing and analysis
The data processing involved for the PSA 23 target is complex, and requires the extraction of criminal histories that can span a number of decades, and the subsequent matching of these histories against the community sentence caseload files and prison discharges in order to generate a statistical model. The components are:
2A. Matching offender records
This process involves matching prison discharges and community sentences commencements data with the Police National Computer database. The process uses automated matching routines that look at offenders’ surnames, initials, and dates of birth, using direct name matching along with a variety of ‘sounds like’ algorithms. The matching algorithm also searches through PNC held information on alias names and dates of birth for offenders. However, not all offenders are matched and a thorough analysis of bias in the matching system has yet to be undertaken. Table D1 below shows that the overall matching rates between 2000 and 2005 have remained high and have been improving slightly. Additionally, matching rates are similar for both prison and community sentences data.
32

Re-offending of adults: new measures of re-offending 2000-2005
Table D1: Matching rates for the different data sources for 2000, 2002, 2003, 2004 and 2005 cohorts
2000 Q1 2002 Q1 2003 Q1 2004 Q1 2005 Q1Prison
Prison discharges 19,164 18,792 17,521 19,384 18,052Automatically matched to the PNC 17,708 17,505 16,276 18,047 16,854
Manually matched to the PNC 559 552 596 597 602Not matched 897 735 649 740 596
Total matches 18,267 18,057 16,872 18,644 17,456Percentage matched 95.3% 96.1% 96.3% 96.2% 96.7%
Community sentencesCommunity sentences starts 36,953 35,193 37,426 38,415 35,875
Automatically matched to the PNC 33,485 32,440 34,798 35,952 33,502Manually matched to the PNC 1,479 1,234 1,289 1,012 1,177
Not matched 1,989 1,519 1,339 1,451 1,196Total matches 34,964 33,674 36,087 36,964 34,679
Percentage matched 94.6% 95.7% 96.4% 96.2% 96.7%
Total percentage matched to PNC 94.9% 95.8% 96.4% 96.2% 96.7%
The total number of matched offenders is substantially higher than the final figure for the cohorts – for example, in 2005 there were 52,135 matched offenders and the final cohort numbers are 44,323. The main reasons for these discrepancies are:
• Conviction dates for the beginning of the community or custodial sentence do not match the conviction date within seven days of the criminal records database (PNC);
• The offence was not dealt with by a Home Office police force – this ensures that only offences in England and Wales are counted;
• Exclusion of all offenders where the index offence is a breach, since we are only interested in new offences; and,
• Exclusion of Multiple Offender Entries (as outlined in Appendix C).
2B. Counting rules
The counting rules for choosing which prison discharges to include offer a variety of choices. For instance, it makes little sense to include offenders deported on release or because they have died. These counting rules were enumerated and discussed to ensure a more accurate and consistent counting.
2C. The extraction of the criminal histories
To quality assure the extraction of criminal histories, a small set of random samples of offenders was taken after the analysis and have shown, via a basic validation, that outputs of the SQL (Structured Query Language) program are accurate outcomes and the Ministry of Justice is confident that this process has been successful.
33
Re-offending of adults: new measures of re-offending 2000-2005
3. Level of subjectivity
There is relatively little subjectivity in the system. Occasional judgements are required (e.g. where to classify an offence) but these will not significantly influence the results.
4. Maturity and stability of the data system
The system is well established having been used several times to produce statistics for publication for the two-year actual and predicted (yes/no) rates. Nonetheless, vigilance continues to be exercised to ensure the validity of the results.
5. Expertise of those who operate the system
Prison and community sentence datafeeds have neither been fully nor recently audited, although work is being undertaken at present and will be implemented at the time of the 2006 data. The internal processing of the results within the Ministry of Justice has been subject to dip sampling of criminal histories and the statistical model has been extensively tested.
6. Use of data to manage and reward performance
The data are not currently used to manage the performance of individuals or teams.
Improvements to the quality of the PNC data held by the Ministry of Justice
During 2007 an internal Ministry of Justice review of the quality of the extract of the PNC data was held which led to a number of improvements, listed below, which have been incorporated in these results:
• Improvements to the coding and classification of offences and court disposals, including the reduction of uncoded offences, the reduction in the use of miscellaneous offence codes and the clarification of the coding of breach offences;
• Improvements to the methods used to identify the primary offence, where several offences are dealt with on the same occasion, and the methods used to identify the primary disposal, where an offence attracts more than one court disposal; and,
• Removal of some duplication of records within the database resulting in improvements to the efficiency and reliability of the matching process.
34

Re-offending of adults: new measures of re-offending 2000-2005
Appendix E: Statistical Modelling
Introduction
The characteristics of offenders are likely to be systematically different over time, and the Criminal Justice System aims to target particular sentences to offenders most likely to benefit most from that type. It is therefore, important to note that one can neither reach firm conclusions about changes in rates over time, nor about the relative effectiveness of different sentence types from actual re-offending rates.
The Ministry of Justice has developed a new predicted (yes/no) rate for the year 2005 in a similar way to the PSA 2000-2006 predicted (yes/no) rate for the year 2000 (Cunliffe, J. and Shepherd, A., 2007). This new 2005 predicted (yes/no) rate can only predict the actual (yes/no) rate and there are currently no predictions of the frequency and severity rates. The 2005 model is presented in this appendix for information only and will be used to assess changes in the composition of the cohort from 2005 onwards, and to produce predicted yes/no rates for future years.
Predicted or expected (yes/no) rates (see Lloyd et al., 1994, for a discussion) are used to take account of some of the differences in characteristics of offenders. Accordingly they can give a more meaningful measure of the change that has occurred in the rate of re-offending than can be obtained using the actual (yes/no) rates. If the composition of the groups of offenders being compared differs significantly over a time period, so that the type of offenders in one year is inherently more (or less) likely to re-offend, this may result in a spurious rise or fall in the actual (yes/no) rates even when there may be no ‘real’ difference for similar offenders over that time. Hence the actual (yes/no) rates should be compared with the expected rates using a model based on data from an earlier year, and changes in re-offending rates measured by comparing the actual rate with the rate that would be expected given this group of offenders.
Statistical model
The 2005 statistical model is an update and improvement on the 2000 logistic regression model and includes a range of offender characteristics available in the Police National Computer (PNC), such as age, gender, offence group and criminal history. However, research has shown that other factors, for which data on these samples are not available, such as drug and alcohol use, employment, accommodation and marital background are likely to be significantly related to re-offending (see, for example, May, 1999).
The logistic regression model behind the 2005 predicted rate provides a probability of re-offending for each offender and identifies the statistically significance set of variables that are related to re-offending. Aggregated predicted (yes/no) rates are also only valid for terms included in the final model. Any predicted rates for groups of offenders that have a common characteristic that is not in the final model (e.g., employment status or
35

Re-offending of adults: new measures of re-offending 2000-2005
disposal type) can suffer from statistical biases and are, therefore, unreliable.
For the 2005 model additional developments were included to ensure that the predicted rate model was a more parsimonious model, more robust against changes in the number of offenders, and that interaction terms and non-linear terms were included where appropriate. The final decision for inclusion or exclusion of particular variables was heavily influence by their statistical significance (typically p < 0.10).
The Ministry of Justice believes that the method used for the construction of the statistical model for producing predicted rates is robust, fit for purpose and it has been peer reviewed by an academic statistician.
Variables included
The following notes provide some further detail on the 2005 model and show the relative impacts of different variables when holding all other variables constant. The coefficients are shown in Appendix F.
Gender
Gender is included in the model as a categorical variable separating out males and females. Generally, males are more likely to re-offend than females.
Age
Age is included in the model as a categorical variable separating offenders into seven age bands. Generally, younger offenders are more likely to re-offend than older offenders.
Index offence
The index offence represents the offence that enables the offender to become part of the cohort. Index offences were classified into 21 broad categories and their relative coefficients are shown in relation to the reference category violence (non serious). To ensure the reliability and replicability of the model coefficients, any index offences with low numbers were grouped with ‘other’ index offence group.
Ethnicity
Ethnicity is derived from the PNC and reflects the officer’s view of the offender’s ethnicity. Thus, ethnicity in this model should be taken as a proxy for the actual ethnicity and the results should not be over-interpreted because any biases in the assessment are unknown. Ethnicity was a statistically significant factor, making it an important factor to control for and therefore it was included in the model.
Copas rate
The Copas rate (Copas and Marshall, 1998) controls for the rate at which an offender has built up convictions throughout their criminal career. The
36

Re-offending of adults: new measures of re-offending 2000-2005
higher the rate, the more convictions an offender has in a given amount of time, and the more likely it is that an offender will re-offend within one year.
The Copas rate formula is:
⎟⎟⎠
⎞⎜⎜⎝
⎛+
+=
10 yearsin career criminal ofLength 1 cautionsor sappearancecourt ofNumber log rate copas e
Length of criminal career
An offender’s criminal career is a significant factor in predicting the likelihood of a re-offence and this relationship is quadratic, thus both a linear and quadratic terms were included in the model.
Total number of previous offences
The total number of previous offences is a significant factor in predicting the likelihood of a re-offence. The previous offending categories counted cautions and convictions.
Previous custodial sentences
The number of previous custodial sentences was implemented as a continuous variable in both linear and quadratic terms.
Counts of previous offending
The number of previous offences was an improvement over simple ‘yes or no’ variables for recording the presence of prior offences in the relevant categories.
Interaction terms
Interaction terms are calculated by multiplying two factors together. The inclusion of these terms ‘tunes’ the effects of the individual factors, improving the quality of predictions. This is important because three factors (gender, age and total number of previous offences) are not completely independent of each other.
Model assessment
The model is assessed by calculating the level of discrimination between the offenders that re-offended and offenders that did not. The 2005 adult logistic regression model achieved a 72.7% overall discrimination level (Table E1). A level of discrimination of about 70% was deemed to be acceptable and the model should predict results accurately enough for the predicted rate to be used. The discrimination can also be evaluated by calculating the Area Under Curve (AUC) for the Receiver Operator Characteristics curve. Again, the value for the 2005 model was 0.80, which means an excellent level of discrimination (Hosmer and Lemeshow, 2000, p.162).
37
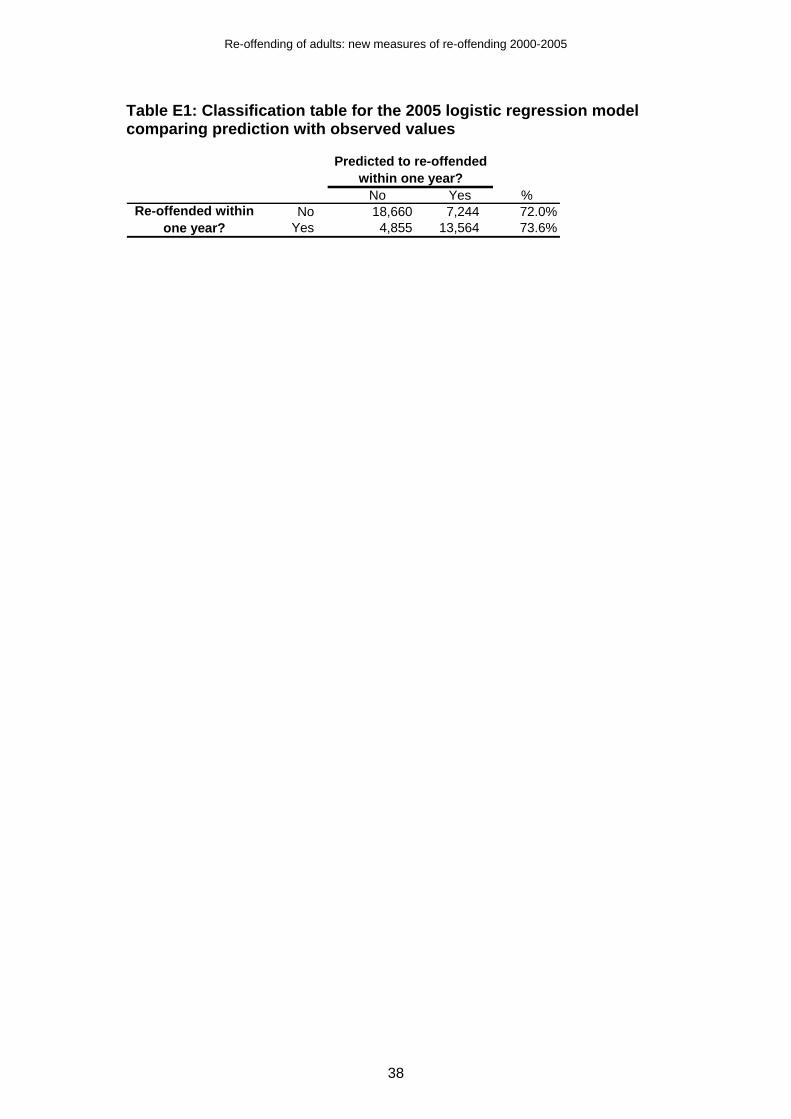
Re-offending of adults: new measures of re-offending 2000-2005
Table E1: Classification table for the 2005 logistic regression model comparing prediction with observed values
No Yes %No 18,660 7,244 72.0%
Yes 4,855 13,564 73.6%
Predicted to re-offended within one year?
Re-offended within one year?
38
Re-offending of adults: new measures of re-offending 2000-2005
Appendix F: Coefficients of the 2005 statistical model
The following table (Table F1) shows the parameter estimates for the various components of the logistic regression model for the predicted one-year re-offending rates.
Each logistic coefficient is multiplied by the variable value for each offender to calculate a linear prediction. To calculate each offender’s predicted probability of re-offending after one year we transform the linear prediction Z using the following formula:
)exp(1)exp(offending-Re ofy Probabilit PredictedZ
Z+
=
The exponent of the coefficient is the odds ratio of re-offending corresponding to the particular coefficient and enables us to make comparisons between different categories. For example, an offender with a theft index offence is 2.15 times more likely to re-offend within one year than an offender with a violence (non serious) index offence. For factors with interactions (e.g. age and gender) the interpretation is more complex.
The significance (p-value) gives us an assessment of how significant each variable is in predicting the likelihood of an offender to re-offend within one year. For modelling purposes, a probability value (p-value) of less than 0.05 is considered to be significant.
39

Re-offending of adults: new measures of re-offending 2000-2005
Table F1: List of variables in the logistic regression model applied to the 1st quarter 2005 data and their respective coefficients
Logistic Exponent of Logistic Exponent ofCoefficient Coefficient Coefficient Coefficient
Constant 0.649 1.913 < 0.001 General Criminal Career VariablesCopas Rate 1.095 2.989 < 0.001Length of criminal career (Linear) 0.039 1.039 0.133
Female Length of criminal career (Squared) -0.047 0.954 < 0.001Male 0.501 1.651 < 0.001 Total Number of Previous Offences -0.005 0.995 0.035
18-2021-24 -0.168 0.845 0.12925-29 -0.179 0.836 0.10630-34 -0.247 0.781 0.03335-39 -0.405 0.667 0.00140-49 -0.634 0.531 < 0.00150+ -0.675 0.509 0.006
Violence (non serious)Violence (serious) -0.748 0.473 < 0.001Robbery -0.568 0.567 < 0.001Public order -0.245 0.783 < 0.001Sexual -0.063 0.939 0.672Sexual (child) -0.726 0.484 < 0.001Domestic burglary 0.195 1.216 0.001Other burglary 0.432 1.540 < 0.001Theft 0.765 2.150 < 0.001Handling 0.406 1.500 < 0.001Fraud and forgery 0.060 1.062 0.363Absconding and bail 0.516 1.675 < 0.001Taking and driving away 0.337 1.401 < 0.001Theft from vehicles 0.645 1.907 < 0.001
Interaction between Age and GenderDrink driving -0.349 0.705 < 0.001 Females at any ageCriminal and malicious damage 0.201 1.223 0.001 Male and aged 18-20
Male and aged 21-24 -0.399 0.671 0.001Male and aged 25-29 -0.560 0.571 < 0.001Male and aged 30-34 -0.618 0.539 < 0.001Male and aged 35-39 -0.455 0.634 0.001
Other1 0.103 1.109 0.195 Male and aged 40-49 -0.268 0.765 0.057Male and aged 50+ -0.321 0.725 0.215
EthnicityWhite Interaction between Gender and Total Number of Previous OffencesNot Recorded -0.435 0.648 < 0.001 FemaleBlack 0.135 1.144 0.002 Male -0.004 0.996 0.021Asian 0.056 1.057 0.321Other 0.340 1.404 0.012
1 Includes other, soliciting and prostitution and offence not recorded
< 0.001
1.021 0.003
Total number of previous drugs (possession/small-scale supply) offences
0.016 1.017 0.016
0.009 1.009 0.001
0.057
Total number of previous criminal and malicious damage offences
Drugs (import/export/ production/supply) -0.749 0.473 < 0.001
Reference CategoryReference Category
0.021
Total number of previous other1
offences-0.006 0.994
Total number of previous absconding and bail offences 0.038
Drugs (possession/ small-scale supply) -0.015 0.985 0.798
Reference Category
Total Number of previous custodial sentences (Linear) 0.284 1.328 < 0.001
1.020 0.001
Total Number of previous custodial sentences (Squared) -0.009 0.991
0.145 1.156 < 0.001
0.044
0.045
1.039
0.910-0.094
< 0.001
0.012 1.012
Variables Significance Variables Significance
1.045 0.083
1.046
Motoring offences (not including drink driving)
Total number of previous violence (non serious) offences
GenderReference Category
AgeReference Category
Index Offence TypeReference Category
Total number of previous motoring offences
Reference Category
Total number of previous sexual (child) offences
Total number of previous theft offences
< 0.001
Total number of previous violence (serious) offences
Total number of previous public order offences
0.001
0.001
0.020
40

Re-offending of adults: new measures of re-offending 2000-2005
Appendix G: List of most serious (severe) offences
Violence against the person
1. Murder: 1. Of persons aged 1 year or over. 2. Of infants under 1 year of age.
2. Attempted murder. 4. Manslaughter, etc:
1. Manslaughter. 2. Infanticide. 3. Child destruction.
5. Wounding or other act endangering life:
1. Wounding, etc. with intent to do grievous bodily harm, etc. or to resist apprehension.
2. Shooting at naval or revenue vessels. 4. Attempting to choke, suffocate, etc. with intent to commit an indictable offence
(garrotting). 5. Using chloroform, etc. to commit or assist in committing an indictable offence. 6. Burning, maiming, etc. by explosion. 7. Causing explosions or casting corrosive fluids with intent to do grievous bodily
harm. 8. Impeding the saving of life from shipwreck. 9. Placing, etc. explosives in or near ships or buildings with intent to do bodily
harm, etc. 10. Endangering life or causing harm by administering poison. 11. Causing danger by causing anything to be on road, interfering with a vehicle or
traffic equipment. 13. Possession, etc. of explosives with intent to endanger life. 14. Possession of firearms, etc. with intent to endanger life or injure property, etc.
(Group I). 15. Possession of firearms, etc. with intent to endanger life or injure property, etc.
(Group II). 16. Possession of firearms, etc. with intent to endanger life or injure property, etc.
(Group III). 17. Using, etc. firearms or imitation firearms with intent to resist arrest, etc. (Group
I). 18. Using, etc. firearms or imitation firearms with intent to resist arrest, etc. (Group
II). 19. Using, etc. firearms or imitation firearms with intent to resist arrest, etc. (Group
III). [Group I - Firearms, etc. other than as described in Group II or III. Group II - Shotguns as defined in s.1 (3)(a) of the Firearms Act 1968. Group III - Air weapons as defined in s.1 (3)(b) of the Firearms Act 1968] 20. Use etc. of chemical weapons. 21. Use of premises or equipment for producing chemical weapons. 22. Use, threat to use, production or possession of a nuclear weapon. 23. Weapons related acts overseas. 24. Use of noxious substances or things to cause harm or intimidate. 25. Performing an aviation function or ancillary function when ability to carry out
function is impaired because of drink or drugs. 26. Endangering safety at sea/aerodromes. 27. Torture.
8. Other wounding, etc: 1. Wounding or inflicting grievous bodily harm (inflicting bodily injury with or without
weapon).
41

Re-offending of adults: new measures of re-offending 2000-2005
33. Racially aggravated wounding or inflicting grievous bodily harm (inflicting bodily injury with or without weapon).
40. Religiously aggravated malicious wounding or GBH. 46. Racially or religiously aggravated malicious wounding or grievous bodily harm.
Sexual offences
17. Sexual assault on a male (previously indecent assault on a male): 11. Indecent assault on male person under 16 years. 12. Indecent assault on male person 16 years or over. 13. Assault on a male by penetration. 14. Assault of a male child under 13 by penetration. 15. Sexual assault on a male. 16. Sexual assault of a male child under 13.
19. Rape:
2. Man having unlawful sexual intercourse with a woman who is a defective. 3. Male member of staff of hospital or mental nursing home having unlawful sexual
intercourse with female patient. 4. Man having unlawful sexual intercourse with mentally disordered female patient
who is subject to his care. 7. Rape of a female aged under 16. 8. Rape of a female aged 16 or over. 9. Rape of a male aged under 16. 10. Rape of a male aged 16 or over. 11. Attempted rape of a female aged under 16. 12. Attempted rape of a female aged 16 or over. 13. Attempted rape of a male aged under 16. 14. Attempted rape of a male aged 16 or over. 16. Rape of female child under 13 by a male. 17. Rape of a male child under 13 by a male. 18. Attempted rape of a female child under 13 by a male 19. Attempted rape of a male child under 13 by a male
20. Sexual assault on female (previously indecent assault on a female):
1. On females under 16 years of age. 2. On females aged 16 years and over. 3. Assault on a female by penetration. 4. Assault on a female child under 13 by penetration. 5. Sexual assault on a female. 6. Sexual assault on a female child under 13.
21. Sexual activity (male and female) (including with a child under 13) (previously unlawful intercourse with a girl under 13):
2. Causing or inciting a female child under 13 to engage in sexual activity - penetration.
3. Causing or inciting a female child under 13 to engage in sexual activity - no penetration.
4. Causing or inciting a male child under 13 to engage in sexual activity - penetration
5. Causing or inciting a male child under 13 to engage in sexual activity - no penetration.
6. Sexual activity with a female child under 13 - offender aged 18 or over - penetration.
7. Sexual activity with a male child under 13 - offender aged 18 or over - penetration.
8. Causing or inciting a female child under 13 to engage in sexual activity - offender aged 18 or over - penetration
9. Causing or inciting a male child under 13 to engage in sexual activity - offender aged 18 or over - penetration.
10. Engaging in sexual activity in the presence of a child under 13 (offender aged 18 or over).
42
Re-offending of adults: new measures of re-offending 2000-2005
11. Causing a child under 13 to watch a sexual act (offender aged 18 or over). 18. Sexual activity with a female under 13 - offender aged 18 or over - no
penetration. 19. Sexual activity with a male child under 13 - offender aged 18 or over - no
penetration. 20. Causing or inciting a female child under 13 to engage in sexual activity -
offender aged 18 or over - no penetration. 21. Causing or inciting a male child under 13 to engage in sexual activity - offender
aged 18 or over - no penetration. 22. Sexual activity with a female child under 13 - offender aged under 18 - no
penetration. 23. Sexual activity with a male child under 13 - offender aged under 18 - no
penetration. 24. Causing or inciting a female child under 13 to engage in sexual activity -
offender aged under 18 - no penetration. 25. Causing or inciting a male child under 13 to engage in sexual activity - offender
aged under 18 - no penetration. 22. Sexual activity (male and female) (including with a child under 16) (previously unlawful
sexual intercourse with a girl under 16): 0. Unlawful sexual intercourse with girl under 16 (offences committed prior to 1
May 2004). 2. Causing a female person to engage in sexual activity without consent -
penetration 3. Causing a male person to engage in sexual activity without consent -
penetration 4. Causing a female person to engage in sexual activity without consent - no
penetration. 5. Causing a male person to engage in sexual activity without consent - no
penetration. 6. Sexual activity with a female child under 16 (offender aged 18 or over) -
penetration 7. Sexual activity with a male child under 16 (offender aged 18 or over) -
penetration 8. Causing or inciting a female child under 16 to engage in sexual activity (offender
aged 18 or over) - penetration 9. Causing of inciting a male child under 16 to engage in sexual activity (offender
aged 18 or over) - penetration 10. Engaging in sexual activity in the presence of a child under 16 (offender aged
18 or over). 11. Causing a child under 16 to watch a sexual act (offender aged 18 or over). 12. Sexual activity with a female child under 16 (offender aged under 18). 13. Sexual activity with a male child under 16 (offender aged under 18). 14. Causing or inciting a female child under 16 to engage in sexual activity (offender
aged under 18). 15. Causing or inciting a male child under 16 to engage in sexual activity (offender
aged under 18). 16. Engaging in sexual activity in the presence of a child under 16 (offender aged
under 18). 17. Causing a child under 16 to watch a sexual act (offender aged under 18). 18. Sexual activity with a female child under 16 - offender aged 18 or over - no
penetration. 19. Sexual activity with a male child under 16 - offender aged 18 or over - no
penetration. 20. Causing or inciting a female child under 16 to engage in sexual activity (offender
aged 18 or over) - no penetration. 21. Causing or inciting a male child under 16 to engage in sexual activity (offender
aged 18 or over) - no penetration. 70. Sexual activity etc. with a person with a mental disorder:
1. Sexual activity with a male person with a mental disorder impeding choice – penetration.
43
Re-offending of adults: new measures of re-offending 2000-2005
2. Sexual activity with a female person with a mental disorder impeding choice – penetration.
3. Sexual activity with a male person with a mental disorder impeding choice - no penetration.
4. Sexual activity with a female person with a mental disorder impeding choice - no penetration.
5. Causing or inciting a male person with a mental disorder impeding choice to engage in sexual activity – penetration.
6. Causing or inciting a female person with a mental disorder impeding choice to engage in sexual activity – penetration.
7. Causing or inciting a male person with a mental disorder impeding choice to engage in sexual activity – penetration.
8. Causing or inciting a female person with a mental disorder impeding choice to engage in sexual activity - no penetration.
9. Engaging in sexual activity in the presence of a person with a mental disorder impeding choice.
10. Causing a person with a mental disorder impeding choice to watch a sexual act. 11. Inducement, threat or deception to procure sexual activity with a person with a
mental disorder – penetration. 12. Inducement, threat or deception to procure sexual activity with a person with a
mental disorder - no penetration. 13. Causing a person with a mental disorder to engage in sexual activity by
inducement, threat or deception - penetration. 14. Causing a person with a mental disorder to engage in sexual activity by
inducement, threat or deception - no penetration. 15. Engaging in sexual activity in the presence, procured by inducement, threat or
deception, of a person with a mental disorder. 16. Causing a person with a mental disorder to watch a sexual act by inducement,
threat or deception. 17. Care workers: Sexual activity with a male person with a mental disorder -
penetration. 18. Care workers: Sexual activity with a female person with a mental disorder -
penetration. 19. Care workers: Sexual activity with a male person with a mental disorder - no
penetration. 20. Care workers: Sexual activity with a female person with a mental disorder - no
penetration. 21. Care workers: Causing or inciting sexual activity (person with a mental disorder)
- penetration. 22. Care workers: Causing or inciting sexual activity (person with a mental disorder)
- no penetration. 23. Care workers: Sexual activity in the presence of a person with a mental
disorder. 24. Care workers: Causing a person with a mental disorder impeding choice to
watch a sexual act. 71. Abuse of children through prostitution and pornography (previously child prostitution
and pornography): 1. Arranging or facilitating the commission of a child sex offence. 2. Paying for sex with a female child under 13 - penetration 3. Paying for sex with a male child under 13 - penetration 4. Paying for sex with a female child under 16 - no penetration 5. Paying for sex with a male child under 16 - no penetration 6. Paying for sex with a female child aged 16 or 17. 7. Paying for sex with a male child aged 16 or 17. 8. Causing or inciting child prostitution or pornography - child aged 13-17. 9. Controlling a child prostitute or a child involved in pornography - child aged 13-
17. 10. Arranging or facilitating child prostitution or pornography - child aged 13-17. 11. Causing or inciting child prostitution or pornography - child under 13. 12. Controlling a child prostitute or child involved in pornography - child under 13. 13. Arranging or facilitating child prostitution or pornography - child under 13.
44
Re-offending of adults: new measures of re-offending 2000-2005
14. Paying for sex with a female child aged under 16 - penetration 15. Paying for sex with a male child aged under 16 - penetration
72. Trafficking for sexual exploitation:
1. Arranging or facilitating arrival of a person into the UK for sexual exploitation (trafficking).
2. Arranging or facilitating travel of a person within the UK for sexual exploitation (trafficking).
3. Arranging or facilitating departure of a person from the UK for sexual exploitation (trafficking).
Taking and driving away and related offences
37. Aggravated vehicle taking: 1. Where, owing to the driving of the vehicle, an accident occurs causing the death
of any person.
Other motoring offences
4. Manslaughter, etc: 4. Causing death by dangerous driving. 8. (Offences) Causing death by careless or inconsiderate driving (Offences due to
commence in Autumn 2007).
Drink driving offences
4. Manslaughter, etc: 6. Causing death by careless driving when under the influence of drink or drugs.
45

Re-offending of adults: new measures of re-offending 2000-2005
Appendix H: References
Copas, J. and Marshall, P. (1998) The offender group re-offending scale: A statistical reoffending score for use by probation officers. Applied Statistics 47(1); 159-171
Hosmer, D. and Lemeshow S. (2000) Applied Logistic Regression (2nd Ed). John Wiley & Sons: New York
Lloyd, C., Mair, G. and Hough, M. (1994) Explaining re-offending rates: a critical analysis. Home Office Research Study 136. London: Home Office
May, C. (1999) Explaining reconviction following a community sentence: the role of social factors. Home Office Research Study 192. London: Home Office.
National Audit Office (2005) Public Service Agreements: Managing Data Quality – Compendium Report. Available on online at: http://www.nao.org.uk/pn/04-05/0405476.htm
Taylor, R. (1999) Predicting reconvictions for sexual and violent offences using the revised offender group reconviction scale. Home Office Research Findings 104. London: Home Office
Links to previous adult re-offending publications
Cunliffe, J. and Shepherd, A. (2007) Re-offending of adults: results from the 2004 cohort
Shepherd, A. and Whiting, E. (2006) Re-offending of adults: results from the 2003 cohort
Cuppleditch, L. and Evans, W. (2005) Re-offending of adults: results from the 2002 cohort
46

Re-offending of adults: new measures of re-offending 2000-2005
Appendix I: PSA 2000-2006 – 2005 cohort results
Introduction The 2000-2006 Public Service Agreement (PSA) headline measure was agreed as part of the Government Spending Review 2002 and set a target to reduce re-offending by five per cent by 2006, from the 2000 baseline.
Results For the baseline cohort (2000), the actual proven two-year re-offending rate was 57.6%. Re-offending means that the offender committed an offence within the two-year follow-up period and subsequently received a conviction in court. In 2005, the actual proven re-offending rate was 53.2%, a decrease of 4.4 percentage points since 2000.
Actual proven rates are not used in isolation for the PSA 2000-2006 target. Instead predicted rates are used to take into account the differences between cohorts of offenders. In 2005 the cohort of offenders was slightly less likely to re-offend than those in the baseline year. This resulted in a predicted rate of 57.5%. The predicted re-offending rate is higher than the actual rate and indicates a reduction in proven re-offending of 7.4% against the 2000 baseline. The Ministry of Justice is on target to deliver a reduction of at least 5% between the 2000 and 2006 cohorts. The full results to date for the PSA 2000-2006 are summarised in the table below.
Table I1: Overall re-offending rates against the PSA target to reduce re-offending by 5% by the 2006 cohort, 2000, 2002, 2003, 2004 and 2005 cohorts
Year Actual two-year (yes/no) re-offending rate
2000 Predicted two-year (yes/no) re-offending rate
Progress against the target
2000 Q1 57.6% 57.6% 0.0%2002 Q1 58.5% 58.6% -0.2%2003 Q1 57.6% 58.9% -2.3%2004 Q1 55.5% 58.8% -5.8%2005 Q1 53.2% 57.5% -7.4%
The final year for this PSA 2000-2006 will be the 2006 cohort. This will be published in March 2009. The new measures of re-offending for PSA 2005-2011 will focus only on one-year re-offending measures.
Statistical tables All statistical tables for the 2005 results of PSA 2000-2006 are available at the Ministry of Justice website.
47

Re-offending of adults: new measures of re-offending 2000-2005
Explanatory notes
This is a National Statistics publication produced by the Ministry of Justice. National Statistics are produced to high professional standards set out in the National Statistics Code of Practice. They undergo regular quality assurance reviews to ensure that they meet customer needs. They are produced free from any political interference.
Symbols and conventions
Figures in the text have not been rounded, whilst percentages have been rounded to one decimal place.
The following symbols have been used throughout the tables in this bulletin:
Italics = Treat data with caution * = Data removed as data is unreliable for interpretation.
Contact points for further information
Current and previous editions of this publication are available for download at www.justice.gov.uk/publications/reoffendingofadults.htm.
Spreadsheet files of the tables and graphs contained in this document are also available for download from this address.
Press enquiries should be directed to the Ministry of Justice press office:
Paul Shaw Tel: 020 7210 8724 Email: [email protected]
Other enquiries about these statistics should be directed to:
Miguel Gonçalves SE Quarter, 2nd Floor Fry Building 2 Marsham Street London SW1P 4DF Tel: 020 7035 3466 Email: [email protected]
General enquiries about the statistical work of the Ministry of Justice can be e-mailed to: [email protected]
Other National Statistics publications, and general information about the official statistics system of the UK, are available from www.statistics.gov.uk
48

Re-offending of adults: new measures of re-offending 2000-2005
© Crown copyright Produced by the Ministry of Justice
Alternative formats are available on request from [email protected]
49