Embed Size (px)
Citation preview
PricewaterhouseCoopers LLP, One North Wacker, Chicago, IL 60606T: (312) 298 2000, www.pwc.com/us
February 20, 2013
Mr. M. Steve YoakumExecutive DirectorPSRS and PEERS of Missouri3210 West Truman Blvd.Jefferson City, MO 65109
Re: Public School Retirement System of MissouriCost Estimate of Proposed Benefit Changes
Dear Steve:
This letter has been prepared pursuant to the engagement letter dated October 27, 2008, betweenPricewaterhouseCoopers LLP ("PwC") and the Public SchoolSystems of Missouri ("PSRS and PEERS of Missouri").June 30, 2012 of the following proposed benefit change to
Permanent extension of theof any age to retire after 25 years of service with a reduced benefit.
We estimate that this change would result in a decrease to the Actuarial Accrued Liabilapproximately $78.1 million, whichAnnual Required Contribution percentage by 0.21%.analysis, as follows:
Exhibit I – Summary impact on the Annual Required Exhibit II – Detailed impact to the Funded Status and Annual Required Contribution Exhibit III – Summary impact of assumption changes since prior analysis Exhibit IV – Detail of retirement assumption used in prior analysis Exhibit V – Detail of retirement assumption used in current analysis Exhibit VI – Detail of individual salary growth assumption used in prior and current analysis Exhibit VII – Description of all actuarial assumptions and methods used in our analysis Exhibit VIII – Disclosures relating to our analysis
When a member has 25 years of service,benefits under the "Rule of 80". At mostrequirement for unreduced benefits
For members with 25 years of service or moreimmediately after 25 years of service islater by delaying retirement until the member meets the requirements of the Rule of 80 or 30 & Out.advantages of retiring at 25 years of service are that the member receives pension benefits for a longer periodof time, the COLA starts earlier, and the member no longer contributes to the system. The disadvantagethat the member gives up future increases in their pension benefit due to service and salary increases, as wellas improved subsidy, which can be significant as the member& Out. Whether the 25 & Out reduced benefit is more or less valdepends on how soon after earning 25 years of service the member would be eligible for an unreduced bene
PricewaterhouseCoopers LLP, One North Wacker, Chicago, IL 60606T: (312) 298 2000, www.pwc.com/us
Public School Retirement System of Missouri ("PSRS")Cost Estimate of Proposed Benefit Changes
ursuant to the engagement letter dated October 27, 2008, between("PwC") and the Public School and Public Education Employee
and PEERS of Missouri"). As requested, we have estimatedproposed benefit change to PSRS of Missouri:
Permanent extension of the "25 & Out" Early Retirement Benefit which allows membersto retire after 25 years of service with a reduced benefit.
this change would result in a decrease to the Actuarial Accrued Liabilhich increases the funded ratio of the system by 0.18%, and
Annual Required Contribution percentage by 0.21%. Enclosed are several exhibits presenting the results of our
Summary impact on the Annual Required ContributionDetailed impact to the Funded Status and Annual Required ContributionSummary impact of assumption changes since prior analysisDetail of retirement assumption used in prior analysis
f retirement assumption used in current analysisDetail of individual salary growth assumption used in prior and current analysisDescription of all actuarial assumptions and methods used in our analysis
s relating to our analysis
a member has 25 years of service, the member is at or near the eligibility threshold for unreducedbenefits under the "Rule of 80". At most, members are five years away from meeting the eligibility
benefits under the "30 & Out" benefit.
with 25 years of service or more, the actuarial present value of a reduced benefit commencingimmediately after 25 years of service is nearly the same as the value of an unreduced benefitlater by delaying retirement until the member meets the requirements of the Rule of 80 or 30 & Out.advantages of retiring at 25 years of service are that the member receives pension benefits for a longer period
earlier, and the member no longer contributes to the system. The disadvantagethat the member gives up future increases in their pension benefit due to service and salary increases, as wellas improved subsidy, which can be significant as the member approaches eligibility for the Rule of 80 and 30
Whether the 25 & Out reduced benefit is more or less valuable than a deferred unreduced benefitdepends on how soon after earning 25 years of service the member would be eligible for an unreduced bene
ursuant to the engagement letter dated October 27, 2008, betweenEmployee Retirement
As requested, we have estimated the cost impact as of
Early Retirement Benefit which allows membersto retire after 25 years of service with a reduced benefit.
this change would result in a decrease to the Actuarial Accrued Liability ("AAL") ofof the system by 0.18%, and would reduce the
exhibits presenting the results of our
Detailed impact to the Funded Status and Annual Required Contribution
Detail of individual salary growth assumption used in prior and current analysisDescription of all actuarial assumptions and methods used in our analysis
at or near the eligibility threshold for unreducedmeeting the eligibility
the actuarial present value of a reduced benefit commencinghe value of an unreduced benefit taken sometime
later by delaying retirement until the member meets the requirements of the Rule of 80 or 30 & Out. Theadvantages of retiring at 25 years of service are that the member receives pension benefits for a longer period
earlier, and the member no longer contributes to the system. The disadvantages arethat the member gives up future increases in their pension benefit due to service and salary increases, as well
approaches eligibility for the Rule of 80 and 30a deferred unreduced benefit
depends on how soon after earning 25 years of service the member would be eligible for an unreduced benefit.
As such, the results of our analysis are driven by the demographics of the current member population and bythe retirement assumption.
The experience study completed in 201125 & Out reduced benefit when eligible25 & Out reduced benefit when eligible. If the benefit is made available to members permanently, the same 5%assumption would apply in future years. See Eassumption and given the demographics of the active member population as of June 30, 2012, permanentextension of the 25 & Out benefit is expected to be a small cost savings.
In addition, please note the following when reviewing the results:
Our analysis was performed by measuring the impact of the change at June 30, 2012, using censusdata collected from PSRSincorporate the impact of future employees who may become members of PSRS.actuarial valuation report dated October 19, 2012 for a summary of the census data.
The BASELINE results shown in Exhibit I are equal thsystem.
Our analysis was performed based on our understanding of the current Pforth in Chapter 169 of the Missouri Revised Statutesaffect the change described above.
Our analysis does not include any additional administrative cMissouri to implement this change.
Our analysis is based on the specific assumptions disclosed herein.dependent on those assumptions. The actual cost of the proposed benefit change will depend on theactual future experience of plan members.
To the best of our knowledge this actuarial statement is complete and accurate and hasaccordance with generally accepted actuarial principles and practice and with the Actuarial Standards ofPractice issued by the Actuarial Standards Board. In ourunderstanding of the requirements of MissouriSociety of Actuaries and other professional organizations, including the American Academy of Actuaries, andmeet the Qualification Standards for Actuaries Issuing Statements of Actuarirelating to pension plans. There is noand PSRS and PEERS of Missouri
This document was not intended or written to be ufederal, state, or local tax penalties. This includes penalties that may apply if the transaction that is the subjectof this document is found to lack economic substancedocument has been prepared pursuant to an engagement letter betweenPwC, and is intended solely for the use and benefits of PSRS and PEERS of Missouriany other person.
Please call with any questions or if you require additional information.
2
As such, the results of our analysis are driven by the demographics of the current member population and by
he experience study completed in 2011 showed that a small percentage of members have elected to take thewhen eligible. The current assumption is that 5% of members will retire and elect thewhen eligible. If the benefit is made available to members permanently, the same 5%
assumption would apply in future years. See Exhibit III for details of the retirement assumption.assumption and given the demographics of the active member population as of June 30, 2012, permanentextension of the 25 & Out benefit is expected to be a small cost savings.
lease note the following when reviewing the results:
Our analysis was performed by measuring the impact of the change at June 30, 2012, using censusPSRS and PEERS of Missouri as of June 30, 2012. Our estimates do not
incorporate the impact of future employees who may become members of PSRS.actuarial valuation report dated October 19, 2012 for a summary of the census data.
The BASELINE results shown in Exhibit I are equal the results of our June 30, 2012 valuation of the
Our analysis was performed based on our understanding of the current PSRSin Chapter 169 of the Missouri Revised Statutes, as well as the modification to those statute
ffect the change described above.
Our analysis does not include any additional administrative cost that may be incurred byto implement this change.
Our analysis is based on the specific assumptions disclosed herein. The result ofdependent on those assumptions. The actual cost of the proposed benefit change will depend on theactual future experience of plan members.
To the best of our knowledge this actuarial statement is complete and accurate and hasaccepted actuarial principles and practice and with the Actuarial Standards of
Practice issued by the Actuarial Standards Board. In our opinion, our calculations also comply with ournts of Missouri state law. The undersigned actuaries are
Society of Actuaries and other professional organizations, including the American Academy of Actuaries, andQualification Standards for Actuaries Issuing Statements of Actuarial Opinion in the United States
relating to pension plans. There is no relationship between the PwC practitioners involand PSRS and PEERS of Missouri that may impair our objectivity.
This document was not intended or written to be used, and it cannot be used, for the purpose of avoiding U.S.penalties. This includes penalties that may apply if the transaction that is the subject
of this document is found to lack economic substance or fails to satisfy any other similar rule of law. Thisdocument has been prepared pursuant to an engagement letter between PSRS and PEERS of Missouri
or the use and benefits of PSRS and PEERS of Missouri and not for reliance by
Please call with any questions or if you require additional information.
As such, the results of our analysis are driven by the demographics of the current member population and by
members have elected to take thethat 5% of members will retire and elect the
when eligible. If the benefit is made available to members permanently, the same 5%xhibit III for details of the retirement assumption. Based on this
assumption and given the demographics of the active member population as of June 30, 2012, permanent
Our analysis was performed by measuring the impact of the change at June 30, 2012, using censusOur estimates do not
incorporate the impact of future employees who may become members of PSRS. Please refer to ouractuarial valuation report dated October 19, 2012 for a summary of the census data.
e results of our June 30, 2012 valuation of the
benefit provisions as setfication to those statutes to
ost that may be incurred by PSRS of
The result of our analysis is heavilydependent on those assumptions. The actual cost of the proposed benefit change will depend on the
To the best of our knowledge this actuarial statement is complete and accurate and has been prepared inaccepted actuarial principles and practice and with the Actuarial Standards of
opinion, our calculations also comply with ourstate law. The undersigned actuaries are members of the
Society of Actuaries and other professional organizations, including the American Academy of Actuaries, andal Opinion in the United States
relationship between the PwC practitioners involved in this engagement
sed, and it cannot be used, for the purpose of avoiding U.S.penalties. This includes penalties that may apply if the transaction that is the subject
other similar rule of law. ThisPSRS and PEERS of Missouri and
and not for reliance by
Sincerely,
Sheldon A. Gamzon, FSA, MAAA
3
Brandon Robertson, ASA, MAAABrandon Robertson, ASA, MAAA

Public School Retirement System of Missouri Exhibit I
Permanent Extension of 25 & Out Early Retirement Benefit
Summary Cost Analysis as of June 30, 2012
BASELINEPermanent
Extension of the25 & Out Benefit
Annual Required Contribution
Normal Cost Rate 19.03% 18.93%
Unfunded Actuarial Accrued Liability Amortization Rate 9.17% 9.06%
Annual Required Contribution Rate 28.20% 27.99%
Change in Annual Required Contribution Rate -0.21%
PwC 4 February 20, 2013

Public School Retirement System of Missouri Exhibit IIPermanent Extension of 25 & Out Early Retirement Benefit
Cost Analysis as of June 30, 2012
BASELINEPermanent Extension of
the 25 & Out Benefit
Funded Status
Actuarial Accrued Liability ("AAL")
Active Members 13,864,695,798 13,786,554,794State Members 11,398,812 11,398,812Inactive Members 520,903,729 520,903,729Pay Status Members 21,191,032,300 21,191,032,300Total Actuarial Accrued Liability ("AAL") $35,588,030,639 $35,509,889,635
% Change -0.22%
Actuarial Value of Assets ("AVA") 29,013,002,242 29,013,002,242
Unfunded Actuarial Accrued Liability (AAL - AVA) $6,575,028,397 $6,496,887,393
Funded Percentage (AVA / AAL) 81.52% 81.70%Change in Funded Percentage 0.18%
Annual Required Contribution
Expected Payroll $4,379,059,546 $4,379,059,546
Normal CostActive Members $785,187,462 $781,389,559State Members 206,285 206,285Total Normal Cost $785,393,747 $781,595,844
Total Normal Cost With 2% Service Purchase Load $801,101,622 $797,227,761Normal Cost Rate 19.03% 18.93%
Unfunded Actuarial Accrued Liability Amortization $385,941,641 $381,426,292Unfunded Actuarial Accrued Liability Amortization Rate 9.17% 9.06%
Annual Required Contribution $1,187,043,263 $1,178,654,053Annual Required Contribution Rate 28.20% 27.99%Change in Annual Required Contribution Rate -0.21%
PwC 5 February 20, 2013
Public School Retirement System of Missouri Exhibit IIIPermanent Extension of 25 & Out Early Retirement Benefit
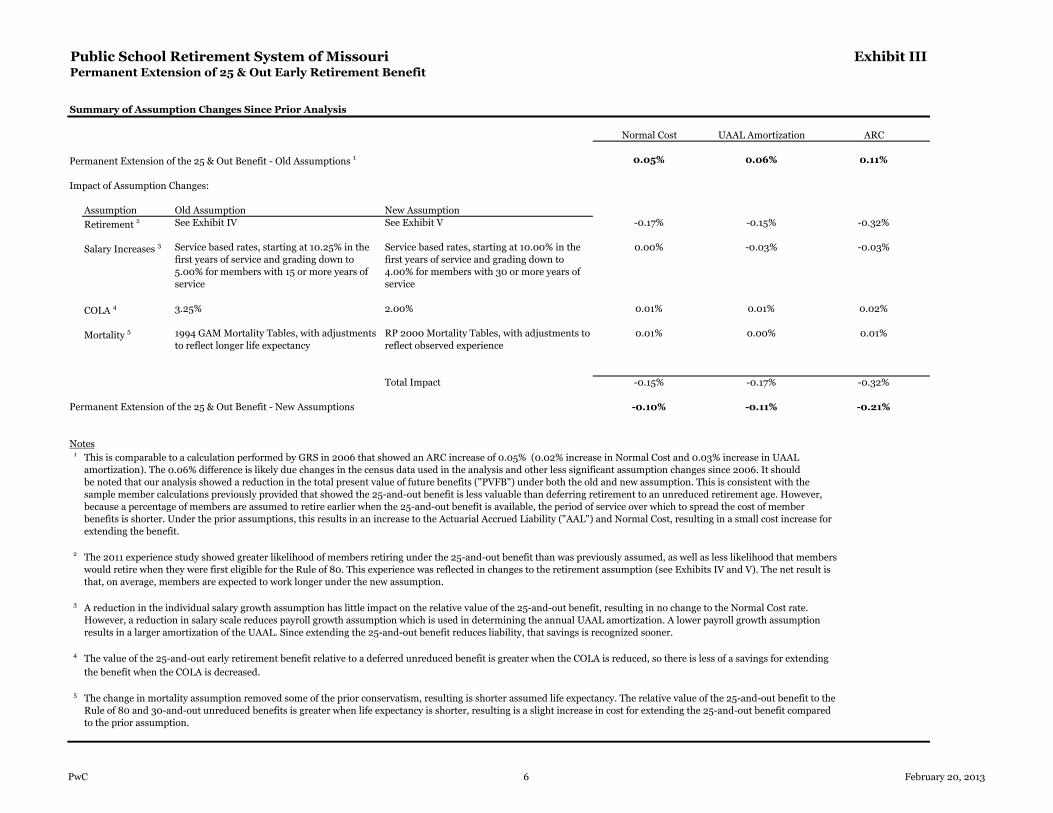
Summary of Assumption Changes Since Prior Analysis
Normal Cost UAAL Amortization ARC
Permanent Extension of the 25 & Out Benefit - Old Assumptions 1 0.05% 0.06% 0.11%
Impact of Assumption Changes:
Assumption Old Assumption New Assumption
Retirement 2 See Exhibit IV See Exhibit V -0.17% -0.15% -0.32%
Salary Increases 3 Service based rates, starting at 10.25% in thefirst years of service and grading down to5.00% for members with 15 or more years ofservice
Service based rates, starting at 10.00% in thefirst years of service and grading down to4.00% for members with 30 or more years ofservice
0.00% -0.03% -0.03%
COLA 4 3.25% 2.00% 0.01% 0.01% 0.02%
Mortality 5 1994 GAM Mortality Tables, with adjustmentsto reflect longer life expectancy
RP 2000 Mortality Tables, with adjustments toreflect observed experience
0.01% 0.00% 0.01%
Total Impact -0.15% -0.17% -0.32%
Permanent Extension of the 25 & Out Benefit - New Assumptions -0.10% -0.11% -0.21%
Notes1 This is comparable to a calculation performed by GRS in 2006 that showed an ARC increase of 0.05% (0.02% increase in Normal Cost and 0.03% increase in UAAL
amortization). The 0.06% difference is likely due changes in the census data used in the analysis and other less significant assumption changes since 2006. It shouldbe noted that our analysis showed a reduction in the total present value of future benefits ("PVFB") under both the old and new assumption. This is consistent with thesample member calculations previously provided that showed the 25-and-out benefit is less valuable than deferring retirement to an unreduced retirement age. However,because a percentage of members are assumed to retire earlier when the 25-and-out benefit is available, the period of service over which to spread the cost of memberbenefits is shorter. Under the prior assumptions, this results in an increase to the Actuarial Accrued Liability ("AAL") and Normal Cost, resulting in a small cost increase forextending the benefit.
2 The 2011 experience study showed greater likelihood of members retiring under the 25-and-out benefit than was previously assumed, as well as less likelihood that memberswould retire when they were first eligible for the Rule of 80. This experience was reflected in changes to the retirement assumption (see Exhibits IV and V). The net result isthat, on average, members are expected to work longer under the new assumption.
3 A reduction in the individual salary growth assumption has little impact on the relative value of the 25-and-out benefit, resulting in no change to the Normal Cost rate.However, a reduction in salary scale reduces payroll growth assumption which is used in determining the annual UAAL amortization. A lower payroll growth assumptionresults in a larger amortization of the UAAL. Since extending the 25-and-out benefit reduces liability, that savings is recognized sooner.
4 The value of the 25-and-out early retirement benefit relative to a deferred unreduced benefit is greater when the COLA is reduced, so there is less of a savings for extending
the benefit when the COLA is decreased.
5 The change in mortality assumption removed some of the prior conservatism, resulting is shorter assumed life expectancy. The relative value of the 25-and-out benefit to theRule of 80 and 30-and-out unreduced benefits is greater when life expectancy is shorter, resulting is a slight increase in cost for extending the 25-and-out benefit comparedto the prior assumption.
PwC 6 February 20, 2013

Public School Retirement System of Missouri Exhibit IVPermanent Extension of 25 & Out Early Retirement Benefit
Retirement Assumption Prior to 2011 Experience Study
Retirement Rates When 25 & Out Benefit is Available
Service
Age <=20 21 22 23 24 25 26 27 28 29 30 >=31
<50 0 0 0 0 0 40 40 40 40 40 350 300
50 0 0 0 0 0 40 40 40 40 40 490 300
51 0 0 0 0 0 40 40 40 40 490 350 300
52 0 0 0 0 0 40 40 40 490 240 350 300
53 0 0 0 0 0 40 40 490 240 240 350 300
54 0 0 0 0 0 40 490 240 240 240 350 300
55 25 25 25 25 25 450 200 200 200 200 350 300
56 25 25 25 25 450 200 200 200 200 200 350 300
57 25 25 25 450 200 200 200 200 200 200 350 300
58 25 25 450 200 200 200 200 200 200 200 350 300
59 25 450 200 200 200 200 200 200 200 200 350 300
60 200 200 200 200 200 200 200 200 200 200 350 300
61 200 200 200 200 200 200 200 200 200 200 350 300
62 200 200 200 200 200 200 200 200 200 200 350 300
63 200 200 200 200 200 200 200 200 200 200 350 300
64 200 200 200 200 200 200 200 200 200 200 350 300
65 300 300 300 300 300 300 300 300 300 300 350 300
66 200 200 200 200 200 200 200 200 200 200 350 300
67 200 200 200 200 200 200 200 200 200 200 350 300
68 200 200 200 200 200 200 200 200 200 200 350 300
69 200 200 200 200 200 200 200 200 200 200 350 300
>70 1000 1000 1000 1000 1000 1000 1000 1000 1000 1000 1000 1000
Retirement Rates When the 25 & Out Benefit is Not Available
Service
Age <=20 21 22 23 24 25 26 27 28 29 30 >=31
<50 0 0 0 0 0 0 0 0 0 0 350 300
50 0 0 0 0 0 0 0 0 0 0 490 300
51 0 0 0 0 0 0 0 0 0 490 350 300
52 0 0 0 0 0 0 0 0 490 240 350 300
53 0 0 0 0 0 0 0 490 240 240 350 300
54 0 0 0 0 0 0 490 240 240 240 350 300
55 25 25 25 25 25 450 200 200 200 200 350 300
56 25 25 25 25 450 200 200 200 200 200 350 300
57 25 25 25 450 200 200 200 200 200 200 350 300
58 25 25 450 200 200 200 200 200 200 200 350 300
59 25 450 200 200 200 200 200 200 200 200 350 300
60 200 200 200 200 200 200 200 200 200 200 350 300
61 200 200 200 200 200 200 200 200 200 200 350 300
62 200 200 200 200 200 200 200 200 200 200 350 300
63 200 200 200 200 200 200 200 200 200 200 350 300
64 200 200 200 200 200 200 200 200 200 200 350 300
65 300 300 300 300 300 300 300 300 300 300 350 300
66 200 200 200 200 200 200 200 200 200 200 350 300
67 200 200 200 200 200 200 200 200 200 200 350 300
68 200 200 200 200 200 200 200 200 200 200 350 300
69 200 200 200 200 200 200 200 200 200 200 350 300
>70 1000 1000 1000 1000 1000 1000 1000 1000 1000 1000 1000 1000
Active Member Retirement Per 1,000 Eligible Members
Active Member Retirement Per 1,000 Eligible Members
PwC 7 February 20, 2013
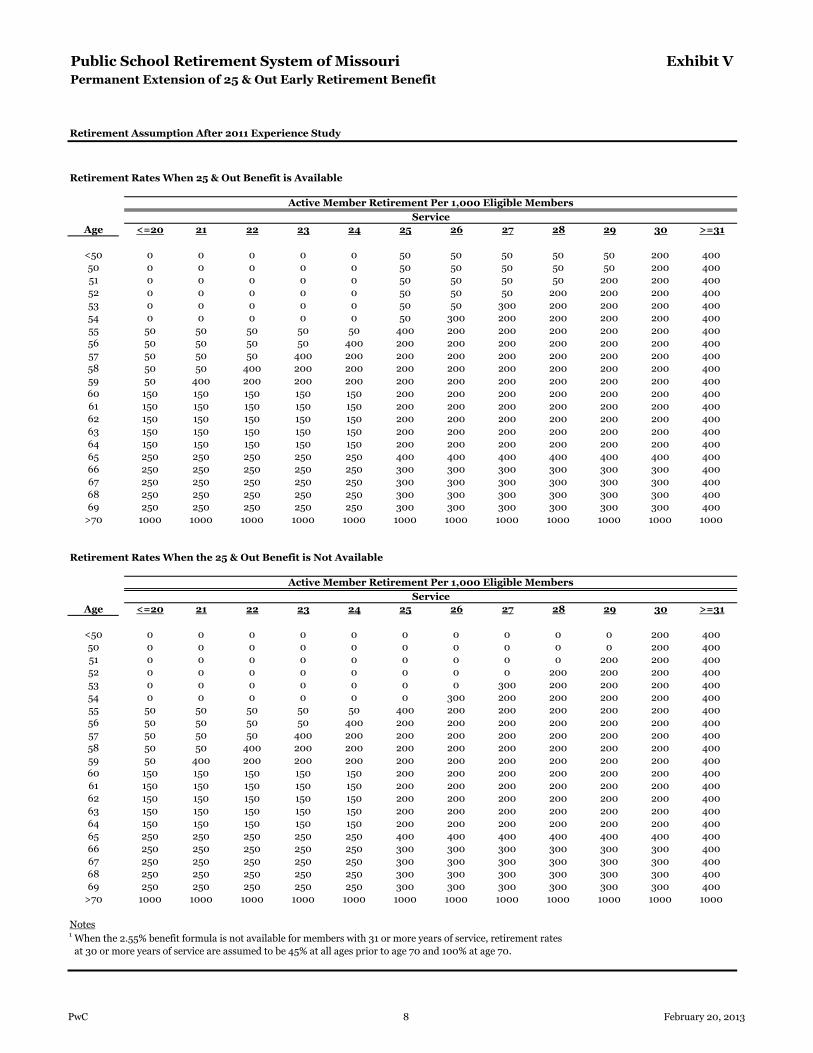
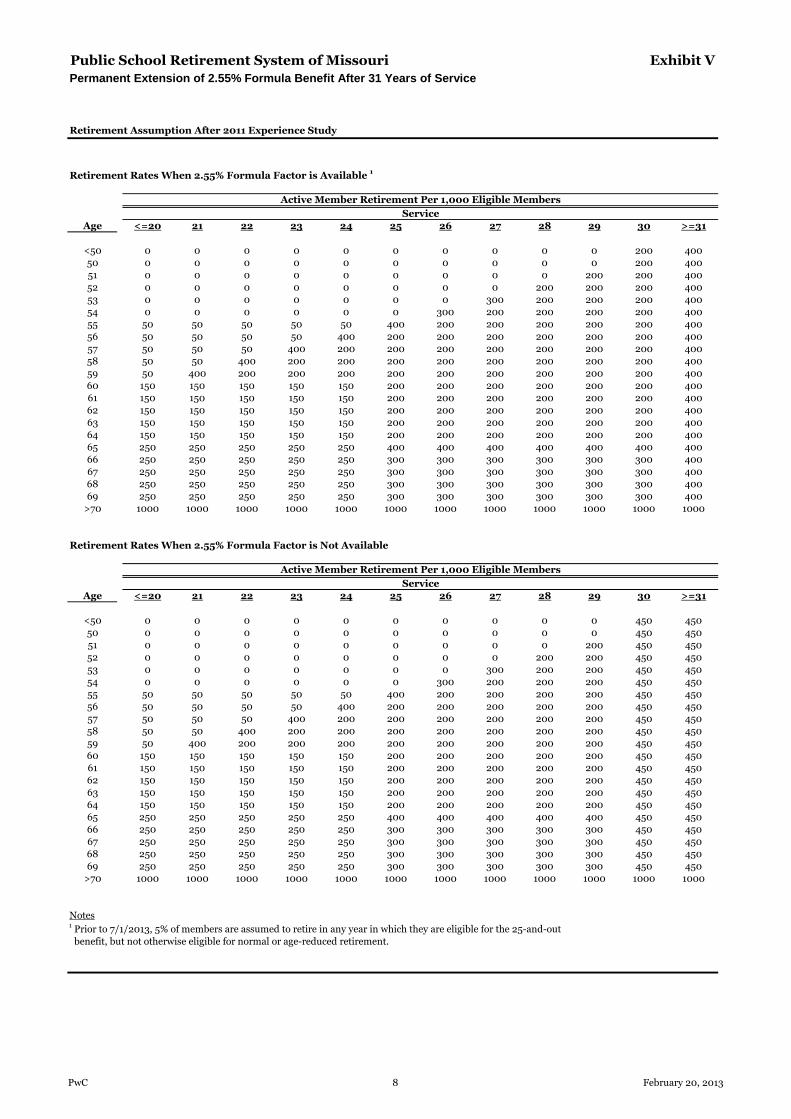
Public School Retirement System of Missouri Exhibit VPermanent Extension of 25 & Out Early Retirement Benefit
Retirement Assumption After 2011 Experience Study
Retirement Rates When 25 & Out Benefit is Available
Service
Age <=20 21 22 23 24 25 26 27 28 29 30 >=31
<50 0 0 0 0 0 50 50 50 50 50 200 400
50 0 0 0 0 0 50 50 50 50 50 200 400
51 0 0 0 0 0 50 50 50 50 200 200 400
52 0 0 0 0 0 50 50 50 200 200 200 400
53 0 0 0 0 0 50 50 300 200 200 200 400
54 0 0 0 0 0 50 300 200 200 200 200 400
55 50 50 50 50 50 400 200 200 200 200 200 400
56 50 50 50 50 400 200 200 200 200 200 200 400
57 50 50 50 400 200 200 200 200 200 200 200 400
58 50 50 400 200 200 200 200 200 200 200 200 400
59 50 400 200 200 200 200 200 200 200 200 200 400
60 150 150 150 150 150 200 200 200 200 200 200 400
61 150 150 150 150 150 200 200 200 200 200 200 400
62 150 150 150 150 150 200 200 200 200 200 200 400
63 150 150 150 150 150 200 200 200 200 200 200 400
64 150 150 150 150 150 200 200 200 200 200 200 400
65 250 250 250 250 250 400 400 400 400 400 400 400
66 250 250 250 250 250 300 300 300 300 300 300 400
67 250 250 250 250 250 300 300 300 300 300 300 400
68 250 250 250 250 250 300 300 300 300 300 300 400
69 250 250 250 250 250 300 300 300 300 300 300 400
>70 1000 1000 1000 1000 1000 1000 1000 1000 1000 1000 1000 1000
Retirement Rates When the 25 & Out Benefit is Not Available
Service
Age <=20 21 22 23 24 25 26 27 28 29 30 >=31
<50 0 0 0 0 0 0 0 0 0 0 200 400
50 0 0 0 0 0 0 0 0 0 0 200 400
51 0 0 0 0 0 0 0 0 0 200 200 400
52 0 0 0 0 0 0 0 0 200 200 200 400
53 0 0 0 0 0 0 0 300 200 200 200 400
54 0 0 0 0 0 0 300 200 200 200 200 400
55 50 50 50 50 50 400 200 200 200 200 200 400
56 50 50 50 50 400 200 200 200 200 200 200 400
57 50 50 50 400 200 200 200 200 200 200 200 400
58 50 50 400 200 200 200 200 200 200 200 200 400
59 50 400 200 200 200 200 200 200 200 200 200 400
60 150 150 150 150 150 200 200 200 200 200 200 400
61 150 150 150 150 150 200 200 200 200 200 200 400
62 150 150 150 150 150 200 200 200 200 200 200 400
63 150 150 150 150 150 200 200 200 200 200 200 400
64 150 150 150 150 150 200 200 200 200 200 200 400
65 250 250 250 250 250 400 400 400 400 400 400 400
66 250 250 250 250 250 300 300 300 300 300 300 400
67 250 250 250 250 250 300 300 300 300 300 300 400
68 250 250 250 250 250 300 300 300 300 300 300 400
69 250 250 250 250 250 300 300 300 300 300 300 400
>70 1000 1000 1000 1000 1000 1000 1000 1000 1000 1000 1000 1000
Notes1 When the 2.55% benefit formula is not available for members with 31 or more years of service, retirement rates
at 30 or more years of service are assumed to be 45% at all ages prior to age 70 and 100% at age 70.
Active Member Retirement Per 1,000 Eligible Members
Active Member Retirement Per 1,000 Eligible Members
PwC 8 February 20, 2013

Public School Retirement System of Missouri Exhibit VIPermanent Extension of 25 & Out Early Retirement Benefit
Individual Salary Increase Assumptions
Prior to After
Service 2011 Experience Study 2011 Experience Study
0 10.25% 10.00%
1 9.25% 7.00%
2 7.75% 7.00%
3 7.75% 7.00%
4 7.75% 7.00%
5 7.50% 6.80%
6 7.25% 6.60%
7 7.00% 6.40%
8 6.75% 6.20%
9 6.50% 6.00%
10 6.25% 5.80%
11 6.00% 5.60%
12 5.75% 5.40%
13 5.50% 5.20%
14 5.25% 5.00%
15 5.00% 5.00%
16 5.00% 4.90%
17 5.00% 4.90%
18 5.00% 4.80%
19 5.00% 4.80%
20 5.00% 4.70%
21 5.00% 4.70%
22 5.00% 4.60%
23 5.00% 4.60%
24 5.00% 4.50%
25 5.00% 4.50%
26 5.00% 4.40%
27 5.00% 4.30%
28 5.00% 4.20%
29 5.00% 4.10%
30 5.00% 4.00%
Notes
Rates shown above are total assumed increase, including the effects of inflation and real wage growth.
PwC 9 February 20, 2013

Exhibit VII
ACTUARIAL ASSUMPTIONS
Inflation
Payroll Growth
Individual Salary Growth
Inflation is assumed to be 2.50% per annum.
Total payroll growth is assumed to be 3.50% per annum, consisting of 2.50% inflation, 0.50% additional inflation due tothe inclusion of health care costs in pension earnings, and 0.50% of real wage growth.
Salaries are assumed to increase each year with general inflation of 2.50%, plus health care inflation of 0.50% (sincehealth care costs are included in pension earnings), plus a longevity adjustment that accounts for merit, promotion, andother real wage growth.
4.90%
4.90%
5.80%
5.60%
5.40%
5.20%
5.00%
5.00%
2.80%
2.60%
2.40%
2.20%
2.00%
2.00%
1.90%
1.90%
10.00%
7.00%
6.80%
6.60%
6.40%
6.20%
6.00%
7.00%
4.00%
3.80%
3.60%
3.40%
3.20%
3.00%
0.50%
0.50%
0.50%
0.50%
0.50%
0.50%
0.50%
0.50%
0.50%
0.50%
0.50%
2.50%
2.50%
13
14
15
0.50%
0.50%
0.50%
0.50%
11
12
2.50%
2.50%
2.50%
2.50%
2.50%
2.50%
16
17
Inflation Longevity Increase
1 - 4
5
6
7
8
9
Service
0
Inflation
2.50%
2.50%
2.50%
2.50%
2.50%
2.50%
2.50%
10
Investment Return
It is assumed that investments of the System will return a yield of 8.00% per annum, net of system expenses (investmentand administrative).
4.60%
4.60%
4.50%
4.80%
4.80%
4.70%
4.70%
1.20%
1.10%
1.00%
1.50%
1.50%
1.40%
1.30%
1.60%
1.60%
1.80%
1.80%
1.70%
1.70%
4.20%
4.10%
4.00%
4.50%
4.40%
4.30%
0.50%
0.50%
0.50%
0.50%
0.50%
0.50%
2.50%
2.50%
2.50%
2.50%
2.50%
2.50%
2.50%
2.50%
2.50%
2.50%
0.50%
0.50%
0.50%
0.50%
0.50%
28 2.50%
0.50%
0.50%
22
23
24
25
26
27
2.50%
2.50%
18
19
20
21
29
30+
PwC10 February 20, 2013

Exhibit VII
Service Retiree, Beneficiary and Surviror Mortality
1.178
4.099
1.492
4.593
50
60
40 0.898 0.509
Active Member Mortality
Mortality Rates for non-disabled retirees and beneficiaries are based on the RP 2000 Mortality Table, set back one yearfor both males and females, then projected to 2016 using Scale AA. Illustrative rates per 1,000 members at various agesare as follows:
Age Male Female
0.1310.24420
0.898 0.171
50 1.492 0.782
60 4.593 2.237
Age Male Female
70 15.549 7.955
30 0.38 0.171
40
Mortality Rates
Mortality Rates for active members are based on the RP 2000 Mortality Table, set back one year for males and six yearsfor females, then projected to 2016 using Scale AA. Illustrative rates per 1,000 members at various ages are as follows:
Cost of Living Adjustments
Cost of living adjustments ("COLA") are assumed to be 2.00% per year and compounded, based on the current policy ofthe Board to grant a 2.00% COLA whenever annual inflation, as measured by the CPI-U index for a fiscal year, increasesbetween 0.00% and 5.00%.
The COLA assumption applies to service retirees and their beneficiaries. The COLA does not apply to the benefits for in-service death payable to spouses (where the spouse is over age 60), and does not apply to the spouse with children pre-retirement death benefit, the dependent children pre-retirement death benefit, or the dependent parent death benefit.The total lifetime COLA cannot exceed 80% of the original benefit. Future COLAs for current benefit recipients reflectactual cumulative adjustments granted at the time of valuation.
237.467
364.617
7.450
11.535
21.839
37.635
72.312
140.049
100
110
22.571
28.975
42.042
62.583
109.372
183.408
344.556
400.000
40
50
60
70
80
90
351.544
Mortality Rates for disabled retirees are based on the RP 2000 Disabled Retiree Mortality Table. Illustrative rates per1,000 members at various ages are as follows:
Disability Retiree Mortality
Age Male Female
4.099
13.715
37.094
113.562
227.712
110
4.593
15.549
49.322
156.083
324.963
400
60
70
80
90
100
PwC11 February 20, 2013
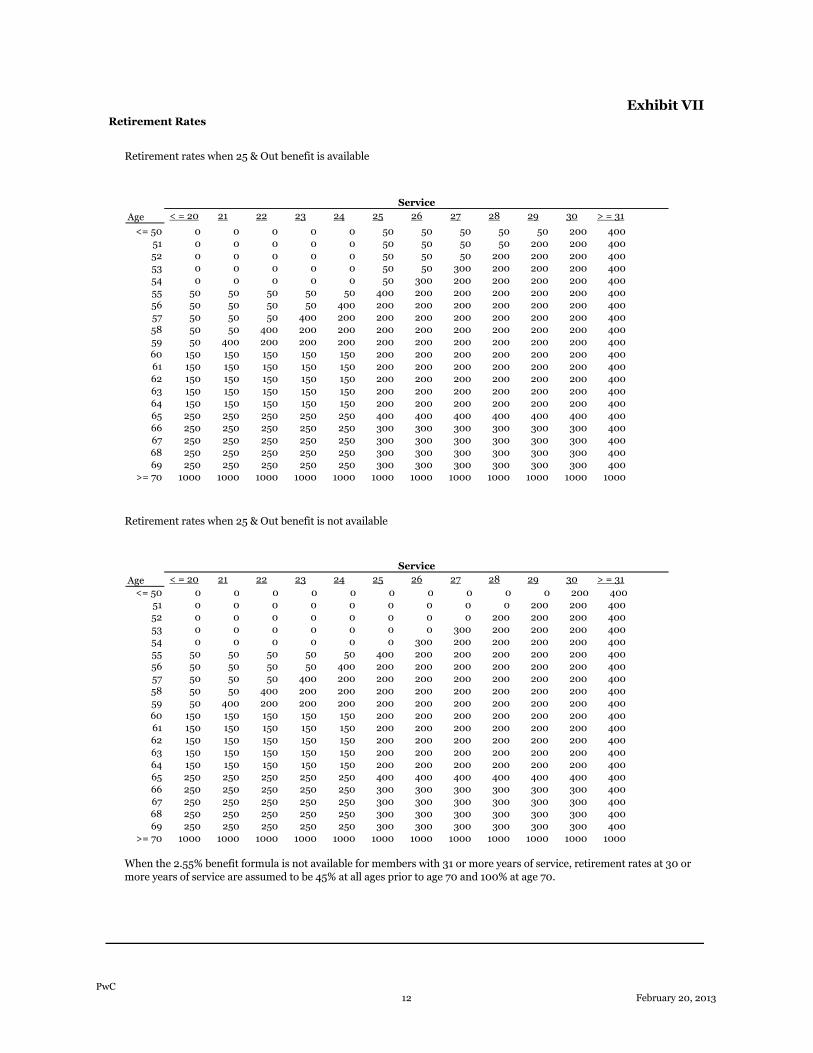
Exhibit VII
Age < = 20 21 22 23 24 25 26 27 28 29 30 > = 31
<= 50 0 0 0 0 0 50 50 50 50 50 200 40051 0 0 0 0 0 50 50 50 50 200 200 40052 0 0 0 0 0 50 50 50 200 200 200 40053 0 0 0 0 0 50 50 300 200 200 200 40054 0 0 0 0 0 50 300 200 200 200 200 40055 50 50 50 50 50 400 200 200 200 200 200 40056 50 50 50 50 400 200 200 200 200 200 200 40057 50 50 50 400 200 200 200 200 200 200 200 40058 50 50 400 200 200 200 200 200 200 200 200 40059 50 400 200 200 200 200 200 200 200 200 200 40060 150 150 150 150 150 200 200 200 200 200 200 40061 150 150 150 150 150 200 200 200 200 200 200 40062 150 150 150 150 150 200 200 200 200 200 200 40063 150 150 150 150 150 200 200 200 200 200 200 40064 150 150 150 150 150 200 200 200 200 200 200 40065 250 250 250 250 250 400 400 400 400 400 400 40066 250 250 250 250 250 300 300 300 300 300 300 40067 250 250 250 250 250 300 300 300 300 300 300 40068 250 250 250 250 250 300 300 300 300 300 300 40069 250 250 250 250 250 300 300 300 300 300 300 400
>= 70 1000 1000 1000 1000 1000 1000 1000 1000 1000 1000 1000 1000
Age < = 20 21 22 23 24 25 26 27 28 29 30 > = 31
<= 50 0 0 0 0 0 0 0 0 0 0 200 400
Service
Retirement Rates
Service
Retirement rates when 25 & Out benefit is available
Retirement rates when 25 & Out benefit is not available
<= 50 0 0 0 0 0 0 0 0 0 0 200 40051 0 0 0 0 0 0 0 0 0 200 200 40052 0 0 0 0 0 0 0 0 200 200 200 40053 0 0 0 0 0 0 0 300 200 200 200 40054 0 0 0 0 0 0 300 200 200 200 200 40055 50 50 50 50 50 400 200 200 200 200 200 40056 50 50 50 50 400 200 200 200 200 200 200 40057 50 50 50 400 200 200 200 200 200 200 200 40058 50 50 400 200 200 200 200 200 200 200 200 40059 50 400 200 200 200 200 200 200 200 200 200 40060 150 150 150 150 150 200 200 200 200 200 200 40061 150 150 150 150 150 200 200 200 200 200 200 40062 150 150 150 150 150 200 200 200 200 200 200 40063 150 150 150 150 150 200 200 200 200 200 200 40064 150 150 150 150 150 200 200 200 200 200 200 40065 250 250 250 250 250 400 400 400 400 400 400 40066 250 250 250 250 250 300 300 300 300 300 300 40067 250 250 250 250 250 300 300 300 300 300 300 40068 250 250 250 250 250 300 300 300 300 300 300 40069 250 250 250 250 250 300 300 300 300 300 300 400
>= 70 1000 1000 1000 1000 1000 1000 1000 1000 1000 1000 1000 1000
When the 2.55% benefit formula is not available for members with 31 or more years of service, retirement rates at 30 ormore years of service are assumed to be 45% at all ages prior to age 70 and 100% at age 70.
PwC12 February 20, 2013

Exhibit VII
40
45
50
0.017
0.080
0.160
0.320
0.610
0.960
Active Member Disability
Age Rates
25
30
35
0
Disability Rates
Retirement for disability prior to age 60 is assumed in accordance with the following illustrative rates per 1,000 eligiblemembers:
25+
62
52
23
12
5
4
5
10
15
20
Active Member Withdrawal
Years ofService
0
1
2
3
Rate
190
105
85
73
Withdrawal Rates
Termination of membership prior to eligibility for retirement from all causes other than death and disability is assumedin accordance with the following illustrative rates per 1,000 members:
Provisions for Expenses
Refund of Contributions
It is assumed that 88% of those leaving after earning 5 years of service leave their contributions in the fund and receive avested benefit. If the present value of the deferred benefit is less than the member account balance, the member'saccount balance is valued. The remaining 12% are assumed to take an immediate refund of their contributions, thusforfeiting their vested retirement benefit.
It is assumed that 100% of those leaving prior to earning 5 years of service will take an immediate refund of theircontributions.
There is no specific provision for expenses. The implicit assumption is that administrative expenses are paid frominvestment income in excess of 8.00% per annum.
1.310
Interest on Member Accounts
1.00% per annum.
Service Purchases
A 2.00% load is added to the Normal Cost to account for anticipated losses resulting from service purchases andreinstatements.
50
55
0.960
PwC13 February 20, 2013
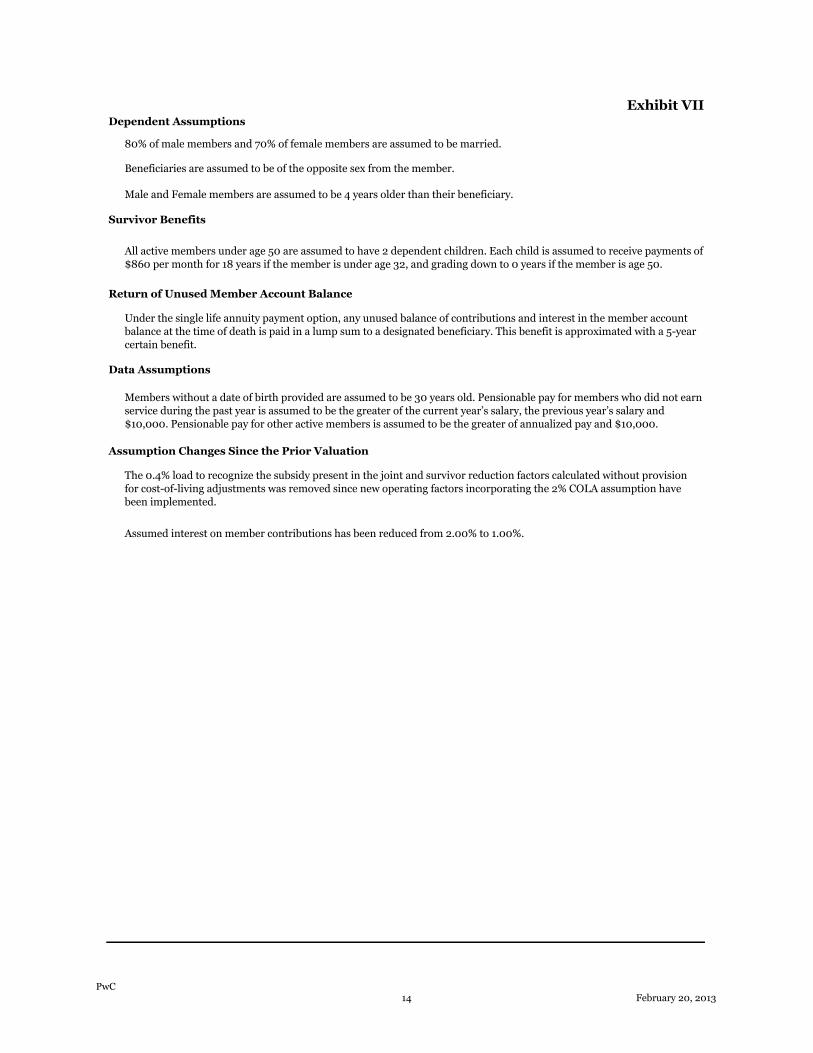
Exhibit VII
The 0.4% load to recognize the subsidy present in the joint and survivor reduction factors calculated without provisionfor cost-of-living adjustments was removed since new operating factors incorporating the 2% COLA assumption havebeen implemented.
Assumed interest on member contributions has been reduced from 2.00% to 1.00%.
All active members under age 50 are assumed to have 2 dependent children. Each child is assumed to receive payments of$860 per month for 18 years if the member is under age 32, and grading down to 0 years if the member is age 50.
Return of Unused Member Account Balance
Under the single life annuity payment option, any unused balance of contributions and interest in the member accountbalance at the time of death is paid in a lump sum to a designated beneficiary. This benefit is approximated with a 5-yearcertain benefit.
Data Assumptions
Members without a date of birth provided are assumed to be 30 years old. Pensionable pay for members who did not earnservice during the past year is assumed to be the greater of the current year’s salary, the previous year’s salary and$10,000. Pensionable pay for other active members is assumed to be the greater of annualized pay and $10,000.
Assumption Changes Since the Prior Valuation
Dependent Assumptions
80% of male members and 70% of female members are assumed to be married.
Beneficiaries are assumed to be of the opposite sex from the member.
Male and Female members are assumed to be 4 years older than their beneficiary.
Survivor Benefits
PwC14 February 20, 2013

Exhibit VII
Acturial Cost Method
The actuarial cost method is Entry Age Normal - Level Percent of Payroll.
The normal cost is calculated separately for each active member and is equal to the level percentage of payrollneeded as an annual contribution from entry age to retirement age to fund projected benefits. The actuarialaccrued liability on any valuation date is the accumulated value of such normal costs from entry age to thevaluation date.
Asset Valuation Method
The Actuarial Value of Assets is a smoothed value of assets. The actuarial value for a year is computed by takingthe actuarial value at June 30 of the prior year, subtracting all expenses (including benefit payments), and addingcontributions and expected investment return at 8% of actuarial value of assets. The difference between the actualreturns at market value for the year and expected returns is determined. Twenty percent (20%) of that difference isadded to the actuarial value along with corresponding amounts from each of the prior four years. The ActuarialValue of Assets was reset to market value at June 30, 2003.
Amortization of Unfunded Actuarial Accrued Liability
Gains and losses occurring from census experience different than assumed and assumption changes are amortizedover a 30-year period as a level percent of payroll. A new gain or loss base is established each year based on theadditional gain or loss during that year and that base is amortized over a new 30-year period. The purpose of themethod is to give a smooth progression of the costs from year to year and, at the same time, provide for an orderlyfunding of the unfunded liabilities.
Increases or decreases in the Actuarial Accrued Liability caused by changes in the benefit provisions are amortizedover 20 years, as determined in the 2007 session of the Legislature.
Method Changes Since the Prior Valuation
None
ACTUARIAL METHODS
PwC 15 February 20, 2013

Exhibit VIII
Public School Retirement System of Missouri
Disclosures
This letter has been prepared pursuant to the engagement letter between PricewaterhouseCoopers LLP and PSRS and PEERS of Missouri,dated October 27, 2008.
In preparing the results presented in this letter, we have relied upon information provided to us by PSRS and PEERS of Missouri regardingplan provisions, plan participants, and benefit payments. While the scope of our engagement did not call for us to perform an audit orindependent verification of this information, we have reviewed this information for reasonableness. The accuracy of the results presentedin this letter is dependent upon the accuracy and completeness of the underlying information.
To the best of our knowledge, the individuals involved in this engagement have no relationship that may impair or appear to impair theobjectivity of our work.
No statement in this letter is intended as a recommendation in favor, or in opposition, of the proposed legislation. Except as otherwisenoted, potential impacts on other benefit plans were not considered.
The calculations are based upon assumptions regarding future events. However, the plan’s long term costs will be determined by actualfuture events, which may differ materially from the assumptions that were made. The calculations are also based upon present andproposed plan provisions that are outlined in the letter. If you have reason to believe that the assumptions that were used are unreasonable,that the plan provisions are incorrectly described, that important plan provisions relevant to this proposal are not described, or thatconditions have changed since the calculations were made, you should contact PSRS and PEERS of Missouri.
In the event that more than one plan change is being considered, it is very important to remember that the results of separate actuarialvaluations cannot generally be added together to produce a correct estimate of the combined effect of all of the changes. The total can beconsiderably greater or less than the sum of the parts due to the interaction of various plan provisions with each other, and with theassumptions that must be used.
This document was not intended or written to be used, and it cannot be used, for the purpose of avoiding U.S. federal, state or local taxpenalties. This includes penalties that may apply if the transaction that is the subject of this document is found to lack economic substanceor fails to satisfy any other similar rule of law. This document has been prepared pursuant to an engagement betweenPricewaterhouseCoopers LLP and PSRS and PEERS of Missouri and is intended solely for the use and benefit of PSRS and PEERS ofMissouri and not for reliance by any other person.
PwC 16 February 20, 2013
Missouri and not for reliance by any other person.
PwC 16 February 20, 2013

PricewaterhouseCoopers LLP, One North Wacker, Chicago, IL 60606T: (312) 298 2000, www.pwc.com/us
February 20, 2013
Mr. M. Steve YoakumExecutive DirectorPSRS and PEERS of Missouri3210 West Truman Blvd.Jefferson City, MO 65109
Re: Public School Retirement System of MissouriCost Estimate of Proposed Benefit Changes
Dear Steve:
This letter has been prepared pPricewaterhouseCoopers LLP ("PwC") and the Public SchoolMissouri ("PSRS and PEERS of Missouri").2012 of the following proposed benefit change to
Permanent extension of themore years of service
We estimate that this change would result in a reduction to the Present Value of Future Benefits ("PVFB") ofapproximately $64.7 million and a corresponding reduction in the Annual RequiredRate") of approximately 0.09%
Exhibit I – Summary impact on the Annual Required Contribution Exhibit II – Detailed impact to the Funded Status and Annu Exhibit III – Summary Exhibit IV – Detail of retirement assumption used in prior analysis Exhibit V – Detail of ret Exhibit VI – Detail of individual salary growth assumption used in prior and current analysis Exhibit VII – Description of all a Exhibit VIII – Disclosures relating to our analysis
The PVFB of the system is equal to the presentthe system based on service and final average salary at retirementlarger percentage of active members are assumed to delay retirement until they earn 31 years of servicemore. Although delaying retirement resultsthe delayed higher monthly paymenttaken after 30 years of servicereasons being that delaying retirementfuture cost-of-living adjustmentssuch, the PVFB is estimated tomembers are assumed to delay retirement until they earn 31 years of service or more.
Because the PVFB is estimated to decrease, the ongoing cost of the syalso expected to decrease. Note that the ARC Rate
1. The Normal Cost Rate
PricewaterhouseCoopers LLP, One North Wacker, Chicago, IL 60606T: (312) 298 2000, www.pwc.com/us
Public School Retirement System of Missouri ("PSRS")Cost Estimate of Proposed Benefit Changes
This letter has been prepared pursuant to the engagement letter dated October 27, 2008, between("PwC") and the Public School and Public Education
and PEERS of Missouri"). As requested, we have estimated theproposed benefit change to PSRS of Missouri:
Permanent extension of the 2.55% formula factor for members who retire with 31 ormore years of service.
this change would result in a reduction to the Present Value of Future Benefits ("PVFB") of$64.7 million and a corresponding reduction in the Annual Required
approximately 0.09%. Enclosed are several exhibits presenting the results of our analysis
Summary impact on the Annual Required ContributionDetailed impact to the Funded Status and Annual Required ContributionSummary impact of assumption changes since prior analysis
of retirement assumption used in prior analysisof retirement assumption used in current analysis
individual salary growth assumption used in prior and current analysisDescription of all actuarial assumptions and methods used in our analysisDisclosures relating to our analysis
is equal to the present value of all benefits expected to be paidand final average salary at retirement. When the 2.55%
larger percentage of active members are assumed to delay retirement until they earn 31 years of servicedelaying retirement results in a higher monthly payment for the member,
higher monthly payments are less than the present value of the unreduced benefit that cunder the 2.50% formula multiplier for the active population as a whole
reasons being that delaying retirement results in the member forgoing receipt of benefit payments, delayingliving adjustments, and reducing the period of time that they will recei
he PVFB is estimated to decrease when the 2.55% benefit is available because a larger percentage ofmembers are assumed to delay retirement until they earn 31 years of service or more.
Because the PVFB is estimated to decrease, the ongoing cost of the system, represented byNote that the ARC Rate is the sum of two components:
The Normal Cost Rate
ursuant to the engagement letter dated October 27, 2008, betweenand Public Education Retirement Systems of
the cost impact as of June 30,
for members who retire with 31 or
this change would result in a reduction to the Present Value of Future Benefits ("PVFB") of$64.7 million and a corresponding reduction in the Annual Required Contribution Rate ("ARC
exhibits presenting the results of our analysis, as follows:
al Required Contributionprior analysis
individual salary growth assumption used in prior and current analysisctuarial assumptions and methods used in our analysis
to be paid to current members ofWhen the 2.55% benefit is available, a
larger percentage of active members are assumed to delay retirement until they earn 31 years of service orhigher monthly payment for the member, the present value of
educed benefit that could behe active population as a whole. The
of benefit payments, delayingreducing the period of time that they will receive pension payments. As
when the 2.55% benefit is available because a larger percentage ofmembers are assumed to delay retirement until they earn 31 years of service or more.
represented by the ARC Rate, isthe sum of two components:

2. The Unfunded Actuarial Accrued Liability Rate
These components are determined by applying the Entry Age Normal costservice and future service, which provides for orderly funding of the benefits over the working careers of themembers. The portion of the PVFB allocated to past service is("AAL"), and the portion allocated to future service isportion allocated to the one-year period following the measurement date
Since the assumed retirementwhen the 2.55% benefit is available, theIn this case, the result is somewhat of an anomaly in that themeaning that a larger portion of the PVFB gets allocated to past service. An increase in the AAL results in alarger unfunded AAL, which in turn increases the Unfunded AAL9.17% to 9.30% of pay), as shown in Exhibit I.
However, a larger portion of the PFVB beingto future service, resulting in a decrease in the Normal Costthe ARC Rate (from 19.03% to 18.81%
When the two components are added together, the result is a small decrease in the ARC Rate28.11% of pay), which is directionally
In addition, please note the following when reviewing the results:
Our analysis was performed by measuring the impact of the change at June 30, 2012, using censusdata collected from PSRSincorporate the impact of future employees who may become members of PSRS.actuarial valuation report dated October 19, 2012 for a summary of the census data.
The BASELINE results shown in Exhibiof the system.
Our analysis was performed based on our understanding of the current Pforth in Chapter 169 of the Missouri Revised Statutesaffect the change described above.
Our analysis does not include any additional administrative cPEERS of Missouri to implement this change.
Our analysis is based on the specific assumptions disclosed hereidependent on those assumptions. The actual cost of the proposed benefit change will depend on theactual future experience of plan members.
To the best of our knowledge this actuarial statement is complete andaccordance with generally accepted actuarial principles and practice and with the Actuarial Standards ofPractice issued by the Actuarial Standards Board. In ourunderstanding of the requirements of MissouriSociety of Actuaries and other professional organizations, including the American Academy of Actuaries, andmeet the Qualification Standards for Actuaries Issuingrelating to pension plans. There is noand PSRS and PEERS of Missouri
2
The Unfunded Actuarial Accrued Liability Rate
These components are determined by applying the Entry Age Normal cost method to allocate the PVFB to pastand future service, which provides for orderly funding of the benefits over the working careers of the
members. The portion of the PVFB allocated to past service is known as the Actuarial Accrued Liabilitythe portion allocated to future service is known as the Present Value
year period following the measurement date is referred to as the Normal Cost.
rates are changed (employees are expected to remain in active service longer)when the 2.55% benefit is available, the expected service period over which the PVFB is allocated also changes.
the result is somewhat of an anomaly in that the AAL increases even thoughmeaning that a larger portion of the PVFB gets allocated to past service. An increase in the AAL results in alarger unfunded AAL, which in turn increases the Unfunded AAL Rate component of the ARC Rate
), as shown in Exhibit I.
However, a larger portion of the PFVB being allocated to past service means that a smaller portion is allocated, resulting in a decrease in the Normal Cost. This reduces the Normal Co
(from 19.03% to 18.81% of pay), as shown in Exhibit I.
When the two components are added together, the result is a small decrease in the ARC Ratedirectionally consistent with the small decrease in the PVFB.
lease note the following when reviewing the results:
Our analysis was performed by measuring the impact of the change at June 30, 2012, using censusPSRS and PEERS of Missouri as of June 30, 2012. Our estimates do not
incorporate the impact of future employees who may become members of PSRS.actuarial valuation report dated October 19, 2012 for a summary of the census data.
The BASELINE results shown in Exhibits I and II are equal the results of our June 30, 2012 valuation
Our analysis was performed based on our understanding of the current Pin Chapter 169 of the Missouri Revised Statutes, as well as the modi
ffect the change described above.
Our analysis does not include any additional administrative cost that may be incurred byto implement this change.
Our analysis is based on the specific assumptions disclosed herein. The result of our analysis is heavilydependent on those assumptions. The actual cost of the proposed benefit change will depend on theactual future experience of plan members.
To the best of our knowledge this actuarial statement is complete and accurate and has been prepared inaccepted actuarial principles and practice and with the Actuarial Standards of
Practice issued by the Actuarial Standards Board. In our opinion, our calculations also comply with ourof the requirements of Missouri state law. The undersigned actuaries are
Society of Actuaries and other professional organizations, including the American Academy of Actuaries, andQualification Standards for Actuaries Issuing Statements of Actuarial Opinion in the United States
relating to pension plans. There is no relationship between the PwC practitioners involand PSRS and PEERS of Missouri that may impair our objectivity.
method to allocate the PVFB to pastand future service, which provides for orderly funding of the benefits over the working careers of the
known as the Actuarial Accrued Liabilityknown as the Present Value of Future Normal Costs. The
is referred to as the Normal Cost.
(employees are expected to remain in active service longer)period over which the PVFB is allocated also changes.
even though the PVFB decreases,meaning that a larger portion of the PVFB gets allocated to past service. An increase in the AAL results in a
component of the ARC Rate (from
means that a smaller portion is allocatedthe Normal Cost Rate component of
When the two components are added together, the result is a small decrease in the ARC Rate (from 28.20% tosmall decrease in the PVFB.
Our analysis was performed by measuring the impact of the change at June 30, 2012, using censusOur estimates do not
incorporate the impact of future employees who may become members of PSRS. Please refer to ouractuarial valuation report dated October 19, 2012 for a summary of the census data.
al the results of our June 30, 2012 valuation
Our analysis was performed based on our understanding of the current PSRS benefit provisions as set, as well as the modification to those statutes to
ost that may be incurred by PSRS and
The result of our analysis is heavilydependent on those assumptions. The actual cost of the proposed benefit change will depend on the
accurate and has been prepared inaccepted actuarial principles and practice and with the Actuarial Standards of
opinion, our calculations also comply with ourstate law. The undersigned actuaries are members of the
Society of Actuaries and other professional organizations, including the American Academy of Actuaries, andStatements of Actuarial Opinion in the United States
relationship between the PwC practitioners involved in this engagement

This document was not intended or written to be used, and it cannot be used, for the purpose of avoiding U.S.federal, state, or local tax penalties. This includes penalties that may apply if the transaction that is the subjectof this document is found to lack economic substancedocument has been prepared pursuant to an engagement letter betweenPwC, and is intended solely for the use and benefits of PSRS and PEERS of Missouriany other person.
Please call with any questions or if you require additional information.
Sincerely,
Sheldon A. Gamzon, FSA, MAAA
3
ed or written to be used, and it cannot be used, for the purpose of avoiding U.S.penalties. This includes penalties that may apply if the transaction that is the subject
of this document is found to lack economic substance or fails to satisfy any other similar rule of law. Thisdocument has been prepared pursuant to an engagement letter between PSRS and PEERS of Missouri
or the use and benefits of PSRS and PEERS of Missouri
Please call with any questions or if you require additional information.
, FSA, MAAA Brandon Robertson, ASA, MAAA
ed or written to be used, and it cannot be used, for the purpose of avoiding U.S.penalties. This includes penalties that may apply if the transaction that is the subject
fails to satisfy any other similar rule of law. ThisPSRS and PEERS of Missouri and
or the use and benefits of PSRS and PEERS of Missouri and not for reliance by
Brandon Robertson, ASA, MAAA

Public School Retirement System of Missouri Exhibit I
Permanent Extension of 2.55% Formula Benefit After 31 Years of Service
Summary Cost Analysis as of June 30, 2012
BASELINEPermanent
Extension of 2.55%Benefit
Annual Required Contribution
Normal Cost Rate 19.03% 18.81%
Unfunded Actuarial Accrued Liability Amortization Rate 9.17% 9.30%
Annual Required Contribution Rate 28.20% 28.11%
Change in Annual Required Contribution Rate -0.09%
PwC 4 February 20, 2013

Public School Retirement System of Missouri Exhibit II
Permanent Extension of 2.55% Formula Benefit After 31 Years of Service
Cost Analysis as of June 30, 2012
BASELINEPermanent Extension of
2.55% Benefit
Funded Status
Actuarial Accrued Liability ("AAL")
Active MembersService less than 31 years $12,873,153,908 $12,880,433,620Service of 31+ years 991,541,891 1,085,007,180
State Members 11,398,812 11,398,812Inactive Members 520,903,729 520,903,729Pay Status Members 21,191,032,300 21,191,032,300Total Actuarial Accrued Liability ("AAL") $35,588,030,639 $35,688,775,641
% Change 0.28%
Actuarial Value of Assets ("AVA") 29,013,002,242 29,013,002,242
Unfunded Actuarial Accrued Liability (AAL - AVA) $6,575,028,397 $6,675,773,399
Funded Percentage (AVA / AAL) 81.52% 81.29%Change in Funded Percentage -0.23%
Annual Required Contribution
Expected Payroll $4,379,059,546 $4,379,059,546
Normal Cost $801,101,622 $791,870,527Active Members
Service less than 31 years $768,027,408 $758,792,906Service of 31+ years 17,160,054 17,550,749
State Members 206,285 206,285
PwC 5 February 20, 2013
State Members 206,285 206,285Total Normal Cost $785,393,747 $776,549,939
Total Normal Cost With 2% Service Purchase Load $801,101,622 $792,080,938Normal Cost Rate 19.03% 18.81%
Unfunded Actuarial Accrued Liability Amortization $385,941,641 $391,763,153Unfunded Actuarial Accrued Liability Amortization Rate 9.17% 9.30%
Annual Required Contribution $1,187,043,263 $1,183,633,680Annual Required Contribution Rate 28.20% 28.11%Change in Annual Required Contribution Rate -0.09%
PwC 5 February 20, 2013

Public School Retirement System of Missouri Exhibit IIIPermanent Extension of 2.55% Formula Benefit After 31 Years of Service
Summary of Assumption Changes Since Prior Analysis
Normal Cost UAAL Amortization ARC
Permanent Extension of 2.55% Formula Benefit - Old Assumptions1 0.07% 0.09% 0.16%
Impact of Assumption Changes:
Assumption Old Assumption New Assumption
Retirement2 See Exhibit IV See Exhibit V -0.27% 0.10% -0.17%
Salary Increases3 Service based rates, starting at 10.25% in the
first years of service and grading down to 5.00%for members with 15 or more years of service
Service based rates, starting at 10.00% in thefirst years of service and grading down to 4.00%for members with 30 or more years of service
-0.03% -0.02% -0.05%
COLA4 3.25% 2.00% 0.02% -0.02% 0.00%
Mortality5 1994 GAM Mortality Tables, with adjustments
to reflect longer life expectancyRP 2000 Mortality Tables, with adjustments toreflect observed experience
-0.01% -0.02% -0.03%
Total Impact -0.29% 0.04% -0.25%
Permanent Extension of 2.55% Formula Benefit - New Assumptions -0.22% 0.13% -0.09%
Notes1 This is comparable to a calculation performed by GRS in 2006 that showed an ARC increase of 0.13% (0.06% increase in Normal Cost and 0.07% increase in UAAL
amortization). The 0.03% difference is likely due changes in the census data used in the analysis and other less significant assumption changes since 2006.
2 Prior to the 2011 experience study, the retirement assumption for members with 30 or more years of service was the same whether the 2.55% formula benefit was
available or not (see Exhibit IV). With no difference in assumed retirement, an extension of the 2.55% benefit is simply an increase in benefit for those assumed to work to 31
years of service or more, resulting in an estimated cost increase for extending the benefit. The 2011 experience study showed that when the 2.55% benefit is available, a greater
percentage of members defer retirement to receive the higher monthly benefit, rather than retiring on or before 30 years of service (see Exhibit V). Despite the greater benefit
formula, the delay of retirement benefits (and delay of future COLA increase) reduces the cost of the system.
3 The 2011 experience showed the individual member salaries were growing slower that previously assumed. Under the new assumption, a member's benefit is not assumed to
grow as fast when retirement is deferred beyond 30 years of service, reducing the cost of extending the 2.55% compared to the prior salary increase assumption.
4 The value of incremental benefit provided by the 2.55% (i.e. the extra 0.05%) as a percentage of the total benefit value is very similar whether the assumed COLA is 3.25%
or 2.00%. Therefore, the effect of changing the COLA assumption has virtually no impact on the ARC.
5 The new mortality assumption removed some of the conservatism of the prior assumption in that the life expectancy of members is lower under the new assumption. Similar to
the change in COLA assumption, this change reduces the value of all retirement benefits, including an extension of the 2.55% benefit, when compared to the prior assumption
since it assumes that retirees will receive benefits for a shorter period of time.
PwC 6 February 20, 2013

Public School Retirement System of Missouri Exhibit IV
Permanent Extension of 2.55% Formula Benefit After 31 Years of Service
Retirement Assumption Prior to 2011 Experience Study
Retirement Rates When 2.55% Formula Factor is Available 1
ServiceAge <=20 21 22 23 24 25 26 27 28 29 30 >=31
<50 0 0 0 0 0 0 0 0 0 0 350 30050 0 0 0 0 0 0 0 0 0 0 490 30051 0 0 0 0 0 0 0 0 0 490 350 30052 0 0 0 0 0 0 0 0 490 240 350 30053 0 0 0 0 0 0 0 490 240 240 350 30054 0 0 0 0 0 0 490 240 240 240 350 30055 25 25 25 25 25 450 200 200 200 200 350 30056 25 25 25 25 450 200 200 200 200 200 350 30057 25 25 25 450 200 200 200 200 200 200 350 30058 25 25 450 200 200 200 200 200 200 200 350 30059 25 450 200 200 200 200 200 200 200 200 350 30060 200 200 200 200 200 200 200 200 200 200 350 30061 200 200 200 200 200 200 200 200 200 200 350 30062 200 200 200 200 200 200 200 200 200 200 350 30063 200 200 200 200 200 200 200 200 200 200 350 30064 200 200 200 200 200 200 200 200 200 200 350 30065 300 300 300 300 300 300 300 300 300 300 350 30066 200 200 200 200 200 200 200 200 200 200 350 30067 200 200 200 200 200 200 200 200 200 200 350 30068 200 200 200 200 200 200 200 200 200 200 350 30069 200 200 200 200 200 200 200 200 200 200 350 300
>70 1000 1000 1000 1000 1000 1000 1000 1000 1000 1000 1000 1000
Retirement Rates When 2.55% Formula Factor is Not Available
ServiceAge <=20 21 22 23 24 25 26 27 28 29 30 >=31
<50 0 0 0 0 0 0 0 0 0 0 350 30050 0 0 0 0 0 0 0 0 0 0 490 30051 0 0 0 0 0 0 0 0 0 490 350 30052 0 0 0 0 0 0 0 0 490 240 350 30053 0 0 0 0 0 0 0 490 240 240 350 30054 0 0 0 0 0 0 490 240 240 240 350 30055 25 25 25 25 25 450 200 200 200 200 350 30056 25 25 25 25 450 200 200 200 200 200 350 30057 25 25 25 450 200 200 200 200 200 200 350 30058 25 25 450 200 200 200 200 200 200 200 350 30059 25 450 200 200 200 200 200 200 200 200 350 30060 200 200 200 200 200 200 200 200 200 200 350 30061 200 200 200 200 200 200 200 200 200 200 350 30062 200 200 200 200 200 200 200 200 200 200 350 30063 200 200 200 200 200 200 200 200 200 200 350 30064 200 200 200 200 200 200 200 200 200 200 350 30065 300 300 300 300 300 300 300 300 300 300 350 30066 200 200 200 200 200 200 200 200 200 200 350 30067 200 200 200 200 200 200 200 200 200 200 350 30068 200 200 200 200 200 200 200 200 200 200 350 30069 200 200 200 200 200 200 200 200 200 200 350 300
>70 1000 1000 1000 1000 1000 1000 1000 1000 1000 1000 1000 1000
Notes1
Prior to 7/1/2013, 4% of members are assumed to retire in any year in which they are eligible for the 25-and-outbenefit, but not otherwise eligible for normal or age-reduced retirement.
Active Member Retirement Per 1,000 Eligible Members
Active Member Retirement Per 1,000 Eligible Members
PwC 7 February 20, 2013
Public School Retirement System of Missouri Exhibit V
Permanent Extension of 2.55% Formula Benefit After 31 Years of Service
Retirement Assumption After 2011 Experience Study
Retirement Rates When 2.55% Formula Factor is Available 1
ServiceAge <=20 21 22 23 24 25 26 27 28 29 30 >=31
<50 0 0 0 0 0 0 0 0 0 0 200 40050 0 0 0 0 0 0 0 0 0 0 200 40051 0 0 0 0 0 0 0 0 0 200 200 40052 0 0 0 0 0 0 0 0 200 200 200 40053 0 0 0 0 0 0 0 300 200 200 200 40054 0 0 0 0 0 0 300 200 200 200 200 40055 50 50 50 50 50 400 200 200 200 200 200 40056 50 50 50 50 400 200 200 200 200 200 200 40057 50 50 50 400 200 200 200 200 200 200 200 40058 50 50 400 200 200 200 200 200 200 200 200 40059 50 400 200 200 200 200 200 200 200 200 200 40060 150 150 150 150 150 200 200 200 200 200 200 40061 150 150 150 150 150 200 200 200 200 200 200 40062 150 150 150 150 150 200 200 200 200 200 200 40063 150 150 150 150 150 200 200 200 200 200 200 40064 150 150 150 150 150 200 200 200 200 200 200 40065 250 250 250 250 250 400 400 400 400 400 400 40066 250 250 250 250 250 300 300 300 300 300 300 40067 250 250 250 250 250 300 300 300 300 300 300 40068 250 250 250 250 250 300 300 300 300 300 300 40069 250 250 250 250 250 300 300 300 300 300 300 400
>70 1000 1000 1000 1000 1000 1000 1000 1000 1000 1000 1000 1000
Retirement Rates When 2.55% Formula Factor is Not Available
ServiceAge <=20 21 22 23 24 25 26 27 28 29 30 >=31
<50 0 0 0 0 0 0 0 0 0 0 450 45050 0 0 0 0 0 0 0 0 0 0 450 45051 0 0 0 0 0 0 0 0 0 200 450 45052 0 0 0 0 0 0 0 0 200 200 450 45053 0 0 0 0 0 0 0 300 200 200 450 45054 0 0 0 0 0 0 300 200 200 200 450 45055 50 50 50 50 50 400 200 200 200 200 450 45056 50 50 50 50 400 200 200 200 200 200 450 45057 50 50 50 400 200 200 200 200 200 200 450 45058 50 50 400 200 200 200 200 200 200 200 450 45059 50 400 200 200 200 200 200 200 200 200 450 45060 150 150 150 150 150 200 200 200 200 200 450 45061 150 150 150 150 150 200 200 200 200 200 450 45062 150 150 150 150 150 200 200 200 200 200 450 45063 150 150 150 150 150 200 200 200 200 200 450 45064 150 150 150 150 150 200 200 200 200 200 450 45065 250 250 250 250 250 400 400 400 400 400 450 45066 250 250 250 250 250 300 300 300 300 300 450 45067 250 250 250 250 250 300 300 300 300 300 450 45068 250 250 250 250 250 300 300 300 300 300 450 45069 250 250 250 250 250 300 300 300 300 300 450 450
>70 1000 1000 1000 1000 1000 1000 1000 1000 1000 1000 1000 1000
Notes1
Prior to 7/1/2013, 5% of members are assumed to retire in any year in which they are eligible for the 25-and-outbenefit, but not otherwise eligible for normal or age-reduced retirement.
Active Member Retirement Per 1,000 Eligible Members
Active Member Retirement Per 1,000 Eligible Members
PwC 8 February 20, 2013

Public School Retirement System of Missouri Exhibit VIPermanent Extension of 2.55% Formula Benefit After 31 Years of Service
Individual Salary Increase Assumptions
Prior to AfterService 2011 Experience Study 2011 Experience Study0 10.25% 10.00%1 9.25% 7.00%2 7.75% 7.00%3 7.75% 7.00%4 7.75% 7.00%5 7.50% 6.80%6 7.25% 6.60%7 7.00% 6.40%8 6.75% 6.20%9 6.50% 6.00%10 6.25% 5.80%11 6.00% 5.60%12 5.75% 5.40%13 5.50% 5.20%14 5.25% 5.00%15 5.00% 5.00%16 5.00% 4.90%17 5.00% 4.90%18 5.00% 4.80%19 5.00% 4.80%20 5.00% 4.70%21 5.00% 4.70%22 5.00% 4.60%23 5.00% 4.60%24 5.00% 4.50%25 5.00% 4.50%26 5.00% 4.40%27 5.00% 4.30%28 5.00% 4.20%29 5.00% 4.10%30 5.00% 4.00%
NotesRates shown above are total assumed increase, including the effects of inflation and real wage growth.
PwC 9 February 20, 2013

Exhibit VIIACTUARIAL ASSUMPTIONS
Inflation
Payroll Growth
Individual Salary Growth
Inflation is assumed to be 2.50% per annum.
Total payroll growth is assumed to be 3.50% per annum, consisting of 2.50% inflation, 0.50% additional inflation due tothe inclusion of health care costs in pension earnings, and 0.50% of real wage growth.
Salaries are assumed to increase each year with general inflation of 2.50%, plus health care inflation of 0.50% (sincehealth care costs are included in pension earnings), plus a longevity adjustment that accounts for merit, promotion, andother real wage growth.
4.90%
4.90%
4.80%
4.80%
4.70%
5.80%
5.60%
5.40%
5.20%
5.00%
5.00%
2.80%
2.60%
2.40%
2.20%
2.00%
2.00%
1.90%
1.90%
1.80%
1.80%
1.70%
10.00%
7.00%
6.80%
6.60%
6.40%
6.20%
6.00%
7.00%
4.00%
3.80%
3.60%
3.40%
3.20%
3.00%
0.50%
0.50%
0.50%
0.50%
0.50%
0.50%
0.50%
0.50%
0.50%
0.50%
0.50%
0.50%
0.50%
0.50%
2.50%
2.50%
2.50%
2.50%
13
14
15
0.50%
0.50%
0.50%
0.50%
11
12
2.50%
2.50%
2.50%
2.50%
2.50%
2.50%
2.50%
16
17
18
19
20
Health CareInflation Longevity
TotalIncrease
1 - 4
5
6
7
8
9
Service
0
GeneralInflation
2.50%
2.50%
2.50%
2.50%
2.50%
2.50%
2.50%
10
Investment Return
It is assumed that investments of the System will return a yield of 8.00% per annum, net of system expenses (investmentand administrative).
4.60%
4.60%
4.50%
4.70%
4.70%
1.20%
1.10%
1.00%
1.50%
1.50%
1.40%
1.30%
1.60%
1.60%
1.70%
1.70%
4.20%
4.10%
4.00%
4.50%
4.40%
4.30%
0.50%
0.50%
0.50%
0.50%
2.50%
2.50%
2.50%
2.50%
2.50%
2.50%
2.50%
2.50%
0.50%
0.50%
0.50%
0.50%
0.50%
28 2.50%
0.50%
0.50%
22
23
24
25
26
27
2.50%
2.50%
20
21
29
30+
PwC10 February 20, 2013

Exhibit VII
Service Retiree, Beneficiary and Surviror Mortality
1.178
4.099
13.715
37.094
113.562
1.492
4.593
15.549
49.322
156.083
50
60
70
80
90
40 0.898 0.509
Active Member Mortality
Mortality Rates for non-disabled retirees and beneficiaries are based on the RP 2000 Mortality Table, set back one yearfor both males and females, then projected to 2016 using Scale AA. Illustrative rates per 1,000 members at various agesare as follows:
Age Male Female
0.1310.24420
0.898 0.171
50 1.492 0.782
60 4.593 2.237
Age Male Female
70 15.549 7.955
30 0.38 0.171
40
Mortality Rates
Mortality Rates for active members are based on the RP 2000 Mortality Table, set back one year for males and six yearsfor females, then projected to 2016 using Scale AA. Illustrative rates per 1,000 members at various ages are as follows:
Cost of Living Adjustments
Cost of living adjustments ("COLA") are assumed to be 2.00% per year and compounded, based on the current policy ofthe Board to grant a 2.00% COLA whenever annual inflation, as measured by the CPI-U index for a fiscal year, increasesbetween 0.00% and 5.00%.
The COLA assumption applies to service retirees and their beneficiaries. The COLA does not apply to the benefits for in-service death payable to spouses (where the spouse is over age 60), and does not apply to the spouse with children pre-retirement death benefit, the dependent children pre-retirement death benefit, or the dependent parent death benefit.The total lifetime COLA cannot exceed 80% of the original benefit. Future COLAs for current benefit recipients reflectactual cumulative adjustments granted at the time of valuation.
237.467
364.617
7.450
11.535
21.839
37.635
72.312
140.049
100
110
22.571
28.975
42.042
62.583
109.372
183.408
344.556
400.000
40
50
60
70
80
90
351.544
Mortality Rates for disabled retirees are based on the RP 2000 Disabled Retiree Mortality Table. Illustrative rates per1,000 members at various ages are as follows:
Disability Retiree Mortality
Age Male Female
113.562
227.712
110
156.083
324.963
400
90
100
PwC11 February 20, 2013

Exhibit VII
Age < = 20 21 22 23 24 25 26 27 28 29 30 > = 31
<= 50 0 0 0 0 0 0 0 0 0 0 200 400
51 0 0 0 0 0 0 0 0 0 200 200 400
52 0 0 0 0 0 0 0 0 200 200 200 400
53 0 0 0 0 0 0 0 300 200 200 200 400
54 0 0 0 0 0 0 300 200 200 200 200 400
55 50 50 50 50 50 400 200 200 200 200 200 400
56 50 50 50 50 400 200 200 200 200 200 200 400
57 50 50 50 400 200 200 200 200 200 200 200 400
58 50 50 400 200 200 200 200 200 200 200 200 400
59 50 400 200 200 200 200 200 200 200 200 200 400
60 150 150 150 150 150 200 200 200 200 200 200 400
61 150 150 150 150 150 200 200 200 200 200 200 400
62 150 150 150 150 150 200 200 200 200 200 200 400
63 150 150 150 150 150 200 200 200 200 200 200 400
64 150 150 150 150 150 200 200 200 200 200 200 400
65 250 250 250 250 250 400 400 400 400 400 400 400
66 250 250 250 250 250 300 300 300 300 300 300 400
67 250 250 250 250 250 300 300 300 300 300 300 400
68 250 250 250 250 250 300 300 300 300 300 300 400
69 250 250 250 250 250 300 300 300 300 300 300 400
>= 70 1000 1000 1000 1000 1000 1000 1000 1000 1000 1000 1000 1000
Age < = 20 21 22 23 24 25 26 27 28 29 30 > = 31
<= 50 0 0 0 0 0 0 0 0 0 0 450 450
51 0 0 0 0 0 0 0 0 0 200 450 450
52 0 0 0 0 0 0 0 0 200 200 450 450
53 0 0 0 0 0 0 0 300 200 200 450 450
Service
Retirement Rates
Service
When the 2.55% Formula benefit is available (and the 25-and-out benefit is not available), retirement is assumed inaccordance with the following rates per 1,000 eligible members:
Without the permanent extension of the 2.55% Formula Factor, after June 30, 2013, retirement is assumed in accordancewith the following rates per 1,000 eligible members:
53 0 0 0 0 0 0 0 300 200 200 450 450
54 0 0 0 0 0 0 300 200 200 200 450 450
55 50 50 50 50 50 400 200 200 200 200 450 450
56 50 50 50 50 400 200 200 200 200 200 450 450
57 50 50 50 400 200 200 200 200 200 200 450 450
58 50 50 400 200 200 200 200 200 200 200 450 450
59 50 400 200 200 200 200 200 200 200 200 450 450
60 150 150 150 150 150 200 200 200 200 200 450 450
61 150 150 150 150 150 200 200 200 200 200 450 450
62 150 150 150 150 150 200 200 200 200 200 450 450
63 150 150 150 150 150 200 200 200 200 200 450 450
64 150 150 150 150 150 200 200 200 200 200 450 450
65 250 250 250 250 250 400 400 400 400 400 450 450
66 250 250 250 250 250 300 300 300 300 300 450 450
67 250 250 250 250 250 300 300 300 300 300 450 450
68 250 250 250 250 250 300 300 300 300 300 450 450
69 250 250 250 250 250 300 300 300 300 300 450 450
>= 70 1000 1000 1000 1000 1000 1000 1000 1000 1000 1000 1000 1000
When the 25-and-out benefit is available, which is assumed to sunset on July 1, 2013, 5% (i.e. 50 of every 1,000) ofmembers who qualify and are not otherwise eligible for retirement are assumed to retire.
PwC12 February 20, 2013
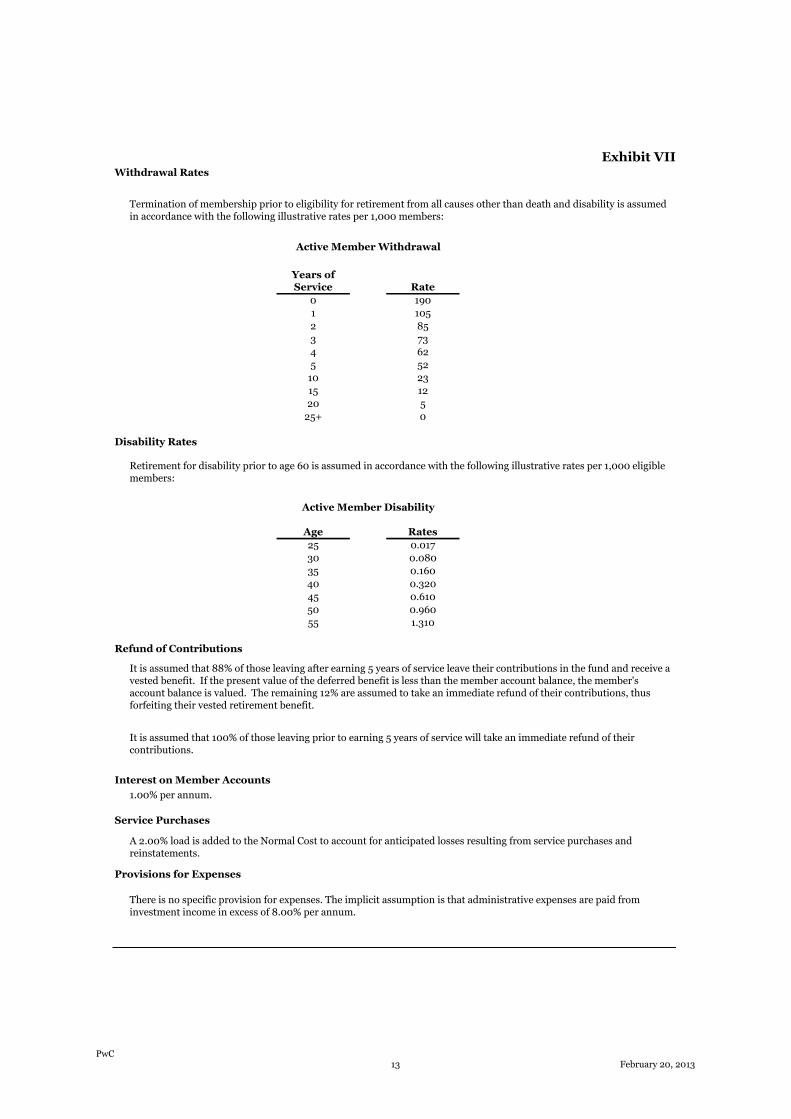
Exhibit VII
Refund of Contributions
1.310
40
45
50
55
0.017
0.080
0.160
0.320
0.610
0.960
Active Member Disability
Age Rates
25
30
35
0
Disability Rates
Retirement for disability prior to age 60 is assumed in accordance with the following illustrative rates per 1,000 eligiblemembers:
25+
62
52
23
12
5
4
5
10
15
20
Active Member Withdrawal
Years ofService
0
1
2
3
Rate
190
105
85
73
Withdrawal Rates
Termination of membership prior to eligibility for retirement from all causes other than death and disability is assumedin accordance with the following illustrative rates per 1,000 members:
Provisions for Expenses
Refund of Contributions
It is assumed that 88% of those leaving after earning 5 years of service leave their contributions in the fund and receive avested benefit. If the present value of the deferred benefit is less than the member account balance, the member'saccount balance is valued. The remaining 12% are assumed to take an immediate refund of their contributions, thusforfeiting their vested retirement benefit.
It is assumed that 100% of those leaving prior to earning 5 years of service will take an immediate refund of theircontributions.
There is no specific provision for expenses. The implicit assumption is that administrative expenses are paid frominvestment income in excess of 8.00% per annum.
Interest on Member Accounts
1.00% per annum.
Service Purchases
A 2.00% load is added to the Normal Cost to account for anticipated losses resulting from service purchases andreinstatements.
PwC13 February 20, 2013

Exhibit VII
The 0.4% load to recognize the subsidy present in the joint and survivor reduction factors calculated without provisionfor cost-of-living adjustments was removed since new operating factors incorporating the 2% COLA assumption havebeen implemented.
Assumed interest on member contributions has been reduced from 2.00% to 1.00%.
All active members under age 50 are assumed to have 2 dependent children. Each child is assumed to receive payments of$860 per month for 18 years if the member is under age 32, and grading down to 0 years if the member is age 50.
Return of Unused Member Account Balance
Under the single life annuity payment option, any unused balance of contributions and interest in the member accountbalance at the time of death is paid in a lump sum to a designated beneficiary. This benefit is approximated with a 5-yearcertain benefit.
Data Assumptions
Members without a date of birth provided are assumed to be 30 years old. Pensionable pay for members who did not earnservice during the past year is assumed to be the greater of the current year’s salary, the previous year’s salary and$10,000. Pensionable pay for other active members is assumed to be the greater of annualized pay and $10,000.
Assumption Changes Since the Prior Valuation
Dependent Assumptions
80% of male members and 70% of female members are assumed to be married.
Beneficiaries are assumed to be of the opposite sex from the member.
Male and Female members are assumed to be 4 years older than their beneficiary.
Survivor Benefits
PwC14 February 20, 2013

Exhibit VII
Acturial Cost Method
The actuarial cost method is Entry Age Normal - Level Percent of Payroll.
The normal cost is calculated separately for each active member and is equal to the level percentage of payrollneeded as an annual contribution from entry age to retirement age to fund projected benefits. The actuarialaccrued liability on any valuation date is the accumulated value of such normal costs from entry age to thevaluation date.
Asset Valuation Method
The Actuarial Value of Assets is a smoothed value of assets. The actuarial value for a year is computed by taking theactuarial value at June 30 of the prior year, subtracting all expenses (including benefit payments), and addingcontributions and expected investment return at 8% of actuarial value of assets. The difference between the actualreturns at market value for the year and expected returns is determined. Twenty percent (20%) of that difference isadded to the actuarial value along with corresponding amounts from each of the prior four years. The ActuarialValue of Assets was reset to market value at June 30, 2003.
Amortization of Unfunded Actuarial Accrued Liability
Gains and losses occurring from census experience different than assumed and assumption changes are amortizedover a 30-year period as a level percent of payroll. A new gain or loss base is established each year based on theadditional gain or loss during that year and that base is amortized over a new 30-year period. The purpose of themethod is to give a smooth progression of the costs from year to year and, at the same time, provide for an orderlyfunding of the unfunded liabilities.
Increases or decreases in the Actuarial Accrued Liability caused by changes in the benefit provisions are amortizedover 20 years, as determined in the 2007 session of the Legislature.
Method Changes Since the Prior Valuation
None
ACTUARIAL METHODS
PwC 15 February 20, 2013

Exhibit VIIIPublic School Retirement System of Missouri
Disclosures
This letter has been prepared pursuant to the engagement letter between PricewaterhouseCoopers LLP and PSRS and PEERS of Missouri,dated October 27, 2008.
In preparing the results presented in this letter, we have relied upon information provided to us by PSRS and PEERS of Missouri regardingplan provisions, plan participants, and benefit payments. While the scope of our engagement did not call for us to perform an audit orindependent verification of this information, we have reviewed this information for reasonableness. The accuracy of the results presented inthis letter is dependent upon the accuracy and completeness of the underlying information.
To the best of our knowledge, the individuals involved in this engagement have no relationship that may impair or appear to impair theobjectivity of our work.
No statement in this letter is intended as a recommendation in favor, or in opposition, of the proposed legislation. Except as otherwisenoted, potential impacts on other benefit plans were not considered.
The calculations are based upon assumptions regarding future events. However, the plan’s long term costs will be determined by actualfuture events, which may differ materially from the assumptions that were made. The calculations are also based upon present and proposedplan provisions that are outlined in the letter. If you have reason to believe that the assumptions that were used are unreasonable, that theplan provisions are incorrectly described, that important plan provisions relevant to this proposal are not described, or that conditions havechanged since the calculations were made, you should contact PSRS and PEERS of Missouri.
In the event that more than one plan change is being considered, it is very important to remember that the results of separate actuarialvaluations cannot generally be added together to produce a correct estimate of the combined effect of all of the changes. The total can beconsiderably greater or less than the sum of the parts due to the interaction of various plan provisions with each other, and with theassumptions that must be used.
This document was not intended or written to be used, and it cannot be used, for the purpose of avoiding U.S. federal, state or local taxpenalties. This includes penalties that may apply if the transaction that is the subject of this document is found to lack economic substanceor fails to satisfy any other similar rule of law. This document has been prepared pursuant to an engagement betweenPricewaterhouseCoopers LLP and PSRS and PEERS of Missouri and is intended solely for the use and benefit of PSRS and PEERS ofMissouri and not for reliance by any other person.
PwC 16 February 20, 2013PwC 16 February 20, 2013

PricewaterhouseCoopers LLP, One North Wacker, Chicago, IL 60606 T: (312) 298 2000, www.pwc.com/us
January 22, 2013 Mr. M. Steve Yoakum Executive Director PSRS and PEERS of Missouri 3210 West Truman Blvd. Jefferson City, MO 65109 Re: Public Education Employee Retirement System of Missouri ("PEERS") Cost Estimate of Proposed Benefit Changes Dear Steve: This letter has been prepared pursuant to the engagement letter dated October 27, 2008, between PricewaterhouseCoopers LLP ("PwC") and the Public School and Public Education Employee Retirement Systems of Missouri ("PSRS and PEERS of Missouri"). As requested, we have estimated the cost impact as of June 30, 2012 of the following proposed benefit change to PEERS of Missouri:
Permanent extension of the "25 & Out" Early Retirement Benefit which allows members of any age to retire after 25 years of service with a reduced benefit.
We estimate that this change would result in an increase to the Actuarial Accrued Liability ("AAL") of approximately $1.5 million, which decreases the funded ratio of the system by 0.03%, and would increase the Annual Required Contribution percentage by 0.01%. Enclosed are four exhibits presenting the results of our analysis as follows:
Exhibit I - Summary impact on the Annual Required Contribution
Exhibit II - Detailed impact to the Funded Status and Annual Required Contribution
Exhibit III - Actuarial assumptions and methods used in our analysis
Exhibit IV - Disclosures relating to our analysis When a member has 25 years of service, the member is at or near the eligibility threshold for unreduced benefits under the "Rule of 80". At most, members are five years away from meeting the eligibility requirement for unreduced benefits under the "30 & Out" benefit. For members with 25 years of service or more, the actuarial present value of a reduced benefit commencing immediately after 25 years of service is nearly the same as the value of an unreduced benefit taken sometime later by delaying retirement until the member meets the requirements of the Rule of 80 or 30 & Out. The advantages of retiring at 25 years of service are that the member receives pension benefits for a longer period of time, the COLA starts earlier, and the member no longer contributes to the system. The disadvantages are that the member gives up future increases in their pension benefit due to service and salary increases, as well as improved subsidy, which can be significant as the member approaches eligibility for the Rule of 80 and 30 & Out. Whether the 25 & Out reduced benefit is more or less valuable than a deferred unreduced benefit depends on how soon after earning 25 years of service the member would be eligible for an unreduced benefit. As such, the results of our analysis are driven by the demographics of the current member population and by the retirement assumption. The experience study completed in 2011 showed that a small percentage of members have elected to take the 25 & Out reduced benefit when eligible. The current assumption is that 5% of members will retire and elect the 25 & Out reduced benefit when eligible. If the benefit is made available to members permanently, the same 5%
2
assumption would apply in future years. See Exhibit III for details of the retirement assumption. Based on this assumption and given the demographics of the active member population as of June 30, 2012, permanent extension of the 25 & Out benefit is expected to be a small cost increase. In addition, please note the following when reviewing the results:
Our analysis was performed by measuring the impact of the change at June 30, 2012, using census data collected from PSRS and PEERS of Missouri as of June 30, 2012. Our estimates do not incorporate the impact of future employees who may become members of PEERS. Please refer to our actuarial valuation report dated October 19, 2012 for a summary of the census data.
The BASELINE results shown in Exhibit I are equal the results of our June 30, 2012 valuation of the system.
Our analysis was performed based on our understanding of the current PEERS benefit provisions as set forth in Chapter 169 of the Missouri Revised Statutes, as well as the modification to those statutes to affect the change described above.
Our analysis does not include any additional administrative cost that may be incurred by PEERS of Missouri to implement this change.
Our analysis is based on the specific assumptions disclosed herein. The result of our analysis is heavily dependent on those assumptions. The actual cost of the proposed benefit change will depend on the actual future experience of plan members.
To the best of our knowledge this actuarial statement is complete and accurate and has been prepared in accordance with generally accepted actuarial principles and practice and with the Actuarial Standards of Practice issued by the Actuarial Standards Board. In our opinion, our calculations also comply with our understanding of the requirements of Missouri state law. The undersigned actuaries are members of the Society of Actuaries and other professional organizations, including the American Academy of Actuaries, and meet the Qualification Standards for Actuaries Issuing Statements of Actuarial Opinion in the United States relating to pension plans. There is no relationship between the PwC practitioners involved in this engagement and PSRS and PEERS of Missouri that may impair our objectivity.
This document was not intended or written to be used, and it cannot be used, for the purpose of avoiding U.S. federal, state, or local tax penalties. This includes penalties that may apply if the transaction that is the subject of this document is found to lack economic substance or fails to satisfy any other similar rule of law. This document has been prepared pursuant to an engagement letter between PSRS and PEERS of Missouri and PwC, and is intended solely for the use and benefits of PSRS and PEERS of Missouri and not for reliance by any other person.
Please call with any questions or if you require additional information.
Sincerely,
Sheldon A. Gamzon, FSA, MAAA Brandon Robertson, ASA, MAAA

Exhibit I
Public Education Employee Retirement System of Missouri
Fiscal Impact of Permanently Extending the 25 & Out Early Retirement Benefit as of June 30, 2012
BASELINEPermanent Extension
of 25 & Out Benefit
Annual Required Contribution
Normal Cost Rate 10.79% 10.79%
Unfunded Actuarial Accrued Liability Amortization Rate 2.78% 2.79%
Annual Required Contribution Rate 13.57% 13.58%
Change in Annual Required Contribution Rate 0.01%
PwC 3 January 22, 2013

Exhibit II
Public Education Employee Retirement System of Missouri
Fiscal Impact of Permanently Extending the 25 & Out Early Retirement Benefit as of June 30, 2012
BASELINEPermanent Extension of
25 & Out Benefit
Funded Status
Actuarial Accrued Liability ("AAL")
Active Members 2,076,085,680 2,077,601,525
Inactive Members 128,720,349 128,720,349
Pay Status Members 1,541,541,277 1,541,541,277
Total Actuarial Accrued Liability ("AAL") $3,746,347,306 $3,747,863,151
% Change 0.04%
Actuarial Value of Assets ("AVA") 3,090,879,968 3,090,879,968
Unfunded Actuarial Accrued Liability (AAL - AVA) $655,467,338 $656,983,183
Funded Percentage (AVA / AAL) 82.50% 82.47%
Change in Funded Percentage -0.03%
Annual Required Contribution
Expected Payroll $1,437,310,138 $1,437,310,138
Normal Cost $146,899,546 $146,984,699
Total Normal Cost With 1.5% Service Purchase Load $149,103,039 $149,189,469
Normal Cost Rate 10.79% 10.79%
Unfunded Actuarial Accrued Liability Amortization $38,433,073 $38,520,665
Unfunded Actuarial Accrued Liability Amortization Rate 2.78% 2.79%
Annual Required Contribution $187,536,112 $187,710,134
Annual Required Contribution Rate 13.57% 13.58%
Change in Annual Required Contribution Rate 0.01%
PwC 4 January 22, 2013

Exhibit III
ACTUARIAL ASSUMPTIONS
Investment Return
It is assumed that investments of the System will return a yield of 8.00% per annum, net of system expenses (investment
and administrative).
Cost of living adjustments ("COLA") are assumed to be 2.00% per year and compounded, based on the current policy of
the Board to grant a 2.00% COLA whenever annual inflation, as measured by the CPI-U index for a fiscal year, increases
between 0.00% and 5.00%.
The COLA assumption applies to service retirees and their beneficiaries. The COLA does not apply to the benefits for in-
service death payable to spouses (where the spouse is over age 60), and does not apply to the spouse with children pre-
retirement death benefit, the dependent children pre-retirement death benefit, or the dependent parent death benefit.
The total lifetime COLA cannot exceed 80% of the original benefit. Future COLAs for current benefit recipients reflect
actual cumulative adjustments granted at the time of valuation.
Inflation
Payroll Growth
Salary and Payroll Increases
Inflation is assumed to be 2.50% per annum.
Total payroll growth is assumed to be 3.75% per annum, consisting of 2.50% inflation, 0.75% additional inflation due to
the inclusion of health care costs in pension earnings, and 0.50% of real wage growth.
5.00%
5.00%
5.35%
5.25%
5.20%
5.15%
5.10%
5.05%
5.95%
5.85%
5.75%
5.65%
5.55%
5.45%
2.70%
2.60%
2.50%
12.00%
7.25%
6.75%
6.50%
6.25%
6.15%
6.05%
Cost of Living Adjustments
2.40%
2.30%
2.20%
1.75%
1.75%
2.10%
2.00%
1.95%
1.90%
1.85%
1.80%
8.75%
4.00%
3.50%
3.25%
3.00%
2.90%
2.80%
0.75%
0.75%
0.75%
0.75%
0.75%
0.75%
0.75%
0.75%
0.75%
0.75%
0.75%
0.75%
0.75%
0.75%
19
20+
0.75%
0.75%
0.75%
0.75%
0.75%
0.75%
0.75%
2.50%
2.50%
2.50%
2.50%
2.50%
2.50%
9
2.50%
2.50%
2.50%
2.50%
2.50%
2.50%
2.50%
2.50%
13
14
15
16
17
18
10
11
12
Health Care
Inflation Longevity
Total
Increase
1
2
3
4
5
6
Service
0
General
Inflation
2.50%
2.50%
2.50%
2.50%
2.50%
2.50%
2.50%
7
8
PwC5 January 22, 2013

Exhibit III
237.467
7.450
11.535
21.839
37.635
72.312
140.049
100
22.571
28.975
42.042
62.583
109.372
183.408
344.556
40
50
60
70
80
90
364.617
Service Retiree, Beneficiary and Surviror Mortality
Mortality Rates for disabled retirees are based on the RP 2000 Disabled Retiree Mortality Table. Illustrative rates per
1,000 members at various ages are as follows:
Disability Retiree Mortality
Age Male Female
1.274
4.665
15.452
41.002
125.502
233.696
110
1.831
5.930
19.292
61.340
187.360
352.933
400.000
50
60
70
80
90
100
40 1.004 0.554
Active Member Mortality
Mortality Rates for non-disabled retirees and beneficiaries are based on the RP 2000 Mortality Table, set forward one
year for males and no setback for females, then projected to 2016 using Scale AA. Illustrative rates per 1,000 members at
various ages are as follows:
Age Male Female
0.1310.24420
0.898 0.342
50 1.492 0.782
60 4.593 2.237
Age Male Female
70 15.549 7.955
30 0.380 0.171
40
Mortality Rates
Mortality Rates for active and inactive members are based on the RP 2000 Mortality Table, set back one year for males
and six years for females, then projected to 2016 using Scale AA. Illustrative rates per 1,000 members at various ages are
as follows:
PwC6 January 22, 2013

Exhibit III
Age < = 20 21 22 23 24 25 26 27 28 29 >= 30
<50 0 0 0 0 0 50 50 50 50 50 150
50 0 0 0 0 0 50 50 50 50 50 250
51 0 0 0 0 0 50 50 50 50 250 150
52 0 0 0 0 0 50 50 50 250 150 150
53 0 0 0 0 0 50 50 250 150 150 150
54 0 0 0 0 0 50 250 150 150 150 150
55 30 30 30 30 30 270 170 170 170 170 170
56 30 30 30 30 130 170 170 170 170 170 170
57 30 30 30 130 30 170 170 170 170 170 170
58 30 30 130 30 30 170 170 170 170 170 170
59 30 130 30 30 30 170 170 170 170 170 170
60 160 160 160 160 160 160 160 160 160 160 160
61 100 100 100 100 100 100 100 100 100 100 100
62 240 240 240 240 240 240 240 240 240 240 240
63 200 200 200 200 200 200 200 200 200 200 200
64 140 140 140 140 140 140 140 140 140 140 140
65 260 260 260 260 260 260 260 260 260 260 260
66 200 200 200 200 200 200 200 200 200 200 200
67 200 200 200 200 200 200 200 200 200 200 200
68 200 200 200 200 200 200 200 200 200 200 200
69 200 200 200 200 200 200 200 200 200 200 200
70 200 200 200 200 200 200 200 200 200 200 200
71 200 200 200 200 200 200 200 200 200 200 200
72 200 200 200 200 200 200 200 200 200 200 200
73 200 200 200 200 200 200 200 200 200 200 200
74 200 200 200 200 200 200 200 200 200 200 200
>=75 1000 1000 1000 1000 1000 1000 1000 1000 1000 1000 1000
Age < = 20 21 22 23 24 25 26 27 28 29 >= 30
<50 0 0 0 0 0 0 0 0 0 0 150
50 0 0 0 0 0 0 0 0 0 0 250
51 0 0 0 0 0 0 0 0 0 250 150
52 0 0 0 0 0 0 0 0 250 150 150
53 0 0 0 0 0 0 0 250 150 150 150
54 0 0 0 0 0 0 250 150 150 150 150
55 30 30 30 30 30 270 170 170 170 170 170
56 30 30 30 30 130 170 170 170 170 170 170
57 30 30 30 130 30 170 170 170 170 170 170
58 30 30 130 30 30 170 170 170 170 170 170
59 30 130 30 30 30 170 170 170 170 170 170
60 160 160 160 160 160 160 160 160 160 160 160
61 100 100 100 100 100 100 100 100 100 100 100
62 240 240 240 240 240 240 240 240 240 240 240
63 200 200 200 200 200 200 200 200 200 200 200
64 140 140 140 140 140 140 140 140 140 140 140
65 260 260 260 260 260 260 260 260 260 260 260
66 200 200 200 200 200 200 200 200 200 200 200
67 200 200 200 200 200 200 200 200 200 200 200
68 200 200 200 200 200 200 200 200 200 200 200
69 200 200 200 200 200 200 200 200 200 200 200
70 200 200 200 200 200 200 200 200 200 200 200
71 200 200 200 200 200 200 200 200 200 200 200
72 200 200 200 200 200 200 200 200 200 200 200
73 200 200 200 200 200 200 200 200 200 200 200
74 200 200 200 200 200 200 200 200 200 200 200
>=75 1000 1000 1000 1000 1000 1000 1000 1000 1000 1000 1000
Service
Retirement Rates
Service
When the 25 & Out Benefit is available, retirement is assumed in accordance with the following rates per 1,000 eligible
members:
Without the permanent extension of the 25 & Out Benefit, after June 30, 2013, retirement is assumed in accordance with
the following rates per 1,000 eligible members:
PwC7 January 22, 2013
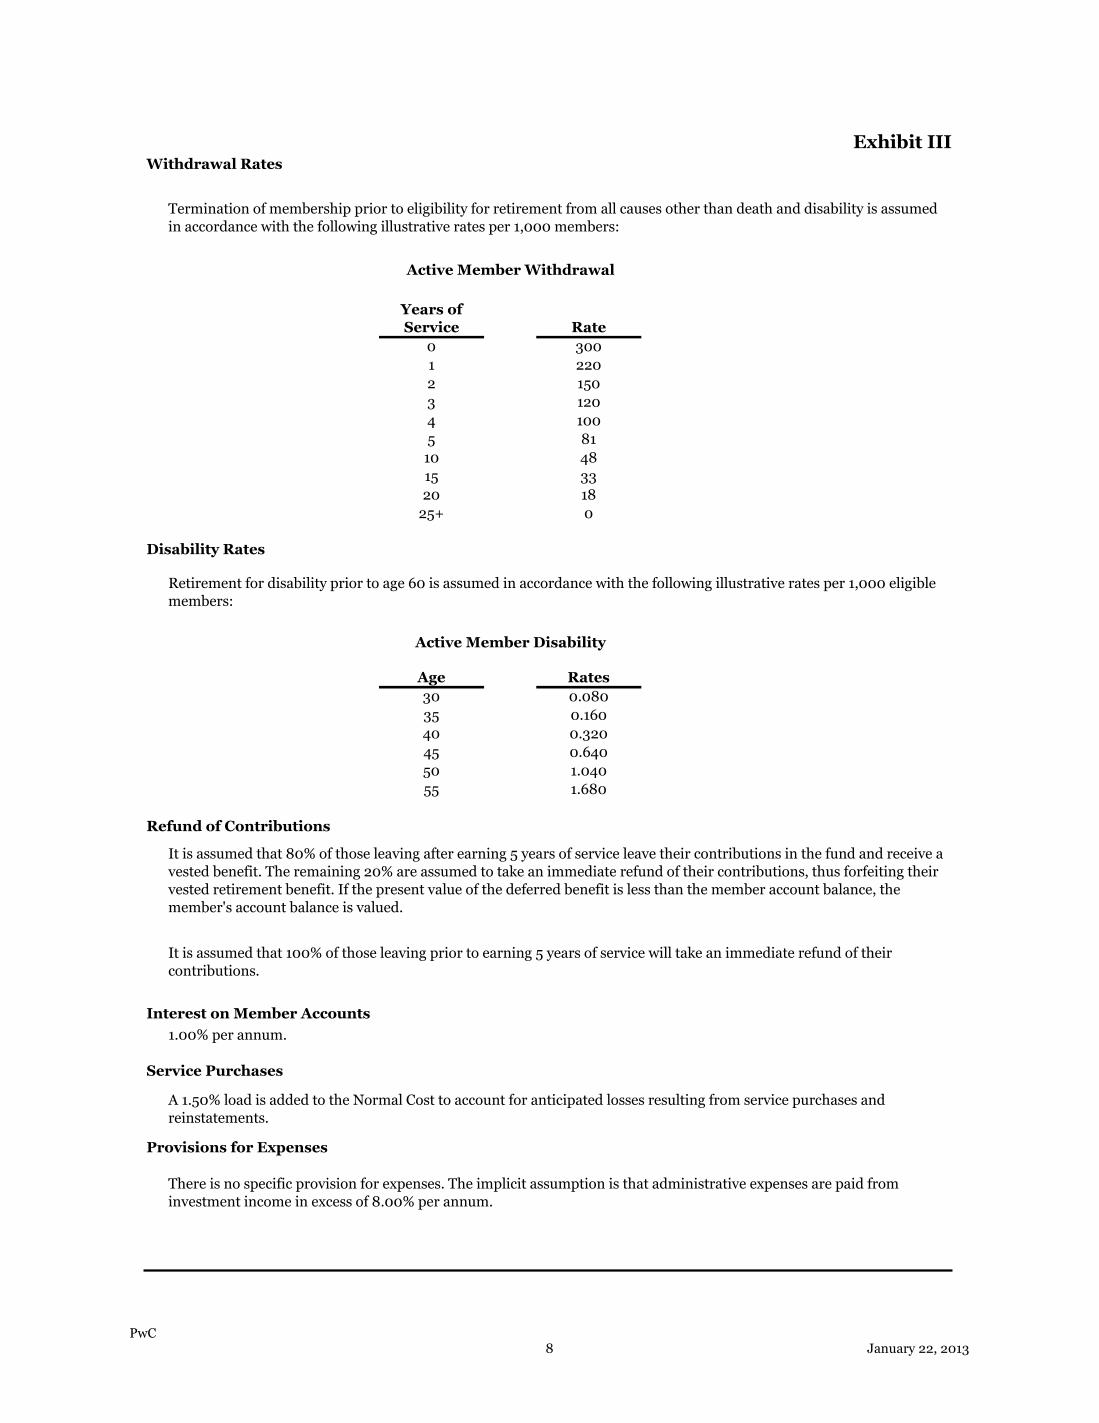
Exhibit III
Provisions for Expenses
Refund of Contributions
It is assumed that 80% of those leaving after earning 5 years of service leave their contributions in the fund and receive a
vested benefit. The remaining 20% are assumed to take an immediate refund of their contributions, thus forfeiting their
vested retirement benefit. If the present value of the deferred benefit is less than the member account balance, the
member's account balance is valued.
It is assumed that 100% of those leaving prior to earning 5 years of service will take an immediate refund of their
contributions.
There is no specific provision for expenses. The implicit assumption is that administrative expenses are paid from
investment income in excess of 8.00% per annum.
1.680
Interest on Member Accounts
1.00% per annum.
Service Purchases
A 1.50% load is added to the Normal Cost to account for anticipated losses resulting from service purchases and
reinstatements.
40
45
50
55
0.080
0.160
0.320
0.640
1.040
Active Member Disability
Age Rates
30
35
0
Disability Rates
Retirement for disability prior to age 60 is assumed in accordance with the following illustrative rates per 1,000 eligible
members:
25+
100
81
48
33
18
4
5
10
15
20
Active Member Withdrawal
Years of
Service
0
1
2
3
Rate
300
220
150
120
Withdrawal Rates
Termination of membership prior to eligibility for retirement from all causes other than death and disability is assumed
in accordance with the following illustrative rates per 1,000 members:
PwC8 January 22, 2013
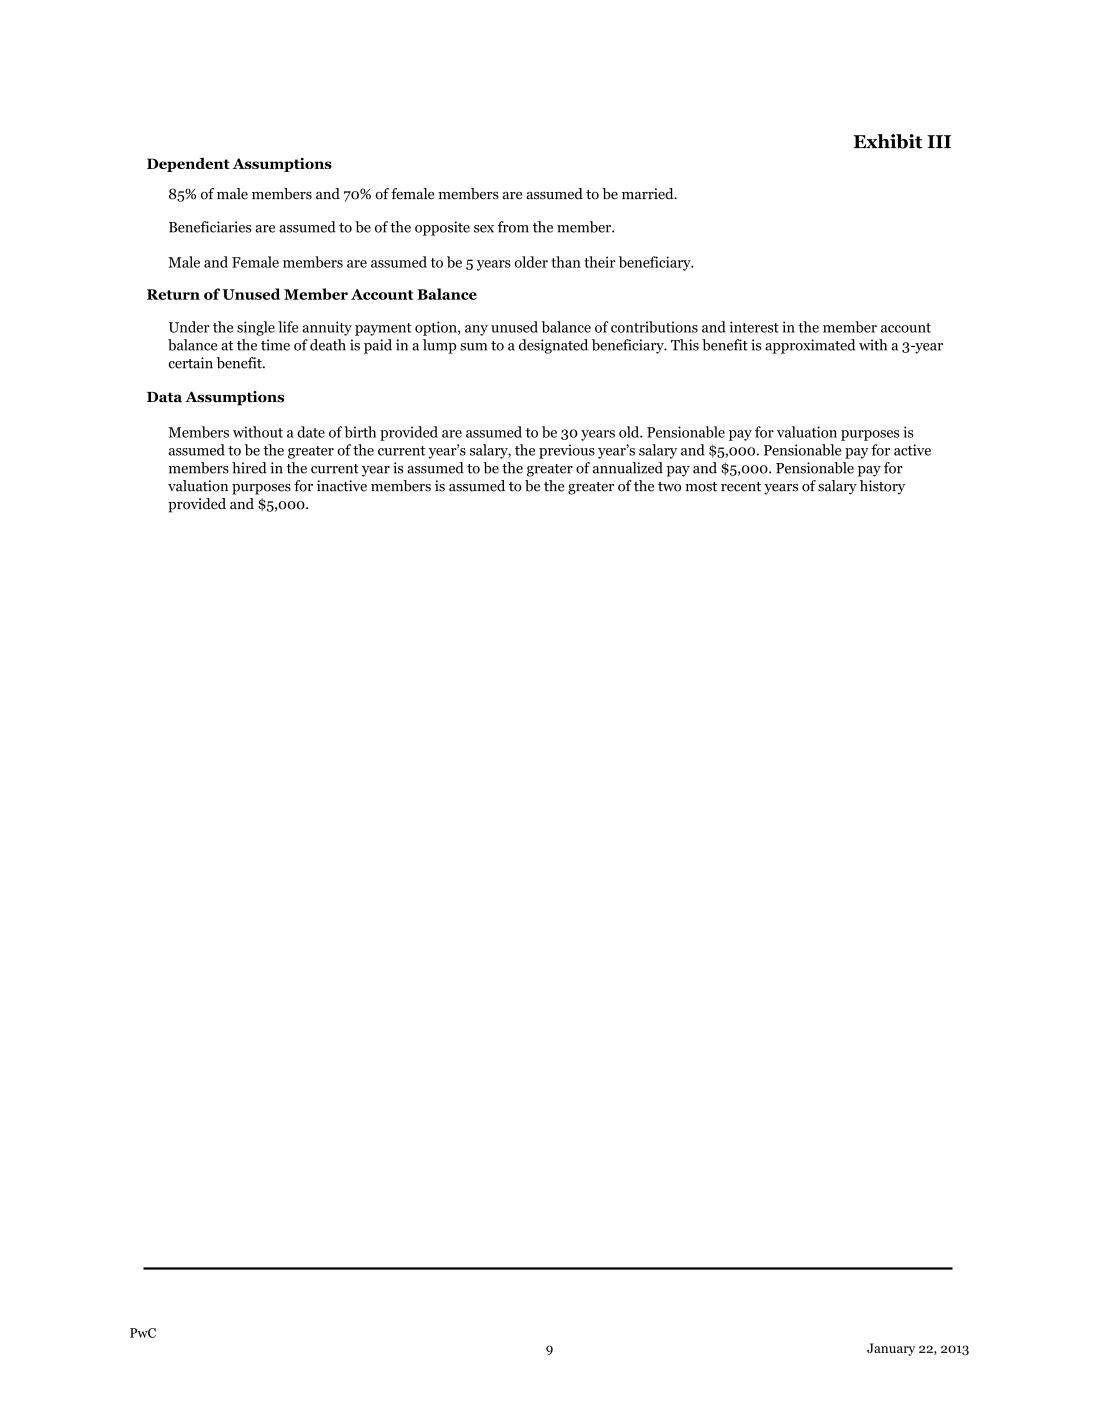
Exhibit III
Return of Unused Member Account Balance
Under the single life annuity payment option, any unused balance of contributions and interest in the member account
balance at the time of death is paid in a lump sum to a designated beneficiary. This benefit is approximated with a 3-year
certain benefit.
Data Assumptions
Dependent Assumptions
85% of male members and 70% of female members are assumed to be married.
Beneficiaries are assumed to be of the opposite sex from the member.
Male and Female members are assumed to be 5 years older than their beneficiary.
Members without a date of birth provided are assumed to be 30 years old. Pensionable pay for valuation purposes is
assumed to be the greater of the current year’s salary, the previous year’s salary and $5,000. Pensionable pay for active
members hired in the current year is assumed to be the greater of annualized pay and $5,000. Pensionable pay for
valuation purposes for inactive members is assumed to be the greater of the two most recent years of salary history
provided and $5,000.
PwC9 January 22, 2013

Exhibit III
Actuarial Cost Method
The actuarial cost method is Entry Age Normal - Level Percent of Payroll.
The normal cost is calculated separately for each active member and is equal to the level percentage of payroll
needed as an annual contribution from entry age to retirement age to fund projected benefits. The actuarial
accrued liability on any valuation date is the accumulated value of such normal costs from entry age to the
valuation date.
Asset Valuation Method
The Actuarial Value of Assets is a smoothed value of assets. The actuarial value for a year is computed by taking
the actuarial value at June 30 of the prior year, subtracting all expenses (including benefit payments), and adding
contributions and expected investment return at 8% of actuarial value of assets. The difference between the actual
returns at market value for the year and expected returns is determined. Twenty percent (20%) of that difference is
added to the actuarial value along with corresponding amounts from each of the prior four years. The Actuarial
Value of Assets was reset to market value at June 30, 2003.
Amortization of Unfunded Actuarial Accrued Liability
Gains and losses occurring from census experience different than assumed and assumption changes are amortized
over a 30-year period as a level percent of payroll. A new gain or loss base is established each year based on the
additional gain or loss during that year and that base is amortized over a new 30-year period. The purpose of the
method is to give a smooth progression of the costs from year to year and, at the same time, provide for an orderly
funding of the unfunded liabilities.
Increases or decreases in the Actuarial Accrued Liability caused by changes in the benefit provisions are amortized
over 20 years, as determined in the 2007 session of the Legislature.
ACTUARIAL METHODS
PwC 10 January 22, 2013

Exhibit IV
Public Education Employee Retirement System of Missouri
Disclosures
This letter has been prepared pursuant to the engagement letter between PricewaterhouseCoopers LLP and PSRS and PEERS of Missouri,
dated October 27, 2008.
In preparing the results presented in this letter, we have relied upon information provided to us by PSRS and PEERS of Missouri regarding
plan provisions, plan participants, and benefit payments. While the scope of our engagement did not call for us to perform an audit or
independent verification of this information, we have reviewed this information for reasonableness. The accuracy of the results presented
in this letter is dependent upon the accuracy and completeness of the underlying information.
To the best of our knowledge, the individuals involved in this engagement have no relationship that may impair or appear to impair the
objectivity of our work.
No statement in this letter is intended as a recommendation in favor, or in opposition, of the proposed legislation. Except as otherwise
noted, potential impacts on other benefit plans were not considered.
The calculations are based upon assumptions regarding future events. However, the plan’s long term costs will be determined by actual
future events, which may differ materially from the assumptions that were made. The calculations are also based upon present and
proposed plan provisions that are outlined in the letter. If you have reason to believe that the assumptions that were used are unreasonable,
that the plan provisions are incorrectly described, that important plan provisions relevant to this proposal are not described, or that
conditions have changed since the calculations were made, you should contact PSRS and PEERS of Missouri.
In the event that more than one plan change is being considered, it is very important to remember that the results of separate actuarial
valuations cannot generally be added together to produce a correct estimate of the combined effect of all of the changes. The total can be
considerably greater or less than the sum of the parts due to the interaction of various plan provisions with each other, and with the
assumptions that must be used.
This document was not intended or written to be used, and it cannot be used, for the purpose of avoiding U.S. federal, state or local tax
penalties. This includes penalties that may apply if the transaction that is the subject of this document is found to lack economic substance
or fails to satisfy any other similar rule of law. This document has been prepared pursuant to an engagement between
PricewaterhouseCoopers LLP and PSRS and PEERS of Missouri and is intended solely for the use and benefit of PSRS and PEERS of
Missouri and not for reliance by any other person.
PwC 11 January 22, 2013