Embed Size (px)
Citation preview
Condensed Interim ReportFor the First Quarter ended
31 December 2017
YEARS1967-2017
Shakarganj Limited
REACHES GOLD
Condensed Interim Report 1Q 2018 1
C O N T E N T S
Vision, Mission and Core Values 3
Company Information 4
Shareholders’ Information 5
Company Profile and Group Structure 6
Directors’ Review 8
Condensed Interim Balance Sheet 10
Condensed Interim Profit and Loss Account 12
Condensed Interim Statement of Comprehensive Income 13
Condensed Interim Cash Flow Statement 14
Condensed Interim Statement of Changes in Equity 15
Notes to the Condensed Interim Financial Information 16

2
Condensed Interim Report 1Q 2018 3
To gain and maintain leadership in our relevant sectors by producingthe best quality products at the lowest possible cost
To give the best returns to our shareholders by optimal allocation ofresources to the products and markets we compete in
To provide the best value products and services to our customersthrough investment in technology, human resources, operational
systems, and processes
To provide the best working environment to our employees andprovide them opportunities to enhance their skills
To work with our farmers, suppliers, and distributors as partners indeveloping their expertise and profitability
To pursue environment friendly policies, and effectively and efficientlyuse all energy resources aiming for zero waste and a clean healthy
environment
To be a socially responsible corporate citizen supporting education,health, environment, and socio economic development of its
community
ViSiON, MiSSiON & CORE ValuES
4
COMPaNY iNFORMaTiON
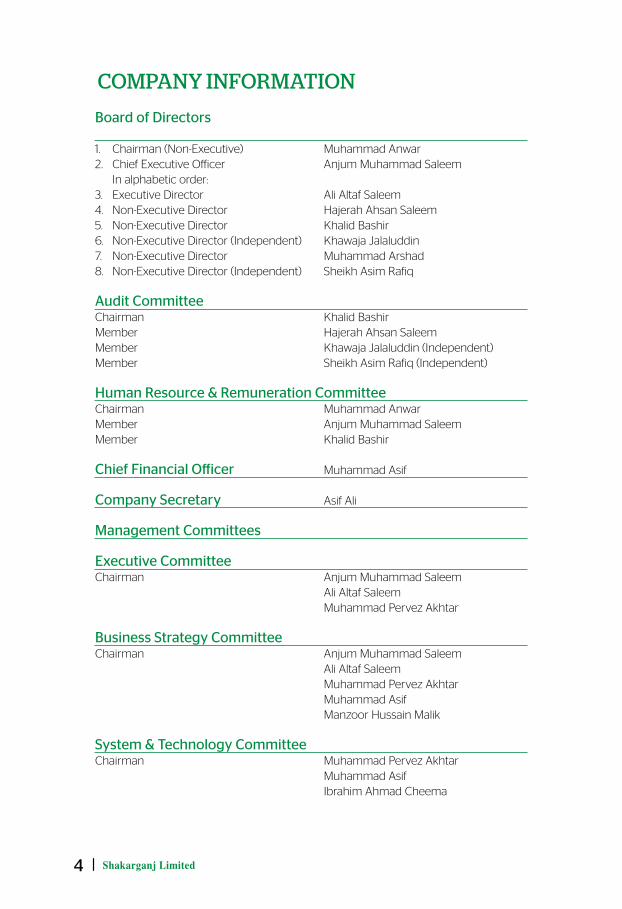
Board of Directors 1. Chairman (Non-Executive) Muhammad Anwar2. Chief Executive Officer Anjum Muhammad Saleem In alphabetic order:3. Executive Director Ali Altaf Saleem4. Non-Executive Director Hajerah Ahsan Saleem 5. Non-Executive Director Khalid Bashir6. Non-Executive Director (Independent) Khawaja Jalaluddin7. Non-Executive Director Muhammad Arshad8. Non-Executive Director (Independent) Sheikh Asim Rafiq
Audit CommitteeChairman Khalid BashirMember Hajerah Ahsan SaleemMember Khawaja Jalaluddin (Independent)Member Sheikh Asim Rafiq (Independent)
Human Resource & Remuneration CommitteeChairman Muhammad Anwar Member Anjum Muhammad SaleemMember Khalid Bashir
Chief Financial Officer Muhammad Asif
Company Secretary Asif Ali
Management Committees
Executive CommitteeChairman Anjum Muhammad Saleem Ali Altaf Saleem Muhammad Pervez Akhtar
Business Strategy CommitteeChairman Anjum Muhammad Saleem Ali Altaf Saleem Muhammad Pervez Akhtar Muhammad Asif Manzoor Hussain Malik System & Technology CommitteeChairman Muhammad Pervez Akhtar Muhammad Asif Ibrahim Ahmad Cheema
Condensed Interim Report 1Q 2018 5
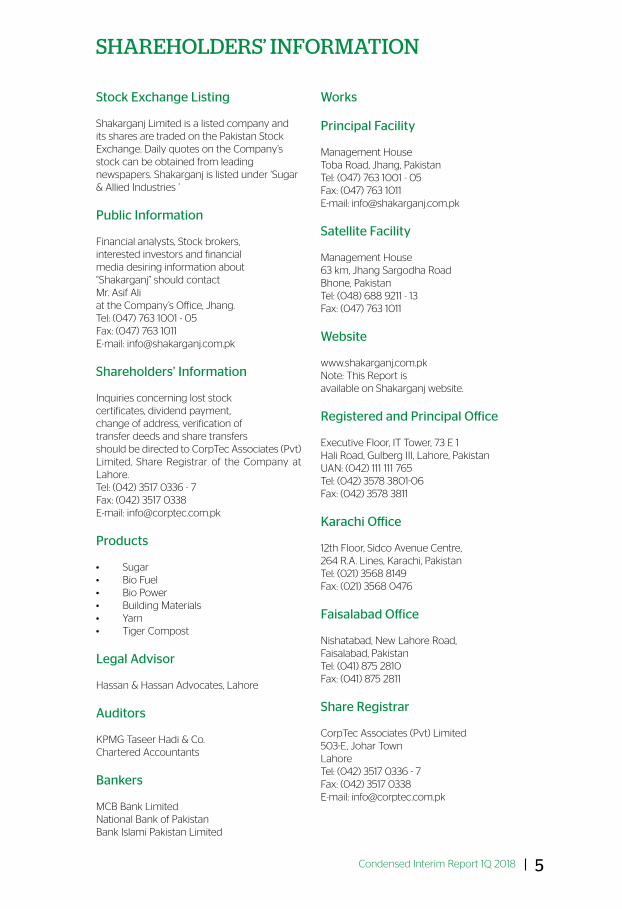
Stock Exchange Listing Shakarganj Limited is a listed company and its shares are traded on the Pakistan Stock Exchange. Daily quotes on the Company’s stock can be obtained from leading newspapers. Shakarganj is listed under ‘Sugar & Allied Industries ’
Public Information
Financial analysts, Stock brokers,interested investors and financialmedia desiring information about“Shakarganj” should contactMr. Asif Aliat the Company’s Office, Jhang.Tel: (047) 763 1001 - 05Fax: (047) 763 1011E-mail: [email protected]
Shareholders’ Information
Inquiries concerning lost stockcertificates, dividend payment,change of address, verification oftransfer deeds and share transfersshould be directed to CorpTec Associates (Pvt) Limited, Share Registrar of the Company at Lahore.Tel: (042) 3517 0336 - 7Fax: (042) 3517 0338E-mail: [email protected]
Products
• Sugar• BioFuel• BioPower• BuildingMaterials• Yarn• TigerCompost
Legal Advisor
Hassan & Hassan Advocates, Lahore
Auditors
KPMG Taseer Hadi & Co.Chartered Accountants
Bankers
MCB Bank LimitedNational Bank of PakistanBank Islami Pakistan Limited
ShaREhOldERS’ iNFORMaTiON
Works
Principal Facility
Management HouseToba Road, Jhang, PakistanTel: (047) 763 1001 - 05Fax: (047) 763 1011E-mail: [email protected]
Satellite Facility
Management House63 km, Jhang Sargodha RoadBhone, PakistanTel: (048) 688 9211 - 13Fax: (047) 763 1011
Website
www.shakarganj.com.pkNote: This Report isavailable on Shakarganj website.
Registered and Principal Office
Executive Floor, IT Tower, 73 E 1Hali Road, Gulberg III, Lahore, PakistanUAN: (042) 111 111 765Tel: (042) 3578 3801-06Fax: (042) 3578 3811
Karachi Office
12th Floor, Sidco Avenue Centre,264 R.A. Lines, Karachi, PakistanTel: (021) 3568 8149Fax: (021) 3568 0476
Faisalabad Office
Nishatabad, New Lahore Road,Faisalabad, PakistanTel: (041) 875 2810Fax: (041) 875 2811
Share Registrar
CorpTec Associates (Pvt) Limited503-E, Johar TownLahoreTel: (042) 3517 0336 - 7Fax: (042) 3517 0338E-mail: [email protected]
6
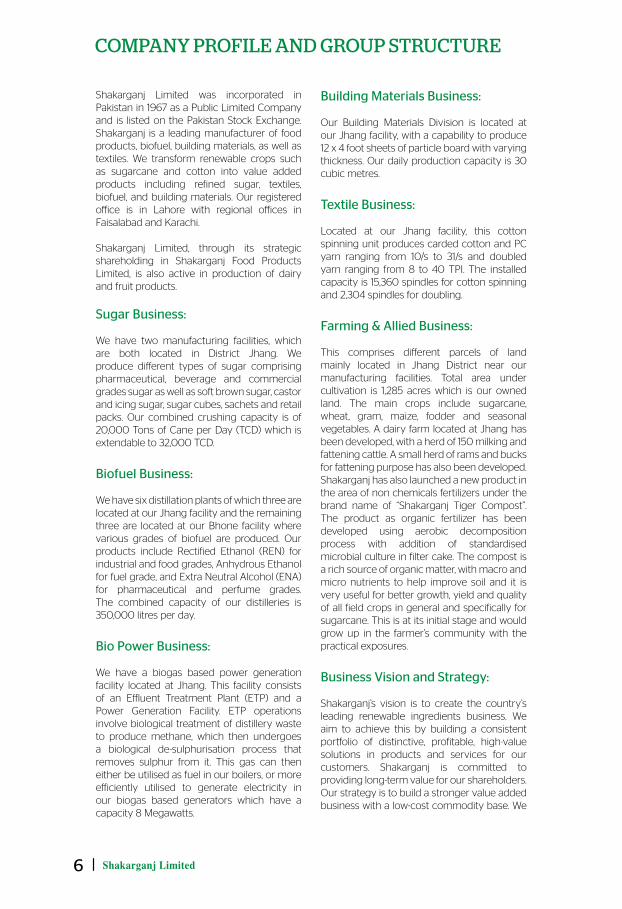
Shakarganj Limited was incorporated in Pakistan in 1967 as a Public Limited Company and is listed on the Pakistan Stock Exchange. Shakarganj is a leading manufacturer of food products, biofuel, building materials, as well as textiles. We transform renewable crops such as sugarcane and cotton into value added products including refined sugar, textiles, biofuel, and building materials. Our registered office is in Lahore with regional offices in Faisalabad and Karachi.
Shakarganj Limited, through its strategic shareholding in Shakarganj Food Products Limited, is also active in production of dairy and fruit products.
Sugar Business:
We have two manufacturing facilities, which are both located in District Jhang. We produce different types of sugar comprising pharmaceutical, beverage and commercial grades sugar as well as soft brown sugar, castor and icing sugar, sugar cubes, sachets and retail packs. Our combined crushing capacity is of 20,000 Tons of Cane per Day (TCD) which is extendable to 32,000 TCD.
Biofuel Business:
We have six distillation plants of which three are located at our Jhang facility and the remaining three are located at our Bhone facility where various grades of biofuel are produced. Our products include Rectified Ethanol (REN) for industrial and food grades, Anhydrous Ethanol for fuel grade, and Extra Neutral Alcohol (ENA) for pharmaceutical and perfume grades. The combined capacity of our distilleries is 350,000 litres per day.
Bio Power Business:
We have a biogas based power generation facility located at Jhang. This facility consists of an Effluent Treatment Plant (ETP) and a Power Generation Facility. ETP operations involve biological treatment of distillery waste to produce methane, which then undergoes a biological de-sulphurisation process that removes sulphur from it. This gas can then either be utilised as fuel in our boilers, or more efficiently utilised to generate electricity in our biogas based generators which have a capacity 8 Megawatts.
Building Materials Business:
Our Building Materials Division is located at our Jhang facility, with a capability to produce 12 x 4 foot sheets of particle board with varying thickness. Our daily production capacity is 30 cubic metres.
Textile Business:
Located at our Jhang facility, this cotton spinning unit produces carded cotton and PC yarn ranging from 10/s to 31/s and doubled yarn ranging from 8 to 40 TPI. The installed capacity is 15,360 spindles for cotton spinning and 2,304 spindles for doubling.
Farming & Allied Business:
This comprises different parcels of land mainly located in Jhang District near our manufacturing facilities. Total area under cultivation is 1,285 acres which is our owned land. The main crops include sugarcane, wheat, gram, maize, fodder and seasonal vegetables. A dairy farm located at Jhang has been developed, with a herd of 150 milking and fattening cattle. A small herd of rams and bucks for fattening purpose has also been developed. Shakarganj has also launched a new product in the area of non chemicals fertilizers under the brand name of “Shakarganj Tiger Compost”. The product as organic fertilizer has been developed using aerobic decomposition process with addition of standardised microbial culture in filter cake. The compost is a rich source of organic matter, with macro and micro nutrients to help improve soil and it is very useful for better growth, yield and quality of all field crops in general and specifically for sugarcane. This is at its initial stage and would grow up in the farmer’s community with the practical exposures.
Business Vision and Strategy:
Shakarganj’s vision is to create the country’s leading renewable ingredients business. We aim to achieve this by building a consistent portfolio of distinctive, profitable, high-value solutions in products and services for our customers. Shakarganj is committed to providing long-term value for our shareholders. Our strategy is to build a stronger value added business with a low-cost commodity base. We
COMPaNY PROFilE aNd gROuP STRuCTuRE
Condensed Interim Report 1Q 2018 7
focus on five key business objectives to deliver consistent growth.
- Serve our Customers:
Delivering excellent customer service is at the core of everything we do. Our aim is to be the partner of choice in our customers’ processes and to help them develop more successful consumer products.
- Operate Efficiently and Safely:
We aim to be the lowest-cost and most efficient producer in all our markets. Through our expertise in high-volume process management, our focus is on technical and manufacturing excellence and the efficient use of services such as logistics and utilities. We are continually working to improve operational efficiency and strive to ensure safe and healthy conditions for everyone at our sites.
- Invest in Long Term Assets and Partnerships:
We continually evaluate investment opportunities that would add strategic value by enabling us to enter new markets or add products, technologies and knowledge more efficiently than we could originally. We also aim to grow our business by forming joint ventures and partnerships to enhance the capabilities of our existing product portfolio. Using alliances
and joint ventures can be an efficient way to lower our cost of investing in new areas and markets, and will help secure access to new and complementary technology and expertise.
- Invest in Technology and People:
We are investing in our research and development capabilities to help us in developing innovative solutions that meet our customers’ product challenges. We are also complementing our own capabilities through business and technology partnerships, and university collaborations. To develop talent, improve leadership and help our employees succeed, we operate various Programmes designed to ensure the right skills at all levels to grow our business.
- Grow the Contribution from Value Added Products:
We are committed to grow the contribution from our value added products. Value added products utilise technology and intellectual property enabling us to obtain a price premium along with sustainable and/or higher margins.
8
I am pleased to present you the un-audited
condensed interim financial information of
the Company for the first quarter ended 31
December 2017.
Financial and Operational Performance:
Summary of operating performance:
As forewarned in our last annual review,
we could not start our crushing campaign
timely due to declined selling prices of sugar
and high procurement rates of sugarcane
fixed by the Government. In view of the
overall surplus sugar scenario in Pakistan
and anticipated sugar production in the
country, the millers were reluctant to start
crushing season as the same is considered
just a loss making exercise. Shakarganj first
time in its history started its crushing in the
last week of December 2017 as compelled
by the Government in view of the high
court order. Unpredictable and impractical
policies of the government pertaining to
sugar exports are creating difficulties for
sugar mills in the shape of sugar glut in the
market and difficulties for farmers as mills
are finding it difficult to pay for sugarcane
supplies.
Biofuel business is already late due to late
start of crushing, but it gained momentum,
prices are reasonable and there is a good
margin in this business. We are hopeful
that the Company will meet its production
targets for the Biofuel Division. In view of
our core business situation and delaying
start as discussed above, the Company
incurred a gross loss of Rs. 307 million
compared to a gross profit of Rs. 139 million
in the corresponding period last year. The
Company incurred an overall after-tax loss
of Rs. 390 million as compared to after
tax profit of Rs. 102 million in Q1FY2017.
However, improvements recently in global
bio fuel prices, coupled with falling molasses
prices, we hope that your Company would
be able to capture the momentum in bio
fuel business and will be back on track in
remaining part of fiscal 2018.
Business Segments:
Sugar Division:
Due to high cost of sugarcane compared to
sugar selling prices, the crushing campaign
was started very late (25 December 2017)
and the production of sugar was still in
start-up phase on 31 December. The Sugar
Divisioncrushed62,064MT(1QFY17:552,132
MT) of sugarcane to produce 2,481 MT
(1QFY17:46,205MT)ofsugaratanaverage
recovery rateof8.26percent (1QFY17: 8.79
percent) resulting in a 95 percent decrease
in sugar production.
Biofuel Division:
The production of this division increased
to 4.62 million litres (1QFY17: 1.75 million
litres). During the period under review, the
performance of Biofuel Division was good
and the trend was improving in terms of
production and profitability. However, delay
in crushing season has the impact on overall
raw material scenario in the area. During the
period, exports accounted for 90.4 percent
of total bio fuel sales.
Bio Power Division:
The Bio Power Division was not operative
due to non-availability of raw material as well
as due to heavy repair and maintenance
involved to restart the power generation.
Therefore, there was no bio power
generationaswasthecasein1QFY17.
diRECTORS’ REViEw
Condensed Interim Report 1Q 2018 9
Building Materials Division:
In view of delay in crushing campaign
and non-availability of surplus bagasse,
the production of this division could not
be started yet as was the case in 1QFY17.
The production is expected to start as
the crushing season moves on with the
availability of surplus bagasse.
Textile Division:
Yarn production increased to 943,261
kg (1QFY17: 919,629 kg). The increase in
production was mainly attributable to lower
load shedding days during the current
period compared to corresponding period.
Outlook:
The management is confident for further
improvements in biofuel business in the
remaining period of fiscal year 2018. As the
future outlook of our distilleries operation
depends on continuous availability of
good quality molasses, the management is
striving to add bulk quantity of molasses at
reasonable cost to create enough margins
for healthy bottom line. Sugar business
outlook is dependent of government
policies and sugar selling prices. However,
the management would try its level best to
achieve better results in this segment. The
Textile Division performance is expected to
improve in view of the margin available. The
Company remains committed to its best
efforts to keep the operational profitability
as achieved in last year as well as to improve
further its overall liquidity scenario.
On behalf of the Board
Anjum Muhammad Saleem
Chief Executive Officer
Ali Altaf Saleem
Director
Date: 30 January 2018
10
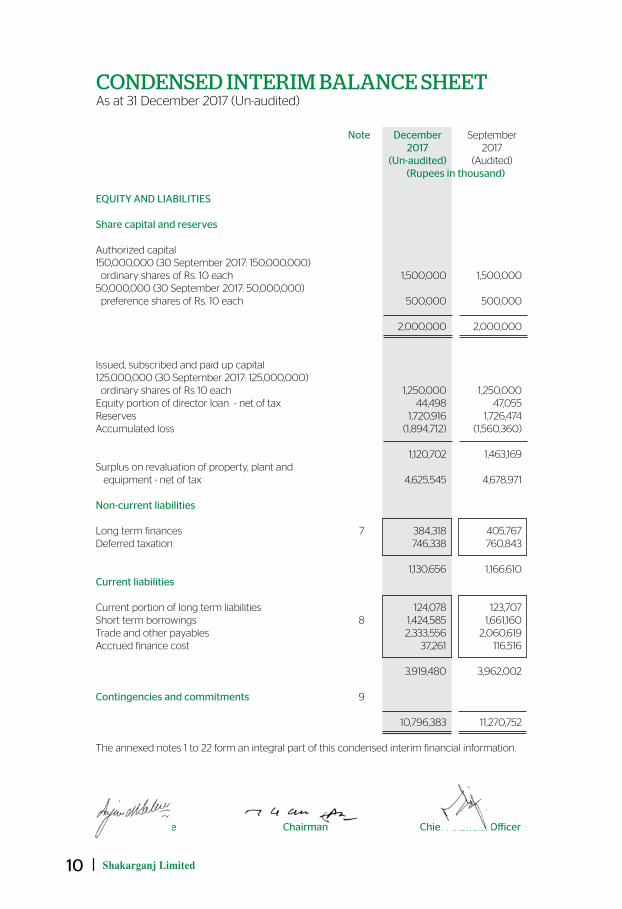
CONdENSEd iNTERiM BalaNCE ShEETS AT As at 31 December 2017 (Un-audited) 31 DECEMBER 2017 (UN-AUDITED)
Note December September 2017 2017 (Un-audited) (Audited) (Rupees in thousand)
EQUITY AND LIABILITIES Share capital and reserves Authorized capital 150,000,000 (30 September 2017: 150,000,000) ordinary shares of Rs. 10 each 1,500,000 1,500,000 50,000,000 (30 September 2017: 50,000,000) preference shares of Rs. 10 each 500,000 500,000
2,000,000 2,000,000 Issued, subscribed and paid up capital 125,000,000 (30 September 2017: 125,000,000) ordinary shares of Rs 10 each 1,250,000 1,250,000 Equity portion of director loan - net of tax 44,498 47,055 Reserves 1,720,916 1,726,474 Accumulated loss (1,894,712) (1,560,360)
1,120,702 1,463,169 Surplus on revaluation of property, plant and equipment - net of tax 4,625,545 4,678,971 Non-current liabilities Long term finances 7 384,318 405,767 Deferred taxation 746,338 760,843
1,130,656 1,166,610 Current liabilities Current portion of long term liabilities 124,078 123,707 Short term borrowings 8 1,424,585 1,661,160 Trade and other payables 2,333,556 2,060,619 Accrued finance cost 37,261 116,516
3,919,480 3,962,002 Contingencies and commitments 9 10,796,383 11,270,752 The annexed notes 1 to 22 form an integral part of this condensed interim financial information.
Chief Executive Chairman Chief Financial Officer
Condensed Interim Report 1Q 2018 11
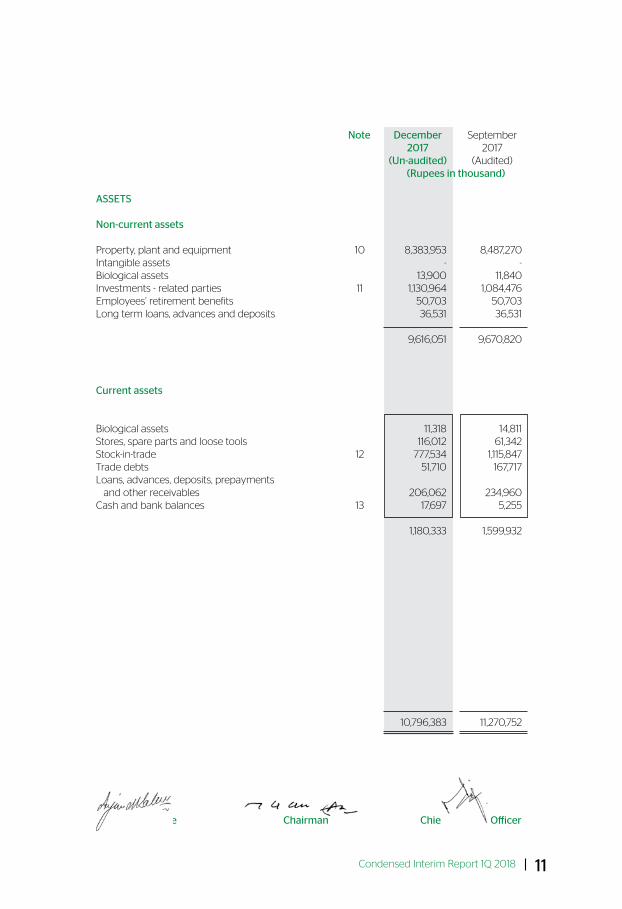
Note December September 2017 2017 (Un-audited) (Audited) (Rupees in thousand)
ASSETS Non-current assets Property, plant and equipment 10 8,383,953 8,487,270 Intangible assets - - Biological assets 13,900 11,840 Investments - related parties 11 1,130,964 1,084,476 Employees’ retirement benefits 50,703 50,703 Long term loans, advances and deposits 36,531 36,531 9,616,051 9,670,820 Current assets Biological assets 11,318 14,811 Stores, spare parts and loose tools 116,012 61,342 Stock-in-trade 12 777,534 1,115,847 Trade debts 51,710 167,717 Loans, advances, deposits, prepayments and other receivables 206,062 234,960 Cash and bank balances 13 17,697 5,255 1,180,333 1,599,932
10,796,383 11,270,752
Chief Executive Chairman Chief Financial Officer
12
CONdENSEd iNTERiM PROFiT aNd lOSS aCCOuNTFor the First Quarter Ended 31 December 2017 (Un-Audited)
December December 2017 2016 Note (Rupees in thousand)
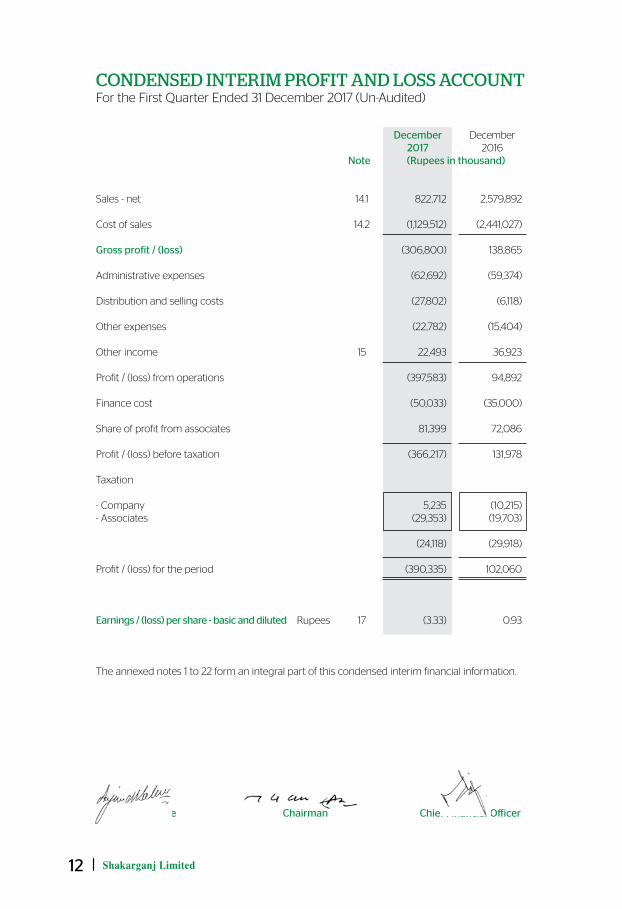
Sales - net 14.1 822,712 2,579,892 Cost of sales 14.2 (1,129,512) (2,441,027) Gross profit / (loss) (306,800) 138,865 Administrative expenses (62,692) (59,374) Distribution and selling costs (27,802) (6,118) Other expenses (22,782) (15,404) Other income 15 22,493 36,923 Profit / (loss) from operations (397,583) 94,892 Finance cost (50,033) (35,000) Share of profit from associates 81,399 72,086 Profit / (loss) before taxation (366,217) 131,978 Taxation - Company 5,235 (10,215)- Associates (29,353) (19,703)
(24,118) (29,918) Profit / (loss) for the period (390,335) 102,060 Earnings / (loss) per share - basic and diluted Rupees 17 (3.33) 0.93 The annexed notes 1 to 22 form an integral part of this condensed interim financial information.
Chief Executive Chairman Chief Financial Officer
Condensed Interim Report 1Q 2018 13
CONdENSEd iNTERiM STaTEMENT OF COMPREhENSiVE iNCOMEFFor the First Quarter Ended 31 December 2017 (Un-Audited)
December December 2017 2016 (Rupees in thousand)
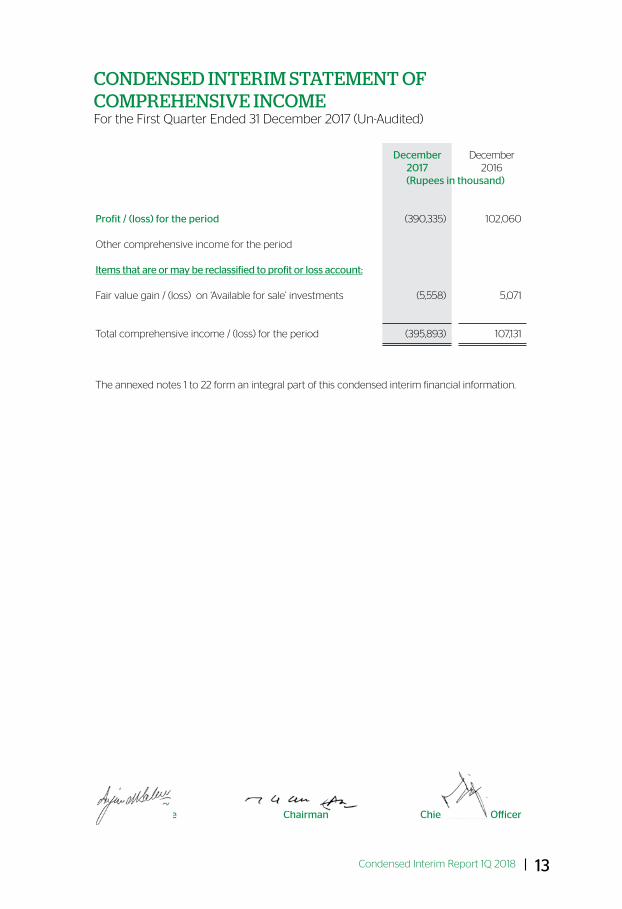
Profit / (loss) for the period (390,335) 102,060 Other comprehensive income for the period Items that are or may be reclassified to profit or loss account: Fair value gain / (loss) on ‘Available for sale’ investments (5,558) 5,071 Total comprehensive income / (loss) for the period (395,893) 107,131 The annexed notes 1 to 22 form an integral part of this condensed interim financial information.
Chief Executive Chairman Chief Financial Officer
14
CONdENSEd iNTERiM CaSh FlOw STaTEMENTFor the First Quarter Ended 31 December 2017 (Un-Audited)
December December 2017 2016 Note (Rupees in thousand)
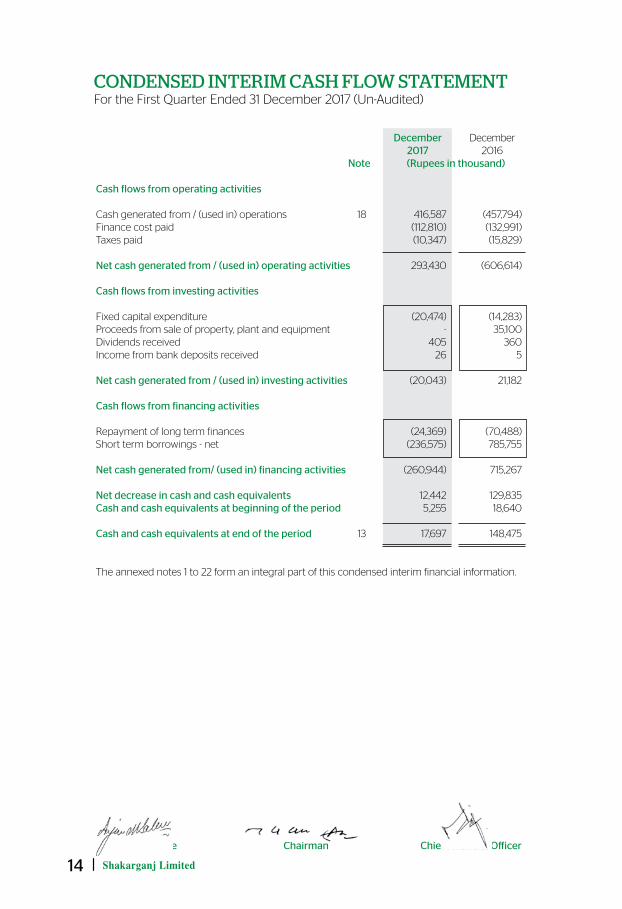
Cash flows from operating activities Cash generated from / (used in) operations 18 416,587 (457,794)Finance cost paid (112,810) (132,991)Taxes paid (10,347) (15,829) Net cash generated from / (used in) operating activities 293,430 (606,614) Cash flows from investing activities Fixed capital expenditure (20,474) (14,283)Proceeds from sale of property, plant and equipment - 35,100 Dividends received 405 360 Income from bank deposits received 26 5 Net cash generated from / (used in) investing activities (20,043) 21,182 Cash flows from financing activities Repayment of long term finances (24,369) (70,488)Short term borrowings - net (236,575) 785,755 Net cash generated from/ (used in) financing activities (260,944) 715,267 Net decrease in cash and cash equivalents 12,442 129,835 Cash and cash equivalents at beginning of the period 5,255 18,640
Cash and cash equivalents at end of the period 13 17,697 148,475 The annexed notes 1 to 22 form an integral part of this condensed interim financial information.
Chief Executive Chairman Chief Financial Officer
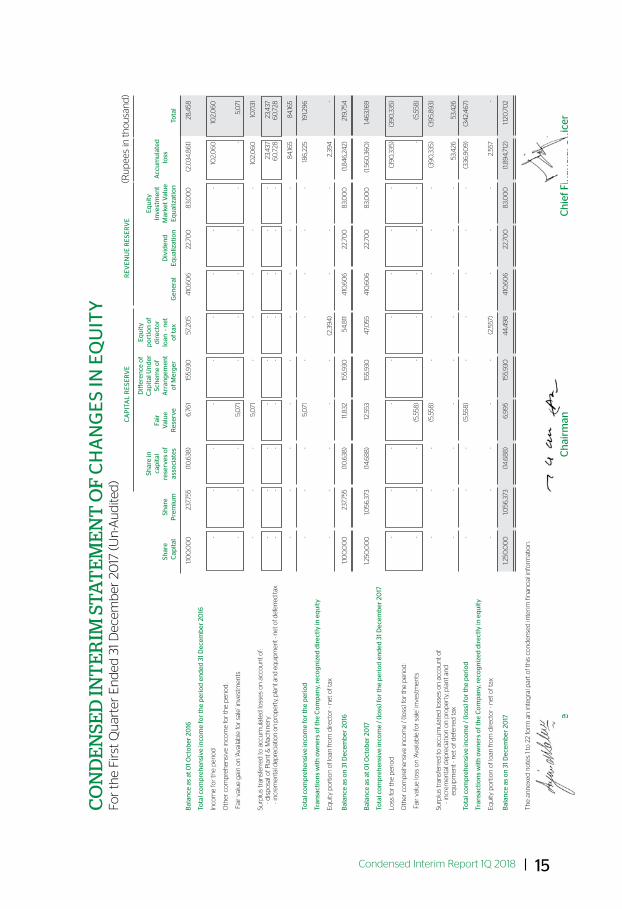
Condensed Interim Report 1Q 2018 15
CO
Nd
EN
SEd
iNT
ER
iM S
Ta
TE
ME
NT
OF
CH
AN
GE
S IN
EQ
UIT
YFo
r th
e Fi
rst
Qu
arte
r E
nd
ed 3
1 Dec
emb
er 2
017
(Un
-Au
dite
d)
C
AP
ITA
L R
ESE
RV
E
RE
VE
NU
E R
ESE
RV
E
Diff
eren
ce o
f Eq
uit
y
Shar
e in
Cap
ital
Un
der
p
ort
ion
of
Equ
ity
cap
ital
Fa
ir
Sch
eme
of
dir
ecto
r
In
vest
men
t A
ccu
mu
late
d
Shar
e Sh
are
rese
rves
of
Val
ue
Arr
ang
emen
t lo
an -
net
Div
iden
d
Mar
ket V
alu
e l
oss
C
apit
al
Pre
miu
m
asso
ciat
es
Res
erve
o
f Mer
ger
o
f tax
G
ener
al
Equ
aliz
atio
n
Equ
aliz
atio
n
To
tal
Bal
ance
as
at 0
1 O
cto
ber
20
16
1,10
0,0
00
2
37,7
55
(10
,638
) 6
,76
1 15
5,9
30
57,
205
4
10,6
06
2
2,70
0
83,
00
0
(2,0
34,8
61)
2
8,4
58
Tota
l co
mp
reh
ensi
ve in
com
e fo
r th
e p
erio
d e
nd
ed 3
1 D
ecem
ber
20
16
Inco
me
for
the
per
iod
-
-
-
-
-
-
-
-
-
102,
06
0
102,
06
0
Oth
er c
om
pre
hen
sive
inco
me
for
the
per
iod
:
F
air
valu
e g
ain
on
‘Ava
ilab
le fo
r sa
le’ i
nve
stm
ents
-
-
-
5
,071
-
-
-
-
-
-
5,0
71
-
-
-
5,0
71
-
-
-
-
-
102,
06
0
107,1
31
Surp
lus
tran
sfer
red
to a
ccu
mu
late
d lo
sses
on
acc
ou
nt
of:
-
dis
po
sal o
f Pla
nt
& M
ach
iner
y -
-
-
-
-
-
-
-
-
2
3,4
37
23,
437
- in
crem
enta
l dep
reci
atio
n on
pro
pert
y, p
lant
and
equ
ipm
ent -
net
of d
efer
red
tax
-
-
-
-
-
-
-
-
-
60
,728
6
0,7
28
-
-
-
-
-
-
-
-
-
84
,165
8
4,16
5
Tota
l co
mp
reh
ensi
ve in
com
e fo
r th
e p
erio
d
-
-
-
5,0
71
-
-
-
-
-
186
,225
19
1,29
6
Tran
sact
ion
s w
ith
ow
ner
s o
f th
e C
om
pan
y, r
eco
gn
ized
dir
ectl
y in
eq
uit
y
Eq
uity
po
rtio
n o
f lo
an fr
om
dire
cto
r - n
et o
f tax
-
-
-
-
-
(2
,39
4)
-
-
-
2,3
94
-
Bal
ance
as
on
31
Dec
emb
er 2
016
1,
100
,00
0
237
,755
(1
0,6
38)
11,8
32
155,
930
5
4,8
11
410
,60
6
22,
700
8
3,0
00
(1
,84
6,2
42)
2
19,7
54
Bal
ance
as
at 0
1 O
cto
ber
20
17
1,25
0,0
00
1,
056
,373
(1
4,6
88
) 12
,553
15
5,9
30
47,0
55
410
,60
6
22,
700
8
3,0
00
(1
,56
0,3
60
) 1,
46
3,16
9
Tota
l co
mp
reh
ensi
ve in
com
e / (
loss
) fo
r th
e p
erio
d e
nd
ed 3
1 D
ecem
ber
20
17
Loss
for
the
per
iod
-
-
-
-
-
-
-
-
-
(39
0,3
35)
(39
0,3
35)
Oth
er c
om
pre
hen
sive
inco
me
/ (lo
ss) f
or
the
per
iod
:
F
air
valu
e lo
ss o
n ‘A
vaila
ble
for
sale
’ in
vest
men
ts
-
-
-
(5,5
58)
-
-
-
-
-
-
(5
,558
)
-
-
-
(5
,558
) -
-
-
-
-
(3
90
,335
) (3
95,
89
3)Su
rplu
s tr
ansf
erre
d to
acc
um
ula
ted
loss
es o
n a
cco
un
t o
f
- in
crem
enta
l dep
reci
atio
n o
n p
rop
erty
, pla
nt
and
equ
ipm
ent
- net
of d
efer
red
tax
-
-
-
-
-
-
-
-
-
5
3,4
26
53,
426
To
tal c
om
pre
hen
sive
inco
me
/ (lo
ss) f
or
the
per
iod
-
-
-
(5
,558
) -
-
-
-
-
(3
36,9
09
) (3
42,
46
7)
Tr
ansa
ctio
ns
wit
h o
wn
ers
of t
he
Co
mp
any,
rec
og
niz
ed d
irec
tly
in e
qu
ity
Equ
ity p
ort
ion
of l
oan
fro
m d
irect
or
- net
of t
ax
-
-
-
-
-
(2,5
57)
-
-
-
2,5
57
-
B
alan
ce a
s o
n 3
1 D
ecem
ber
20
17
1,25
0,0
00
1,
056
,373
(1
4,6
88
) 6
,99
5
155,
930
4
4,4
98
4
10,6
06
2
2,70
0
83,
00
0
(1,8
94
,712
) 1,
120
,70
2
T
he
ann
exed
no
tes
1 to
22
form
an
inte
gra
l par
t o
f th
is c
on
den
sed
inte
rim
fin
anci
al in
form
atio
n.
(Ru
pee
s in
th
ou
san
d)
C
hie
f Exe
cuti
ve
Ch
airm
an
Ch
ief F
inan
cial
Off
icer
16
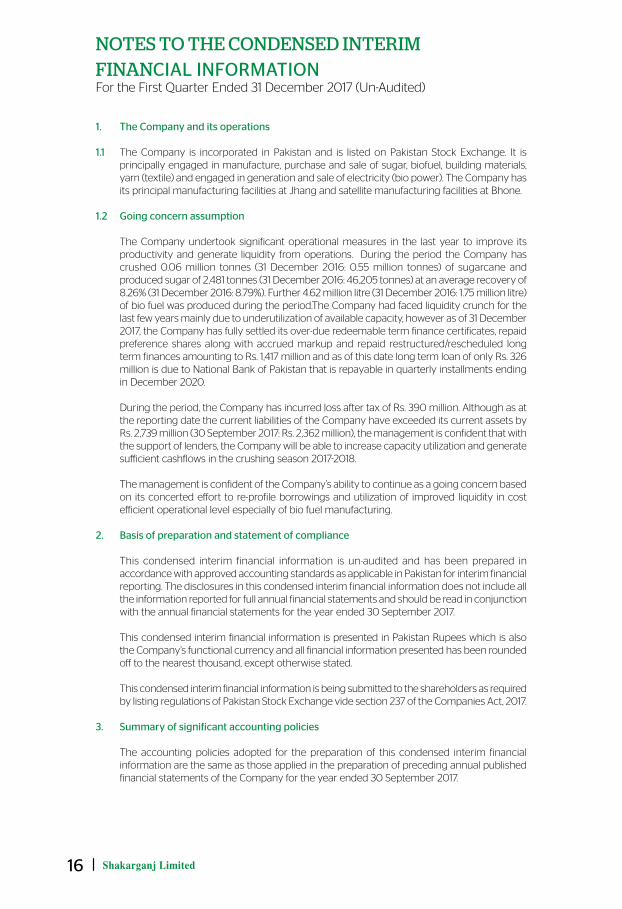
NOTES TO ThE CONdENSEd iNTERiM FiNaNCIAL INFORMATIONFor the First Quarter Ended 31 December 2017 (Un-Audited)
1. The Company and its operations 1.1 The Company is incorporated in Pakistan and is listed on Pakistan Stock Exchange. It is
principally engaged in manufacture, purchase and sale of sugar, biofuel, building materials, yarn (textile) and engaged in generation and sale of electricity (bio power). The Company has its principal manufacturing facilities at Jhang and satellite manufacturing facilities at Bhone.
1.2 Going concern assumption The Company undertook significant operational measures in the last year to improve its
productivity and generate liquidity from operations. During the period the Company has crushed 0.06 million tonnes (31 December 2016: 0.55 million tonnes) of sugarcane and produced sugar of 2,481 tonnes (31 December 2016: 46,205 tonnes) at an average recovery of 8.26% (31 December 2016: 8.79%). Further 4.62 million litre (31 December 2016: 1.75 million litre) of bio fuel was produced during the period.The Company had faced liquidity crunch for the last few years mainly due to underutilization of available capacity, however as of 31 December 2017, the Company has fully settled its over-due redeemable term finance certificates, repaid preference shares along with accrued markup and repaid restructured/rescheduled long term finances amounting to Rs. 1,417 million and as of this date long term loan of only Rs. 326 million is due to National Bank of Pakistan that is repayable in quarterly installments ending in December 2020.
During the period, the Company has incurred loss after tax of Rs. 390 million. Although as at
the reporting date the current liabilities of the Company have exceeded its current assets by Rs. 2,739 million (30 September 2017: Rs. 2,362 million), the management is confident that with the support of lenders, the Company will be able to increase capacity utilization and generate sufficient cashflows in the crushing season 2017-2018.
The management is confident of the Company’s ability to continue as a going concern based
on its concerted effort to re-profile borrowings and utilization of improved liquidity in cost efficient operational level especially of bio fuel manufacturing.
2. Basis of preparation and statement of compliance This condensed interim financial information is un-audited and has been prepared in
accordance with approved accounting standards as applicable in Pakistan for interim financial reporting. The disclosures in this condensed interim financial information does not include all the information reported for full annual financial statements and should be read in conjunction with the annual financial statements for the year ended 30 September 2017.
This condensed interim financial information is presented in Pakistan Rupees which is also
the Company’s functional currency and all financial information presented has been rounded off to the nearest thousand, except otherwise stated.
This condensed interim financial information is being submitted to the shareholders as required
by listing regulations of Pakistan Stock Exchange vide section 237 of the Companies Act, 2017. 3. Summary of significant accounting policies The accounting policies adopted for the preparation of this condensed interim financial
information are the same as those applied in the preparation of preceding annual published financial statements of the Company for the year ended 30 September 2017.
Condensed Interim Report 1Q 2018 17
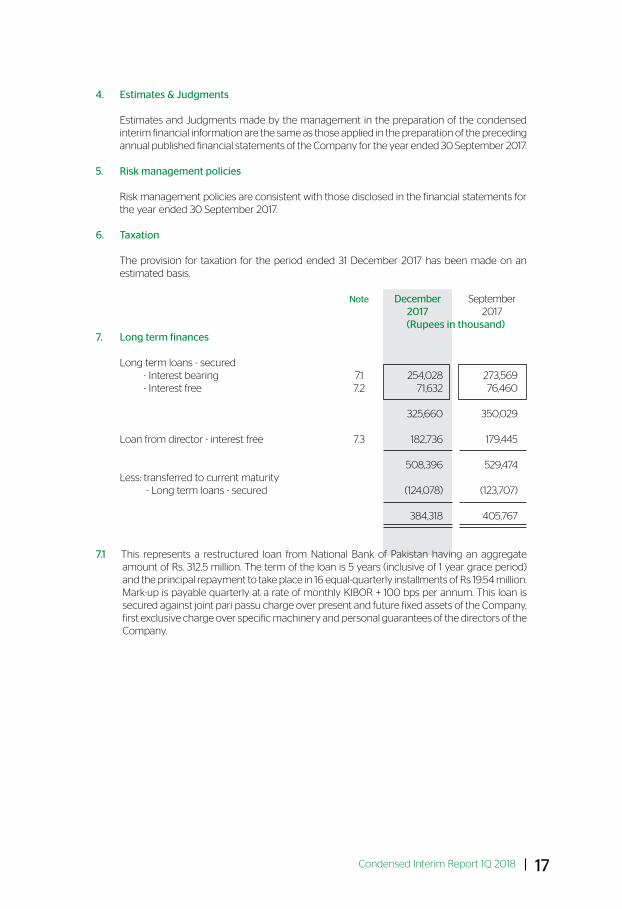
4. Estimates & Judgments Estimates and Judgments made by the management in the preparation of the condensed
interim financial information are the same as those applied in the preparation of the preceding annual published financial statements of the Company for the year ended 30 September 2017.
5. Risk management policies Risk management policies are consistent with those disclosed in the financial statements for
the year ended 30 September 2017. 6. Taxation The provision for taxation for the period ended 31 December 2017 has been made on an
estimated basis.
Note December September 2017 2017 (Rupees in thousand)7. Long term finances Long term loans - secured - Interest bearing 7.1 254,028 273,569 - Interest free 7.2 71,632 76,460
325,660 350,029 Loan from director - interest free 7.3 182,736 179,445 508,396 529,474 Less: transferred to current maturity - Long term loans - secured (124,078) (123,707) 384,318 405,767
7.1 This represents a restructured loan from National Bank of Pakistan having an aggregate amount of Rs. 312.5 million. The term of the loan is 5 years (inclusive of 1 year grace period) and the principal repayment to take place in 16 equal-quarterly installments of Rs 19.54 million. Mark-up is payable quarterly at a rate of monthly KIBOR + 100 bps per annum. This loan is secured against joint pari passu charge over present and future fixed assets of the Company, first exclusive charge over specific machinery and personal guarantees of the directors of the Company.
18
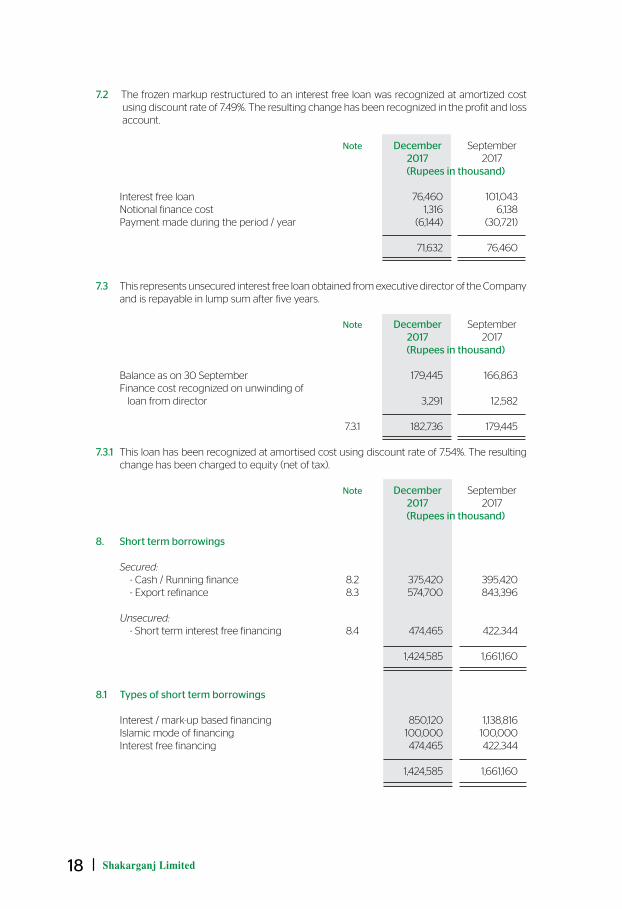
7.2 The frozen markup restructured to an interest free loan was recognized at amortized cost using discount rate of 7.49%. The resulting change has been recognized in the profit and loss account.
Note December September 2017 2017 (Rupees in thousand) Interest free loan 76,460 101,043 Notional finance cost 1,316 6,138 Payment made during the period / year (6,144) (30,721)
71,632 76,460 7.3 This represents unsecured interest free loan obtained from executive director of the Company
and is repayable in lump sum after five years. Note December September 2017 2017 (Rupees in thousand)
Balance as on 30 September 179,445 166,863 Finance cost recognized on unwinding of loan from director 3,291 12,582
7.3.1 182,736 179,445 7.3.1 This loan has been recognized at amortised cost using discount rate of 7.54%. The resulting
change has been charged to equity (net of tax). Note December September 2017 2017 (Rupees in thousand)
8. Short term borrowings
Secured: - Cash / Running finance 8.2 375,420 395,420 - Export refinance 8.3 574,700 843,396 Unsecured: - Short term interest free financing 8.4 474,465 422,344 1,424,585 1,661,160 8.1 Types of short term borrowings Interest / mark-up based financing 850,120 1,138,816 Islamic mode of financing 100,000 100,000 Interest free financing 474,465 422,344
1,424,585 1,661,160
Condensed Interim Report 1Q 2018 19
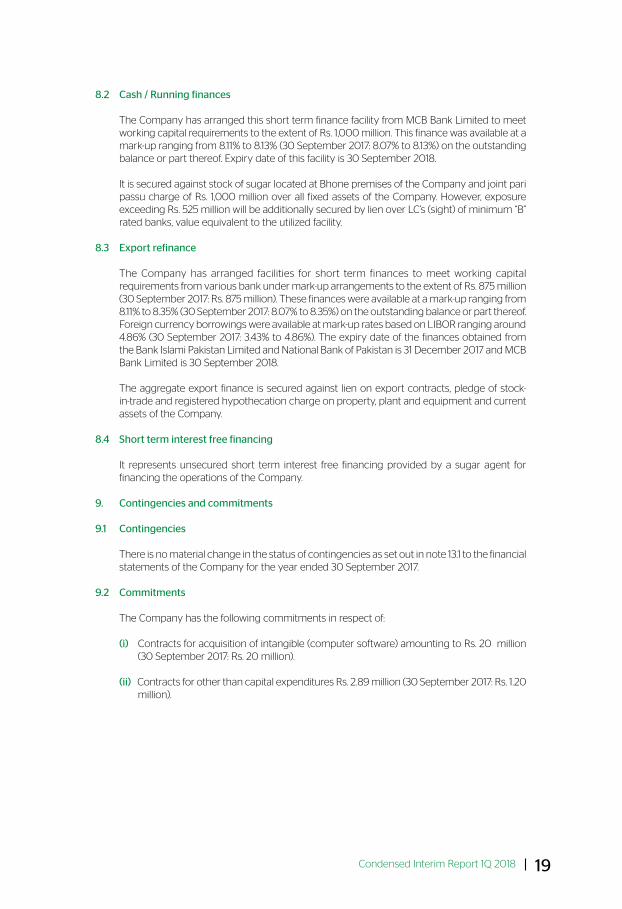
8.2 Cash / Running finances The Company has arranged this short term finance facility from MCB Bank Limited to meet
working capital requirements to the extent of Rs. 1,000 million. This finance was available at a mark-up ranging from 8.11% to 8.13% (30 September 2017: 8.07% to 8.13%) on the outstanding balance or part thereof. Expiry date of this facility is 30 September 2018.
It is secured against stock of sugar located at Bhone premises of the Company and joint pari
passu charge of Rs. 1,000 million over all fixed assets of the Company. However, exposure exceeding Rs. 525 million will be additionally secured by lien over LC’s (sight) of minimum “B” rated banks, value equivalent to the utilized facility.
8.3 Export refinance The Company has arranged facilities for short term finances to meet working capital
requirements from various bank under mark-up arrangements to the extent of Rs. 875 million (30 September 2017: Rs. 875 million). These finances were available at a mark-up ranging from 8.11% to 8.35% (30 September 2017: 8.07% to 8.35%) on the outstanding balance or part thereof. Foreign currency borrowings were available at mark-up rates based on LIBOR ranging around 4.86% (30 September 2017: 3.43% to 4.86%). The expiry date of the finances obtained from the Bank Islami Pakistan Limited and National Bank of Pakistan is 31 December 2017 and MCB Bank Limited is 30 September 2018.
The aggregate export finance is secured against lien on export contracts, pledge of stock-
in-trade and registered hypothecation charge on property, plant and equipment and current assets of the Company.
8.4 Short term interest free financing It represents unsecured short term interest free financing provided by a sugar agent for
financing the operations of the Company.
9. Contingencies and commitments 9.1 Contingencies
There is no material change in the status of contingencies as set out in note 13.1 to the financial statements of the Company for the year ended 30 September 2017.
9.2 Commitments The Company has the following commitments in respect of: (i) Contracts for acquisition of intangible (computer software) amounting to Rs. 20 million
(30 September 2017: Rs. 20 million). (ii) Contracts for other than capital expenditures Rs. 2.89 million (30 September 2017: Rs. 1.20
million).
20
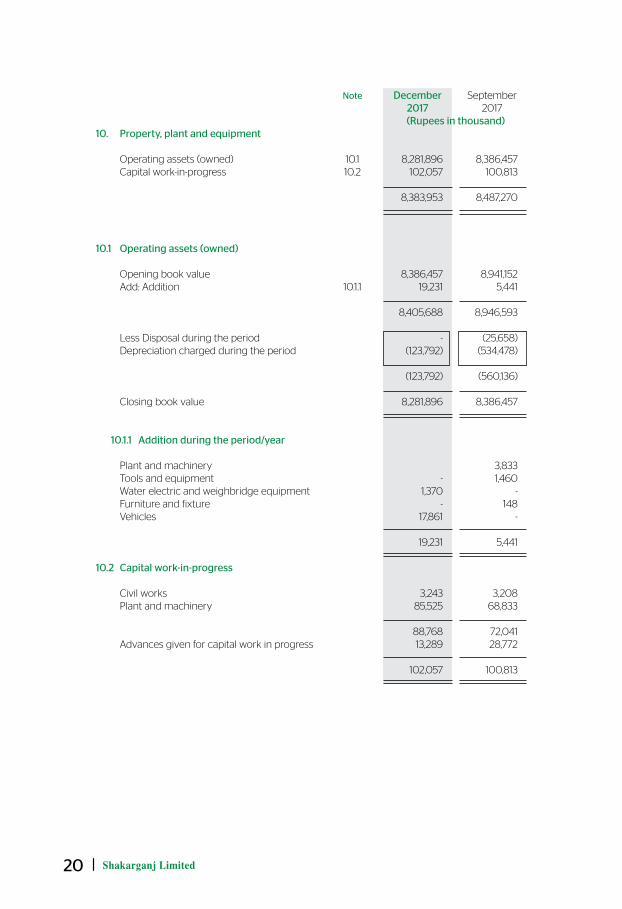
Note December September 2017 2017 (Rupees in thousand)10. Property, plant and equipment Operating assets (owned) 10.1 8,281,896 8,386,457 Capital work-in-progress 10.2 102,057 100,813
8,383,953 8,487,270 10.1 Operating assets (owned) Opening book value 8,386,457 8,941,152 Add: Addition 10.1.1 19,231 5,441 8,405,688 8,946,593
Less Disposal during the period - (25,658) Depreciation charged during the period (123,792) (534,478)
(123,792) (560,136)
Closing book value 8,281,896 8,386,457
10.1.1 Addition during the period/year Plant and machinery 3,833 Tools and equipment - 1,460 Water electric and weighbridge equipment 1,370 - Furniture and fixture - 148 Vehicles 17,861 - 19,231 5,441
10.2 Capital work-in-progress Civil works 3,243 3,208 Plant and machinery 85,525 68,833 88,768 72,041 Advances given for capital work in progress 13,289 28,772
102,057 100,813
Condensed Interim Report 1Q 2018 21
Note December September 2017 2017 (Rupees in thousand)
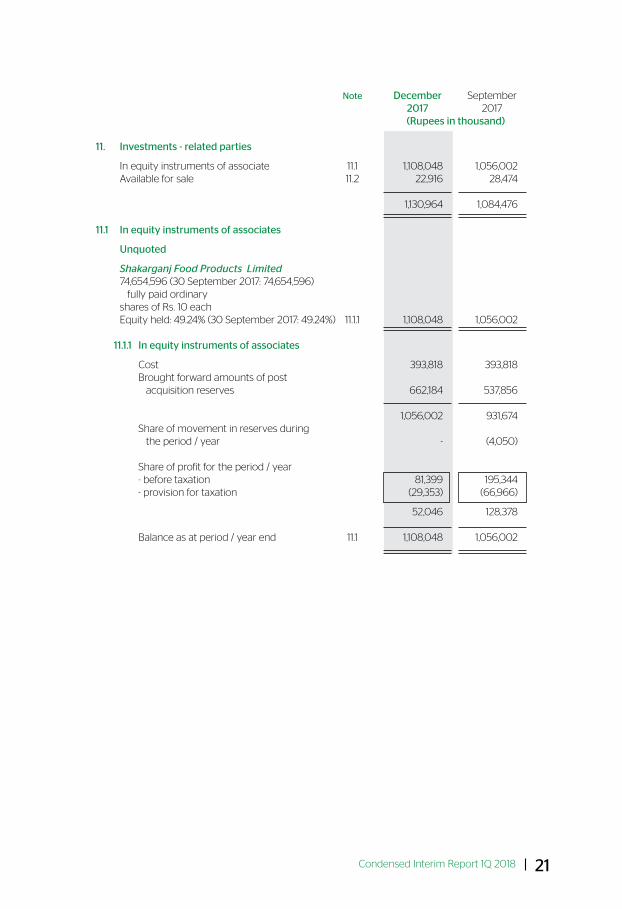
11. Investments - related parties In equity instruments of associate 11.1 1,108,048 1,056,002 Available for sale 11.2 22,916 28,474
1,130,964 1,084,476 11.1 In equity instruments of associates Unquoted Shakarganj Food Products Limited 74,654,596 (30 September 2017: 74,654,596) fully paid ordinary shares of Rs. 10 each Equity held: 49.24% (30 September 2017: 49.24%) 11.1.1 1,108,048 1,056,002 11.1.1 In equity instruments of associates Cost 393,818 393,818 Brought forward amounts of post acquisition reserves 662,184 537,856
1,056,002 931,674 Share of movement in reserves during the period / year - (4,050) Share of profit for the period / year - before taxation 81,399 195,344 - provision for taxation (29,353) (66,966)
52,046 128,378 Balance as at period / year end 11.1 1,108,048 1,056,002
22
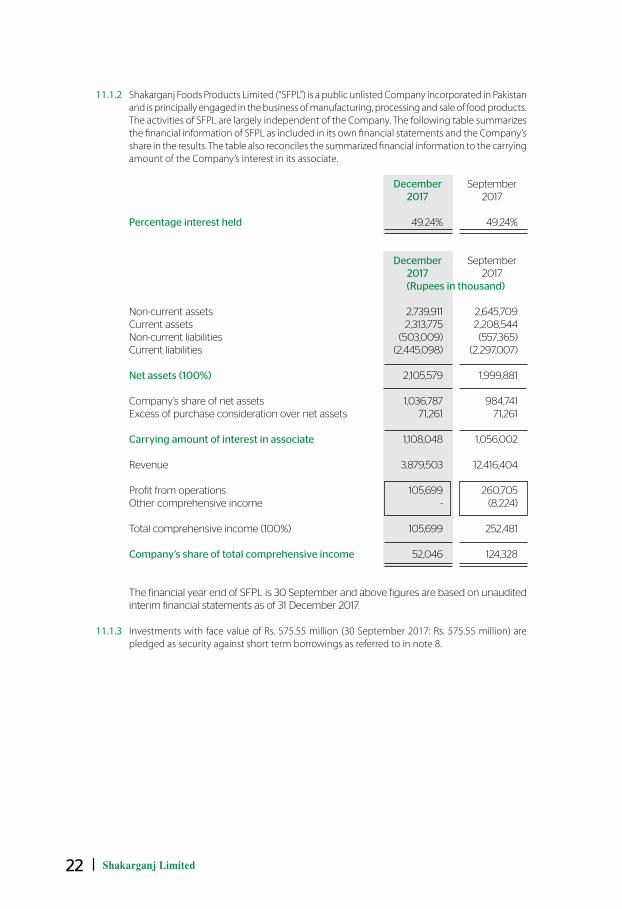
11.1.2 Shakarganj Foods Products Limited (“SFPL”) is a public unlisted Company incorporated in Pakistan and is principally engaged in the business of manufacturing, processing and sale of food products. The activities of SFPL are largely independent of the Company. The following table summarizes the financial information of SFPL as included in its own financial statements and the Company’s share in the results. The table also reconciles the summarized financial information to the carrying amount of the Company’s interest in its associate.
December September 2017 2017
Percentage interest held 49.24% 49.24%
December September 2017 2017 (Rupees in thousand)
Non-current assets 2,739,911 2,645,709 Current assets 2,313,775 2,208,544 Non-current liabilities (503,009) (557,365) Current liabilities (2,445,098) (2,297,007)
Net assets (100%) 2,105,579 1,999,881 Company’s share of net assets 1,036,787 984,741 Excess of purchase consideration over net assets 71,261 71,261
Carrying amount of interest in associate 1,108,048 1,056,002 Revenue 3,879,503 12,416,404 Profit from operations 105,699 260,705 Other comprehensive income - (8,224)
Total comprehensive income (100%) 105,699 252,481
Company’s share of total comprehensive income 52,046 124,328 The financial year end of SFPL is 30 September and above figures are based on unaudited
interim financial statements as of 31 December 2017. 11.1.3 Investments with face value of Rs. 575.55 million (30 September 2017: Rs. 575.55 million) are
pledged as security against short term borrowings as referred to in note 8.
Condensed Interim Report 1Q 2018 23
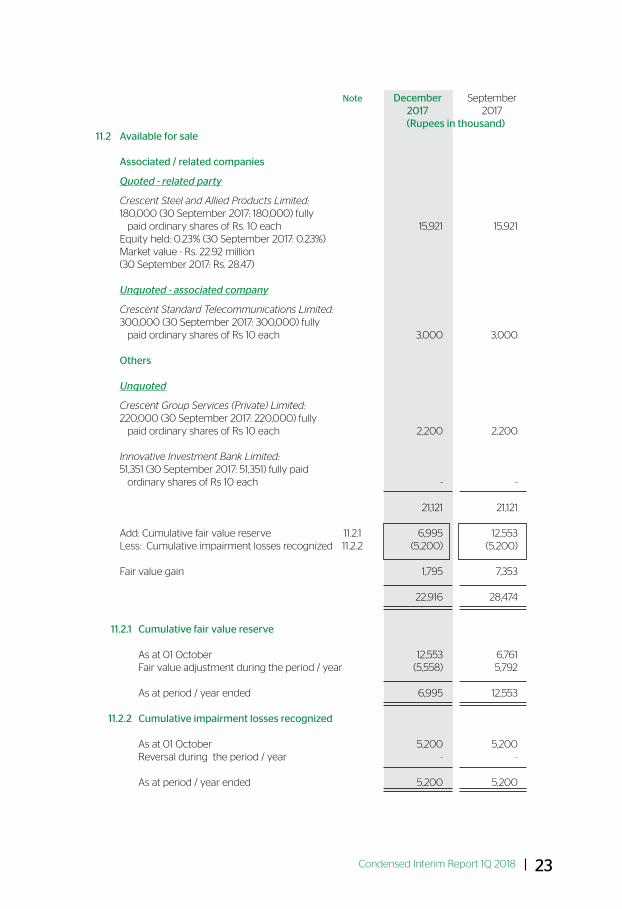
Note December September 2017 2017 (Rupees in thousand)11.2 Available for sale Associated / related companies Quoted - related party Crescent Steel and Allied Products Limited: 180,000 (30 September 2017: 180,000) fully paid ordinary shares of Rs. 10 each 15,921 15,921 Equity held: 0.23% (30 September 2017: 0.23%) Market value - Rs. 22.92 million (30 September 2017: Rs. 28.47) Unquoted - associated company Crescent Standard Telecommunications Limited: 300,000 (30 September 2017: 300,000) fully paid ordinary shares of Rs 10 each 3,000 3,000 Others Unquoted Crescent Group Services (Private) Limited: 220,000 (30 September 2017: 220,000) fully paid ordinary shares of Rs 10 each 2,200 2,200 Innovative Investment Bank Limited: 51,351 (30 September 2017: 51,351) fully paid ordinary shares of Rs 10 each - - 21,121 21,121 Add: Cumulative fair value reserve 11.2.1 6,995 12,553 Less: Cumulative impairment losses recognized 11.2.2 (5,200) (5,200)
Fair value gain 1,795 7,353
22,916 28,474 11.2.1 Cumulative fair value reserve
As at 01 October 12,553 6,761 Fair value adjustment during the period / year (5,558) 5,792
As at period / year ended 6,995 12,553 11.2.2 Cumulative impairment losses recognized As at 01 October 5,200 5,200 Reversal during the period / year - -
As at period / year ended 5,200 5,200
24
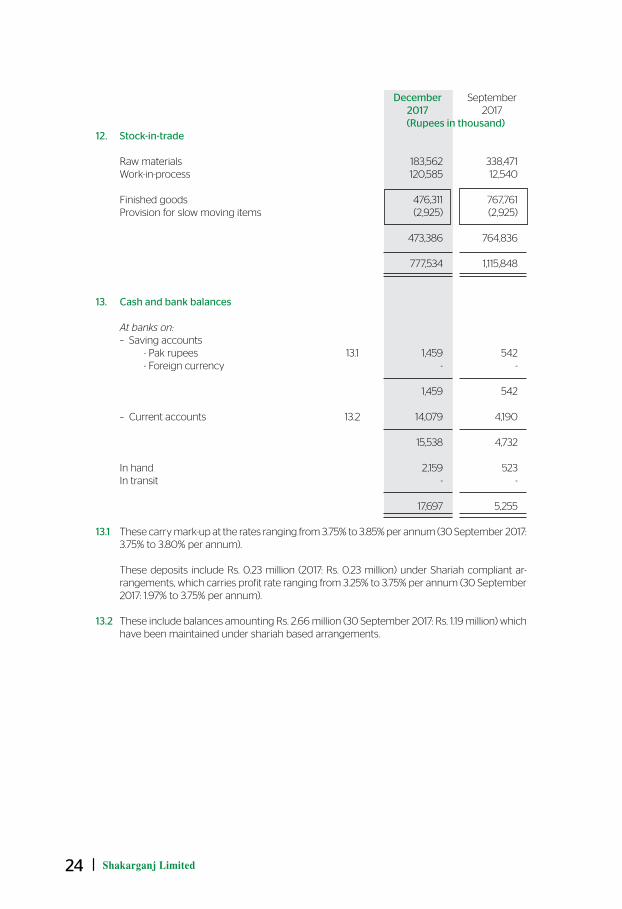
December September 2017 2017 (Rupees in thousand)12. Stock-in-trade Raw materials 183,562 338,471 Work-in-process 120,585 12,540 Finished goods 476,311 767,761 Provision for slow moving items (2,925) (2,925)
473,386 764,836 777,534 1,115,848 13. Cash and bank balances
At banks on: – Saving accounts - Pak rupees 13.1 1,459 542 - Foreign currency - -
1,459 542 – Current accounts 13.2 14,079 4,190
15,538 4,732 In hand 2,159 523 In transit - -
17,697 5,255 13.1 These carry mark-up at the rates ranging from 3.75% to 3.85% per annum (30 September 2017:
3.75% to 3.80% per annum). These deposits include Rs. 0.23 million (2017: Rs. 0.23 million) under Shariah compliant ar-
rangements, which carries profit rate ranging from 3.25% to 3.75% per annum (30 September 2017: 1.97% to 3.75% per annum).
13.2 These include balances amounting Rs. 2.66 million (30 September 2017: Rs. 1.19 million) which
have been maintained under shariah based arrangements.
Condensed Interim Report 1Q 2018 25
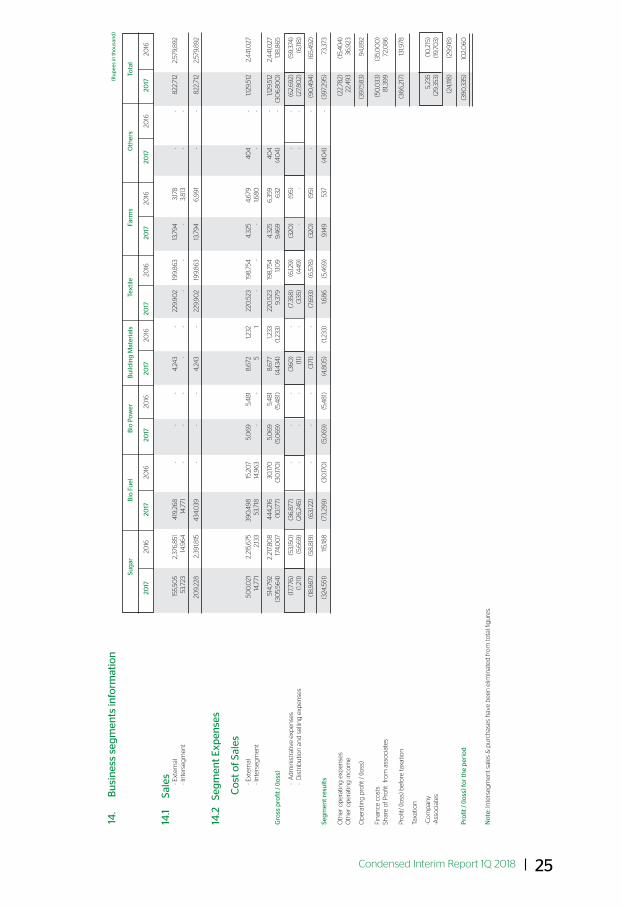
14.
Bu
sin
ess
seg
men
ts in
form
atio
n
(Ru
pee
s in
tho
usa
nd
)
Sug
ar
Bio
Fu
el
Bio
Pow
er
Bu
ildin
g M
ater
ials
Te
xtile
F
arm
s
Oth
ers
Tota
l
20
17
2016
20
17
2016
20
17
2016
20
17
2016
20
17
2016
20
17
2016
20
17
2016
20
17
2016
14.1
Sale
s
- Ext
ern
al
15
5,50
5
2,3
76,8
51
419
,26
8
-
-
-
4,2
43
-
2
29,9
02
19
9,8
63
13
,79
4
3,17
8
-
-
822
,712
2
,579
,892
- In
ters
egm
ent
5
3,72
3
14,9
64
14
,771
-
-
-
-
-
-
-
-
3
,813
-
-
2
09,
228
2
,39
1,815
4
34,0
39
-
-
-
4,2
43
-
2
29,9
02
19
9,8
63
13
,79
4
6,9
91
-
-
822
,712
2
,579
,892
14.2
Se
gm
ent E
xpen
ses
Co
st o
f Sal
es
- Ext
ern
al
5
00
,021
2
,215
,675
3
90
,49
8
15,2
07
5
,06
9
5,4
81
8,6
72
1,23
2
220
,523
19
8,7
54
4,3
25
4,6
79
40
4
-
1,12
9,51
2
2,4
41,0
27
- I
nte
rseg
men
t
14,7
71
2,13
3
53,
718
14
,96
3
-
-
5
1
-
-
-
1,6
80
-
-
5
14,7
92
2,2
17,8
08
4
44
,216
3
0,17
0
5,0
69
5
,48
1 8
,677
1,
233
2
20,5
23
198
,754
4
,325
6
,359
4
04
-
1,
129,
512
2
,44
1,027
G
ross
pro
fit /
(loss
)
(30
5,56
4)
174
,00
7
(10
,177)
(3
0,17
0)
(5,0
69
) (5
,48
1)
(4,4
34)
(1,2
33)
9,3
79
1,10
9
9,4
69
6
32
(40
4)
-
(30
6,8
00
) 13
8,8
65
-
Ad
min
istr
ativ
e ex
pen
ses
(1
7,776
) (5
3,15
0)
(36
,877
) -
-
-
(3
60
) -
(7
,358
) (6
,129
) (3
20)
(95)
-
-
(6
2,6
92)
(59,
374
)
- D
istr
ibu
tion
an
d s
ellin
g e
xpen
ses
(1
,211
) (5
,66
9)
(26
,24
5)
-
-
-
(11)
-
(335
) (4
49)
-
-
-
-
(27,
80
2)
(6,11
8)
(1
8,9
87)
(58
,819
) (6
3,12
2)
-
-
-
(371
) -
(7
,69
3)
(6,5
78)
(320
) (9
5)
-
-
(90
,49
4)
(65,
492)
Seg
men
t res
ult
s
(324
,551
) 11
5,18
8
(73,
299
) (3
0,17
0)
(5,0
69
) (5
,48
1)
(4,8
05)
(1
,233
) 1,
68
6
(5,4
69
) 9
,149
5
37
(40
4)
-
(397
,29
5)
73,
373
O
ther
op
erat
ing
exp
ense
s
(22,
782)
(1
5,4
04
)O
ther
op
erat
ing
inco
me
22,
493
3
6,9
23
Op
erat
ing
pro
fit /
(lo
ss)
(3
97,5
83)
9
4,8
92
Fi
nan
ce c
ost
s
(5
0,0
33)
(35,
00
0)
Shar
e o
f Pro
fit f
rom
ass
oci
ates
81,3
99
7
2,0
86
Pro
fit/
(loss
) bef
ore
tax
atio
n
(3
66
,217
) 13
1,978
Taxa
tion
-Co
mp
any
5,2
35
(10
,215
)-A
sso
ciat
es
(29,
353)
(1
9,70
3)
(2
4,11
8)
(29,
918
)
Pro
fit /
(loss
) fo
r th
e p
erio
d
(3
90
,335
) 10
2,0
60
N
ote
: In
ters
egm
ent
sale
s &
pu
rch
ases
hav
e b
een
elim
inat
ed fr
om
tota
l fig
ure
s.
26
Segment assets Segment liabilities
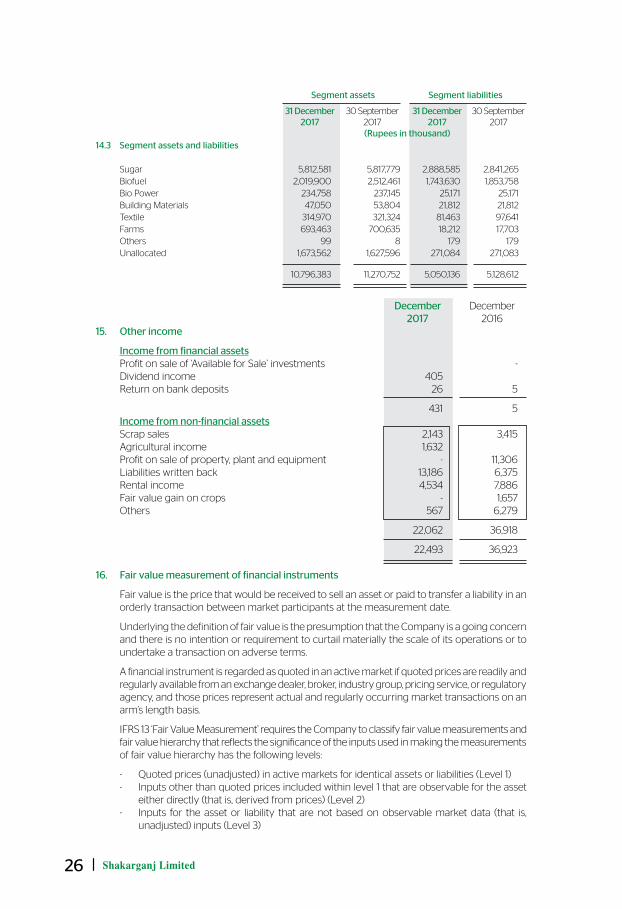
31 December 30 September 31 December 30 September 2017 2017 2017 2017 (Rupees in thousand)14.3 Segment assets and liabilities Sugar 5,812,581 5,817,779 2,888,585 2,841,265 Biofuel 2,019,900 2,512,461 1,743,630 1,853,758 Bio Power 234,758 237,145 25,171 25,171 Building Materials 47,050 53,804 21,812 21,812 Textile 314,970 321,324 81,463 97,641 Farms 693,463 700,635 18,212 17,703 Others 99 8 179 179 Unallocated 1,673,562 1,627,596 271,084 271,083 10,796,383 11,270,752 5,050,136 5,128,612
December December 2017 201615. Other income Income from financial assets Profit on sale of ‘Available for Sale’ investments - Dividend income 405 Return on bank deposits 26 5
431 5 Income from non-financial assets Scrap sales 2,143 3,415 Agricultural income 1,632 Profit on sale of property, plant and equipment - 11,306 Liabilities written back 13,186 6,375 Rental income 4,534 7,886 Fair value gain on crops - 1,657 Others 567 6,279
22,062 36,918
22,493 36,923
16. Fair value measurement of financial instruments Fair value is the price that would be received to sell an asset or paid to transfer a liability in an
orderly transaction between market participants at the measurement date. Underlying the definition of fair value is the presumption that the Company is a going concern
and there is no intention or requirement to curtail materially the scale of its operations or to undertake a transaction on adverse terms.
A financial instrument is regarded as quoted in an active market if quoted prices are readily and
regularly available from an exchange dealer, broker, industry group, pricing service, or regulatory agency, and those prices represent actual and regularly occurring market transactions on an arm’s length basis.
IFRS 13 ‘Fair Value Measurement’ requires the Company to classify fair value measurements and
fair value hierarchy that reflects the significance of the inputs used in making the measurements of fair value hierarchy has the following levels:
- Quoted prices (unadjusted) in active markets for identical assets or liabilities (Level 1) - Inputs other than quoted prices included within level 1 that are observable for the asset
either directly (that is, derived from prices) (Level 2) - Inputs for the asset or liability that are not based on observable market data (that is,
unadjusted) inputs (Level 3)
Condensed Interim Report 1Q 2018 27
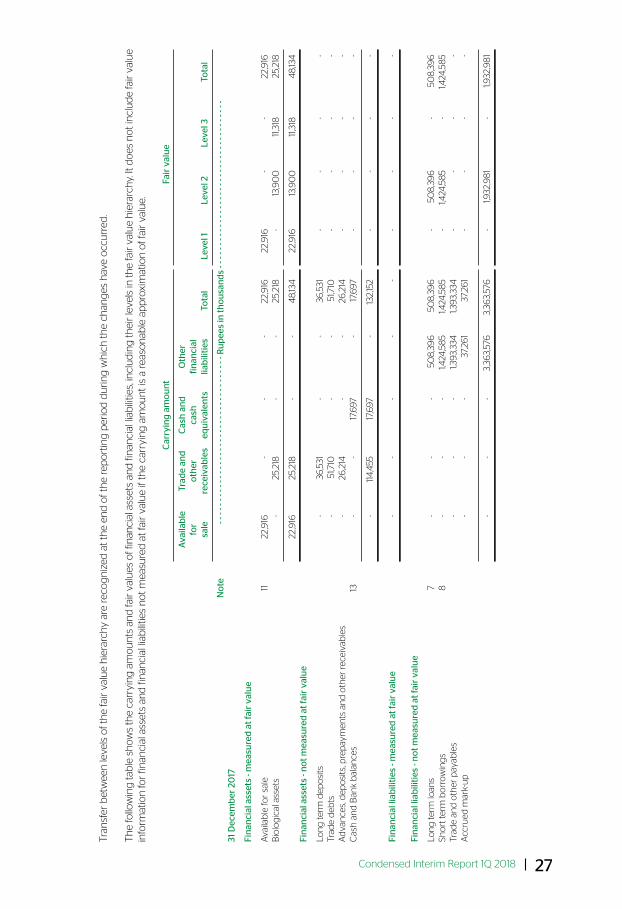
Tran
sfer
bet
wee
n le
vels
of t
he
fair
val
ue
hie
rarc
hy
are
reco
gn
ized
at
the
end
of t
he
rep
ort
ing
per
iod
du
rin
g w
hic
h t
he
chan
ges
hav
e o
ccu
rred
.
Th
e fo
llow
ing
tab
le s
ho
ws
the
carr
yin
g a
mo
un
ts a
nd
fair
val
ues
of f
inan
cial
ass
ets
and
fin
anci
al li
abili
ties,
incl
ud
ing
thei
r le
vels
in th
e fa
ir v
alu
e h
iera
rch
y. It
do
es n
ot i
ncl
ud
e fa
ir v
alu
e in
form
atio
n fo
r fin
anci
al a
sset
s an
d fi
nan
cial
liab
ilitie
s n
ot
mea
sure
d a
t fa
ir v
alu
e if
the
carr
yin
g a
mo
un
t is
a r
easo
nab
le a
pp
roxi
mat
ion
of f
air
valu
e.
Car
ryin
g a
mo
un
t
Fai
r va
lue
Ava
ilab
le
Trad
e an
d
Cas
h a
nd
O
ther
fo
r
oth
er
cash
fin
anci
al
sale
re
ceiv
able
s eq
uiv
alen
ts
liab
iliti
es
Tota
l Le
vel 1
Le
vel 2
Le
vel 3
To
tal
N
ote
- -
- - -
- - -
- - -
- - -
- - -
- - -
- - -
- - -
- - -
- - -
- - -
- - R
up
ees
in th
ou
san
ds
- - -
- - -
- - -
- - -
- - -
- - -
- - -
- - -
- - -
- - -
- - -
- - -
-31
Dec
emb
er 2
017
Fin
anci
al a
sset
s - m
easu
red
at f
air
valu
e
Ava
ilab
le fo
r sa
le
11
22,
916
-
-
-
2
2,9
16
22,
916
-
-
2
2,9
16
Bio
log
ical
ass
ets
-
2
5,21
8
-
-
25,
218
-
13
,90
0
11,3
18
25,
218
2
2,9
16
25,
218
-
-
4
8,13
4
22,
916
13
,90
0
11,3
18
48
,134
Fi
nan
cial
ass
ets
- no
t mea
sure
d a
t fai
r va
lue
Lo
ng
term
dep
osi
ts
-
3
6,5
31
-
-
36
,531
-
-
-
-
Tr
ade
deb
ts
-
5
1,710
-
-
5
1,710
-
-
-
-
A
dva
nce
s, d
epo
sits
, pre
pay
men
ts a
nd
oth
er r
ecei
vab
les
-
2
6,2
14
-
-
26
,214
-
-
-
-
C
ash
an
d B
ank
bal
ance
s 13
-
-
17
,697
-
17,6
97
-
-
-
-
-
11
4,4
55
17,6
97
-
132,
152
-
-
-
-
Fi
nan
cial
liab
iliti
es -
mea
sure
d a
t fai
r va
lue
-
-
-
-
-
-
-
-
-
Fi
nan
cial
liab
iliti
es -
no
t mea
sure
d a
t fai
r va
lue
Lo
ng
term
loan
s
7 -
-
-
5
08
,39
6
50
8,3
96
-
5
08
,39
6
-
50
8,3
96
Sh
ort
term
bo
rro
win
gs
8
-
-
-
1,4
24,5
85
1,
424
,58
5
-
1,4
24,5
85
-
1,
424
,58
5 Tr
ade
and
oth
er p
ayab
les
-
-
-
1,
393,
334
1,
393,
334
-
-
-
-
A
ccru
ed m
ark-
up
-
-
-
37,
261
37,
261
-
-
-
-
-
-
-
3
,36
3,57
6
3,3
63,
576
-
1,
932
,98
1 -
1,
932
,98
1
28
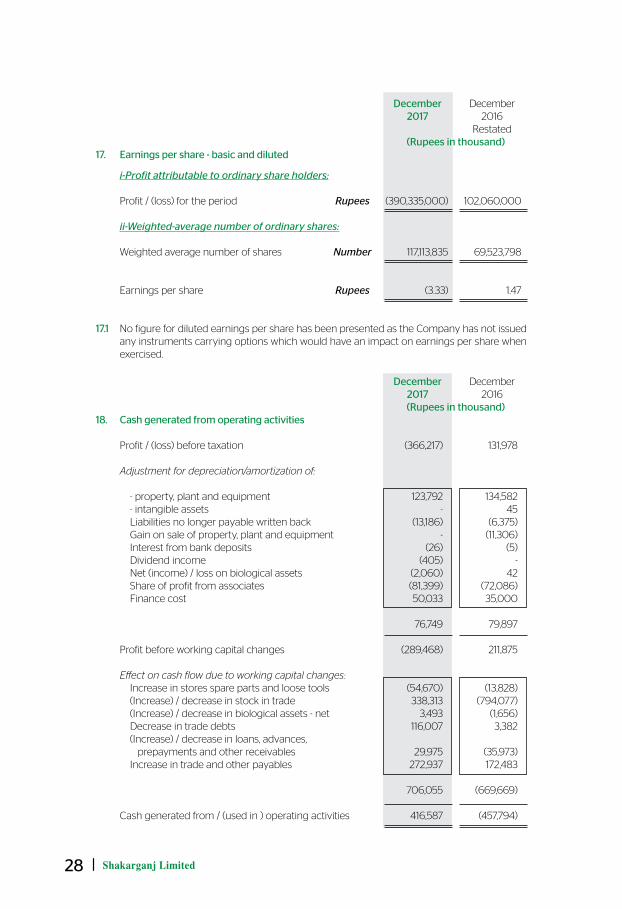
December December 2017 2016 Restated (Rupees in thousand)17. Earnings per share - basic and diluted i-Profit attributable to ordinary share holders: Profit / (loss) for the period Rupees (390,335,000) 102,060,000 ii-Weighted-average number of ordinary shares: Weighted average number of shares Number 117,113,835 69,523,798 Earnings per share Rupees (3.33) 1.47 17.1 No figure for diluted earnings per share has been presented as the Company has not issued
any instruments carrying options which would have an impact on earnings per share when exercised.
December December 2017 2016 (Rupees in thousand)18. Cash generated from operating activities Profit / (loss) before taxation (366,217) 131,978 Adjustment for depreciation/amortization of: - property, plant and equipment 123,792 134,582 - intangible assets - 45 Liabilities no longer payable written back (13,186) (6,375) Gain on sale of property, plant and equipment - (11,306) Interest from bank deposits (26) (5) Dividend income (405) - Net (income) / loss on biological assets (2,060) 42 Share of profit from associates (81,399) (72,086) Finance cost 50,033 35,000 76,749 79,897 Profit before working capital changes (289,468) 211,875 Effect on cash flow due to working capital changes: Increase in stores spare parts and loose tools (54,670) (13,828) (Increase) / decrease in stock in trade 338,313 (794,077) (Increase) / decrease in biological assets - net 3,493 (1,656) Decrease in trade debts 116,007 3,382 (Increase) / decrease in loans, advances, prepayments and other receivables 29,975 (35,973) Increase in trade and other payables 272,937 172,483
706,055 (669,669)
Cash generated from / (used in ) operating activities 416,587 (457,794)
Condensed Interim Report 1Q 2018 29
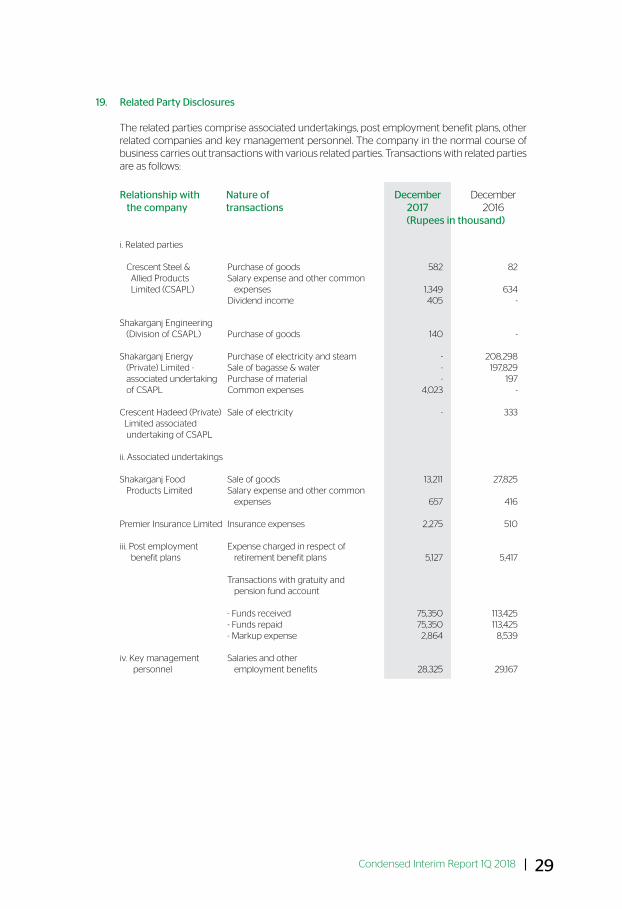
19. Related Party Disclosures
The related parties comprise associated undertakings, post employment benefit plans, other related companies and key management personnel. The company in the normal course of business carries out transactions with various related parties. Transactions with related parties are as follows:
Relationship with Nature of December December the company transactions 2017 2016 (Rupees in thousand) i. Related parties Crescent Steel & Purchase of goods 582 82 Allied Products Salary expense and other common Limited (CSAPL) expenses 1,349 634 Dividend income 405 - Shakarganj Engineering (Division of CSAPL) Purchase of goods 140 - Shakarganj Energy Purchase of electricity and steam - 208,298 (Private) Limited - Sale of bagasse & water - 197,829 associated undertaking Purchase of material - 197 of CSAPL Common expenses 4,023 - Crescent Hadeed (Private) Sale of electricity - 333 Limited associated undertaking of CSAPL ii. Associated undertakings Shakarganj Food Sale of goods 13,211 27,825 Products Limited Salary expense and other common expenses 657 416 Premier Insurance Limited Insurance expenses 2,275 510 iii. Post employment Expense charged in respect of benefit plans retirement benefit plans 5,127 5,417 Transactions with gratuity and pension fund account - Funds received 75,350 113,425 - Funds repaid 75,350 113,425 - Markup expense 2,864 8,539 iv. Key management Salaries and other personnel employment benefits 28,325 29,167
30
20. Date of authorization of issue This condensed interim financial information was authorized for issue on 30 January 2018 by
the board of directors of the Company. 21. Events after the balance sheet date There are no subsequent events occurring after balance sheet date. 22. Corresponding figures Corresponding figures have been re-arranged and re-classified, wherever necessary, for the
purposes of comparison and better presentation as per reporting framework however, no significant re-arrangements have been made.
Chief Executive Chairman Chief Financial Officer
Condensed Interim Report 1Q 2018 31
32

Shakarganj LimitedExecutive Floor, IT Tower, 73 E 1 Hali Road, Gulberg III, Lahore, PakistanTelephone: (042) 111 111 765Fax: (042) 3578 3811