Embed Size (px)
Citation preview

Reaction Kinetics in Acid-Catalyzed Deprotection of Polymer FilmsGinusha M. Perera,† Yogendra Narayan Pandey,† Abhijit A. Patil, Gila E. Stein,* and Manolis Doxastakis*
Department of Chemical and Biomolecular Engineering, University of Houston, Houston, Texas 77204-4004, United States
*S Supporting Information
ABSTRACT: A quantitative description of kinetics in acid-catalyzed polymerdeprotection reactions requires proper identification of the controlling mecha-nisms. We examined the acid-catalyzed deprotection of a glassy poly(4-hydroxystyrene-co-tert-butyl acrylate) resin using infrared absorbance spectroscopyand stochastic simulations. We interpret experimental data with a model thatexplicitly accounts for acid transport, where heterogeneities at local length scalesare introduced through a nonexponential distribution of waiting times betweensuccessive hopping events. A subdiffusive behavior with long-tail kinetics predictskey attributes of the observed deprotection rates, such as a fast initial deprotection,slow conversion at long times, and a nonlinear dependence on acid loading. Mostimportantly, only two parameters are introduced to offer a near-quantitative description of deprotection levels at low acidloadings and short times. The model is extended to high acid loadings and long times by incorporating a simple acid depletionmodel based on mutual encounters. Our study suggests that macroscopic deprotection rates are controlled by acid transport inthe glassy deprotected polymer, which presents with a strongly non-Fickian behavior.
■ INTRODUCTION
The most sophisticated integrated circuits, such as micro-processors and memory chips, are patterned with projectionlithography. The efficiency of semiconductor devices iscontrolled by lithographic resolution (minimum feature sizeRmin). To keep pace with historic growth rates (Moore’s law),future lithographic processes must resolve features at the scaleof 10 nm.1 Imaging materials for next-generation lithographymust satisfy a number of demanding requirements, such asnanoscale resolution, near-perfect pattern uniformity, and highsensitivity to radiation.2
The most sensitive resists are based on a process calledchemical amplification.3−5 Chemically amplified (CA) resistshave two principal components: (i) a lipophilic polymer withacid-labile protecting groups and (ii) a low concentration ofphotoacid generator (PAG). Exposing the resist to radiationgenerates a strong acid catalyst, and heating at moderatetemperature promotes the acid-catalyzed decomposition ofprotecting groups along the polymer backbone. Thisdeprotection reaction changes the polymer polarity fordevelopment in an aqueous base. CA systems are highlyefficient because each photon absorbed by the resist generatesca. 0.3−3 acids,6,7 and each acid cleaves hundreds of bonds,3 soa low radiation dose is “amplified” through chemistry. However,the excellent sensitivity of CA resists comes at a price becausecatalytic efficiency and/or acid diffusion will limit the patternresolution and uniformity.1,2,8−10
There is a clear need to develop quantitative models ofchemical amplification that can predict the spatial extent-of-deprotection with nanoscale resolution. It is well-establishedthat deprotection kinetics is controlled by acid catalystdiffusion,8,9 but the mechanism cannot be described by simpleFickian transport models.11−13 Macroscopic models have been
proposed that include thermodynamic equilibria, free volumegeneration, acid trapping reactions, or concentration-dependentdiffusion coefficients.14−18 These studies aim to capture certainaspects of the deprotection kinetics, such as the fast initialconversion or slow conversion at long times. For example,introducing concepts from polymer physics, Croffie et al.described an initially fast deprotection rate that is concurrentwith the creation of free volume from escaping volatilebyproducts.15 The additional free volume subsequently relaxes,leading to a dense polymer resin that arrests the acid mobility.A different route describes the overall deprotection rate as aseries of thermodynamic equilibria between the acid catalystand protected or deprotected polymer.8 Finally, many studiesemploy a phenomenological concentration-dependent aciddiffusivity that increases with extent-of-deprotection.17,19,20 Inany case, it is unclear whether such descriptions can beextended to model material behavior at the nanoscale, wheremolecular parameters such as the distances between thereacting centers and acid−anion pair play a significant role.21
To increase the challenge in capturing macroscopic behaviorwith a mesoscopic model, we note that local fluctuations incomposition and density are anticipated,22 and it is not certainthat mean values of parameters such as acid hopping times canadequately describe the transport mechanism in a reactingglassy polymer matrix.Following a concerted modeling and experimental approach,
we show that a surprisingly simple model of anomalousdiffusive behavior can predict macroscopic deprotection rates.The model is based on an acid hopping process that presents
Received: September 10, 2012Revised: October 27, 2012Published: November 5, 2012
Article
pubs.acs.org/JPCC
© 2012 American Chemical Society 24706 dx.doi.org/10.1021/jp308997g | J. Phys. Chem. C 2012, 116, 24706−24716

with a subdiffusive character, which generates extensive short-time reaction followed by long-time limiting behavior. Themodel accurately predicts the higher-order dependence ofdeprotection rates on acid concentration. On the basis of recentstudies of anomalous diffusion in complex materials,23 wepropose that deprotection rates are controlled by an underlyingnonexponential distribution of acid hopping rates. We believethat our study provides a unique framework to examine theeffects of polymer dynamics on reaction front propagation.
■ EXPERIMENTAL PROCEDURES
Overview. The aim of our experiments is to measure theextent of reaction in a model chemically amplified resist withinfrared absorbance spectroscopy. The variables for theseexperiments are catalyst loading, reaction temperature, andreaction time. Reaction temperature is always lower than thepolymer’s glass transition by at least 50 K. The followingparagraphs describe four critical attributes of the experiments.First, we discuss the photoresist chemistry and deprotectionmechanism. Second, we report the acid generation efficiency,which is an important parameter that determines the initialconcentration of acid catalyst. Third, we describe the samplepreparation for infrared absorbance spectroscopy. Finally, weprovide protocols for analyzing spectroscopy data, where thesedata are used to quantify deprotection levels in the resist.Materials. The random copolymer resin was poly(4-
hydroxystyrene-co-tert-butyl acrylate) (PHOST−PTBA), 60vol % PHOST, with molecular weight Mn = 10.4 kg/mol andpolydispersity index of 1.8 (DuPont Electronic Materials). Theglass transition temperature of this polymer is ∼140 °C. Thephotoacid generator (PAG) was triphenylsulfonium perfluoro-1-butanesulfonate (Sigma-Aldrich). The base quencher wasdiphenylamine (Sigma-Aldrich), which has a very low vaporpressure (1 mmHg at 108 °C). All formulas were prepared bydissolving the polymer, PAG, and base in propylene glycolmonomethyl ether acetate. Substrates were double-sidepolished p-type (100) silicon wafers. Substrates were cleanedwith piranha solution (4 parts sulfuric acid, 1 part 30 wt %aqueous hydrogen peroxide), which destroys any organiccontamination and makes the oxide surface extremely hydro-philic.Acid-Catalyzed Deprotection Mechanism.Many studies
have described the acid-catalyzed deprotection reaction in
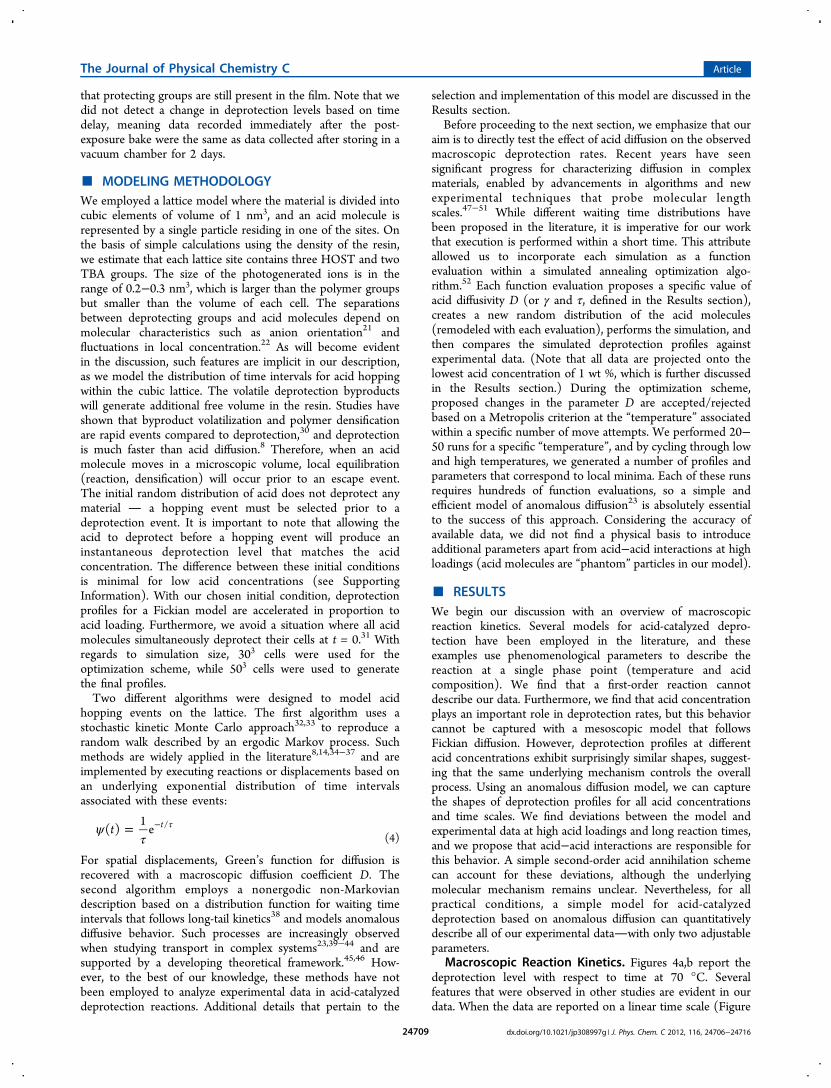
PHOST−PTBA resists. Irradiation by deep ultraviolet light willconvert the PAG into a strong acid catalyst (Figure 1a),24,25 andheating the resist at moderate temperature will activate an acid-catalyzed deprotection reaction (Figure 1b).3,5,9 Note thatdeprotection is a multistep process that is often described bypseudo-first-order kinetics.9 Many resists can be thermallydeprotected in addition to the acidolysis mechanism,8,14 but thePHOST−PTBA copolymer is stable at the temperatures ofinterest.3 The Supporting Information includes spectroscopydata that confirm the thermal stability.
Acid Generation. The efficiency of acid generation wasmeasured with the “standard addition” method, where knownquantities of a base additive are added to the PAG/polymerblend, and the Dill C parameter is calculated from changes incritical dose due to base quenching.26−28 Briefly, we preparedeight resist solutions of PHOST−PTBA, PAG, and basequencher. The polymer concentration in PGMEA was 10 wt %for all studies. The PAG loading was fixed at 4 wt % relative toPHOST−PTBA, but the molar ratio of base-to-PAG was variedfrom 0 to 0.69. Resist films were spun-cast on clean siliconwafers with a thickness of 280 ± 10 nm and then baked at 130°C for 2 min to remove residual solvent. Films were irradiatedwith 254 nm ultraviolet light (lamp power 1.74 mW/cm2) fordifferent durations of time, where exposure time controls thedose delivered to the film (ca. 10−100 mJ/cm2). Films werebaked at 90 °C for 30 s to activate the acid-catalyzeddeprotection reaction. Films were developed with an aqueoussolution of 0.26 N tetramethylammonium hydroxide (MF 319by MicroChem) for 20 s and rinsed with deionized water. Theresidual film thickness was measured as a function of exposuredose for each resist formula. Note that all resist thicknesseswere measured with a JA Woollam M-2000 spectroscopicellipsometer (λ = 190−1690 nm). Ellipsometry data weremodeled with the Cauchy dispersion relation n(λ) = A + B/λ2,where A, B, and film thickness were adjustable parameters forregression analysis (all positive values). This model provides anexcellent description of ellipsometry data in the range of 350−1690 nm. To fit the data in the deep ultraviolet range, weemployed an Urbach tail that accounts for absorption.The first step of the “standard addition” technique is
determining the critical exposure dose E0 for each resistformula, which is the radiation dose that makes the film solublein the developer. The critical dose is readily identified from
Figure 1. Overall reactions for (a) acid generation and (b) deprotection, where H+X− denotes the acid−counterion pair.
The Journal of Physical Chemistry C Article
dx.doi.org/10.1021/jp308997g | J. Phys. Chem. C 2012, 116, 24706−2471624707

resist contrast curves, meaning plots of normalized residualthickness (hf/h0) as a function of dose E. These data arereported in Figure 2a. The second step is to plot the molar ratio
of base-to-PAG ([B]/[PAG]) against critical dose E0 and fitthese data to a line. The slope of this line is the Dill Cparameter without absorption corrections. Finally, the Dill Cparameter including absorption corrections is
= ×− −
Ca
aslope
1 exp( ) (1)
where a is the film absorbance (base e). The absorptioncoefficient for the resist is α = 4πk/λ, where k is the imaginarycomponent of the refractive index and λ = 254 nm is thewavelength of light. The total film absorbance is a = α ln(10)h0.Figure 1b reports the outcomes of this experiment, where thekey result in the value C = 0.043 ± 0.001 cm2/mJ. The acidgeneration efficiency is calculated with the Dill equation
= − −+ CE[H ] [PAG] (1 exp{ })0 (2)
Note that 99% of the PAG is activated when the radiation doseexceeds 100 mJ/cm2.Deprotection Kinetics. Resist formulas were prepared with
PHOST−PTBA resin and PAG loadings of 1, 2, 4, or 10 wt %.The polymer concentration in PGMEA was 10 wt % for allstudies. Base quenchers were not included in these studies.Resist films were spun-cast onto clean silicon wafers withthicknesses of 250−300 nm and then baked for 2 min at 130 °Cto remove residual solvent. Resist films were irradiated with 254nm light at a dose of 150 mJ/cm2, which ensures that all PAG isdecomposed into acid catalyst (efficiency >99%). Each waferwas cut into smaller sections, so one piece was used to calibratethe initial concentration of protecting groups, while otherpieces were annealed for different durations of time on ashielded hot plate at fixed temperature. The temperatures were70, 80, or 90 °C, and the deprotection times were varieddepending on acid loading and temperature (Figure 4). Thetemperatures were selected to achieve measurable deprotectionlevels within a reasonable time (less than 24 h).Fourier-Transform Infrared (IR) Spectroscopy. IR
absorbance was measured with a Nicolet NEXUS 670 FTIRspectrometer equipped with a Brewster angle sample stage.
Samples were measured in transmission mode with an incidentangle of 16°, which is near the Brewster angle of the siliconsubstrate. IR absorbance was recorded with OMNIC dataacquisition software at a resolution of 8 cm−1 with an average of128 scans. The baseline was subtracted using a “point-and-click” procedure in Matlab, where the user identifies theminima in the spectra and the software fits a line to connectthose points. The signal from a clean silicon wafer wassubtracted from each PHOST−PTBA spectra. Table 1 reports
the IR peak assignments for PHOST−PTBA.29 The strongestsignal associated with the protecting TBA groups is detected at1149 cm−1. The absorbance is calculated by fitting the spectrain the range of 1134−1276 cm−1 to a model based on fourpeaks. The peak centers were near 1151, 1172, 1240, and 1275cm−1, and peak line shapes were Gaussian, Lorentzian,Gaussian, and Gaussian, respectively. Each series of measure-ments includes a fully protected sample and several deprotectedsamples for different postexposure bake times. Examples ofthese data are reported in Figure 3. Within each series, the peak
widths at 1149 and 1172 cm−1 were fixed to their average value,meaning the shape could not change as a function of bake time.Typical peak widths were 9 cm−1 (Gaussian) and 25 cm−1
(Lorentzian) at positions 1149 and 1172 cm−1, respectively,which is typical of low-density solids. The deprotection level(ϕ) is calculated from the ratio of final-to-initial TBAabsorbance and corrected for changes in film thickness,
ϕ = −hh
1[TBA][TBA]
0 f
f 0 (3)
where [TBA]f is the final TBA absorbance, [TBA]0 is the initialTBA absorbance, hf is the final film thickness, and h0 is theinitial film thickness. The uncertainty (95% confidence interval)was determined by performing multiple measurements persample and is approximately 3% for ϕ < 0.85 and 5% for ϕ >0.85. The uncertainty increases at large extent of deprotectionbecause the TBA signals are weak. When the deprotection levelexceeds about 85%, it is difficult to distinguish the TBA signalat 1149 cm−1 from the HOST signal at 1172 cm−1. However,the TBA signal at 1369 cm−1 provides secondary confirmation
Figure 2. Efficiency of acid generation: (a) contrast curves to find E0;(b) calculating the Dill C parameter (cm2/mJ).
Table 1. Key IR Peak Assignments for PHOST−PTBA29
wavenumber (cm−1) assignment
1393, 1369 CH3 split umbrella mode of tert-butyl acrylate1238 C−C−O asymmetric stretch of 4-hydroxystyrene1255−1245 C−C skeletal vibrations of tert-butyl acrylate1172 aromatic C−H in-plane bend of 4-hydroxystyrene1149 C−O−C asymmetric stretch of tert-butyl acrylate
Figure 3. IR absorbance data for PHOST−PTBA resist with 2 wt %acid, deprotected at 70 °C. The peaks at 1369 and 1149 cm−1 areassociated with CH3 and C−O stretches of TBA moieties, respectively.
The Journal of Physical Chemistry C Article
dx.doi.org/10.1021/jp308997g | J. Phys. Chem. C 2012, 116, 24706−2471624708
that protecting groups are still present in the film. Note that wedid not detect a change in deprotection levels based on timedelay, meaning data recorded immediately after the post-exposure bake were the same as data collected after storing in avacuum chamber for 2 days.
■ MODELING METHODOLOGYWe employed a lattice model where the material is divided intocubic elements of volume of 1 nm3, and an acid molecule isrepresented by a single particle residing in one of the sites. Onthe basis of simple calculations using the density of the resin,we estimate that each lattice site contains three HOST and twoTBA groups. The size of the photogenerated ions is in therange of 0.2−0.3 nm3, which is larger than the polymer groupsbut smaller than the volume of each cell. The separationsbetween deprotecting groups and acid molecules depend onmolecular characteristics such as anion orientation21 andfluctuations in local concentration.22 As will become evidentin the discussion, such features are implicit in our description,as we model the distribution of time intervals for acid hoppingwithin the cubic lattice. The volatile deprotection byproductswill generate additional free volume in the resin. Studies haveshown that byproduct volatilization and polymer densificationare rapid events compared to deprotection,30 and deprotectionis much faster than acid diffusion.8 Therefore, when an acidmolecule moves in a microscopic volume, local equilibration(reaction, densification) will occur prior to an escape event.The initial random distribution of acid does not deprotect anymaterial a hopping event must be selected prior to adeprotection event. It is important to note that allowing theacid to deprotect before a hopping event will produce aninstantaneous deprotection level that matches the acidconcentration. The difference between these initial conditionsis minimal for low acid concentrations (see SupportingInformation). With our chosen initial condition, deprotectionprofiles for a Fickian model are accelerated in proportion toacid loading. Furthermore, we avoid a situation where all acidmolecules simultaneously deprotect their cells at t = 0.31 Withregards to simulation size, 303 cells were used for theoptimization scheme, while 503 cells were used to generatethe final profiles.Two different algorithms were designed to model acid
hopping events on the lattice. The first algorithm uses astochastic kinetic Monte Carlo approach32,33 to reproduce arandom walk described by an ergodic Markov process. Suchmethods are widely applied in the literature8,14,34−37 and areimplemented by executing reactions or displacements based onan underlying exponential distribution of time intervalsassociated with these events:
ψτ
= τ−t( )1
e t/(4)
For spatial displacements, Green’s function for diffusion isrecovered with a macroscopic diffusion coefficient D. Thesecond algorithm employs a nonergodic non-Markoviandescription based on a distribution function for waiting timeintervals that follows long-tail kinetics38 and models anomalousdiffusive behavior. Such processes are increasingly observedwhen studying transport in complex systems23,39−44 and aresupported by a developing theoretical framework.45,46 How-ever, to the best of our knowledge, these methods have notbeen employed to analyze experimental data in acid-catalyzeddeprotection reactions. Additional details that pertain to the
selection and implementation of this model are discussed in theResults section.Before proceeding to the next section, we emphasize that our
aim is to directly test the effect of acid diffusion on the observedmacroscopic deprotection rates. Recent years have seensignificant progress for characterizing diffusion in complexmaterials, enabled by advancements in algorithms and newexperimental techniques that probe molecular lengthscales.47−51 While different waiting time distributions havebeen proposed in the literature, it is imperative for our workthat execution is performed within a short time. This attributeallowed us to incorporate each simulation as a functionevaluation within a simulated annealing optimization algo-rithm.52 Each function evaluation proposes a specific value ofacid diffusivity D (or γ and τ, defined in the Results section),creates a new random distribution of the acid molecules(remodeled with each evaluation), performs the simulation, andthen compares the simulated deprotection profiles againstexperimental data. (Note that all data are projected onto thelowest acid concentration of 1 wt %, which is further discussedin the Results section.) During the optimization scheme,proposed changes in the parameter D are accepted/rejectedbased on a Metropolis criterion at the “temperature” associatedwithin a specific number of move attempts. We performed 20−50 runs for a specific “temperature”, and by cycling through lowand high temperatures, we generated a number of profiles andparameters that correspond to local minima. Each of these runsrequires hundreds of function evaluations, so a simple andefficient model of anomalous diffusion23 is absolutely essentialto the success of this approach. Considering the accuracy ofavailable data, we did not find a physical basis to introduceadditional parameters apart from acid−acid interactions at highloadings (acid molecules are “phantom” particles in our model).
■ RESULTSWe begin our discussion with an overview of macroscopicreaction kinetics. Several models for acid-catalyzed depro-tection have been employed in the literature, and theseexamples use phenomenological parameters to describe thereaction at a single phase point (temperature and acidcomposition). We find that a first-order reaction cannotdescribe our data. Furthermore, we find that acid concentrationplays an important role in deprotection rates, but this behaviorcannot be captured with a mesoscopic model that followsFickian diffusion. However, deprotection profiles at differentacid concentrations exhibit surprisingly similar shapes, suggest-ing that the same underlying mechanism controls the overallprocess. Using an anomalous diffusion model, we can capturethe shapes of deprotection profiles for all acid concentrationsand time scales. We find deviations between the model andexperimental data at high acid loadings and long reaction times,and we propose that acid−acid interactions are responsible forthis behavior. A simple second-order acid annihilation schemecan account for these deviations, although the underlyingmolecular mechanism remains unclear. Nevertheless, for allpractical conditions, a simple model for acid-catalyzeddeprotection based on anomalous diffusion can quantitativelydescribe all of our experimental datawith only two adjustableparameters.
Macroscopic Reaction Kinetics. Figures 4a,b report thedeprotection level with respect to time at 70 °C. Severalfeatures that were observed in other studies are evident in ourdata. When the data are reported on a linear time scale (Figure
The Journal of Physical Chemistry C Article
dx.doi.org/10.1021/jp308997g | J. Phys. Chem. C 2012, 116, 24706−2471624709

4a), it appears that the reaction is self-limiting with a maximumdeprotection level that depends on acid concentration.16,53−55
However, on a logarithmic time scale, it appears that thedeprotection reaction continues with an extremely slow rate.(The increase in data scatter at long reaction times wasdiscussed in the Experimental Procedures.) Reduced depro-tection rates with increasing conversion have been discussed byother studies, and this behavior is captured with phenomeno-logical models such as volume relaxation or a temporal acid-trapping through additional reactions.15,56 Before we addressthe phenomena that control long-time behavior, we will discussthe microscopic mechanisms that control deprotection at short-to-intermediate times. We use data from resists with differentacid concentrations to guide this discussion. All of our datawere acquired from glassy polymer resists, meaning thedeprotection temperature is well-below the polymer’s glasstransition (Tg − T ≥ 50 K). Furthermore, unless otherwisenoted, the data reviewed from other studies were also based onglassy polymer resins.The deprotection reaction is usually modeled as a first-order
reaction with a very long catalytic chain.8,9 To quantitativelydescribe our data, we started with a simple analytical differentialequation for reaction-limited kinetics,
ϕ ϕ= −+
tk
dd
[H ](1 )(5)
If [H+] remains constant throughout the reaction, then theobserved deprotection can be formulated with a new parameterK = k[H+] that depends linearly on acid concentration.Therefore, if the acid concentration is reduced by a factor of 2,then the deprotection rate should be twice as slow. Somestudies have reported that deprotection rate varies linearly withacid concentration,16 consistent with the model in eq 5, butthere are many examples where the reaction order is greaterthan 1. For example, Ferguson et al. reported exponents in therange of 1.2−1.8 for the deprotection of tert-butyloxycarbonyl(t-BOC) groups in poly(t-BOC-styrene sulfone) resists.53 Therange of exponents was associated with variations in temper-ature (always below Tg), PAG concentration, and type of PAG.More recently, Jung et al. examined acid-catalyzed deprotectionin two types of polymers: a poly(methyladamantyl methacry-late-co-γ-butyrolactone methacrylate) (PMAdMA−PGBLMA)resin with adamantyl protecting groups and a poly-(hydroxylstyrene-co-styrene-co-tert-butyl methacrylate)(PHOST−PS−PTBMA) resin with tert-butyl methacrylateprotecting groups.57−59 These authors measured the resistsensitivity as a function of acid loading (photospeed), which isroughly proportional to deprotection rates, and they consideredreaction temperatures both below and above Tg. At temper-atures below Tg, they found that halving the acid concentrationwould reduce the PMAdMA−PGBLMA and PHOST−PS−PTBMA photospeeds by factors of 16 and 4, respectively. Thisresult is inconsistent with first-order deprotection kinetics. In
Figure 4. (a−c) Fraction of deprotected group as a function of time on linear and logarithmic scales. Note that shapes of the curves are similar, andthey can be superimposed by assuming a nonlinear dependence on acid loading as illustrated in (d). Solid line is the best-fit profile to a first-orderreaction.
The Journal of Physical Chemistry C Article
dx.doi.org/10.1021/jp308997g | J. Phys. Chem. C 2012, 116, 24706−2471624710

contrast, when they used laser spike annealing (T ≫ Tg), theydetected first-order deprotection kinetics. To our knowledge,an increased reaction order cannot be explained by thechemistry of the deprotection reaction. Considering the datafrom Jung et al., it is likely that deprotection rates in polymer-based resists are controlled by the dynamical properties of thepolymer resin.59
In our experiments, we determined a macroscopic depro-tection rate with a stronger than linear dependence on acidconcentration:
= >+K k n[H ] , 1n (6)
The exponent n was approximately 1.6 at 70 °C, 1.5 at 80 °C,and 1.5 at 90 °C. To demonstrate this behavior, Figure 4dreports all data for 70 °C on a master curve that accounts forthe nonlinear dependence of reaction rate on acid concen-tration. For example, the data for 10 wt % PAG were multipliedby 101.6, which superimposes those points onto the 1 wt %PAG curve. Apparently, the underlying deprotection mecha-nism does not vary with acid concentration, but the observedmacroscopic behavior cannot be described by a simple linearrate law. Figure 4d also reports the model curve based on eq 5(solid black line), and this exponential decay of reacting groupsdoes not describe the reaction kinetics. Apart from theobserved slow reaction at very long times, we find a fasterdecrease in TBA groups at short times. Other studies ofchemically amplified resists have attributed these features to acompeting thermolysis reaction.8,56 However, as previouslydiscussed in the Experimental Procedures, the PHOST−PTBAresin used in our studies is thermally stable.3 With all thesefactors in mind, we believe a different microscopic model isneeded to quantitatively describe the observed deprotectionkinetics.Fickian Diffusion. The acid-catalyzed deprotection of
glassy polymer films has been studied for more than 30 years.While it is widely accepted that acid diffusion controls themacroscopic reaction rate, models based on Fickian diffusioncannot adequately describe experimental data.60,61 Instead,various phenomenological diffusion models were proposed thatreduce the acid transport rates with increasing extent ofdeprotection. This view is supported by many studies of acidtransport in deprotected and protected polymers, whereextremely low diffusion coefficient in the deprotected phase(10−16−10−18 cm2/s) is orders of magnitude less than theprotected phase (10−12−10−14 cm2/s).8,11,62 One such modelsuggests that volatile reaction products create additional freevolume, which subsequently decays to an equilibrium state asthese molecules desorb and the polymer relaxes.15 While thisscenario is plausible, the model introduces several parametersthat are difficult to estimate or measure. Furthermore, someexperiments suggest that desorption is much faster thandeprotection, which is in direct contrast to the volumerelaxation mechanism.30 Other efforts propose a simplerelationship between acid diffusivity and extent of reaction,such as a linear increase in diffusion rate with increasingdeprotection level.17,19 While this view is not supported bydirect measurement of acid transport, such models can describethe image blur in a real photoresist. Considering the difficultiesin determining an appropriate acid transport model, exper-imental data are often interpreted with Fickian diffusion using aconstant acid diffusivity.13,55,63 In summary, models for acid-catalyzed deprotection face significant challenges in capturingboth short-time and long-time behavior. Therefore, depending
on the aim of each study, different parameters are introduced tocapture the time scale of interest.Stochastic simulations have been used to describe reaction
kinetics and acid transport in chemically amplified re-sists.8,14,35−37,64 Using a lattice kinetic Monte Carlo algo-rithm,32−34 we defined a microscopic model based on anexplicit description of acid molecules that perform randomwalks with Gaussian statistics. Following the description in theModeling Methodology section, the only adjustable parameterwithin the simulated annealing scheme was the diffusioncoefficient D. For this refinement of D, we used the mastercurve described in Figure 4d rather than the individual datasets, which improves the algorithm’s reliability and the speed ofsimulations. After extracting the diffusivity D for low acidconcentration (1 wt %), we independently created profiles forhigher acid loadings using the same D. Table 2 reports the
values of D as a function of temperature, and Figure 5 plots thesimulated deprotection level for Fickian diffusion against theexperimental data. The extracted values of D are consistent withother reports of acid mobility in deprotected resins.9
Two aspects of the simulations merit further discussion.Referring to Figure 5, we observe that the simulated curve is anexponential growthmuch like the analytical model describedby eq 5 and displayed in Figure 4. Furthermore, the simulateddeprotection rate has a linear dependence on acid concen-tration. The apparent first-order dependence on acidconcentration is a consequence of independent randomwalks, where the mean-square displacement of acid moleculesgrows linearly with time, reproducing a Fickian diffusioncoefficient as shown in Figure 5d. In summary, while thesimulated profiles can capture the correct time scale fordeprotection, they do not provide quantitative agreement withexperimental data.
Anomalous Diffusion. As discussed earlier, a simplemicroscopic Fickian diffusion mechanism fails to capture themacroscopic deprotection rate. However, this discrepancycould be associated with an underlying hopping process thatpresents features of anomalous diffusion.23,39,41−44 At firstglance, the deviations from Fickian diffusion seem consistentwith acid−anion hopping described by a waiting timedistribution with long-tail kinetics.38 Such dynamic processesexhibit a stretched exponential behavior that is reminiscent ofprobe diffusion in polymer glasses.47,65−67 Several models havebeen proposed that provide a quantitative description ofanomalous diffusion in complex materials.42,48−50,68 For ourstudies, we chose the mathematical formalism of a continuoustime random walk (CTRW), where subdiffusive behaviororiginates from acid hopping described by a broad distribution
Table 2. Parameters Extracted for the Two Different Models
model temperature 70 °C 80 °C 90 °C
Fickian diffusionD (cm2/s) 8.4 × 10⁻¹⁸ 5.5 × 10⁻¹⁷ 3.9 × 10⁻¹⁶
anomalous diffusionτ (s) 4.1 × 10⁻¹ 7.6 × 10⁻² 2.3 × 10⁻²
γ 0.44 0.46 0.47anomalous diffusion withannihilation
τ (s) 7.8 × 10⁻¹ 2.1 × 10⁻¹ 6.6 × 10⁻²
γ 0.53 0.59 0.67
The Journal of Physical Chemistry C Article
dx.doi.org/10.1021/jp308997g | J. Phys. Chem. C 2012, 116, 24706−2471624711

of waiting times.23,69 Waiting times were selected from thePareto distribution,46
ψ γ ττ
=+ γ+t
t( )
/(1 / )1 (7)
where γ is the anomalous exponent and τ is the characteristictime. The relationship between the γ exponent and theKohlrausch−Williams−Watts β exponent has been describedfor systems where models of defect diffusion drive segmentalrelaxation.70 Within this context, γ that drives defect motionand β that characterizes segmental relaxation are the same. ThePareto probability density function allows rapid sampling ofwaiting times between successive hopping processes and hasthe required long-time asymptotic scaling39,40,46
ψ γτ τ
∝γ− −
⎜ ⎟⎛⎝
⎞⎠t
t( )
1
(8)
The algorithm was implemented as described in the literature,with instantaneous reaction when an acid translates to a non-deprotected lattice site.31,46 Kinetics are controlled solely byacid transport, which is described with only two parameters, τand γ. It is important to note that more elaborate models fordiffusion in inert glasses are available in the literature. In onesuch model, transport is controlled by a convolution of twowaiting-time distributions that describe short- and long-timebehavior.48 The overall rate is reminiscent of a CTRW, and inthe long-time limit it recovers Fickian diffusion. While such
models could be physically justified for our reacting system, theapplication of this approach would increase the number offitting parameters, thereby limiting the physical insight.Therefore, we chose to proceed with the simpler mathematicaldescription provided by eq 7.We proceeded by determining γ and τ for the lowest acid
concentration at each temperature, and then we predicted theprofiles for the remaining acid concentrations. Figure 6provides significant insight into the microscopic mechanismof the reaction process. For low concentrations and short times,the model of anomalous diffusion offers a quantitativedescription of bulk deprotection data that is consistent withthe observed dependence on acid concentration. The under-lying feature that generates this macroscopic behavior is thesubdiffusive character of acid transport, where the mean-squaredisplacement is
⟨Δ ⟩ ∝ γr t t( )2ens (9)
This subdiffusive behavior is depicted in Figure 6d with γ < 1.Extraction of these data requires ensemble averaging withouttime averaging; the latter could produce inhomogeneousFickian diffusion.71 The subdiffusive model has a diffusioncoefficient that depends on time. However, a constant value canbe defined with the use of fractional derivatives.23 Within thefractional derivative description, we extract a diffusioncoefficient Dγ with values of 3.0 × 10⁻¹⁵, 5.8 × 10⁻¹⁵, and 5.3× 10⁻¹⁴ cm2/s for 70, 80, and 90 °C, respectively.46,72 Note thatlong-tail kinetics lead to higher values of D, which is similar to
Figure 5. Fickian diffusion model. (a−c) Optimal D was determined for the superimposted data at 1 wt %, and profiles were predicted for higheracid loadings using the same D. (d) Mean-square displacement of acid molecules as a function of time.
The Journal of Physical Chemistry C Article
dx.doi.org/10.1021/jp308997g | J. Phys. Chem. C 2012, 116, 24706−2471624712

findings based on Fickian diffusion with an acid-trappingprocess.55 Nevertheless, as we show in the next section, anirreversible trapping reaction within a local volume cannotcapture the higher-order dependence on acid loading. Withinthe subdiffusive framework, the acid molecules experienceshort-time displacements, but long-range diffusion is signifi-cantly penalized. These characteristics are needed to capturethe experimental data in our studies, and other works have alsoemphasized the same pointsmodels must include short-rangefast dynamics while accounting for the extremely low diffusioncoefficient in the deprotected polymer.11 Clearly, the chemistryinvolved in the reaction−diffusion process is quite complex andnot fully understood. However, the subdiffusive model providesa unique insight into the underlying physics and offers a gooddescription of the process with only two free parameters.Furthermore, the concept is consistent with other studies ofinert probe diffusion in glasses.47,65−67
Acid−Acid Interactions. The microscopic view ofsubdiffusive transport is consistent with experimental data forlow acid concentrations and short reaction times. However, athigher acid loadings and longer reaction times, the subdiffusivemodel overpredicts the extent of deprotection. (In contrast,Fickian diffusion underestimated the deprotection level at shorttimes for all acid loadings.) While industrial processes tend tofocus on lower acid loadings and short deprotection times, wesought to identify the cause of such deviations.
Acid loss will reduce the deprotection level at long times. Weattempted to annihilate a selected acid molecule based on anadditional rate in-between hopping intervals,45,46 which issimilar to phenomenological acid-trapping models proposed inother works.13,16,54,55,63 This mechanism provides a quantitativedescription of the deprotection rates at low acid loadings (1 wt%) but cannot capture the data for higher acid loadings with thesame values for τ, γ, and trapping rate. Specifically, we observesignificant deviations between predicted and measured profilesat short times. These results are included in Figure 7a. Todescribe our data, the loss mechanism must depend on acidconcentration in addition to time.Our model employs a simplistic picture of acid molecules
that translate as “ghost” particles without any explicitinteractions. This assumption could break down when theselarge ionic molecules are within a volume of 1 nm3.Furthermore, reaction products could be present within theirimmediate environment, and it is unclear how the localcomposition impacts the reaction chemistry. Therefore, weproposed a simple loss mechanism that does not requirespecification of new parameters: An acid molecule isdeactivated if it hops into an already occupied lattice site,which is equivalent to the following instantaneous annihilationprocess
+ →+ + +H H H (10)
Figure 6. Anomalous diffusion model. (a−c) Optimal τ and γ were determined for the superimposted data at 1 wt %, and profiles were predicted forhigher acid loadings using the same parameters. (d) Mean-square displacement of acid molecules as a function of time for anomalous diffusioncompared to the Fickian model.
The Journal of Physical Chemistry C Article
dx.doi.org/10.1021/jp308997g | J. Phys. Chem. C 2012, 116, 24706−2471624713

This process occurs when acid molecules are within 1 nm ofeach other, which is equal to the lattice grid and an implicitfeature of the algorithm. Using this simple approach, we canquantitatively describe all data at 1, 2, and 4 wt % acid loadingwith two parameters for the distribution of waiting times.Results are summarized in Figure 7. Small deviations persist forthe 10 wt % loading, but this may be associated with the initialconditions: At such high concentrations, it is possible that thespatial distribution of the PAG is not uniform,35 or perhapsthere is a plasticizing effect that leads to faster deprotectionrates at the highest temperatures.73 Two data sets for 90 °Cexhibit a plateau at long times (ca. 1−10 h) that is not capturedby the acid depletion model, and the reason for this behavior isunknown. Similar trends have been observed in other studiesthat incorporate a base quencher.9,74 While our resist formuladoes not contain base additives, it is possible that airbornecontaminants were slowly adsorbed onto the surface of thesefilms, accidentally deactivating the catalyst with a very slow timescale. Such challenges are well-documented in the literature, somanufacturing processes are designed to minimize the delaybetween acid activation and polymer deprotection steps.3,75
The origin of the phenomenological acid depletion is unclear.The reaction proposed by eq 10 may capture aggregation (withcollective movement of aggregates),7 or an increased local acidconcentration may shift the reaction equilibrium to render thecatalyst partially inactive.9 Currently, we do not have directmeasurements that support any of these mechanisms. However,
most of the catalyst is ultimately deactivated by this model, andaggregation alone cannot explain this behaviorthere is noevidence of large-scale phase separation in microscopymeasurements of the resists films. (Atomic force microscopydata are included in the Supporting Information.)To highlight the differences between a Fickian diffusion
model and subdiffusive behavior, we modeled a system with avery low initial concentration of acid (0.05 wt %) to facilitatevisualization of the process. Note that acid−acid interactionsare not relevant in this case. The evolution of this system at 80°C is illustrated in Figure 8, where simulations were based onthe best-fit parameters for Fickian and anomalous diffusion(with annihilation) as reported in Table 2. Within 10 min, theanomalous diffusion model predicts 3 vol % of reacted material,while the Fickian model predicts 1%. After 2 h, almost 11% ofthe material has undergone deprotection with either model.After 24 h, the Fickian and anomalous transport models predict70% and 32% conversion, respectively.
■ CONCLUSIONS
There is substantial demand for quantitative predictions ofresolution limits in chemically amplified photoresists. Whenmacroscopic models are applied to nanoscale lithography, theoutcomes are often more qualitative than quantitative. Suchmodels attempt to describe acid mobility based on the averagematerial composition, and the temporal deprotection rates arecaptured with additional phenomenological processes such as
Figure 7. (a) Anomalous diffusion model with a linear acid loss dH+/dt = −k[H] with τ = 0.26 s, γ = 0.44, and k = 5.5 × 10⁻⁵ molecule/s. (b−d)Anomalous diffusion model with partial deactivation upon acid−acid encounters.
The Journal of Physical Chemistry C Article
dx.doi.org/10.1021/jp308997g | J. Phys. Chem. C 2012, 116, 24706−2471624714

free volume generation, acid trapping, or thermodynamicequilibria. However, glasses are characterized by dynamicheterogeneities, and fluctuations at microscopic length scalesare not easy to incorporate into Fickian diffusion models (orvariants based on local composition).In this work, we examined the acid-catalyzed deprotection of
a glassy polymer resin with infrared absorbance spectroscopyand stochastic simulations. We interpreted experimental datawith a model that explicitly accounts for acid transport, butlocal heterogeneities are introduced through a nonexponentialdistribution of waiting times between successive hoppingevents. The anomalous behavior can also be envisioned as ahopping process with binding−unbinding events at energetic orgeometric traps.23 Thus, this simplified mathematical modelallows us to explicitly examine acid transport withoutintroducing details of the changing environment that aredifficult to capture at local length scales. We find thatsubdiffusive behavior with long-tail kinetics can capture keyattributes of the observed deprotection rate, offering a near-quantitative description of macroscopic deprotection rates, andonly two parameters need to be specified. The same modelparameters can describe the dependence of deprotection levelon acid concentration, and their variation with temperaturefollows the expected behavior. With high acid loadings, wefound it necessary to include acid−acid interactions thatdeplete the effective acid concentration. While the exactunderlying mechanism is unclear, we believe that other factorsare of greater interest for future studies. For example, changes
in acid−counterion size, polymer chemistry, resist filmthickness, and proximity to Tg would highlight the effects ofthe polymer’s dynamical properties on reaction frontpropagation.
■ ASSOCIATED CONTENT*S Supporting Information(i) IR data that demonstrate the rate of thermolysis isnegligible; (ii) glass transition temperature of PHOST−PTBApolymer; (iii) atomic force micrographs of resist film surfaces;(iv) simulations based on Fickian diffusion with different initialconditions. This material is available free of charge via theInternet at http://pubs.acs.org.
■ AUTHOR INFORMATIONCorresponding Author*E-mail: [email protected] (G.E.S.); [email protected](M.D.).
Author Contributions†Equal contributions.NotesThe authors declare no competing financial interest.
■ ACKNOWLEDGMENTSWe acknowledge financial support by the National ScienceFoundation under Grant ECCS-0927147 and Grant CBET-1067356 and the Semiconductor Research Corporation underContract 2011-OJ-2128. We thank DuPont Electronic Materi-als for providing the polymer resin and the Department ofChemical and Biomolecular Engineering for use of the IRspectrometer.
■ REFERENCES(1) International technology roadmap for semiconductors, 2011.(2) Gallatin, G. Proc. SPIE 2005, 5754, 38−52.(3) Ito, H. Adv. Polym. Sci. 2005, 172, 37−245.(4) Ito, H. Proc. SPIE 2008, 6923, 692302.(5) Sanders, D. Chem. Rev. 2010, 110, 321−360.(6) Brainard, R.; Trefonas, P.; Lammers, J.; Cutler, C.; Mackevich, J.;Trefonas, A.; Robertson, S. Proc. SPIE 2004, 5374, 74−85.(7) Glodde, M.; Goldfarb, D.; Medeiros, D.; Wallraff, G.; Denbeaux,G. J. Vac. Sci. Technol., B 2007, 25, 2496−2503.(8) Houle, F.; Hinsberg, W.; Morrison, M.; Sanchez, M.; Wallraff, G.;Larson, C.; Hoffnagle, J. J. Vac. Sci. Technol., B 2000, 18, 1874−1885.(9) Hinsberg, W.; Houle, F.; Sanchez, M.; Wallraff, G. IBM J. Res.Dev. 2001, 45, 667−682.(10) Kozawa, T.; Tagawa, S. Jpn. J. Appl. Phys. 2010, 49.(11) Postnikov, S.; Stewart, M.; Tran, H.; Nierode, M.; Medeiros, D.;Cao, T.; Byers, J.; Webber, S.; Wilson, C. J. Vac. Sci. Technol., B 1999,17, 3335−3338.(12) Goldfarb, D.; Angelopoulos, M.; Lin, E.; Jones, R.; Soles, C.;Lenhart, J.; Wu, W. J. Vac. Sci. Technol., B 2001, 19, 2699−2704.(13) Vogt, B. D.; Kang, S.; Prabhu, V. M.; Lin, E. K.; Satija, S. K.;Turnquest, K.; Wu, W.-l. Macromolecules 2006, 39, 8311−8317.(14) Wallraff, G.; Hutchinson, J.; Hinsberg, W.; Houle, F.; Seidel, P.;Johnson, R.; Olldham, W. J. Vac. Sci. Technol., B 1994, 12, 3857−3862.(15) Croffie, E.; Cheng, M.; Neureuther, A. J. Vac. Sci. Technol., B1999, 17, 3339−3344.(16) Kang, S. H.; Prabhu, V. M.; Vogt, B. D.; Lin, E. K.; Wu, W.-l.;Turnquest, K. Polymer 2006, 47, 6293−6302.(17) Kozawa, T.; Tagawa, S.; Santillan, J. J.; Itani, T. J. Photopolym.Sci. Technol. 2008, 21, 421−427.(18) Sha, J.; Lee, J.-K.; Kang, S.; Prabhu, V. M.; Soles, C. L.;Bonnesen, P. V.; Ober, C. K. Chem. Mater. 2010, 22, 3093−3098.
Figure 8. Snapshots of a 0.05 wt % acid system at 80 °C for theFickian model (F) and anomalous diffusion with acid−acidinteractions (A). Parameters are summarized in Table 2. Initial acidpositions are rendered with the red particles, and reacted material isrepresented by white particles.
The Journal of Physical Chemistry C Article
dx.doi.org/10.1021/jp308997g | J. Phys. Chem. C 2012, 116, 24706−2471624715

(19) Mack, C. A. Microelectronice Technology: Polymers forAdvanced Imaging and Packaging. ACS Symp. Ser. 1995, 614, 56−68.(20) Petersen, J. S.; Mack, C. A.; Sturtevant, J. L.; Byers, J. D.; Miller,D. A. Proc. SPIE 1995, 2438, 167−180.(21) Rodríguez-Canto,́ P. J.; Nickel, U.; Abargues, R. J. Phys. Chem. C2011, 115, 20367−20374.(22) Schmid, G.; Stewart, M.; Burns, S.; Willson, C. J. Electrochem.Soc. 2004, 151, G155−G161.(23) Sokolov, I. M. Soft Matter 2012, 8, 9043−9052.(24) Hacker, N.; Welsh, K. Macromolecules 1991, 24, 2137−2139.(25) Shirai, M.; Tsunooka, M. Prog. Polym. Sci. 1996, 21, 1−45.(26) Dill, F.; Hornberger, W.; Hauge, P.; Shaw, J. IEEE Trans.Electron Dev. 1975, ED22, 445−452.(27) Szmanda, C.; Kavanagh, R.; Bohland, J.; Cameron, J.; Trefonas,P.; Blacksmith, R. Proc. SPIE 1999, 3678, 857−866.(28) Pawloski, A.; Christian; Nealey, P. Chem. Mater. 2001, 13,4154−4162.(29) Tan, T.; Kudryashov, V.; Tan, B. Appl. Spectrosc. 2003, 57, 842−849.(30) Hinsberg, W.; Houle, F.; Poliskie, G.; Pearson, D.; Sanchez, M.;Ito, H. J. Phys. Chem. A 2002, 106, 9776−9787.(31) Yuste, S. B.; Acedo, L.; Lindenberg, K. Phys. Rev. E 2004, 69,036126.(32) Gillespie, D. T. J. Comput. Phys. 1976, 22, 403−434.(33) Gillespie, D. T. J. Phys. Chem. 1977, 81, 2340−2361.(34) Chatterjee, A.; Vlachos, D. G. J. Comput.-Aided Mater. Des. 2007,14, 253−308.(35) Lawson, R. A.; Henderson, C. L. Microelectron. Eng. 2009, 86,741−744.(36) Lawson, R. A.; Henderson, C. L. J. Micro/Nanolithogr., MEMS,MOEMS 2010, 9, 013016.(37) Lawson, R. A.; Henderson, C. L. Proc. SPIE 2010, 7639,76392G.(38) Nagle, J. Biophys. J. 1992, 63, 366−370.(39) Scher, H.; Montroll, E. W. Phys. Rev. B 1975, 12, 2455−2477.(40) Scher, H.; Shlesinger, M. F.; Bendler, J. T. Phys. Today 1991, 44,26−34.(41) Klafter, J.; Zumofen, G.; Blumen, A. Chem. Phys. 1993, 177,821−829.(42) Wang, B.; Kuo, J.; Bae, S. C.; Granick, S. Nat. Mater. 2012, 11,481−485.(43) Eliazar, I.; Klafter, J. Ann. Phys. 2011, 326, 2517−2531.(44) Sokolov, I. M.; Klafter, J.; Blumen, A. Phys. Today 2002, 55, 48−54.(45) Henry, B. I.; Langlands, T. A. M.; Wearne, S. L. Phys. Rev. E2006, 74, 031116 (see Model III).(46) Langlands, T. A. M.; Henry, B. I.; Wearne, S. L. Phys. Rev. E2008, 77, 021111.(47) Wang, C.-Y.; Ediger, M. D. J. Phys. Chem. B 2000, 104, 1724−1728.(48) Chaudhuri, P.; Berthier, L.; Kob, W. Phys. Rev. Lett. 2007, 99,060604.(49) Chaudhuri, P.; Sastry, S.; Kob, W. Phys. Rev. Lett. 2008, 101,190601.(50) Swallen, S. F.; Traynor, K.; McMahon, R. J.; Ediger, M. D.;Mates, T. E. J. Phys. Chem. B 2009, 113, 4600−4608.(51) Wang, B.; Anthony, S. M.; Bae, S. C.; Granick, S.; Chandler, D.Proc. Natl. Acad. Sci. U. S. A. 2009, 106, 15160−15164.(52) Kirkpatrick, S.; Gelatt, C.; Vecchi, M. Science 1983, 220, 671−680.(53) Ferguson, R. A.; Spence, C. A.; Reichmanis, E.; Thompson, L.F.; Neureuther, A. R. Proc. SPIE 1990, 1262, 412−424.(54) Kang, S.; Lavery, K.; Choi, K.-W.; Prabhu, V. M.; Wu, W.-L.;Lin, E. K.; Silva, A. D.; Felix, N.; Ober, C. Proc. SPIE 2008, 6923,692317.(55) Kang, S.; Wu, W.-l.; Choi, K.-W.; De Silva, A.; Ober, C. K.;Prabhu, V. M. Macromolecules 2010, 43, 4275−4286.(56) Wallraff, G. M.; Hinsberg, W. D.; Houle, F. A.; Opitz, J.;Hopper, D.; Hutchinson, J. M. Proc. SPIE 1995, 2438, 182−190.
(57) Jung, B.; Chandhok, M.; Younkin, T. R.; Ober, C. K.;Thompson, M. O. J. Photopolym. Sci. Technol. 2011, 24, 487−490.(58) Jung, B.; Ober, C. K.; Thompson, M. O. Proc. SPIE 2012, 8325,83250N.(59) Jung, B.; Sha, J.; Paredes, F.; Chandhok, M.; Younkin, T. R.;Wiesner, U.; Ober, C. K.; Thompson, M. O. ACS Nano 2012, 6,5830−5836.(60) Zuniga, M.; Wallraff, G.; Tomacruz, E.; Smith, B.; Larson, C.;Hinsburg, W.; Neureuther, A. J. Vac. Sci. Technol., B 1993, 11, 2862−2866.(61) Zuniga, M.; Neureuther, A. J. Vac. Sci. Technol., B 1995, 13,2957−2962.(62) Stewart, M.; Tran, H.; Schmid, G.; Stachowiak, T.; Becker, D.;Willson, C. J. Vac. Sci. Technol., B 2002, 20, 2946−2952.(63) Prabhu, V. M.; Kang, S.; VanderHart, D. L.; Satija, S. K.; Lin, E.K.; Wu, W. L. Adv. Mater. 2011, 23, 388−408.(64) Mack, C. A. Proc. SPIE 2005, 5754, 1−12.(65) Cicerone, M. T.; Wagner, P. A.; Ediger, M. D. J. Phys. Chem. B1997, 101, 8727−8734.(66) Hall, D. B.; Deppe, D. D.; Hamilton, K. E.; Dhinojwala, A.;Torkelson, J. M. J. Non-Cryst. Solids 1998, 235, 48−56.(67) Langer, J. S.; Mukhopadhyay, S. Phys. Rev. E 2008, 77, 061505.(68) Saltzman, E. J.; Schweizer, K. S. Phys. Rev. E 2008, 77, 051504.(69) Metzler, R.; Klafter, J. Phys. Rep. 2000, 339, 1−77.(70) Bendler, J.; Shlesinger, M. Macromolecules 1985, 18, 591−592.(71) Lubelski, A.; Sokolov, I. M.; Klafter, J. Phys. Rev. Lett. 2008, 100,250602.(72) Henry, B.; Langlands, T.; Straka, P. In Complex Physical,Biophysical and Econophysical Systems; Dewer, R., Detering, F., Eds.;World Scientific Lecture Notes in Complex Systems; World Scientific:Singapore, 2010; Vol. 9, pp 37−90.(73) Ellison, C.; Ruszkowski, R.; Fredin, N.; Torkelson, J. Phys. Rev.Lett. 2004, 92, 95702.(74) Hinsberg, W. D.; Houle, F. A.; Sanchez, M. I.; Morrison, M. E.;Wallraff, G. M.; Larson, C. E.; Hoffnagle, J. A.; Brock, P. J.; Breyta, G.Proc. SPIE 2000, 3999, 148−160.(75) Ito, H. J. Photopolym. Sci. Technol. 2008, 21, 475−491.
The Journal of Physical Chemistry C Article
dx.doi.org/10.1021/jp308997g | J. Phys. Chem. C 2012, 116, 24706−2471624716


![Kinetics of enzyme-catalyzed cross-linking of feruloylated ...orbit.dtu.dk/...2011_Kinetics_of_enz-catalyzed_F-ara_x-linking[1].pdf · Kinetics of Enzyme-Catalyzed Cross-Linking of](https://img.pdfslide.net/doc/110x75/5ab87eb37f8b9aa6018cb720/kinetics-of-enzyme-catalyzed-cross-linking-of-feruloylated-orbitdtudk2011kineticsofenz-catalyzedf-arax-linking1pdfkinetics.jpg)