Embed Size (px)
Citation preview

Reaction of" Oxygen with the
Respiratory Chain in Cells and Tissues
B R I T T O N CHANCE
From the Johnson Research Foundation, University of Pennsylvania, Philadelphia
SUMMARY This paper considers the way in which the oxygen reaction de- scribed by Dr. Nicholls and the ADP control reactions described by Dr. Racker could cooperate to establish a purposeful metabolic control phenomenon in vivo. This has required an examination of the kinetic properties of the respiratory chain with particular reference to methods for determinations of oxygen affinity (K,~). The constant parameter for tissue respiration is kl, the velocity constant for the reaction of oxygen with cytochrome oxidase. Not only is this quantity a constant for a particular tissue or mitochondria; it appears to vary little over a wide range of biological material, and for practical purposes a value of 5 X l0 T at 25 ° close to our original value (20) is found to apply with adequate accu- racy for calculation of K,~ for mamrnalia. The quantity which will depend upon the tissue and its metabolic state is the value of K,~ itself, and K,~ may be as large as 0 . 5 / ~ and may fall to 0.05 ~tM or less in resting, controlled, or inhibited states. The control characteristic for ADP may depend upon the electron flux due to the cytochrome chain (40); less ADP is required to activate the slower electron transport at lower temperatures than at higher temperatures. The affinity constants for ADP control appear to be less dependent upon substrate supplied to the system. The balance of ADP and oxygen control in vivo is amply demon- strated experimentally and is dependent on the oxygen concentration as follows. In the presence of excess oxygen, control may be due to the ADP or phosphate (or substrate), and the kinetics of oxygen utilization will be independent of the oxygen concentration. As the oxygen concentration is diminished, hemoglobin becomes disoxygenated, deep gradients of oxygen concentration develop in the tissue, and eventually cytochrome oxidase becomes partially and then com- pletely reduced. DPN at this point will become reduced and the electron flow diminished. The rate of ATP production falls and energy conservation pre- viously under the control of the ADP concentration will now be controlled by the diffusion of oxygen to the respiratory enzymes in the mitochondria. Under these conditions the rate of reaction of cytochrome oxidase with oxygen and the reaction of cytochromes with one another become of key importance. The rise of ADP and the depletion of energy reserves evoke glycolytic activity, and failure of biological function may result.
I65
The Journal of General Physiology
on April 11, 2019jgp.rupress.org Downloaded from http://doi.org/10.1085/jgp.49.1.163Published Online: 1 September, 1965 | Supp Info:

164 OXYGEN CONSUMPTION BY THE CELL
Oxygen was the topic of another symposium only 15 months ago (1), the results of which afford a good jumping off place for this one. There the bio- chemists' point of view emphasized the nature of the oxygen reaction, the site of oxygen utilization, and the amount needed for effective function. Physiologists emphasized the transport phenomena and the cellular architec- ture that led to efficient oxygen supply. Above all a further intense study of oxygen requirements in localized portions of the cells was pointed to.
Here, the program to this point has emphasized the chemical nature of oxygen and its reactivity with oxygen-transporting pigments. The two preced- ing papers considered the reactivities of oxygen and oxygen intermediates
Stimulus I Contractile Element } 0.5/~ rnoles/grn/tw
ATP ÷Cr -
20/J. mole/gin " Cr P÷ADP Pi
O'O06FM/gmltw J Oxidative
Phosphorylation FIOUR~ 1. A schematic diagram of the energy cycle for contractility in muscle (tw, twitch). (MD 104)
with hemoproteins (2) and the control of electron flow in the respiratory chain (3). I will illustrate the control of oxygen utilization by oxygen itself and the control as well of the electron flow by ADP and phosphate, particularly to show how the two phenomena can interact to give an appropriate performance of cellular energy sources in response to physiological demands.
The balance of energy demand and supply is indicated by Fig. 1 where we have taken as an example of energy demand, the contractile element of muscle. The release of P~ (0.5 ~mole/gm/twitch) and ADP is initially in the same amount, but ADP is attenuated by the buffering action of the creatine kinase system to a level of 0.006/~mole/gm/twitch. It is on these terms that the energy demands of contractility activate mitochondrial oxidative phos- phorylation, accelerate electron flow, and increase the rate of oxygen reduc- tion.
The close functional relationship of myofibrils to mitochondria is well recognized and is especially emphasized in thoracic muscles of insects in

BRITTON CHANCE Oxygen Reaction with Respiratory Chain I6 5
which striking and regular patterns of mitochondria and myofibrils are observed (for a recent summary, see reference 4). Perhaps no better example of functional relationship of energy demand and supply is afforded, except in the salt gland of the sea gull (5) in which all the energy supply for functional activity is derived from the mitochondria.
The Cytochrome Chain Little needs to be added to the description of cytochrome function in the cytochrome chain over and above that given by Nicholls (2), but it is convenient to identify the approximate number of com-
Succinate
?
H~O
FIGURE 2. Electron flow in mitochondrial membranes. A schematic diagram of the non- phosphorylating chain. The dashed lines for electron trans- port from succinate represent differing degrees of disruption of the structure of the system. (MD 138 D)
ponents involved in the sequence from substrate to oxygen. As schematically indicated in Fig. 2, succinate and D P N H transfer electrons to their appropriate flavoproteins which communicate them to the chain of cytochromes. In non-phosphorylating systems cytochrome b may be bypassed and quinone reduction may be activated (6). Generally, the chain can be considered to consist of an assembly of approximately one each of the cytochromes (7).
Intramitochondrial Localization of Electron Transport Negative staining with phosphotungstic acid has revealed greater detail of intramitochondrial struc- ture (8, 9) and has led to a number of hypotheses concerning the location of cytochrome chains. For example, the electron micrograph (Fig. 3 and refer- ence 10) indicates at least three possibilities for the location of the respiratory

i66 O X Y G E N CONSUMPTION BY T H E CELL
chain: the inner membrane subunits (IMS), the basem embrane of the crista (M), or possibly the intercristal space (ICS). The interesting speculation that electron transport components were contained in the projecting subunits (11) has been put to experimental tests in a number of laboratories. One of the first and most obvious tests was whether or not cytochromes were re- moved when the IMS were removed. Our 1963 result with rat liver mito- chondria is summarized in Table I (12). Under these conditions a brief sonication strips over 90 per cent of the IMS from the base membrane as shown by electron microscopic examination. A spectroscopic examination of
FIGURE 3. An electron micrograph obtained with negative staining with phosphotung- stic acid representing three possibilities for the location of the respiratory chain in the fine structure of mitochondrial membranes (courtesy of Dr. Donald Parsons). (P 6255)
the cytochrome content gives 0.35 m~mole cytochrome c per mg protein for the stripped membrane. The increase is presumably due to loss of intracellu- lar membrane structure and of other proteins. In other words, we have concentrated, not removed, the electron transport components. The amounts of other cytochromes are essentially unchanged by sonication as indicated by the ratios of a to c and b to c. It is apparent that the cytochromes are not in the knobs (IMS), and since they are "insoluble," it is reasonable to con- elude that they are in the base membrane. Thus, the base membrane of the crista is the site of oxygen utilization in the mitochondria.
Oxygen Control of Electron Flow Fig. 4 illustrates the two types of control that are discussed in this paper, control by oxygen and control by ADP. If we regard the mitochondrion as a transducer in which the rate of formation of ATP (dATP/dT) is controlled by the oxygen concentration, control char- acteristics (13) of an approximately hyperbolic type will be obtained. The point we wish to emphasize is that the type of the control characteristic will depend upon the metabolic state of the mitochondria. In the resting state ADP or Pi is absent (state 4) and the maximal value of dATP/dT will be
BRITTON CHANCE Oxygen Reaction with Respiratory Chain I6 7
T A B L E I
EFFECT OF STRIPPING OF "KNOBS" ON THE CYTOCHROME CONTENT
Appropriate condition Cyto-
Biochemical conditions Electron mierography chrome c 0/¢ ¢,/c b/c
m/.l mole/ mg protein
Mitochondria in P~ Knobs largely intact 0.21 0.70 0.58 0.52 Mitochondria in P~ after sonica- Knobs largely removed 0.35 0.70 0.45 0.36
tion (LSP) (> 90 per cent)
low. In the active state (ADP and phosphate in excess), state 3, dATP/dT, will be higher and the control characteristic will be different.
Illustration of the Region of Oxygen Control Fig. 5 illustrates three regions of interest in the respiratory activity of a non-phosphorylating succinate oxidase preparation. A heart muscle preparation diluted in phosphate buffer gives an initial oxygen concentration as registered by the plat inum electrode of 240 #M. Cytochrome oxidase is highly oxidized and electron flow is minimal. Electron flow initiated by 12 mM succinate starts respiration at a rate of 2.6
COz •
Substrates Pyruvate
(etc.)
Control Properties Of Mitochondria Control
ATP Characteristics For 0~,
ADP, Pi Excess 5.0-
Respiratory Chain
------~ H2 0
- 0 z
+dATP dt
~ 3
/ -ADP, Pi Z State 4
0 I0 O~ (p.M)
ADP Pi State 3 3-0 7 /f-gT~got~ 3 3.o 1
,dArP/ / Pi *dAr l / AOP Excess dt Excess V Exc~tSaS, te4 clt "V Sta,e 4 -ADP, Pi
o [ , o ~ 0 I00 0 I.()
ADP (/zM) [Pi] mM Control Characteristics For ADP
FIOURE 4. Schematic diagram of the mitochondrion acting as a transducer with the control characteristics for oxygen and for ADP and phosphate. (MD 137e)

I68 OXYGEN CONSUMPTION BY THE CELL
~ t oxygen per second and causes a small reduction of cytochrome as in the steady state. The rate of oxygen utilization is constant (zero order) and the percentage reduction of cytochrome an after an initial overshoot, is approxi- mately constant. The oxygen control region occurs as the oxygen trace turns sharply to the horizontal. Simultaneously, cytochrome reduction occurs as indicated by the downward sweep of the spectrophotometric trace. The zero order portion of the curve allows calculation of the turnover number of cyto- chrome an from the quotient of the oxygen rate: 2.6 I~M oxygen per second converted to electrons per second (10.4 /~M electrons/second) divided by
Oxidized ~ [ Steody s to te .. Z40k = M g ' w ~ ' ~ ' P ' ' ~ - 1: 'J " ^ r . "~ . .~ ' /A . N =lOsec~ | 4 4 5 460m,u uxygen ~ ~ • • • , -
! ,ogI I= o.o,sr
~ . ~ Z e r o 0x]/~en
b go 16o S e c o n d s
F I G u m ~ 5. An illustration of the three portions of the oxygen control characteristic prior to the addition of substrate, in the steady state, after the addition of substrate, and as the oxygen is expended. The steady state levels of cytochrome aa are also indicated by meas- urement with the two wavelength spectrophotometer. The preparation is Keilin and Hartree suceinate and oxidase system. (222-B-II)
cytochrome a3 concentration (1 ]~M) giving a turnover number of 10 electrons per cytochrome per second. The value of the oxygen concentration at which cytochrome becomes rate-limiting cannot be determined with ac- curacy from a recording on this scale, but the following paragraph describes two methods by which this portion of the oxygen utilization characteristic can be investigated adequately.
Sensitive Polarographic Recording Oxygen affinity for respiratory enzyme systems has been studied by a number of workers recently and in great detail by Longmuir (14) and more recently in ascites tumor cells by Froese (15). Dr. F. J. Schindler (16) and Dr. H. Ikuma (17) have achieved a high sensi- tivity with the plat inum electrode as indicated in Fig. 6 where the zero order utilization of oxygen is carried down to 0.1 uM. At that point the sensitivity is increased 2.5 times and finally 10 times. With the final increase of sensi- tivity the deviation of oxygen utilization from the zero order kinetics becomes clear-cut.

BRITTON CHANCE Oxygen Reaction with Respiratory Chain :69
Bacterial Luminescence Method Dr. F. J. Schindler has employed with great effectiveness the oxygen sensitivity of bacterial luminescence (17) and has achieved a sensitivity better than 10 -~° M oxygen. The use of this high sensitivity in recording the oxygen utilization in pigeon heart mitochondria is indicated in Fig. 7. In this record pigeon heart mitochondria, initially anaerobic, are supplemented with 0.4/~M oxygen giving a luminescence which after a 30 second disturbance reaches a steady state (zero order region) and fails off linearly as the sensitivity is increased tenfold and finally 100-fold to give one nmolar oxygen, equal to two major scale divisions. It is apparent
Fmux~ 6. A sensitive polarographic recording of the transition from oxygen to first order kinetics of oxygen utilization in a beef heart succinate and DPNH oxidase system. The appropriate sensitivities to oxygen and the time scales as well are indicated (courtesy of Frederick Schindler). (FS-50)
that the oxygen kinetics have approached an exponential phase even on the 10 nM scale.
Summary of Experimental Data Schindler employs two criteria for the oxygen control characteristics. One of them is derived simply from the experi- mental data and represents the value of oxygen concentration at which the initial slope and plateau value of the control characteristic intersect (see Fig. 4). Values obtained on this basis are given as "K,," for baker's yeast, non- phosphorylating beef heart particles, rat liver mitochondria, and pigeon heart mitochondria (see Table II). An alternative calculation of K,, is based upon the equation for a simple enzyme system:
K=- v=,= (:) k: e
Since k: is calculated on an oxygen basis, turnover numbers computed in electrons per cytochrome per second are divided by 4. The turnover numbers

x7o OXYGEN CONSUMPTION BY THE CELL
o.~
Exp. 820b PH Mw
#
Flotn~ 7. The measurement of oxygen utilization in terms of the luminescence of the bacteria A. fischeri. Here light intensity is plotted as a function of time for the addition of oxygen and for the expenditure of oxygen. The various sensitivities and time scales are indicated. Pigeon heart mitochondria are used in this experiment (courtesy of Frederick Schindler). (FS-17)
obtained for the first order region of the control characteristic are listed for the various preparations, together with values of kl determined by methods described below. The value of K~ is then calculated from the equation:
TN 1 (2 ) ~, . = - T - × kl
These values of K.~ are seen to compare closely with the values of K , ob- tained directly from the control characteristics. The ratio of these values is approximately 0.6; the multienzyme system of the cytochrome chain approxi- mates the simple enzyme system with respect to its oxygen control character- istic.
T A B L E I I
CORRELATION OF VALUES OF kl, TURNOVER NUMBER, AND APPARENT
Km AT 23-26°C (x6)
Cytochrome oxidase Turnover Apparent Experiment system No. k3 X 10-7 Km TN/4k l Ratio
401 (Polarographic) 215a 130 (Polarographic
Luminescence) 820 (Luminescence)
Baker's yeast, ethanol Beef heart particles Rat liver Mw, gluta-
mate, succinate Pigeon heart Mw,
Glutamate, succinate
electrons/ heine a/see. M-I sec.-x DM ~M
59.0 2.6 0.41 0.56 0.73 18.0 5.4 0.052 0.085 0.61 6.8 2.6 0.042 0.065 0.65
1.9 1.7 0.019 0.028 0.68

BRITTON C~ANCE Oxygen Reaction with Respiratory Chain I71
These experimental data point to the variability of K~,. It is a quanti ty which is linearly related to the electron transport rate of the system under study. Therefore, it cannot be given as a fixed parameter of a given tissue or cell or mitochondrion. It must be one in which the metabolic state and as- sociated electron transport activity are specified. The range of variation in- dicated by Table II is very large. For pigeon heart mitochondria with a low turnover number the value is approximately 0.02 #M while that obtained with rapidly respiring yeast is approximately 0.5 #~t. The turnover numbers given here cover the range of values to be expected in mammalian tissue.
02~ p l~ p~-~ p-5-,- p4~ AH
1 . 0 - X ' ' P i - -40
0 TIME (sec.)
Illl O.
Fmug~ 8. An illustration of the high sensitivity of components near the oxygen reac- tion to oxygen concentration compared with the low sensitivity of components far from the site of the oxygen reaction; analog computer solution of kinetics of 4-enzyme system (see top of figure) for the addition of 40 /~t oxygen to I / ~ each of the enzyme inter- mediates. (AC-54)
These values agree fairly well with previous values for yeast (18, 19). The values for succinate oxidase are in better agreement with the values of Long- muir (14) than are the values which we obtained from the "tai l" of the oxygen electrode curve and from the tail of the fumarate curve (19). I t is probable that the enzyme concentrations were so high under our experimental conditions that the enzyme passed too rapidly through the first order region for an accurate measurement of the K~, value.
Determinations from the Oxygen Kinetics The calculations of Table II require the value of the "on" velocity constant for cytochrome oxidase:
tt kl ut 0 2 + a~ , a3 + O~- ( 3 )
As indicated from the nature of the curve in Figs. 7 and 8, when the over-all

I72 OXYGEN CONSUMPTION BY TIlE CELL
reaction is in the "first order" region, the first order velocity constant for oxygen utilization can be calculated according to the following formula:
2.303 , [O~]tl (4) k - t2 - - t~ m g [ O ~ ] t 2
The reaction velocity constant kl is then calculated from the equation:
k kl - (5) M
where "a" is the cytochrome oxidase concentration calculated from spectro- photometric data (16).
T A B L E I I I
VALUES OF kl F R O M OXYGEN KINETICS (I6)
Experiment Material Method k(sec. "a) [a] kt X io-7
n/~.i¢ / g - i X ~ c . - J
401 Baker's yeast (ethanol) Polarographic 0.044 1.7 2.6 127 Beef heart particles Luminescence 0.165 4.0 4.1 130 Rat liver Mw (gluta- Polarographic 0.087 3.3 2.6
mate, succinate) 820 Pigeon heart Mw (glu- Luminescence 0.098 5.8 1,7
tamate, succinate)
A summary of values obtained in this way by polarographic and lumines- cence methods is included in Table I I I for the same materials as studied in Table I, the first order k being in the range 0.04 to 0.16 and the heme a con- centrations in the range 1.7 to 5.8 riM. It is important to note that calculations of heme a concentration involve the molecular extinction coefficient of cyto- chrome oxidase, and the value Ae = 12.5 for the oxidized-reduced change at 605 and 625 mM is employed here.
The values of kl for the four materials are in the range 1.7 to 4.1 X 10⁷ M -1 sec.-1. The range of values relative to one another is outside the known experi- mental error and is at tr ibuted to differences in the nature of the reaction velocity constant for cytochrome oxidase in different organs, tissues, and species.
Determinations from the Cytochrome Kinetics For some time we have at- tempted to develop rapid flow methods suitable for measuring cytochrome kinetics in situ in suspensions of mitochondria and cells (20, 21). In this ease the first order constant k and the second order constant are calculated as follows:
k - 2.303, [as]o t l o g ~ s e c Y 1 (6)

BRITTON CHANCE
and:
Oxygen Reaction with Respiratory Chain I73
k kt = LuJ"~; ( 7 )
It is important to note the difference in the calculation of kl in Tables I I I
T A B L E I V
VALUES OF kl FOR CELLS, MITOCHONDRIA, AND SUBMITOCHONDRIAL PARTICLES
Material
Yeast cells
Ascites tumor cells
Rat liver mito- chondria
DPNH oxidase preparation
Rat liver mito- chondria
Tern- Time [02] k see.-I X 10"-7 Authors Method perature range
~-~ X $e¢.-1
Regenera- 16 530 3.0 tive flow
Regenera- 16 360 2.0 tive flow
Regenera- 3 158 5.3 tive flow
Accelerated " 1-60 t~M <900 1.0 flow
"Pulsed 16 490 3.1 f low ' ~
~'SGUSSiOnS
Chance, B., and Le- gallais, V., Faraday So¢., 1954, 17, 123.
Chance, B., and Le- gallais, V., Faraday So¢., 1954, 17, 123.
Chance, B., and Wil- liams, G. R., J. Biol. Chem., 1955, 217, 1, 429.
Chance, B., Mackler B., Holmes, W., and Higgins, J. , Abstr., 129th Mtg. Amer. Chem. Sot., Dallas Texas, April 8-13, 1956.
Chance, B., and Schindler, F., in Ox- idases and Related Redox Systems, (% E. King, H. S. Mason and M. Morrison, ed- itors), New York. John Wiley and Sons, Inc., in press (see also reference I7).
and IV. In the former, kl is computed from the heine a concentration; in the latter, it is computed from the oxygen concentration.
Table IV summarizes values of kl for yeast cells, for ascites tumor cells, and for rat liver mitochondria and DPNH oxidase preparation from beef heart, duplicating the experiments of Table I I I with the exception of pigeon heart mitochondria. The second order constants agree very closely for baker's yeast cells (2.6 and 3.0 respectively for Tables I I I and IV), but for rat liver

I74 OXYGEN CONSUMPTION BY THE CELL
mitochondria, 3.3 and 6, there appears to be a discrepancy of a factor of approximately 2. The data for the beef heart preparations are not comparable, since the values of Table I I I are measured at 3 °.
In order further to determine whether a discrepancy may exist between the two methods of measuring kt, we compare in Table V the values for k~ from the solubilized cytochrome oxidase preparation of Yonetani (22) deter- mined by the luminescence method according to Schindler and by stop flow photolysis according to Gibson and Greenwood (23). The experiments were carried out at temperatures within a few degrees of one another and give
T A B L E V
VALUES OF kl F O R " S O L U B I L I Z E D " O X I D A S E F R O M BEEF H E A R T (YONETANI P R E P A R A T I O N )
Tem- Method perature [Oxidase] [Oz] k(sec.-0 kl X 107 References
°C M-I S~C,--!
Luminescence* 25 3 X 10 -9 10 -8 0.067 2.2 F. Schindler Stopped flow~ 28 5 X 10 -7 10 -4 Up to 1100 8.0 Q. Gibson and
photolysis 1 X 10 -4 C. Green- wood, personal communica - tion
k * k l ~ - - [a]
k $ ks = - -
[O2]
velocity constants of 2.2 and 8.0 X 10⁷ M -1 sec. -I. Here a fourfold ratio of the two determinations is observed.
The possibility that a significant discrepancy exists between the two methods points first to the difference in the basis on which kl is calculated, on the basis of heme a concentration in the polarographic method, and on the basis of oxygen concentration in the flow and photolysis methods. It is less likely that an error has occurred in the measuring of oxygen concentration than in the measurement of heme a. The nature of the error suggests that the heme a concentration has been overestimated by the optical method. In the flow method we determine the speed with which all the reducible heme a (cytochrome a3) can react with oxygen, regardless of whether this oxidase can " turn over" in steady state function. In the oxygen method we deter- mine the decrease of oxygen utilization rate as the oyxgen concentration approaches zero, and the heme a concentration here refers to the functional or "turning over" cytochrome a8 or heme a. A discrepancy of this type is a distinct possibility in the case of the solubilized preparations where the amount

Bma~roN CHANCE Oxygen Reaction with Respiratory Chain I75
of active cytochrome oxidase may be only a portion of the total heme a (the basis for the calculation of oxidase concentration makes the assumption of equal amounts of a and a3). These data suggest that only 25 per cent of the oxidase is active under the conditions of the experiment. The results for rat liver mitochondria also show some discrepancy. Here we have no reason to believe that a portion of the cytochrome oxidase of the mitochondria is inactive. Also it is possible that unknown aspects of the oxidative phosphoryla- tion mechanism inactivate the cytochrome oxidase. I t is possible, too, that in this case the value of the extinction coefficient from which the heme con- centration is determined is somewhat too low. On the other hand, the rather good agreement of the values for yeast indicates that this suggestion is inade- quate. It is probable that experiments specifically designed to investigate the discrepancy of the k~ values are desirable.
The purpose of these studies is also to determine the K~ value. The value of kl of 5 X 10⁷ ~-~ see. -~ is sufficiently accurate for determination of Km to the accuracy with which the turnover number is known in various cells and tissues. Thus, it is recommended for oxygen affinity calculations that the following relation be used at 25 o (the dimensions of Km are moles per liter) :
TN 1 - 5 X 10 -9 X TN (8) K,~ = - -T-× 5 × 10 ~
At 38 ° the value of kl should be increased to 2.5 × 10⁸;/£,~ = 10 -9 TN.
The Cushioning Effect Since we are dealing with a multienzyme system of the respiratory chain, it is not obvious that an oxygen lack sufficient to cause complete reduction of cytochrome oxidase would cause a corresponding inhibition of electron flow. While one can observe this experimentally, we will take as an example an analogue computer simulation of the kinetics of inter- mediates of a four-enzyme system (Fig. 8) (19) ; p l , p2, P3 represent the cyto- chromes a, c, and c1 of the respiratory chain. The analogue computer repre- sentation starts with zero oxygen concentration and represents the addition of 40 #M oxygen to a system of 1 #M each of the enzymes. The duration of the steady state of p~ is very short and the changes of its steady state towards increased reduction are apparent throughout nearly the entire course of oxygen utilization. The effect is much less for p2 and P3, and for p4 an almost constant steady state level ensues during the interval of oxygen utilization. Reduct ion occurs only as the oxygen kinetics break into their final exponential phase. It is a property of a multienzyme to maintain a constant electron flow for a wide variety of steady state changes of the terminal oxidase, and it is this characteristic which tends to stabilize electron flow in the respiratory chain. This diagram further indicates that the steady state concentration that is relevant to electron flow to the chain is not that of the terminal oxidase bu t

I76 OXYGEN CONSUMPTION BY T H E CELL
of the component nearest the substrate, p4 in this diagram, but in the intact respiratory chain, DPNH.
In order to illustrate this principle, we compare in Fig. 9 the kinetics of reduction in the aerobic-anaerobic transition of a cytochrome with that of D P N H in a suspension of baker's yeast cells. The oxygen kinetics are recorded on the lowest traces. The concentration changes indicate the initiation of respiration, the zero order portion, and the characteristic break at low oxygen concentration. This trace was differentiated electronically to give the oxygen rate, and it was seen after a relatively slow rise to a maximum and a slight overshoot (due to a partial transition from state 3--4) (24) that the rate trace indicates the abrupt termination of respiratory activity. The time constant in the integrator is significant, and the break in the trace is probably slightly delayed from the actual time at which it occurs in the oxygen trace. Cyto- chrome c is indicated on the top trace. The addition of glucose causes reduction to an approximately constant steady state level, until the oxygen concentra- tion becomes rate-limiting and cytochrome c makes a transition to its reduced steady state. In the third trace from the top pyridine nucleotide is measured fluorometrically with 360 m~ excitation and 450 mg measurement. Addition of glucose causes reduction to an approximately steady state (the D P N H cycle is small for these particular cells, reference 25). At the time marked by the abrupt reduction of cytochrome c and the abrupt termination of respira- tory activity, reduced pyridine nucleotide makes a slow transition to the fully reduced state. A slow transition that starts slightly later than the cytochrome c trace is expected from the cushioning effect. An additional effect observed in. cells and tissues is the oxidation-reduction change in the cytoplasm that may accompany that in the mitochondria. These methods do not allow dis- tinction of redox changes in these two compartments and the microfluoro- metric technique is required (26). Two additional traces are provided, one indicating the kinetics of acid production by yeast which is not noticeably affected at the moment of the aerobic-anaerobic transition because of the rate- limiting step in pyruvate decarboxylation. In the sixth trace, light scattering measured at 540 m# shows no change for the yeast cell suspension since 540 m# is an isobestic point for the oxidized-reduced changes. These traces verify that D P N H can be used as an indicator of the intracellular oxidation- reduction state.
Application of the Fluorometric Method to Oxidation-Reduction States in Cells and Tissues In order to make meaningful observations of the response of the respiratory enzymes to anoxia in tissues, it is necessary to consider a tissue which is actively metabolizing and which does not have large oxygen reserves. Skeletal muscles in a resting state are quite unsuitable. For example, the end point of pyridine nucleotide reduction in anoxia in a frog's excised sartorius muscle was not observed for about 4 hours after bathing with nitrogen (27).

BRITTON CHANCE Oxygen Reaction with Respiratory Chain I77
We have preferred, therefore, to carry out studies of hypoxia on the exposed cortex of the anesthetized rat or on the surface of the beating perfused heart. We shall describe examples of both these tissues. Since the review of our work on this point has recently appeared (28), only a few examples of the applica- tion of the fluorometric technique to measurement of oxidation-reduction states in vivo need be afforded (28).
Fig. 10 illustrates the effect of stepwise decreases in the inspired air upon the light absorption of hemoglobin and the fluorescence of reduced pyridine nucleotide. The two latter quantities are measured in the same region of the cortex (29). The top trace represents the per cent oxygen in the air inspired through a tracheal cannula by a urethane-anesthetized rat. I t is seen that
I Cytochrome c --~ 25sec.~-- Reduction 550 - 540rn F
I . ~ 3. I Hydrogen I o n - - " - " ' ~ " + ~ ~'~ log I"JT =0.010 Concentration | "" 0.'~01 p H ~ l ~
Increase ~ ~ c _J_ T - 2 %
,PyridineNucleotide J ~ - ~ T Reduction I ~ 1'
I L.s. \ "- ,o.o M [H*] -f- Light - , •
Scattering Decrease 1 2.4FM 02/sec. 10%
Oxygen T IConcentrotion Decrease ~ / ~ " ~ z~u' \ ._,L
l Oxygen , ¢ ~ ' ~ ~ IFM O~p./sec. ~Rate Decrease I T
5rnM Glucose l % = 0
FIGURE 9. Mulfichannel recording of respiratory components in aerobic-anaerobic transition of a suspension of baker's yeast cells. Traces are appropriately labeled: cyto- chrome c, pH, DPNH, light scattering, oxygen, and oxygen rate. The reaction is started by the addition of 5 n~ glucose. Time scale proceeds from left to right. The moment of addition of 5 m~ glucose is indicated by the notch in the light-scattering trace. (1003-V)
the inspired oxygen is decreased stepwise from 20 to 10 to 6 to 0 per cent and then back to 20 per cent.
The trace immediately below the oxygen trace is obtained by reflectance measurements of oxyhemoglobin dissociation by means of a 2-wavelength spectrophotometer incorporated into the fluorometer (30). The trace indicates a stepwise downward deflection for the transitions from 20 to 10, 10 to 6, and 6 to 0 per cent oxygen in the inspired air. The trace also indicates the recovery of hemoglobin oxygenation as air is breathed.
The bottom trace indicates the increases of fluorescence that accompany the decrease of inspired oxygen, and it is seen that the changes are scarcely measurable until the inspired oxygen is decreased from 6 per cent to zero.
178 OXYGEN CONSUMPTION BY THE CELL
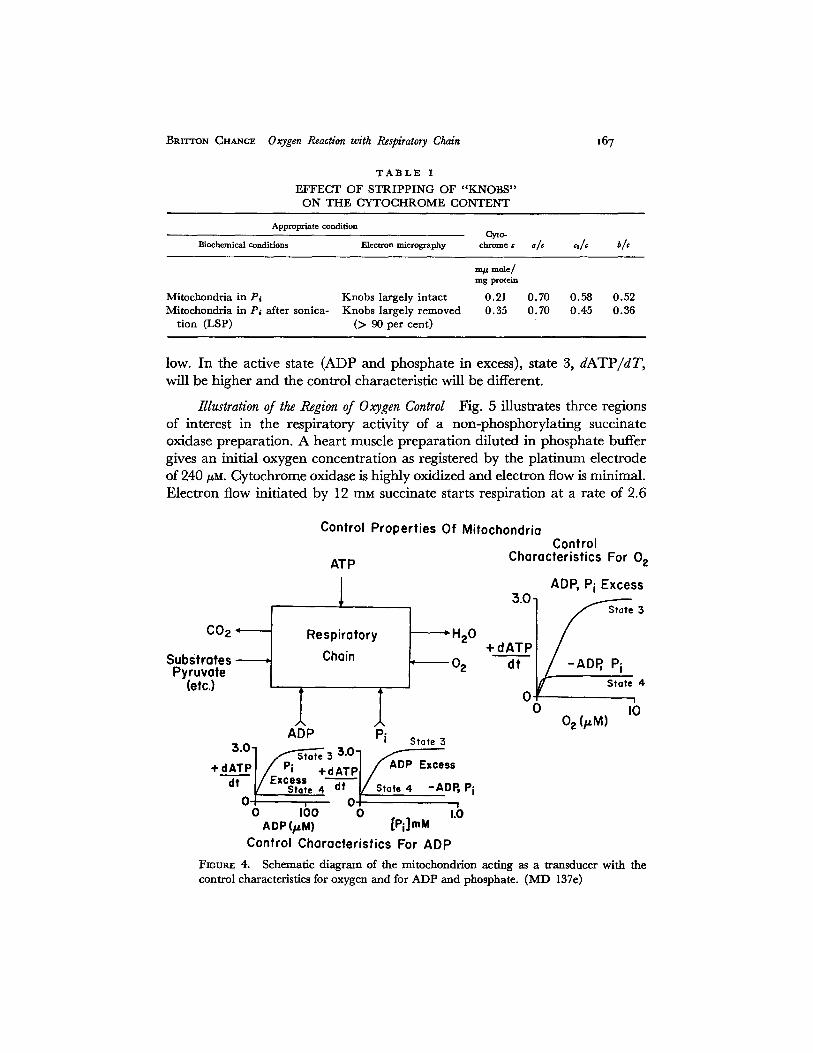
Thereupon, there is an abrupt reduction of DPN. Thus, this is the critical region for DPN reduction of the type indicated by the preceding Fig. 9. A number of detailed studies indicate that the per cent oxygen in the inspired
Rat Brain
i , I I , I
20 2 0 _ _ --
10 - ~ .
o
Absorpt ion c lecreose-~_ at 6 2 5 m F ~.
,¢[ u')
Fluorescence in creas; ~ 3 6 6 m F exci tat ion 4 5 0 rn/~ - -
I
I
o%i '-. / , ,
=N' &.
Fiou~ 10. An oxygen-nitrogen transi- tion in vivo. Recordings from the cortex of an anesthetized rat; top trace, per cent oxygen in aspired air; middle trace, absorbancy chain and wavelengths ap- propriate to the measurement of hemo- globin disoxygenafion. Bottom trace, the increase of fluorescence of the exposed cortex proportional to the degree of re- duction of pyridine nueleotide. Time pro- ceeds from left to right, and the ap- propriate sensitivities are indicated on the graph. (851-43III)
air which gives half-maximal DPN reduction is 3 per cent. It is obvious from this record that the intracellular oxidation-reduction state is independent of the large fluctuation of the oxyhemoglobin concentration, and in all likelihood changes of the intracellular state only occur when the oxygen concentration

BRITTON CHANCE Oxygen Reaction with Respiratory Chain x79
Rat Brain
mm 02 Inlspired = ~ _ ~
FIGURE 1 1. Correlation of platinum microelectrode recording of tissue oxy- gen tension in the rat brain cortex with fluorometric recording of the in- tracellular oxidation-reduction state. Appropriate scales for the two record- ings are indicated in the graph. Other conditions the same as for Fig. 10. (867-15-III)
is sufficiently low tha t h e m o g l o b i n is essentially comple t e ly d i soxygena ted in the v ic in i ty of the cell showing a significant increase of D P N reduct ion .
S imi la r i n fo rma t ion is ob t a ined wi th a p l a t i n u m elect rode loca ted n e a r the
site u n d e r f luoromet r ic obse rva t ion (Fig. 1 I). I n this case the decrease of
Williamson ~ domieson
150
~' 120 "I"
E E 9 O
0 o. 6 0 Q =. l~. 30
0
FIGURE 12. Comparison of oxygen elec- trode recording with the intracellular oxida- tion-reduction state in the perfused rat heart. A gold electrode is inserted into the heart tissue near the area of fluorometric observa- tion. Appropriate sensitivities are indicated in the time scales. (Courtesy of J. R. Williamson and D. Jamieson.) (JRW-29)

~8o OXYGEN CONSUMPTION BY THE CELL
oxygen concentration recorded by the platinum electrode is indicated by an upward deflection, and the millimeters of oxygen in the inspired air are in- dicated on the top of the recording, 100, 65, 40, and 20. The tissue oxygen tensions estimated from the platinum electrode (for the discussion of possible errors in this method, see reference 1) are 58, 27, 6, less than 2 mm. While some reduction of D P N occurs at the 2 mm reading, most of the reduction occurs at lower tissue oxygen tensions. It is apparent that the sensitivity of the plat inum electrode is inadequate for the determination of the very small oxygen concentrations at which true intracellular hypoxia occurs.
A similar experiment on a perfused heart is indicated in Fig. 12. In this case the intracellular oxidation-reduction state is measured fluorometrically in the perfused heart and a gold electrode is inserted near the area of fluoro- metric observation for tissue oxygen measurement (31). On this trace a decrease of oxygen concentration is indicated as a downward deflection. The fluorescence recorded on the upper trace and pyridine nucleotide reduc- tion are indicated as a downward deflection. On changing the perfusate from oxygenated to nitrogenated medium, there is a precipitous fall in the tissue oxygen concentration indicated by the platinum electrode, and a reading of 60 mm is obtained before the D P N reduction is observed to increase. The two curves appear to follow the same course thereafter, and both recover towards their initial states on changing to oxygen-saturated perfusate. It is apparent from the experimental data for the Km of beef heart mitochondria (estimated to have turnover similar to that of the perfused rat heart) that the D P N reduction would not have started until oxygen tension of a few tenth micro- molar. The electrode apparently overestimates the tissue oxygen tension, probably due to damage to the tissue immediately surrounding the electrode (for a discussion, see reference 32).
In summary the experimental data indicate that the change of fluorescence of tissues in the aerobic-anaerobic transition is a highly sensitive oxygen indicator; neither hemoglobin dissociation nor oxygen electrode techniques have an oxygen sensitivity comparable to that of the intracellular indicator. From what has been discussed above concerning the cushioning effect, the steady state level of D P N H should be most closely related to the electron flux rate, and we may therefore correlate the Km values of Table II with half- maximal increase of the pyridine nucleotide reduction in the aerobic-anaerobic transition (for further discussion, see reference 28I).
The Relationship between Oxygen Aj~nity and Cell Function The relationship of D P N reduction and cessation of oxidative phosphorylation to functional
1 I n that paper we compared the Km values with oxygen concentration for half-maximal Z)PN reduc- tion and for half-maximal cytochrome reduction and showed that they were significantly displaced due to the cushioning effect. I n these experiments having more accurate values for K, , , we may correlate the D P N reduction with the/i 'm values as in the case of heart tissue above.

BRITTON CHANCE Oxygen Reaction with Respiratory Chain ISI
activity of tissue may be obscured by the presence of other energy sources such as glycolysis or energy reserves such as phosphocreatine. It is therefore essential to select a tissue and a metabolic state in which sensitivity to its mitochondrial energy source can be observed. It is obvious that muscle is a poor candidate for such study because of the high glycolytic activity of these tissues and a high phosphocreatine reserve. Tissues specialized for active transport are suitable, particularly those where the active transport can be recorded in terms of electrical activity. For this reason we have chosen to correlate the amplitude of the electroencephalogram of the rat brain with DPN reduction in anoxia observed fluorometrically under conditions where
20% 0 z I0~ °I" N,OIB[eathing Starts
I~reathing Stops
Added 1.2mg Picrotoxin _L 92.5% N20 7.5% 02 ~.,--60sec-~l Imv EEG
Fluorescence Increase 366- - '~450 "f-
,FzouRE 13. A correlation of functional activity as measured by the amplitude of the electron encephalogram of the rat brain with the intracellular oxidation state as measured fluorometrically in the rat brain cortex during a transition from 7~ per cent in the as- pired air to zero per cent in the aspired air. Time proceeds from left to right and calibra- tions are indicated in the diagram. (527-I0-III)
the energy reserves had been depleted. Two methods of depletion are em- ployed: (a) by injection of picrotoxin or metrazol to obtain maximal elec- trical activity, and (b) by giving an interval of several minutes of moderate hypoxia before acute hypoxia. In this way we have obtained the record of Fig. 13 in which the top trace indicates the moments at which the inspired nitrous oxide is increased from 99.5 to 100 per cent and the moments at which the breathing of the animal was observed to stop. The middle trace represents the amplitude of the electroencephalogram recorded from a single electrode in the area of fluorescent observation. The bottom trace indicates the DPN reduction level as a function of time with the animal breathing 7.5 per cent inspired oxygen, Under these conditions the electrical activity is high and a few minutes after starting the recording, there is an episode of DPN reduc- tion even at 7.5 per cent oxygen from which a recovery is observed and which does not interfere with the electrical activity of the cortex. It is only when 100 per cent nitrous oxide is added that I )PN reduction increases, and almost immediately thereafter the electrical activity decreases and ceases to be observable when DPN reduction is approximately 80 per cent. These and other recordings indicate that the physiological function measured under

x82 OXYGEN CONSUMPTION BY THE CELL
these conditions is not inhibited until pyridine nucleotide reduction ap- proaches a high level of reduction. In fact, we have estimated that the oxygen concentration which would correspond to half-maximal D P N reduction should be divided by approximately 3 in order to give an oxygen tension which would lead to cessation of the activity on the cortex represented by the electroencephalogram.
Succinate
X - I
o / Estimated M w ~ 2 x I0 e
(Oiameter ~ 170 A )
Fioum~ 14. A schematic diagram of the sites by which oxidative phosphorylation con- trois electron transfer in the respiratory chain or oxysome (the letter symbols refer to cytochromes, Q to ubiquinones,/p to flavoprotein; X and I are hypothetical intermediates of oxidative phosphorylation). (MD 138-B)
It is highly desirable to carry on experiments of this type for the correlation of a more quantitative measurement of D P N reduction. However, the chief problem seems to be the establishment of a level of functional activity and an exhaustion of energy reserves in the tissue under observation.
Control of Oxygen Utilization by ADP and Phosphate If we refer again to Fig. 4 we see on the bot tom portion the control of the rate of formation of A T P (dATP/dt) or by the ADP phosphate concentration when the oxygen concentration is not controlling. These control characteristics differ from the oxygen control characteristics since they do not pass through the point zero, zero but are displaced by the resting or state 4 respiration of the mito- chondria. This level of respiratory activity is probably set by the energy requirements for the mitochondria to maintain a structural integrity and

BRITTON CHANCE Oxygen Reaction with Respiratory Chain I83
appropriate ionic composition. The rate may be accelerated at least tenfold by additions of ADP and phosphate.
The sites at which ADP control is exercised are indicated by the diagram of Fig. 14. While only one site is employed for control of electron transport by oxygen, three sites are employed by ADP and phosphate control. There are probably both thermodynamic and kinetic reasons for this. The thermody- namic argument is based upon the idea that the energy requirement for ADP phosphorylation is only a fraction of the energy available in oxygen reduc- tion and substrate oxidation. Kinetic reasoning is based largely upon the cushioning effect illustrated by Fig. 8. For a mult ienzyme system a more effective control can be obtained by simultaneous action at a number of sites in the chain than by action only at the terminal site. Fig. 14 indicates the three sites at which kinetic data indicate control interaction between D P N H and flavin, between cytochrome b and ci, and between cytochrome c and a (7). The first of these three sites is the one on which Dr. Racker has given evidence of the participation of an 0-phenanthroline-sensitive substance in the control mechanism (3). His data are probably the first to indicate the extent of control over single sites; with the three sites acting together for D P N H oxidation, control ratios well in excess of tenfold and as high as 40- fold have been observed (33). Control ratios are always less in succinate oxidation and factors of 7 are usual. Only scattered evidence is available for control between cytochromes c and a, and it is clear that the degree of control there is not as great as it is at the first two sites. Evidence that control may be emphasized in certain states of mitochondria is provided by phosphate deple- tion on addition of low concentrations of manganese or calcium (34). It is apparent that high degree of control of electron transport by ADP and phos- phate observed in intact mitochondria results from the cooperation of control at the three sites (7).
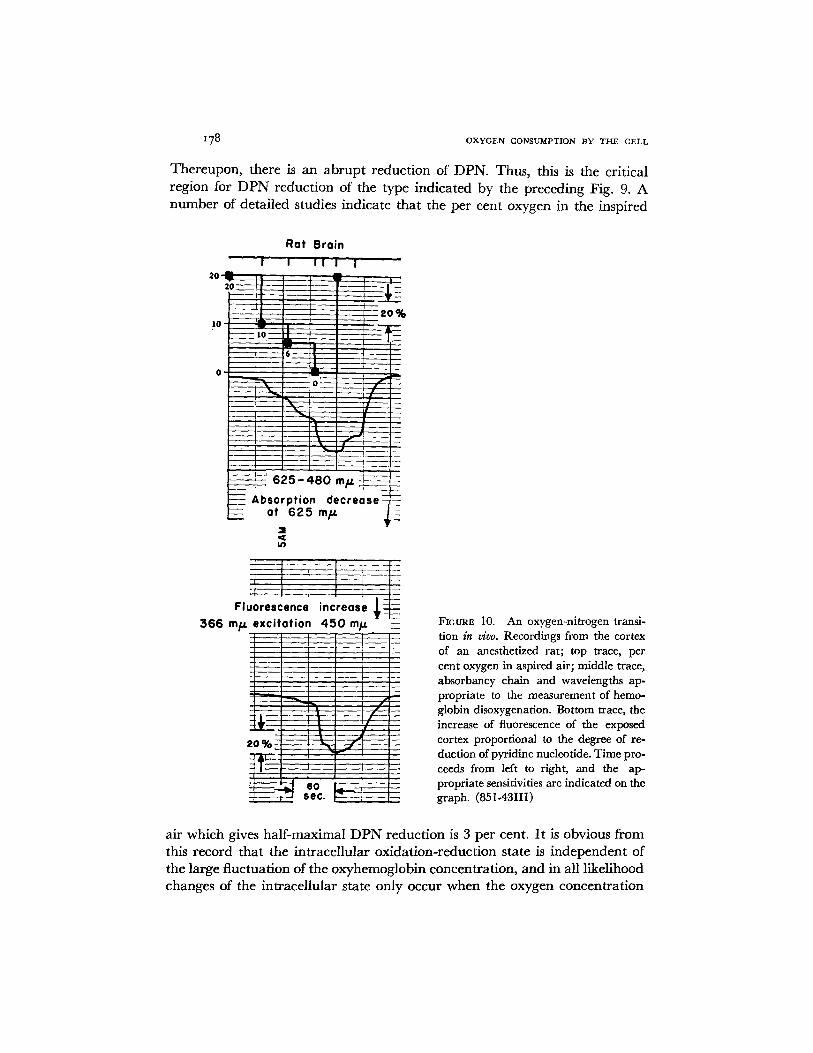
The fact that ADP exerts control over electron flow and over the steady state oxidation-reduction levels of the respiratory carriers can be used to identify the presence and absence of ADP or phosphate; an example of this is illustrated in studies of rat liver mitochondria in Fig. 15. Here, as in Fig. 9, we have indicated on the bot tom two lines the respiratory activity of the rat liver mitochondria suspension in response to one addition of 4 mM succinate and to three additions of 170 #M ADP. As previously, both oxygen concentra- tion and oxygen rate are measured.
The second trace from the top represents the recording of the fluorescence changes of D P N H with 366 m# excitation and 450 m~ measurement. The addition of succinate gives a low oxidation rate which is accelerated many fold on adding 170 #M ADP as indicated by the derivative trace, dO2/dt. The respiratory stimulation lasts only as long as the ADP remains unphosphoryl- ated so that the record illustrates the ability of ADP to control activation of
x84 O X Y G E N C O N S U M P T I O N B Y T I - ~ C E L L
N H
o H
0 0
0 ~ 4
l | ,- ! | I I I ! 1 I
g .~'=
. . ~ co _ J ¢,
i
. o o ~ o ~
a ~.
z u~ a ..i ~ ~ :o
,, o ~ . ~
o~ ~
~ , , , . . _ • a. "~.. "'~ :g • ,-, ~ ~ "~
- ~
.,:- ~,._ ~ -~ • - - C X 0 :K -.J ":- 0 ~ o ~
• T- m
o
0
a~ P"
L~ ~ - ~ . o

BRITTON CHANCE Oxygen Reaction with Respiratory Chain I85
respiration and the reverse of this process. The top trace in this case repre- sents cytochrome b rather than cytochrome c of Fig. 9, but the convention of recording is the same. Addition of substrate reduces the component, and the three additions of ADP each cause oxidation of cytochrome b followed by a reduction which is synchronous with the slowing of respiratory activity. The last addition of ADP carries the system into anoxia, and it can be seen from the scale of the record that steady state changes in cytochrome b are a large percentage of the oxidized-reduced effect. The second trace from the top indicates the pyridine nucleotide components to be reduced on adding succinate and to show cyclic oxidations and reductions on two of the addi- tions of ADP. On the third addition of ADP, the respiratory activity is t e r m i - nated not by the phosphorylation of ADP but by the expenditure of oxygen. Thus we have two examples of ADP control, but in the third example, the respiration is activated by ADP but is slowed by the exhaustion of oxygen. Thus the third record is especially interesting since it represents an accelera- tion of respiration under the ADP control and a deceleration under oxygen control.
The third trace from the top represents light-scattering changes measured at 540 mtz. The mitochondria show a light-scattering decrease on adding substrate, and for each of the two additions of ADP, they show slight cyclic light-scattering increases and decreases which are in reasonable synchrony with the stimulation of respiration (35). On the third addition of ADP it is probable that the slight jog in the trace observed at the moment of the aerobic- anaerobic transition is due to oxidation-reduction change rather than to a scattering change; 575 m/~ is an approximate but not an exact isosbestic point for the oxidized-minus-reduced spectrum.
It is apparent that ADP control of mitochondrial electron flow can be employed not only to measure the P to O value (36), but also as a qualitative indicator of the presence or absence of ADP by measurement of increases or decreases of carrier oxidation-reduction state.
ADP and Oxygen Control in Intact and Excised Muscle The fluorometric technique has been of considerable use in studies of intact and excised tissue, and we indicate in Fig. 16 an early example of the application of this technique to strips of hear t muscle of Bufo marinus where Jos6 Ramirez some years ago clearly showed the control of the oxidation-reduction state of cytochrome a in response to stimulation of the heart strips by the double beam spectrophoto- metric techniques. It is particularly appropriate to show Fig. 16 since my former colleague, Jos6 Ramirez, was recently killed in an automobile accident in Mexico City. I think this record bears witness to Ramirez's great experi- mental skill in carrying out these difficult and pioneering experiments (37).
The upper trace records only light-scattering changes at 690 m/z and is

z86 OXYGEN CONSUMPTION BY T H E CELL
useful in indicating each response of the heart muscle to stimulation at ap- proximately 2/sec. The lower trace is a two-wavelength recording which shows even on the first contraction an increased reduction of cytochrome a which reaches the reduction plateau value in approximately four contractions and remains at a steady state until stimulation is stopped. This type of record provided strong evidence of the breakdown of ATP during a single contraction (38) and has stimulated those pursuing analytical chemical techniques for the detection of A T P breakdown to greater perfection of their methods (for a summary see reference 39).
E x p t . S - 1 5 Bufo marinas
t e m p . = 1 7 ° C
_ 620~(m/~) ~ _ - _ - _
sens = 1 / 7 I ~ ~ I ~ 9.0 sec . r I
mo D = 0'001
Cyt. ared.~ / - - v v v ~ 'r
605-620 rn/z
FIGURE 16. Control of the oxidation-reduction level of cytochrome a, of heart strips from Bufo marinus. Cytochrome reduction is indicated as an upward deflection and is re- corded differentially at 605 and 620 m#. The upper trace (620 m/~ only) indicates the non-specific changes of light transmission caused by the contractions. Electrical stimula- tion approximately 2 per second (courtesy ofJ. Ramirez). (JR-5)
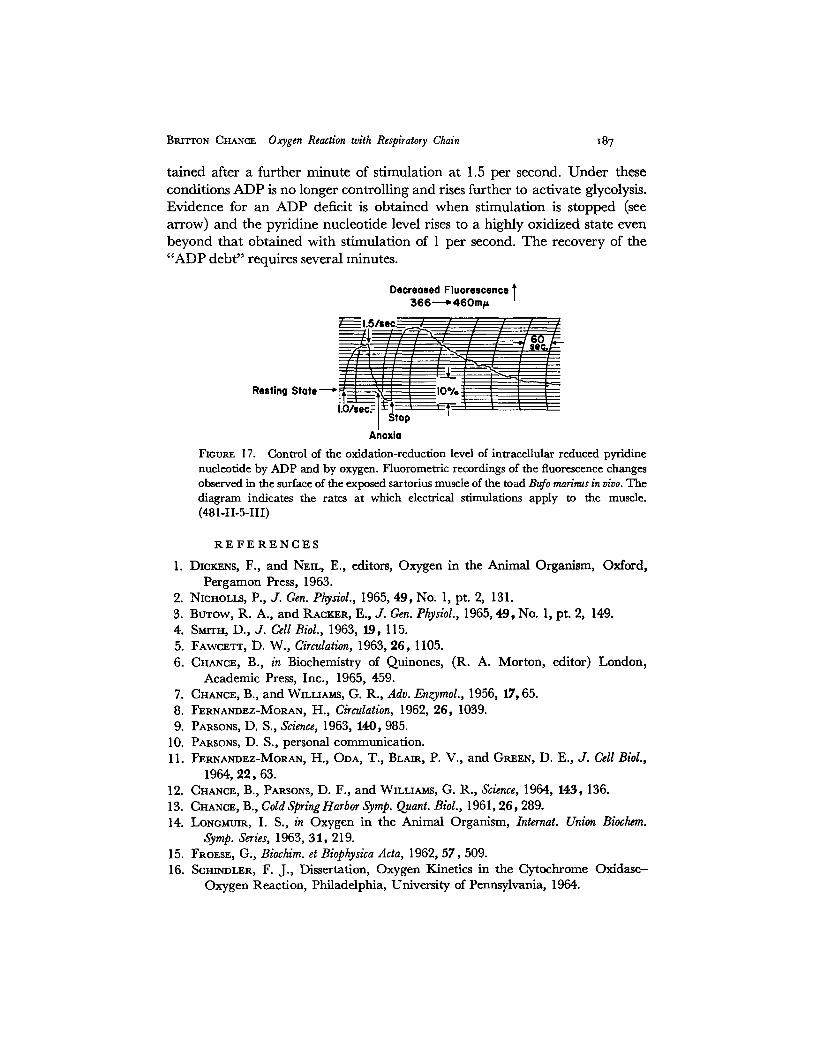
An example of control by the ADP and phosphate and by the oxygen levels in vivo is indicated by Fig. 17. Here the fluorometric technique is used to monitor pyridine nucleotide reduction and oxidation from the exposed surface of the sartorius muscle of Burg marinus. Silver electrodes are inserted at each end of the sartorius muscle to provide stimulation. The animal is pithed. In this figure fluorescence decrease is indicated as an upward deflection. After an initial base line on the left portion of the trace, stimulation starts at 1 per second and causes an upward deflection of the trace indicating ADP control. The steady state is established after about a minute of stimulation with the D P N H highly oxidized. An increase of the stimulation rate to 1.5 per second causes a precipitous increase of fluorescence suggesting that oxygen has now become limiting and the oxidized state of D P N H can no longer be maintained. A maximum of reduction even beyond the initial state of the muscle is ob-
BRITTON CHANCE Oxygen Reaction with Respiratory Chain x87
tained after a further minute of stimulation at 1.5 per second. Under these conditions ADP is no longer controlling and rises further to activate glycolysis. Evidence for an ADP deficit is obtained when stimulation is stopped (see arrow) and the pyridine nucleotide level rises to a highly oxidized state even beyond that obtained with stimulation of 1 per second. The recovery of the " A D P debt" requires several minutes.
Decreased Fluorescence l 366-- -b 460rn V
Resting State
Anoxia
FtouR~ 17. Control of the oxidation-reduction level of intracellular reduced pyridine nucleotide by ADP and by oxygen. Fluorometric recordings of the fluorescence changes observed in the surface of the exposed sartorins muscle of the toad Bufo marinus in vivo. The diagram indicates the rates at which electrical stimulations apply to the muscle. (481-II-5-III)
R E F E R E N C E S
1. DIC~NS, F., and NEIL, E., editors, Oxygen in the Animal Organism, Oxford, Pergamon Press, 1963.
2. NICHOLLS, P., J. Gen. Physiol., 1965, 49, No. l, pt. 2, 131. 3. BUTOW, R. A., and RACS~R, E., J. Gen. Physiol., 1965, 49, No. l, pt. 2, 149. 4. SmTH, D., J. Cell Biol., 1963, 19, ll5. 5. FAWC~T% D. W., Circulation, 1963, 26, 1105. 6. CHANCE, B., in Biochemistry of Quinones, (R. A. Morton, editor) London,
Academic Press, Inc., 1965, 459. 7. CHANCE, B., and WILLIAMS, G. R., Adv. Enzymol., 1956, 17, 65. 8. FERNANDEZ-MORAN, H., Circulation, 1962, 26, 1039. 9. PARSONS, D. S., Science, 1963, 140,985.
10. PARSONS, D. S., personal communication. 11. FERNANDEz-MoRAN, H., ODA, T., BLAre, P. V., and GPa~EN, D. E., J. Cell Biol.,
1964, 22, 63. 12. CHANCP., B., PARSONS, D. F., and WILLIAMS, G. R., Science, 1964, 143,136. 13. CHANC~, B., Cold Spring Harbor Symp. Quant. Biol., 196 I, 26,289. 14. LONCmR, I. S., in Oxygen in the Animal Organism, Internat. Union Biochem.
Symp. Series, 1963, 31,219. 15. FROESE, G., Biochim. et Biophysica Acta, 1962, 57,509. 16. SC~NDLER, F. J., Dissertation, Oxygen Kinetics in the Cytochrome Oxidase--
Oxygen Reaction, Philadelphia, University of Pennsylvania, 1964.

i88 OXYGEN CONSUMPTION BY TIIE CELL
17. HASTINGS, J. W., and McELROY, W. D., in The Luminescence of Biological Systems, (F. H. Johnson, editor), Washington, D.C., American Association for the Advancement of Science, 1955, 161.
18. WINZL~R, R. J., d. Cell and Comp. Physiol., 1941, 17,263. 19. CHANCE, B., Fed. Proc., 1957, 16,671. 20. CHANCE, B., and LEGALLAIS, V., Discussions Faraday Soc., 1954, 17,125. 21. CHANCE, B., in Rapid Mixing and Sampling Techniques in Biochemistry, (B.
Chance, Q. H. Gibson, R. H. Eisenhardt, and K. K. Lonberg-Holm, editors), New York, Academic Press, Inc., 1964, 125.
22. YONETANI, T., J. Biol. Chem., 1961, 236, 1680. 23. GIBSON, Q. H., and GREENWOOD, C., personal communication. 24. CHANCE, B., and WILLIAMS, G. R., or. Biol. Chem., 1955, 217,409. 25. CHANCE, B., in A Symposium on The Mechanism of Enzyme Action, (W. D.
McElroy and B. Glass, editors), Baltimore, The Johns Hopkins Press 1954, 399. 26. CHANCE, B., Ann. New York Acad. Sc., 1962, 97,431. 27. CHANCE, B., and CONNELLY, C. M., Nature, 1957, 179, 1235. 28. CHANCE, B., in Oxygen in the Animal Organism, (F. Dickens and E. Neil, editors),
Internat. Union Biochem. Symp. Series, London, Pergamon Press, 1963, 31,367. 29. CHANCE, B., and LE~ALLAIS, V., Rev. Scient. Instr., 1959, 30,732. 30. CHANCE, B., and LEGALLAIS, V., IEEE, BME-IO, 40 (1963). 31. WILLIAMSON, J. R., and JAMmSON, D., unpublished observations. 32. JAMmSON, D., in Oxygen in the Animal Organism, (F. Dickens and E. Neil, edi-
tors), Internat. Union Biochem. Symp. Series, 1963, 31,261. 33. CHANCE, B., in Ciba Foundation Symposium on the Regulation of Cell Metabo-
lism, (G. E. W. Wolstenholme and C. M. O'Connor, editors), London, J. and A. Churchill, Ltd., 1959, 219.
34. CHANCE, B., Fed. Proc., 1964, 23, Abstract 989, 265. 35. CHANCE, B., and PACKER, L., Biochem. J., 1958, 68, 295. 36. CHANCE, B., and WILLIAMS, G. R., J. Biol. Chem., 1955, 217~ 383. 37. RAM~REZ, J., J. Physiol., 1959, 147, 14. 38. CHANCE, B., MAURIELLO, G., and AUBERT, X. M., in Muscle as a Tissue, (K.
Rodahl and S. Horvath, editors), New York, McGraw-Hill Book Company, 1962, 128.
39. CHANCE, B., GIBSON, Q. H., EISENHARDT, R., and K. K. LONBERG-HOLM, editors, Rapid Mixing and Sampling Techniques in Biochemistry, New York, Aca- demic Press, Inc., 1964, 39.
40. CHANCE, B., and WILLIAMS, G. R., J. Biol. Chem., 1956, 221,477.