Embed Size (px)
Citation preview
Reactome
This tutorial introduces Reactome, the user interface and the database content. Exercises help you practice what you have learned; you will need to refer to the details and screenshots in this document. Further information can be found in the online Reactome user guide at http://www.reactome.org/userguide/Usersguide.html.
You will learn:
How pathways and reactions are visualized in Reactome Querying Reactome through the web interface How to overlay interaction and expression data on Reactome pathways How to perform Pathway Overrepresentation Analysis in Reactome How to map datasets to Reactome pathways
ContentsReactome.............................................................................................................................................1
What is Reactome?........................................................................................................................3
What is this Tutorial For?...............................................................................................................3
Exercises..........................................................................................................................................3
The Reactome Home Page...........................................................................................................3
Exercise 1....................................................................................................................................4
Searching Reactome......................................................................................................................5
Simple text search......................................................................................................................5
The Pathway Browser....................................................................................................................7
Exercise 2..................................................................................................................................10
Pathway Diagrams........................................................................................................................10
Exercise 3..................................................................................................................................13
Overview diagrams and Subpathway icons..............................................................................14
Subpathway Shading................................................................................................................15
Navigating Pathway Diagrams....................................................................................................16
Exercise 4..................................................................................................................................17
Details Panel.................................................................................................................................18
The Description tab...................................................................................................................18
The Molecules Tab...................................................................................................................20
The Structures Tab...................................................................................................................20
This work is licensed under the Creative Commons Attribution 3.0 Unported License. To view a copy of this license, visit http://creativecommons.org/licenses/by-sa/3.0/ or send a letter to Creative Commons, 543 Howard Street, 5th Floor, San Francisco, California, 94105, USA.
The Expression Tab..................................................................................................................21
The Analysis Tab......................................................................................................................21
The Downloads Tab..................................................................................................................21
Exercise 5..................................................................................................................................23
Disease in Reactome...................................................................................................................24
Exercise 6..................................................................................................................................26
Reactome Tools............................................................................................................................27
Analyse Data.............................................................................................................................27
Identifier mapping.....................................................................................................................28
Results for Identifier lists without associated numeric values.............................................30
Exercise 7..................................................................................................................................34
Results for Identifier lists with associated numeric values (expression representation). 35
Exercise 8..................................................................................................................................38
Species Comparison................................................................................................................39
Exercise 9..................................................................................................................................41
Molecular Interaction Overlay..................................................................................................42
Exercise 10................................................................................................................................46
Viewing the Equivalent Pathway in another Species...............................................................47
Details Views.................................................................................................................................47
Pathway Details.........................................................................................................................47
Reaction Details........................................................................................................................47
Complex or Set Details............................................................................................................48
Answers to Exercises...................................................................................................................50
Exercise 1..................................................................................................................................50
Exercise 2..................................................................................................................................50
Exercise 3..................................................................................................................................50
Exercise 4..................................................................................................................................51
Exercise 5..................................................................................................................................51
Exercise 6..................................................................................................................................52
Exercise 7..................................................................................................................................52
Exercise 8..................................................................................................................................52
Exercise 9..................................................................................................................................52
Exercise 10................................................................................................................................52
Printable Key to Reactome Pathway Diagrams........................................................................54
What is Reactome?
Reactome is a curated database of pathways and reactions in human biology. Reactions can be considered as pathway ‘steps’. Reactome defines a ‘reaction’ as any event in biology that changes the state of a biological molecule. Binding, activation, translocation, degradation and classical biochemical events involving a catalyst are all reactions. Information in the database is authored by expert biologists, entered and maintained by Reactome’s team of Curators and Editorial staff. Reactome content frequently cross-references other resources e.g. NCBI, Ensembl, UniProt, KEGG (Gene and Compound), ChEBI, PubMed and GO. Inferred orthologous reactions Inferred orthologous reactions are available for 17 non-human species including mouse, rat, chicken, puffer fish, worm, fly, yeast, rice, and Arabidopsis
What is this Tutorial For?
This tutorial introduces features of the Reactome website using a combination of short explanations and exercises. You will learn how to search Reactome, interpret the views, use the tools and if necessary find documentation or contact us for help.
Exercises
The exercises will help you understand Reactome content. Some of the questions are not directly addressed in the tutorial but can be answered with a little deduction - if you get stuck the answers are available at the end of this document in Answers to Exercises.
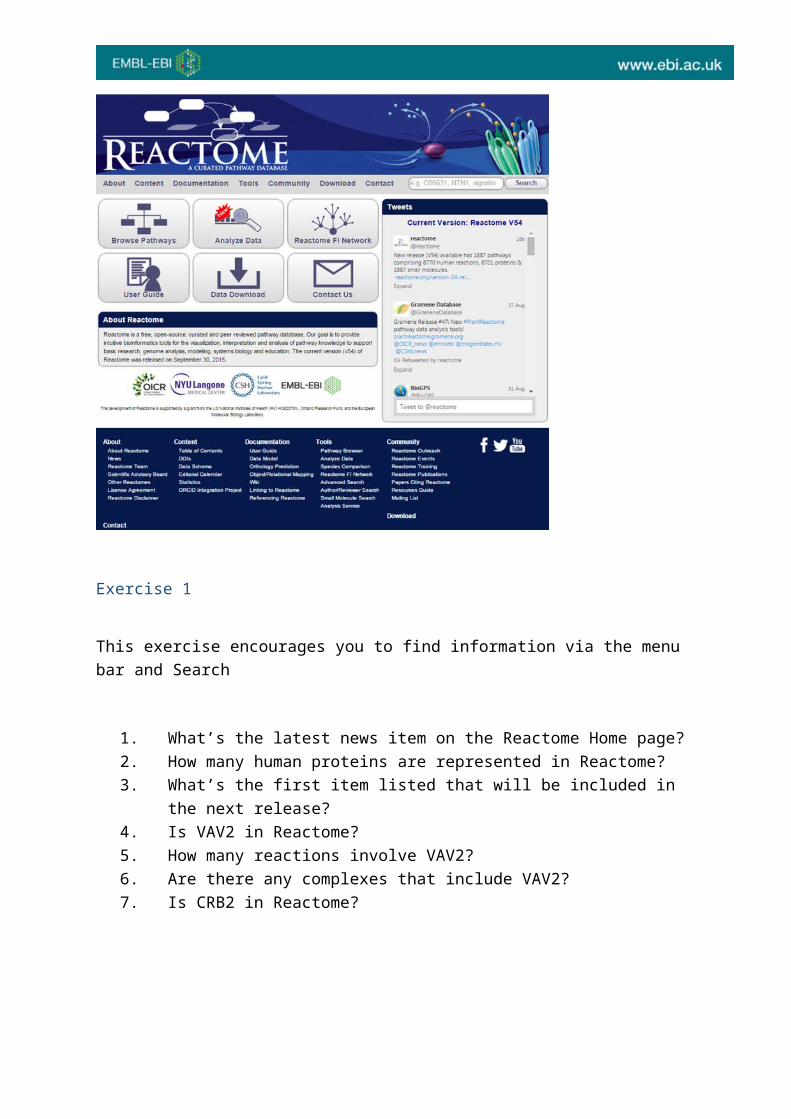
The Reactome Home Page
Reactome’s Home page is http://www.reactome.org/. This page contains links, tools, search functions and documentation that will help you use Reactome.
Exercise 1
This exercise encourages you to find information via the menu bar and Search
1. What’s the latest news item on the Reactome Home page?2. How many human proteins are represented in Reactome?3. What’s the first item listed that will be included in the next release?4. Is VAV2 in Reactome?5. How many reactions involve VAV2?6. Are there any complexes that include VAV2?7. Is CRB2 in Reactome?
Searching Reactome
Simple text search
The simple text search tool is located top right of the Home page. Most other Reactome website pages include this search tool. To search type a word, phrase or identifier in the search box. The search has an auto- complete function; if the text you wanted to use appears in the drop-down list, select it and results will be displayed. For other text click Search.
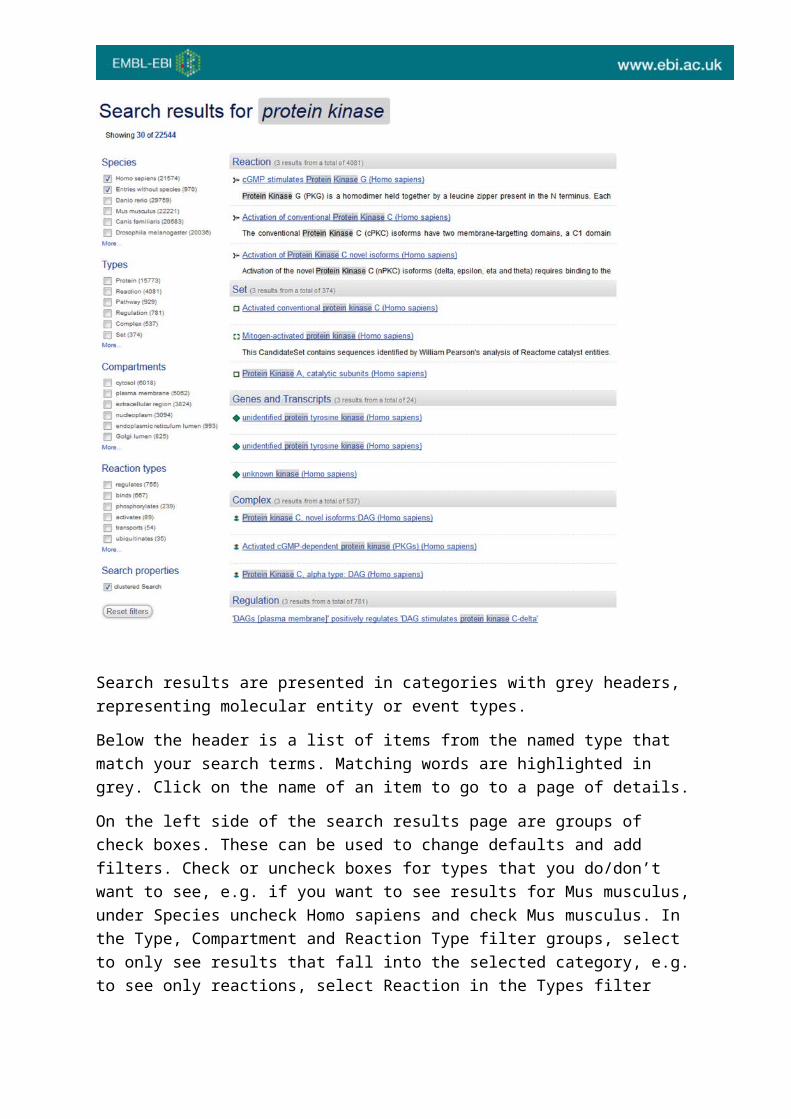
Search results are presented in categories with grey headers, representing molecular entity or event types.
Below the header is a list of items from the named type that match your search terms. Matching words are highlighted in grey. Click on the name of an item to go to a page of details.
On the left side of the search results page are groups of check boxes. These can be used to change defaults and add filters. Check or uncheck boxes for types that you do/don’t want to see, e.g. if you want to see results for Mus musculus, under Species uncheck Homo sapiens and check Mus musculus. In the Type, Compartment and Reaction Type filter groups, select to only see results that fall into the selected category, e.g. to see only reactions, select Reaction in the Types filter group. To see only Reactions that occur in the cytosol, also select Cytosol in Compartments.
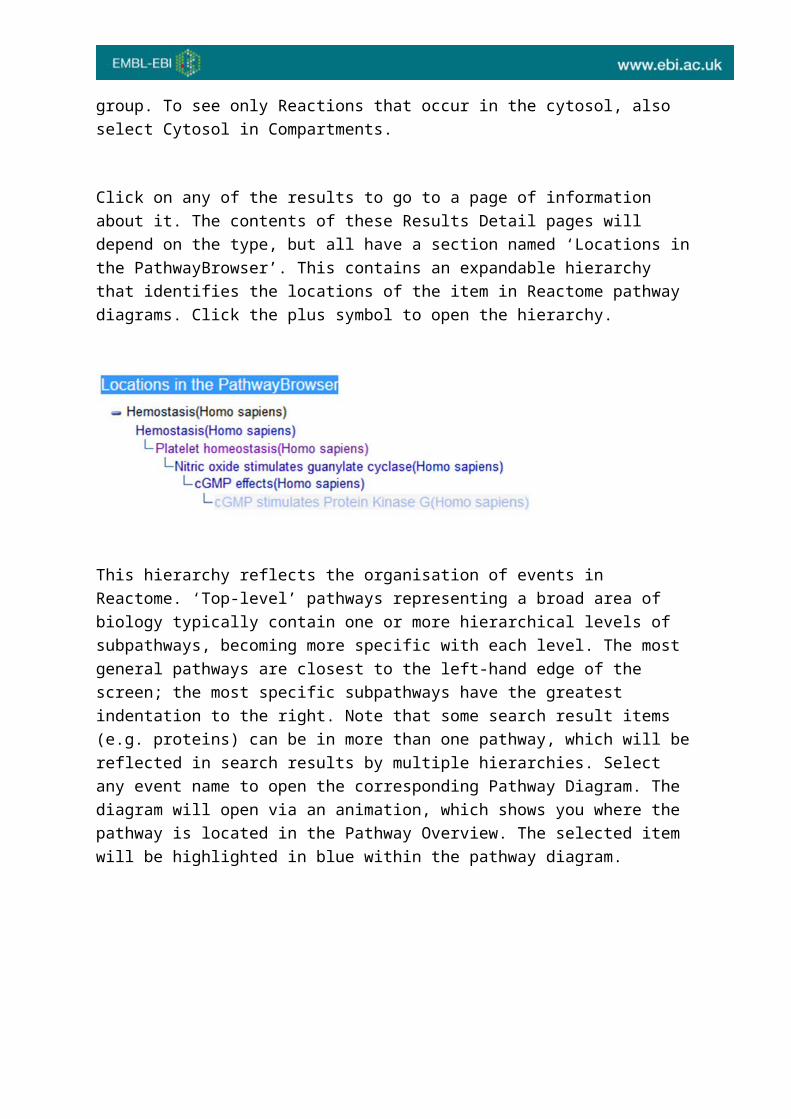
Click on any of the results to go to a page of information about it. The contents of these Results Detail pages will depend on the type, but all have a section named ‘Locations in the PathwayBrowser’. This contains an expandable hierarchy that identifies the locations of the item in Reactome pathway diagrams. Click the plus symbol to open the hierarchy.
This hierarchy reflects the organisation of events in Reactome. ‘Top-level’ pathways representing a broad area of biology typically contain one or more hierarchical levels of subpathways, becoming more specific with each level. The most general pathways are closest to the left-hand edge of the screen; the most specific subpathways have the greatest indentation to the right. Note that some search result items (e.g. proteins) can be in more than one pathway, which will be reflected in search results by multiple hierarchies. Select any event name to open the corresponding Pathway Diagram. The diagram will open via an animation, which shows you where the pathway is located in the Pathway Overview. The selected item will be highlighted in blue within the pathway diagram.
The Pathway Browser
The Pathway Browser is the primary means of viewing and interacting with pathways in Reactome. It includes tools for analysing datasets and exploring pathways. These tools allow several types of analysis:
Pathway over-representation analysis and pathway topology-based analysis Comparison of a pathway with its equivalent in another species The overlay of user-supplied expression data onto a pathway The overlay of protein-protein or protein-compound interaction data from
external databases or user-supplied data onto a pathway
See the section Reactome Tools for details of the analysis tools.
The Pathway Browser is launched by clicking the Browse Pathways button on the Homepage:
When the Pathway Browser opens, it displays an overview of all Reactome pathways. Pathways are organized hierarchically and often have sub-pathways. At the highest hierarchical level, all pathways are represented in an Overview. At intermediate levels, pathways are often represented as interactive illustrations, with selectable regions that act as links to the lower levels, which are represented as detailed Pathway Diagrams. Reactome’s Overview uses a unique graphical visualization of the hierarchy, representing pathways at the uppermost hierarchical level as central nodes (circles) with subpathways arranged concentrically (in rings) around them. Many have further concentric rings of ‘child’ subpathways. Pathway nodes are connected to their subpathways by edges (lines). This overview displays all pathways and allows rapid zooming to details. As you zoom in, labels appear for the subpathway nodes. This view is also used to display data analysis results.
Nodes in the overview link to detailed pathway diagrams that use a style based on Systems Biology Graphical Notation. They have several features intended to ensure an appropriate level of information detail, including subpathway shading and fade-in of labels, commonly occurring small molecules and structures.
To see the details of a specific pathway, select and click (or double-click) the node representing the pathway. Alternatively select and click on the name in the Pathway Hierarchy panel on the left.
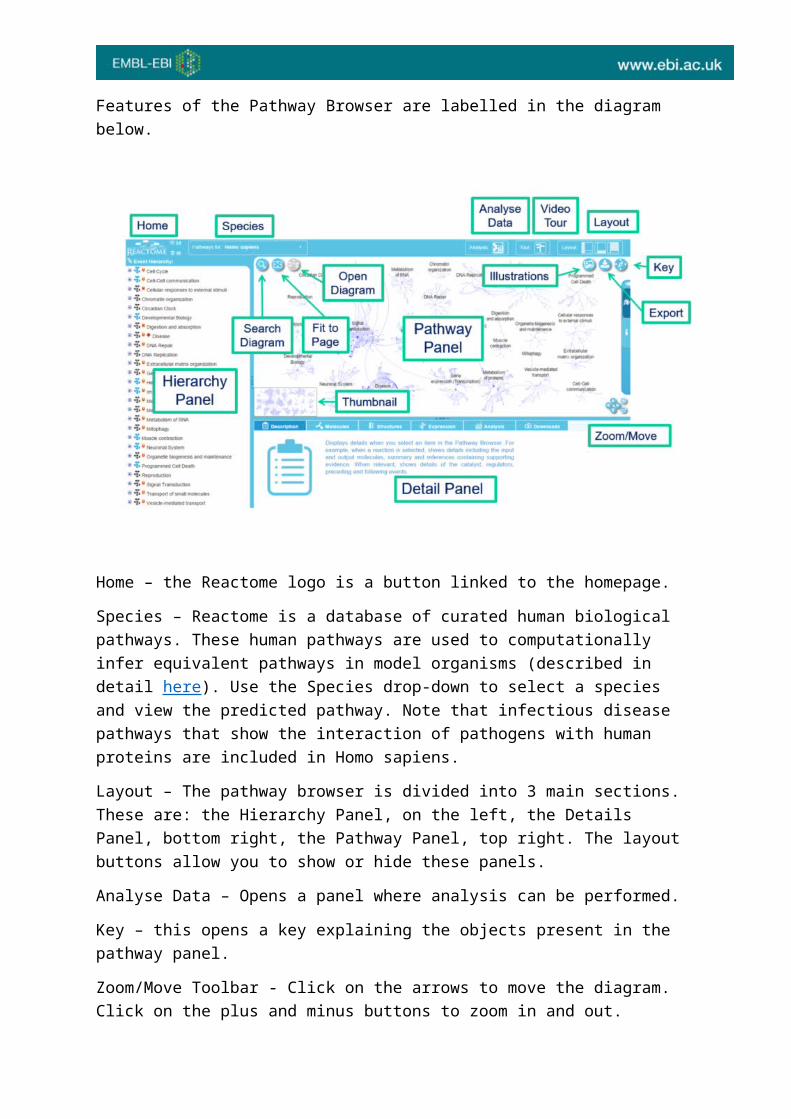
Features of the Pathway Browser are labelled in the diagram below.
Home – the Reactome logo is a button linked to the homepage.
Species – Reactome is a database of curated human biological pathways. These human pathways are used to computationally infer equivalent pathways in model organisms (described in detail here). Use the Species drop-down to select a species and view the predicted pathway. Note that infectious disease pathways that show the interaction of pathogens with human proteins are included in Homo sapiens.
Layout – The pathway browser is divided into 3 main sections. These are: the Hierarchy Panel, on the left, the Details Panel, bottom right, the Pathway Panel, top right. The layout buttons allow you to show or hide these panels.
Analyse Data – Opens a panel where analysis can be performed.
Key – this opens a key explaining the objects present in the pathway panel.
Zoom/Move Toolbar - Click on the arrows to move the diagram. Click on the plus and minus buttons to zoom in and out. Alternatively, click and drag the diagram, and use your mouse scroll wheel to zoom.
Search Diagram – click the button to open the search panel. Note that this searches the diagram. To search all of Reactome, use the Search on the Homepage.
Fit to Page - resizes the Pathway Overview or Diagram to fit the available space.
Open Diagram – when a pathway node is selected in the Pathway Overview, this button opens the corresponding Pathway Diagram
Illustrations – some Reactome pathways have a corresponding high-quality graphic. Select this button to view.
Export – use this button to download the visible region of the Pathway Overview or Diagram, including any analysis overlay, as a PNG file or upload it to GenomeSpace.
Thumbnail – Provides an overview of the entire pathway when zoomed in so that only a region of the pathway is displayed.
Pathway Panel - This is where Pathway Diagrams are displayed when they are selected in the Pathway Hierarchy or in search results. If no pathway is selected, this panel displays a brief Reactome help guide.
Details Panel - Contains details of objects when they are selected in the Pathway Diagram. The content depends on the type of object, i.e. pathway, reaction, complex, set, protein or small molecule (see the Details section).
Hierarchy Panel – Includes the hierarchical organisation of Reactome pathways and pathway events or steps, known as reactions. When the Pathway Browser is opened, only the top level of the hierarchy is shown, as an alphabetical list of Reactome’s main topics. Most topics are too large to be represented as a single diagram. Instead they are split into sub-pathways, which may be further divided into sub-sub-pathways. Most topics in Reactome are organised in this hierarchical manner. Sub-pathways can be revealed by clicking on the + icon to the left of the pathway name, and hidden by clicking on the - icon.
Pathway names are preceded by the icon . As sub-pathways are revealed, at some point a level is reached where the reactions will become visible. Reactions names are preceded by the icon . You may also see the icon representing “black-box” reactions, where the full molecular details have been omitted for clarity, or the details are incompletely determined.
The order of reactions from top to bottom in the Hierarchy Panel usually follows their order as steps in the pathway so that the preceding reaction is above and the subsequent reaction below, but this is not always the case. Pathways may not be linear; they can be circular or branched. Consequently, reactions often have multiple preceding or subsequent reactions. These connected events are often visible within the pathway diagram but can be part of a different pathway diagram. To view a complete list of the events that precede or follow a reaction, refer to the Preceding and Following Events section in the Details Panel, as described in the Details Panel chapter below.
Exercise 2
This exercise is to check that you understand the organisation of the Hierarchy Panel. You don’t need to look at the Diagram Panel.
From the Home page, search for PDGF signaling.
In the results page, open the expandable hierarchy in the section Locations in the Pathway Browser by clicking on the + button. DON’T click on the location before expanding the hierarchy! This will open the pathway diagram in the Pathway Browser.
Look at the Hierarchy Panel on the left.
1. How many sub-pathways does this pathway have?2. How many reactions are in the first sub-pathway?3. What reaction(s) follow ‘Translocation of PDGF from ER to Golgi’?
Hint:Look in the Details Panel, bottom-right. If it is hidden, use the layout buttons in the top right corner, above the diagram, to reveal it.
Pathway Diagrams
Pathway Diagrams represent pathways as a series of connected molecular events, known in Reactome as ‘reactions’, which can be considered as steps in the pathway.
Cellular compartments are represented as pink/orange boxes with a double boundary. A typical diagram has a box to represent the cytosol, bounded by a double-line that represents the plasma membrane. The white area outside this box represents the extracellular space. Other organelles are represented as additional labelled boxes within the cytosol.
Molecules, represented in diagrams as blue/green boxes, are placed in the physiologically-correct cellular compartment, or lie on the boundary of a compartment to indicate that they are in the corresponding membrane, e.g. a plasma membrane protein will be placed on the boundary of the cytosol.
Reactions typically include:
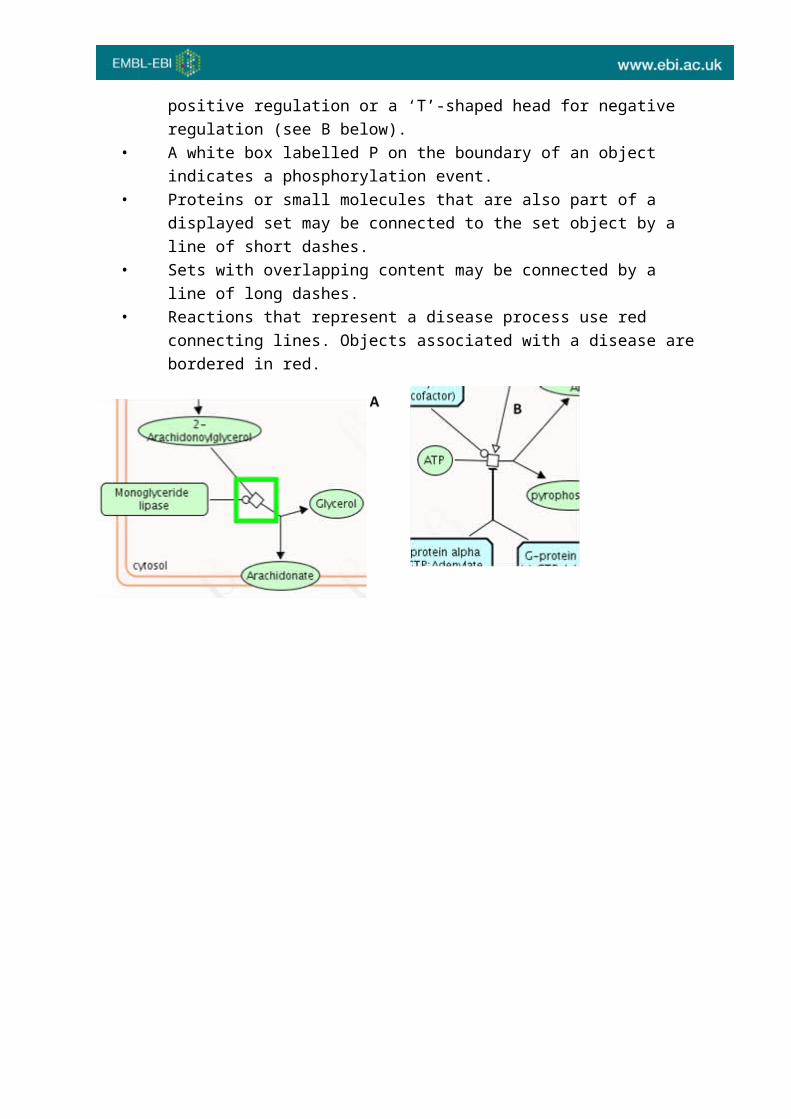
• Input and output molecules, and when relevant a catalyst (see diagram A below)
• Inputs, outputs and catalyst are represented as boxes or ovals• Green boxes with rounded corners are proteins• Green boxes with square corners are proteins that have no UniProt
accession (or did not at the time the reaction was created).• Green ovals are small molecules or sets of small molecules
• Blue boxes with a double boundary are sets, i.e. proteins or small molecules that are functionally equivalent.
• Blue boxes with cut corners are complexes, i.e. proteins and/or other molecules that are bound in a multimolecular entity.
• Green boxes with a white inner box are sub-pathways.• Reaction input and output molecules are joined by lines to a central
‘reaction node’ (surrounded by a green box in Figure A below). Clicking this node selects the reaction.
• The outputs of a reaction have an arrowhead on the line connecting them to the reaction node.
• Reaction inputs/output molecules are often connected by arrows to preceding or subsequent reactions (i.e. the preceding/subsequent steps in the pathway).
• Catalysts are connected to the reaction node by a line ending in a circle. • Numbered boxes on the line between an input/output and the reaction
node indicates the number of molecules of this type in the reaction (when n >1).
• Molecules that regulate a reaction are connected to the reaction node by a line ending in an open triangle for positive regulation or a ‘T’-shaped head for negative regulation (see B below).
• A white box labelled P on the boundary of an object indicates a phosphorylation event.
• Proteins or small molecules that are also part of a displayed set may be connected to the set object by a line of short dashes.
• Sets with overlapping content may be connected by a line of long dashes. • Reactions that represent a disease process use red connecting lines.
Objects associated with a disease are bordered in red.
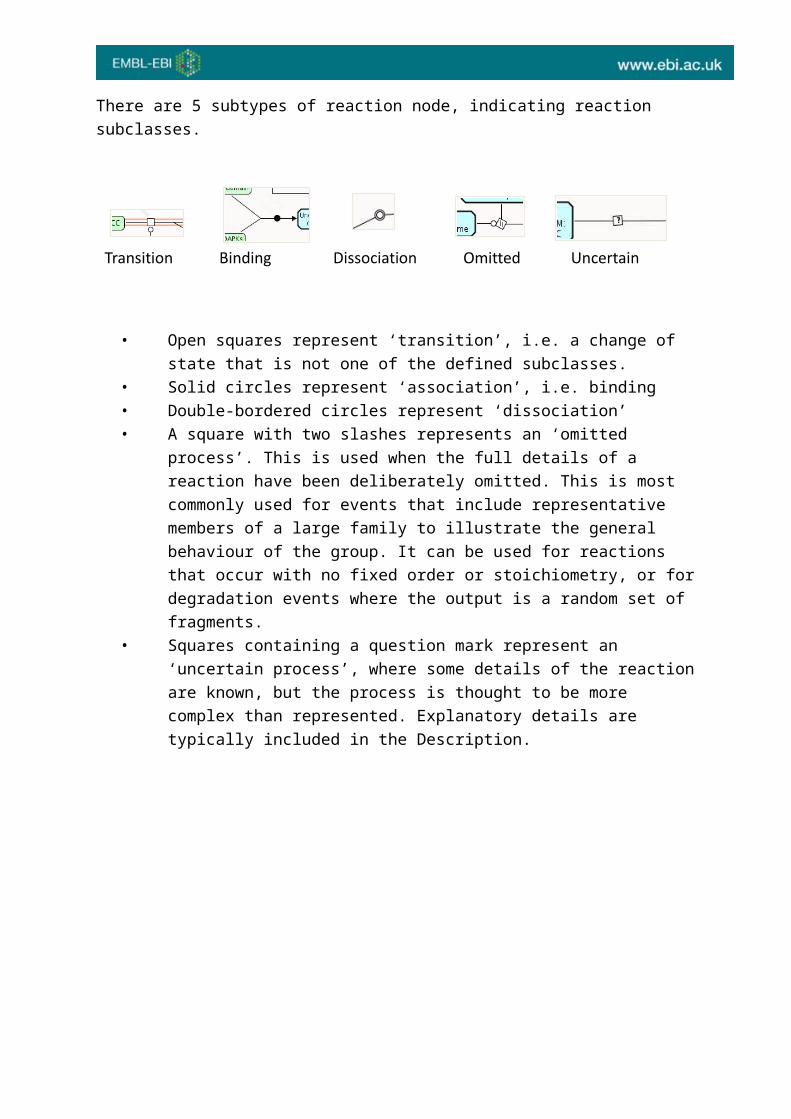
There are 5 subtypes of reaction node, indicating reaction subclasses.
• Open squares represent ‘transition’, i.e. a change of state that is not one of the defined subclasses.
• Solid circles represent ‘association’, i.e. binding• Double-bordered circles represent ‘dissociation’ • A square with two slashes represents an ‘omitted process’. This is used
when the full details of a reaction have been deliberately omitted. This is most commonly used for events that include representative members of a large family to illustrate the general behaviour of the group. It can be used for reactions that occur with no fixed order or stoichiometry, or for degradation events where the output is a random set of fragments.
• Squares containing a question mark represent an ‘uncertain process’, where some details of the reaction are known, but the process is thought to be more complex than represented. Explanatory details are typically included in the Description.
Exercise 3
This exercise is to check that you understand reaction subtypes.
From the Home page, search for the pathway ‘Effects of PIP2 hydrolysis’ and open it in the Pathway Browser (in any of the several locations)
1. What symbol represents the reaction for ‘Binding of IP3 to the IP3 receptor’?
2. What symbol represents the reaction ‘IP3R tetramer:I(1,4,5)P3:4xCa2+ transports Ca2+ from platelet dense tubular system to cytosol? What subtype of reaction is this?
3. Open the subpathway ‘Arachidonate production from DAG’. What is the name of the catalyst for ‘2-AG hydrolysis to arachidonate by MAGL’? Can you name the three outputs of this reaction?
4. Can you find the UniProt ID for the catalyst? Hint: The answer is in the Details Panel, but hidden, you will need to expand a panel.
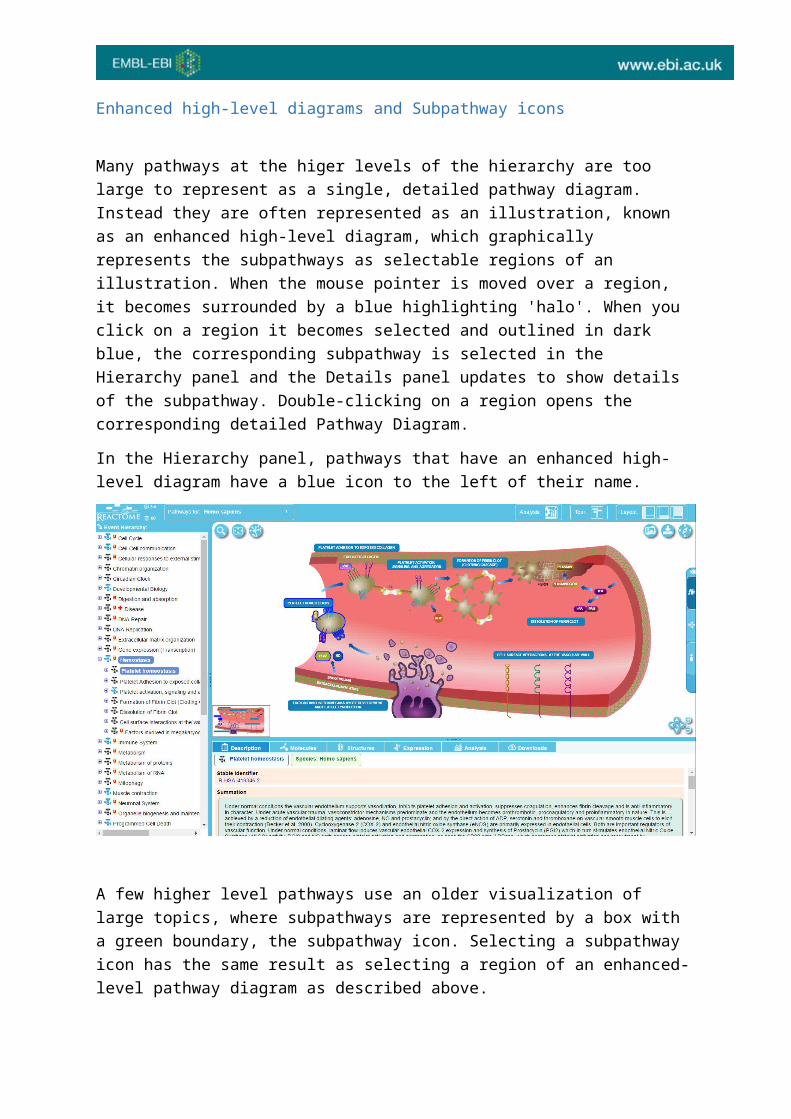
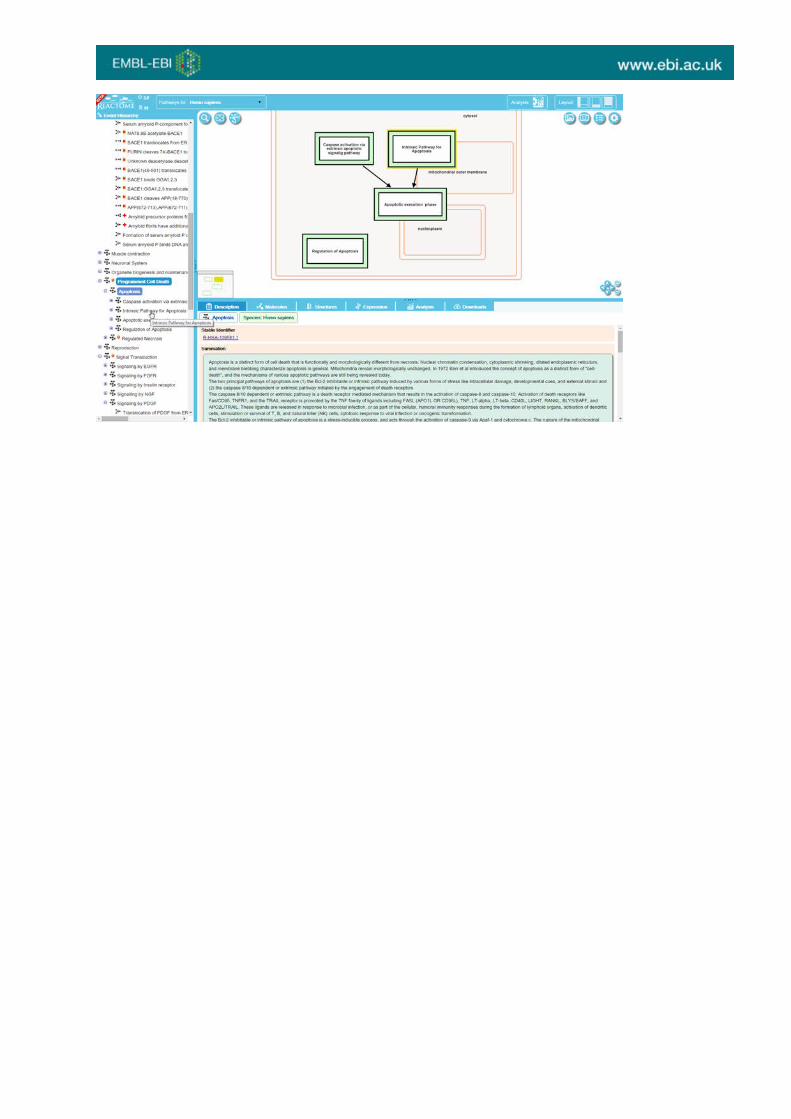
Enhanced high-level diagrams and Subpathway icons
Many pathways at the higer levels of the hierarchy are too large to represent as a single, detailed pathway diagram. Instead they are often represented as an illustration, known as an enhanced high-level diagram, which graphically represents the subpathways as selectable regions of an illustration. When the mouse pointer is moved over a region, it becomes surrounded by a blue highlighting 'halo'. When you click on a region it becomes selected and outlined in dark blue, the corresponding subpathway is selected in the Hierarchy panel and the Details panel updates to show details of the subpathway. Double-clicking on a region opens the corresponding detailed Pathway Diagram.
In the Hierarchy panel, pathways that have an enhanced high-level diagram have a blue icon to the left of their name.
A few higher level pathways use an older visualization of large topics, where subpathways are represented by a box with a green boundary, the subpathway icon. Selecting a subpathway icon has the same result as selecting a region of an enhanced-level pathway diagram as described above.
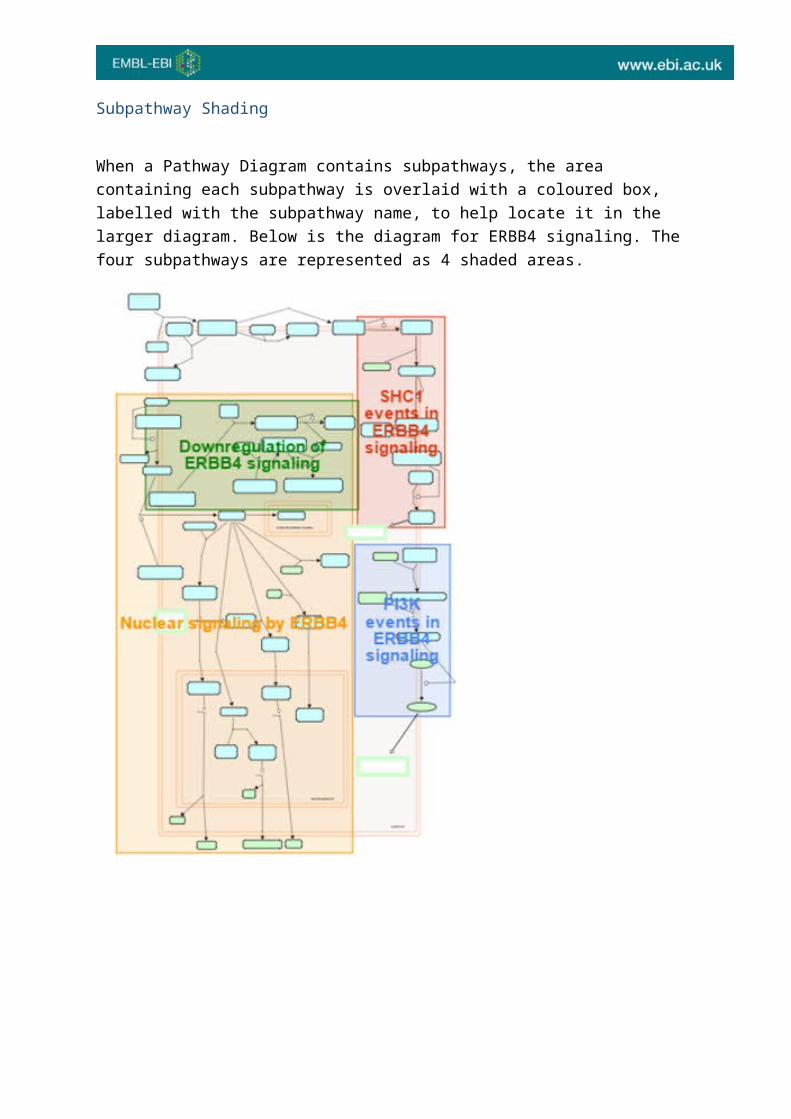
Subpathway Shading
When a Pathway Diagram contains subpathways, the area containing each subpathway is overlaid with a coloured box, labelled with the subpathway name, to help locate it in the larger diagram. Below is the diagram for ERBB4 signaling. The four subpathways are represented as 4 shaded areas.
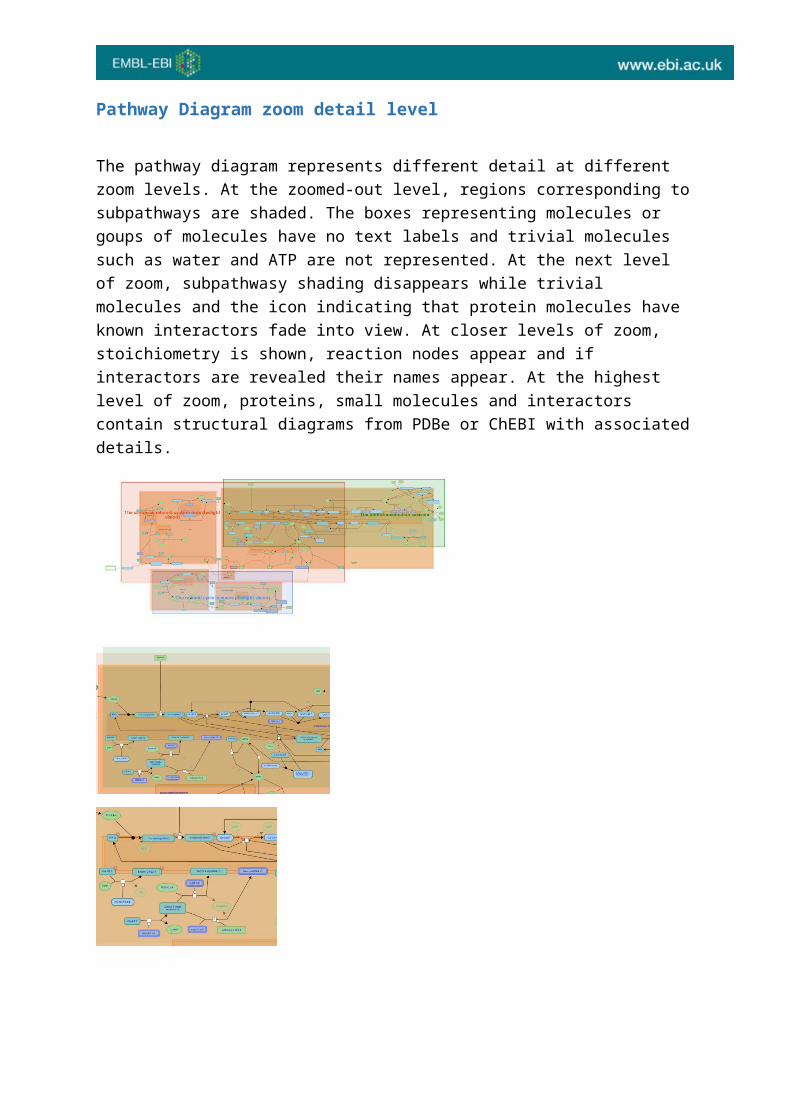
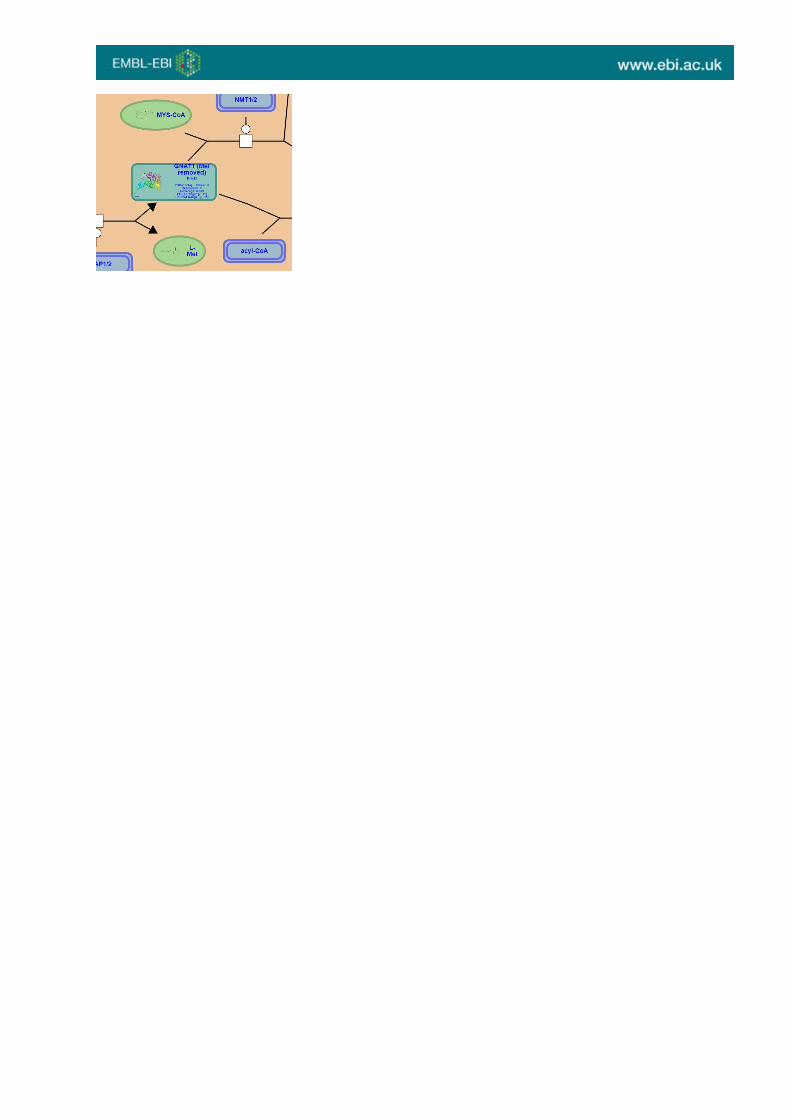
Pathway Diagram zoom detail level
The pathway diagram represents different detail at different zoom levels. At the zoomed-out level, regions corresponding to subpathways are shaded. The boxes representing molecules or goups of molecules have no text labels and trivial molecules such as water and ATP are not represented. At the next level of zoom, subpathwasy shading disappears while trivial molecules and the icon indicating that protein molecules have known interactors fade into view. At closer levels of zoom, stoichiometry is shown, reaction nodes appear and if interactors are revealed their names appear. At the highest level of zoom, proteins, small molecules and interactors contain structural diagrams from PDBe or ChEBI with associated details.
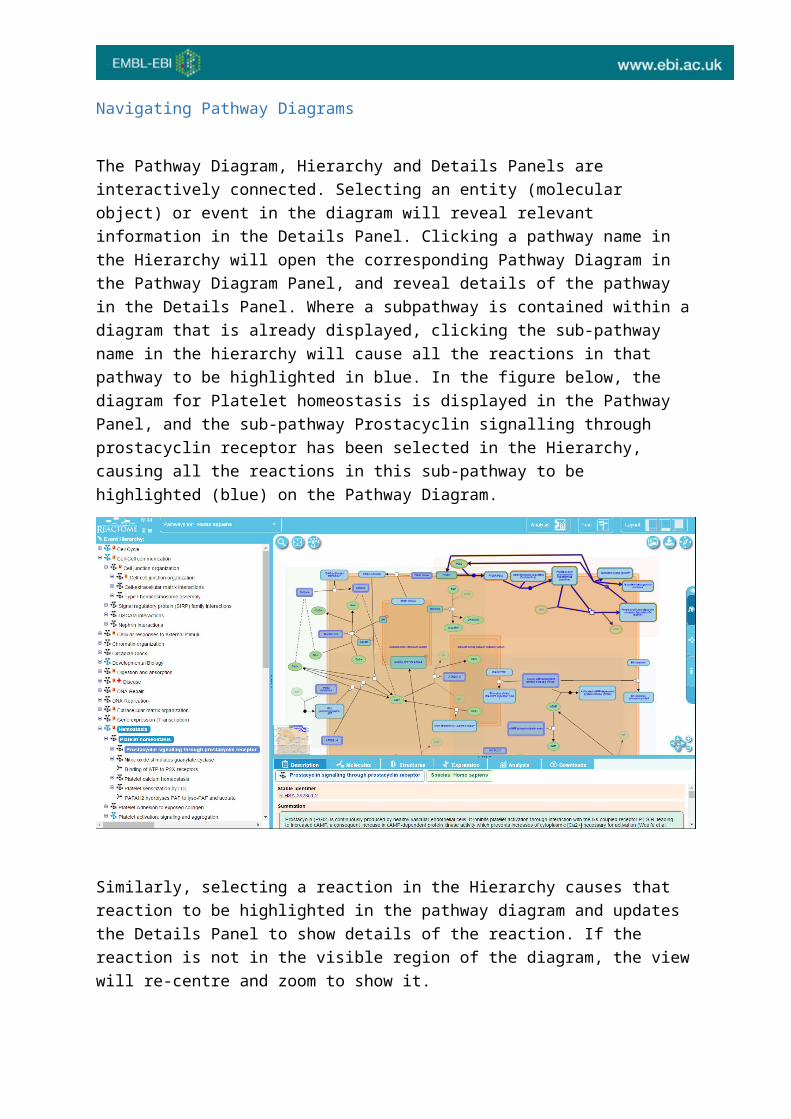
Navigating Pathway Diagrams
The Pathway Diagram, Hierarchy and Details Panels are interactively connected. Selecting an entity (molecular object) or event in the diagram will reveal relevant information in the Details Panel. Clicking a pathway name in the Hierarchy will open the corresponding Pathway Diagram in the Pathway Diagram Panel, and reveal details of the pathway in the Details Panel. Where a subpathway is contained within a diagram that is already displayed, clicking the sub-pathway name in the hierarchy will cause all the reactions in that pathway to be highlighted in blue. In the figure below, the diagram for Platelet homeostasis is displayed in the Pathway Panel, and the sub-pathway Prostacyclin signalling through prostacyclin receptor has been selected in the Hierarchy, causing all the reactions in this sub-pathway to be highlighted (blue) on the Pathway Diagram.
Similarly, selecting a reaction in the Hierarchy causes that reaction to be highlighted in the pathway diagram and updates the Details Panel to show details of the reaction. If the reaction is not in the visible region of the diagram, the view will re-centre and zoom to show it.
Exercise 4
This exercise is to check that you understand Subpathway icons and the relationship between the Pathway Hierarchy and Pathway Diagram.
Open the pathway Hemostasis in the Pathway Browser.
Select the subpathway icon ‘Platelet Hemostasis’.
1. How do you open the Pathway Diagram for this sub-pathway?2. What happens if you click in the Hierarchy on the sub-pathway ‘Platelet
calcium hemostasis’?3. What happens if you click in the hierarchy on the reaction ‘Binding of ATP
to P2X receptors’?
Details Panel
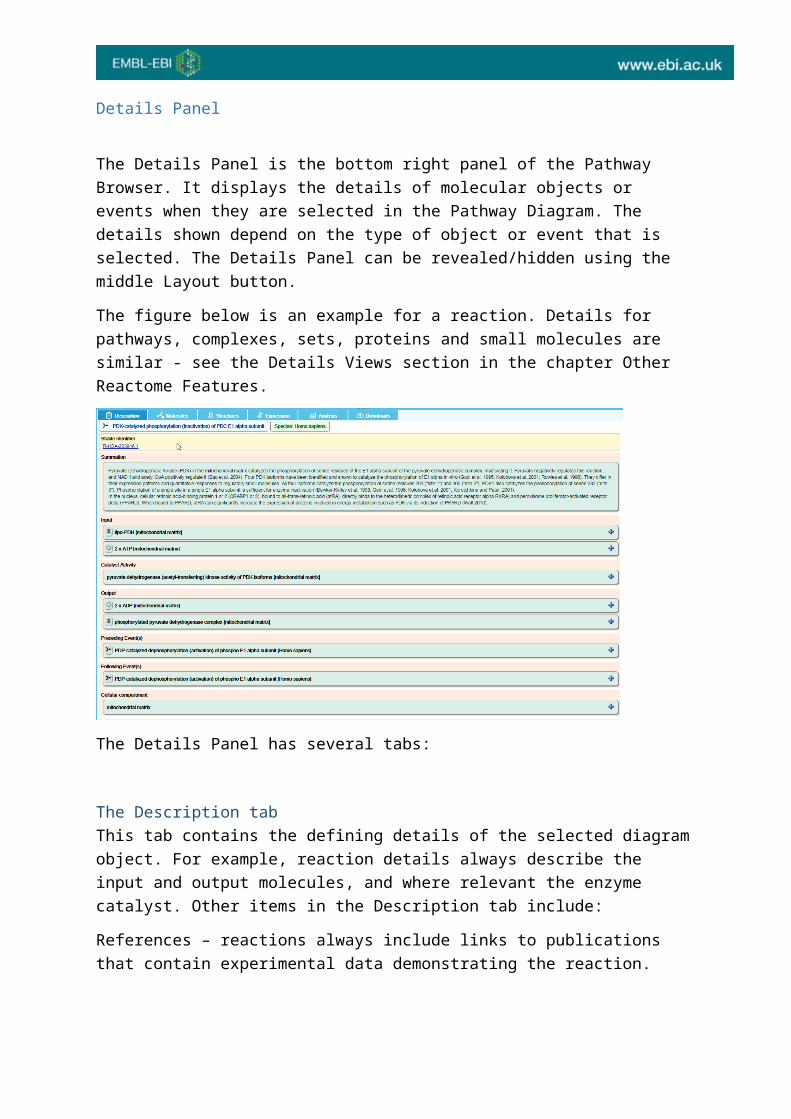
The Details Panel is the bottom right panel of the Pathway Browser. It displays the details of molecular objects or events when they are selected in the Pathway Diagram. The details shown depend on the type of object or event that is selected. The Details Panel can be revealed/hidden using the middle Layout button.
The figure below is an example for a reaction. Details for pathways, complexes, sets, proteins and small molecules are similar - see the Details Views section in the chapter Other Reactome Features.
The Details Panel has several tabs:
The Description tab This tab contains the defining details of the selected diagram object. For example, reaction details always describe the input and output molecules, and where relevant the enzyme catalyst. Other items in the Description tab include:
References – reactions always include links to publications that contain experimental data demonstrating the reaction.
Summation – a summary of the molecular event, often with background information and additional literature citations
Authored - an expert biologist who contributed materials allowing construction of the reaction/pathway. All Reactome pathways are authored by an expert biologist.
Reviewed – All Reactome pathways are reviewed by an expert biologist who verifies the content provided by the Author.
Cellular Compartment - Identifies the cellular compartment for the reaction, with the associated Gene Ontology (GO) term.
Preceding/Following Events - Links to reactions that precede/follow this reaction.
Inferred from another species - Reactome represents human biology and wherever possible cites experimental data obtained using human reagents. When this is unavailable, a human reaction may be inferred from data obtained from model organisms, if the Author of the reaction believes this is valid. When this is the case, the reaction details will include an ‘Inferred from another species’ link, indicating that the human reaction has been manually inferred from experimental data obtained in another species. Selecting the link will reveal details of the reaction in the model organism including the literature references.
Computationally Inferred To – Provides a drop-down list of model organism species, select one to see computationally predicted pathways, inferred from Reactome’s human pathway.
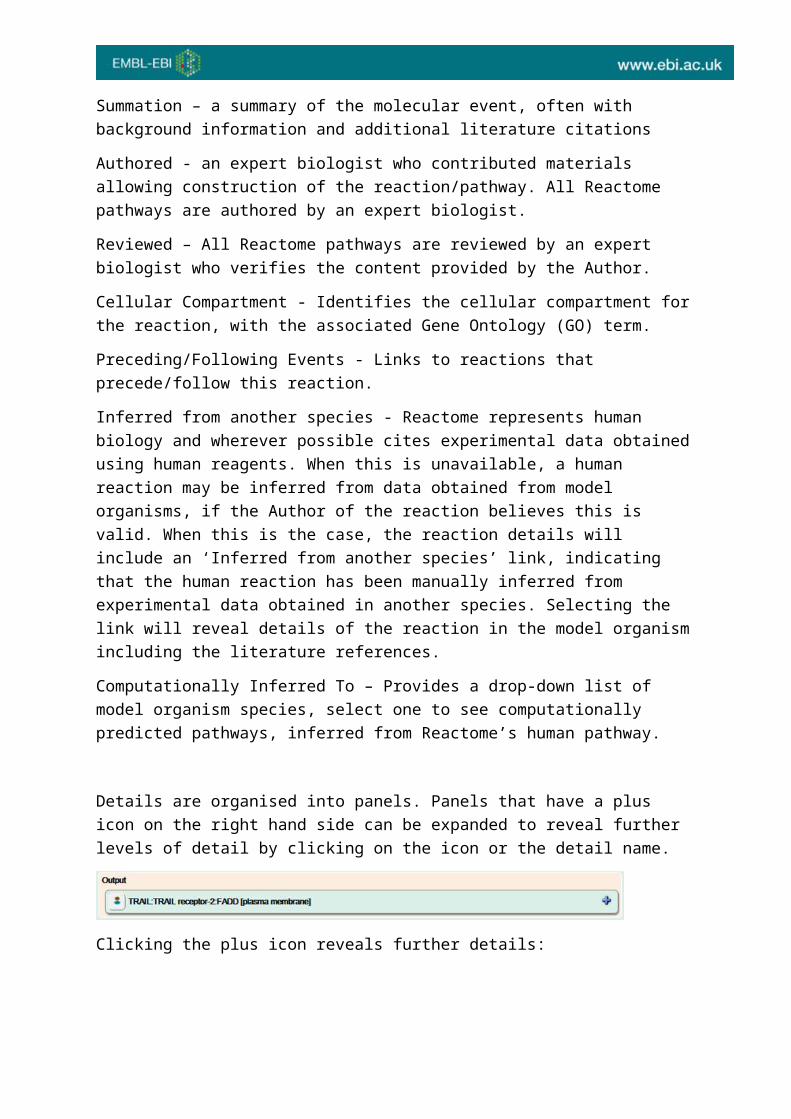
Details are organised into panels. Panels that have a plus icon on the right hand side can be expanded to reveal further levels of detail by clicking on the icon or the detail name.
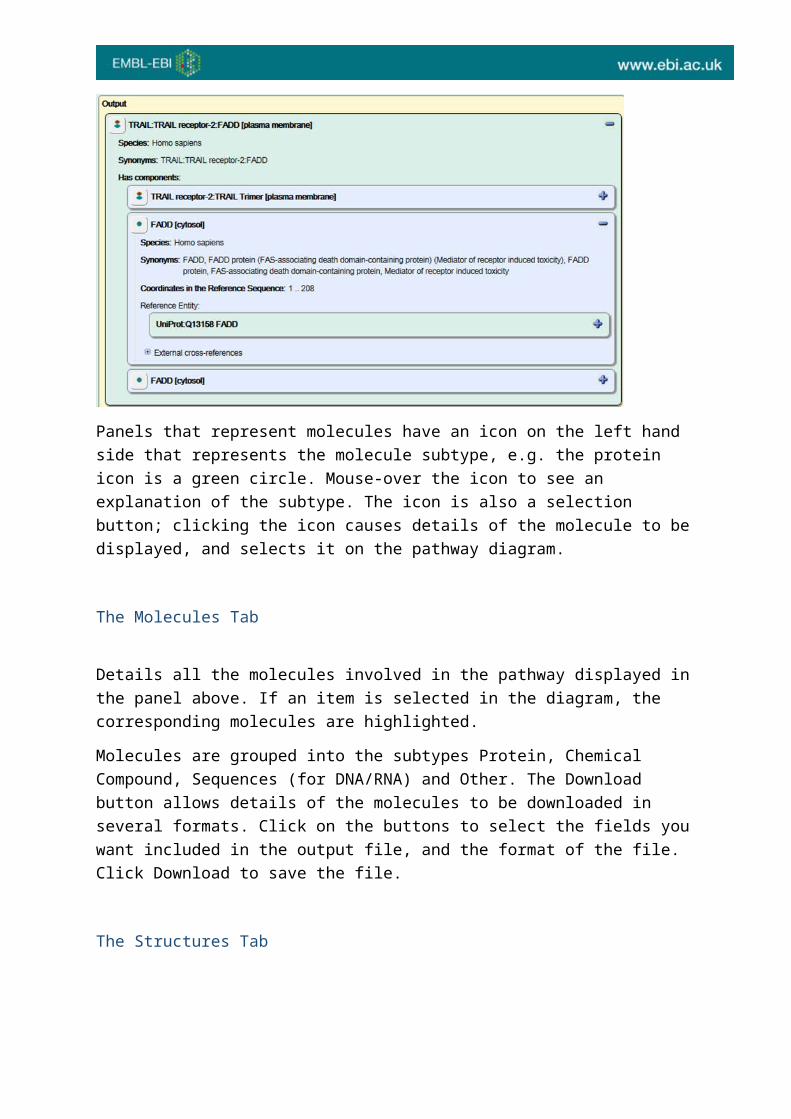
Clicking the plus icon reveals further details:
Panels that represent molecules have an icon on the left hand side that represents the molecule subtype, e.g. the protein icon is a green circle. Mouse-over the icon to see an explanation of the subtype. The icon is also a selection button; clicking the icon causes details of the molecule to be displayed, and selects it on the pathway diagram.
The Molecules Tab
Details all the molecules involved in the pathway displayed in the panel above. If an item is selected in the diagram, the corresponding molecules are highlighted.
Molecules are grouped into the subtypes Protein, Chemical Compound, Sequences (for DNA/RNA) and Other. The Download button allows details of the molecules to be downloaded in several formats. Click on the buttons to select the fields you want included in the output file, and the format of the file. Click Download to save the file.
The Structures Tab
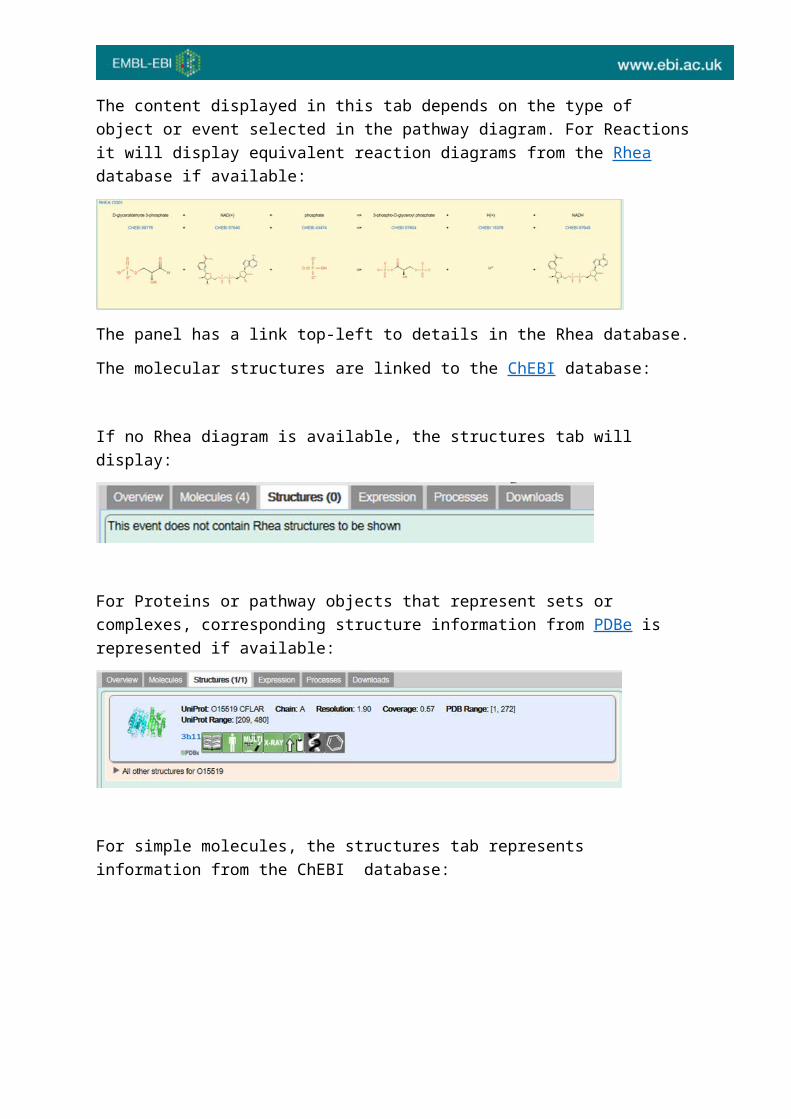
The content displayed in this tab depends on the type of object or event selected in the pathway diagram. For Reactions it will display equivalent reaction diagrams from the Rhea database if available:
The panel has a link top-left to details in the Rhea database.
The molecular structures are linked to the ChEBI database:
If no Rhea diagram is available, the structures tab will display:
For Proteins or pathway objects that represent sets or complexes, corresponding structure information from PDBe is represented if available:
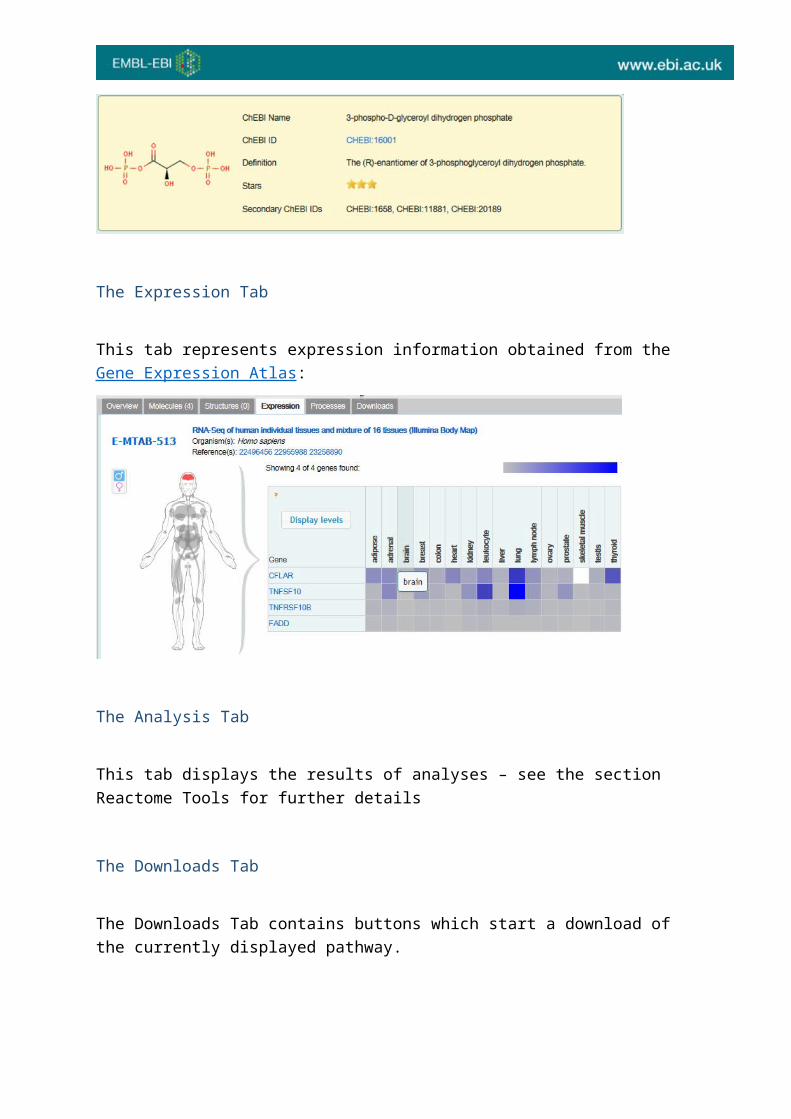
For simple molecules, the structures tab represents information from the ChEBI database:
The Expression Tab
This tab represents expression information obtained from the Gene Expression Atlas:
The Analysis Tab
This tab displays the results of analyses – see the section Reactome Tools for further details
The Downloads Tab
The Downloads Tab contains buttons which start a download of the currently displayed pathway.

Exercise 5
This exercise checks that you understand the Details Panel.
1. Find the reaction ‘Activated type I receptor phosphorylates SMAD2/3 directly’. What pathway does it belong to?
2. In which cellular compartment does this reaction take place?3. What is the GO molecular function associated with the catalyst?4. What reference has experimental verification of this reaction?5. Is this reaction predicted to occur in Canis familiaris? In C. elegans?6. Is this event likely to occur in liver?7. Are 3D structures available for TGF-beta1?
Disease in Reactome
Reactome can annotate and display pathways associated with disease.
Disease events or processes are overlaid onto their normal counterparts to provide a pathway context to the disease event.
Disease events have red connecting lines; abnormal molecules involved in these processes are outlined in red.
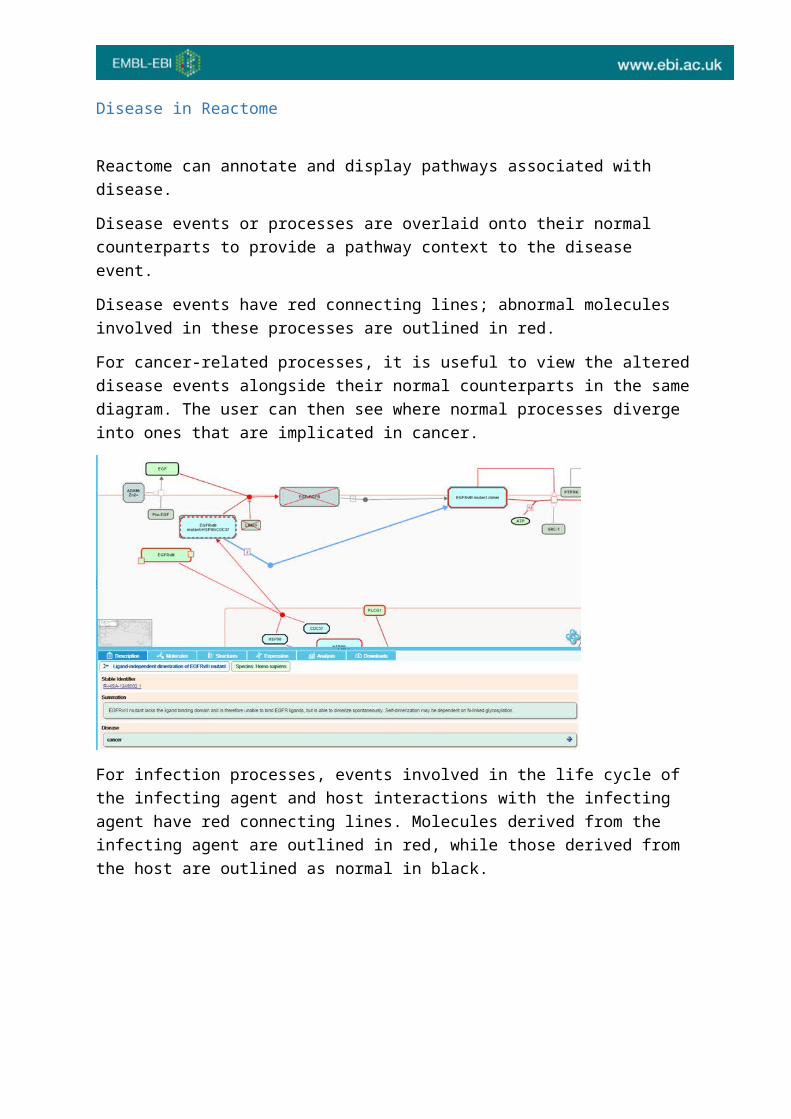
For cancer-related processes, it is useful to view the altered disease events alongside their normal counterparts in the same diagram. The user can then see where normal processes diverge into ones that are implicated in cancer.
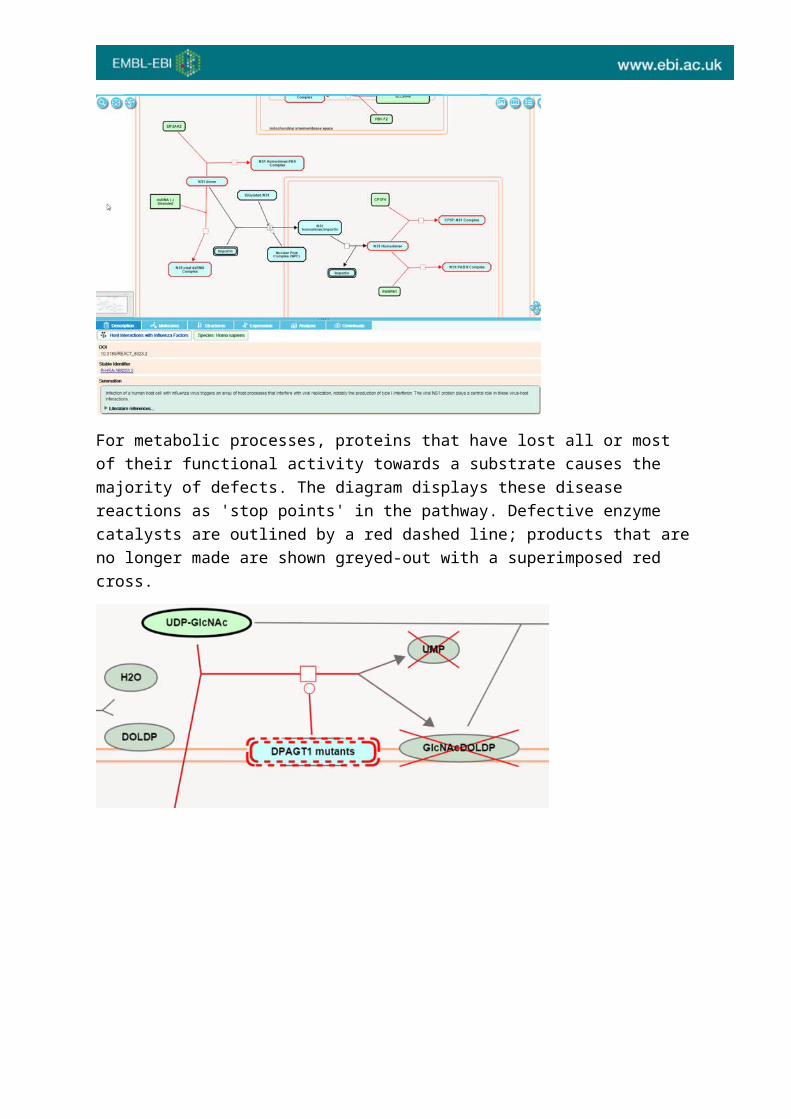
For infection processes, events involved in the life cycle of the infecting agent and host interactions with the infecting agent have red connecting lines. Molecules derived from the infecting agent are outlined in red, while those derived from the host are outlined as normal in black.
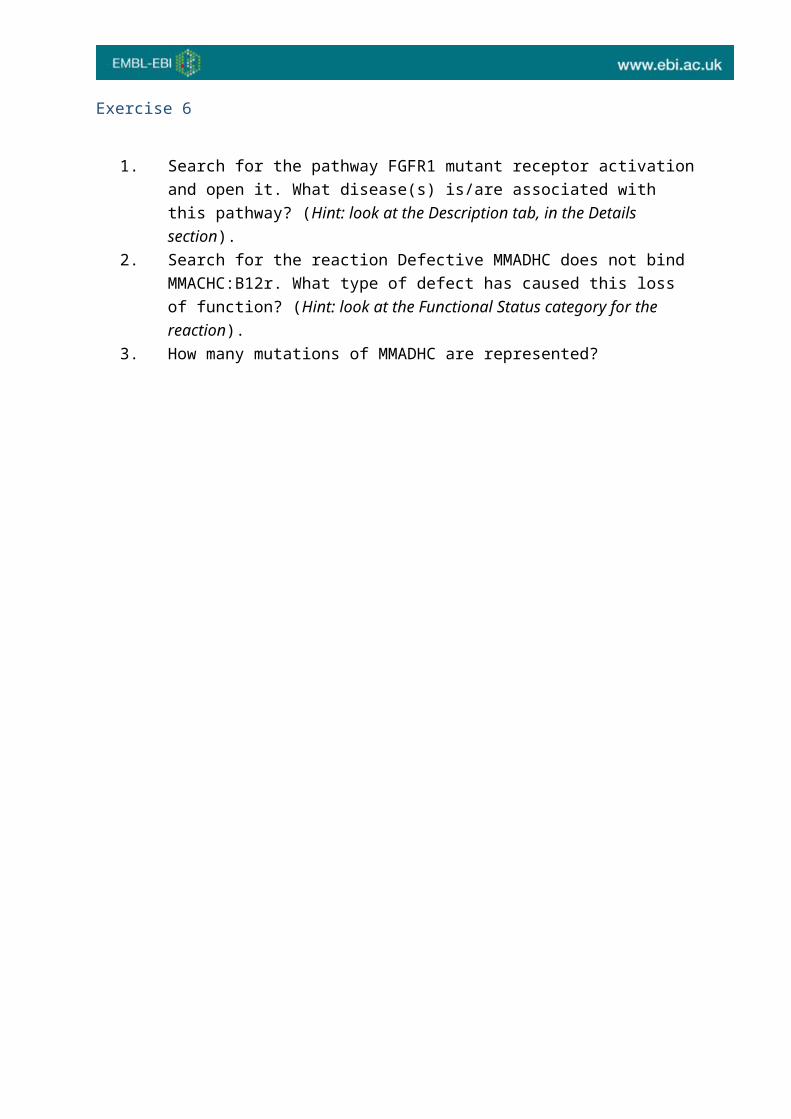
For metabolic processes, proteins that have lost all or most of their functional activity towards a substrate causes the majority of defects. The diagram displays these disease reactions as 'stop points' in the pathway. Defective enzyme catalysts are outlined by a red dashed line; products that are no longer made are shown greyed-out with a superimposed red cross.
Exercise 6
1. Search for the pathway FGFR1 mutant receptor activation and open it. What disease(s) is/are associated with this pathway? (Hint: look at the Description tab, in the Details section).
2. Search for the reaction Defective MMADHC does not bind MMACHC:B12r. What type of defect has caused this loss of function? (Hint: look at the Functional Status category for the reaction).
3. How many mutations of MMADHC are represented?
Reactome Tools
Analyse Data
The Analyse data panel is opened in the Pathway Browser by clicking on the Analysis button on the Pathway Browser header bar:
Alternatively, from the Homepage select the Analyze data button:
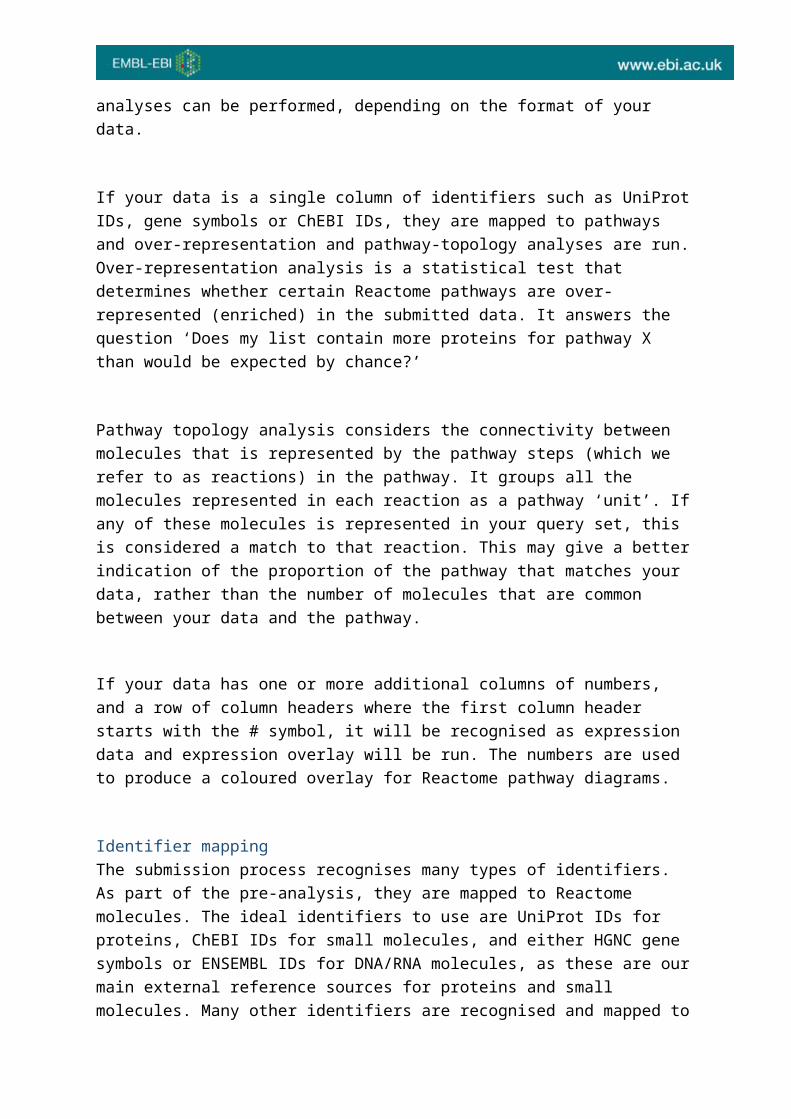
This opens a submission form, where you can select the analysis you want to perform, paste in or browse to a file containing your data, or use an example data set.
There are two sections to the submision form. Use the Analyse your data section to submit your data. Several different analyses can be performed, depending on the format of your data.
If your data is a single column of identifiers such as UniProt IDs, gene symbols or ChEBI IDs, they are mapped to pathways and over-representation and pathway-topology analyses are run. Over-representation analysis is a statistical test that determines whether certain Reactome pathways are over-represented (enriched) in the submitted data. It answers the question ‘Does my list contain more proteins for pathway X than would be expected by chance?’
Pathway topology analysis considers the connectivity between molecules that is represented by the pathway steps (which we refer to as reactions) in the pathway. It groups all the molecules represented in each reaction as a pathway ‘unit’. If any of these molecules is represented in your query set, this is considered a match to that reaction. This may give a better indication of the proportion of the pathway that matches your data, rather than the number of molecules that are common between your data and the pathway.
If your data has one or more additional columns of numbers, and a row of column headers where the first column header starts with the # symbol, it will be recognised as expression data and expression overlay will be run. The numbers are used to produce a coloured overlay for Reactome pathway diagrams.
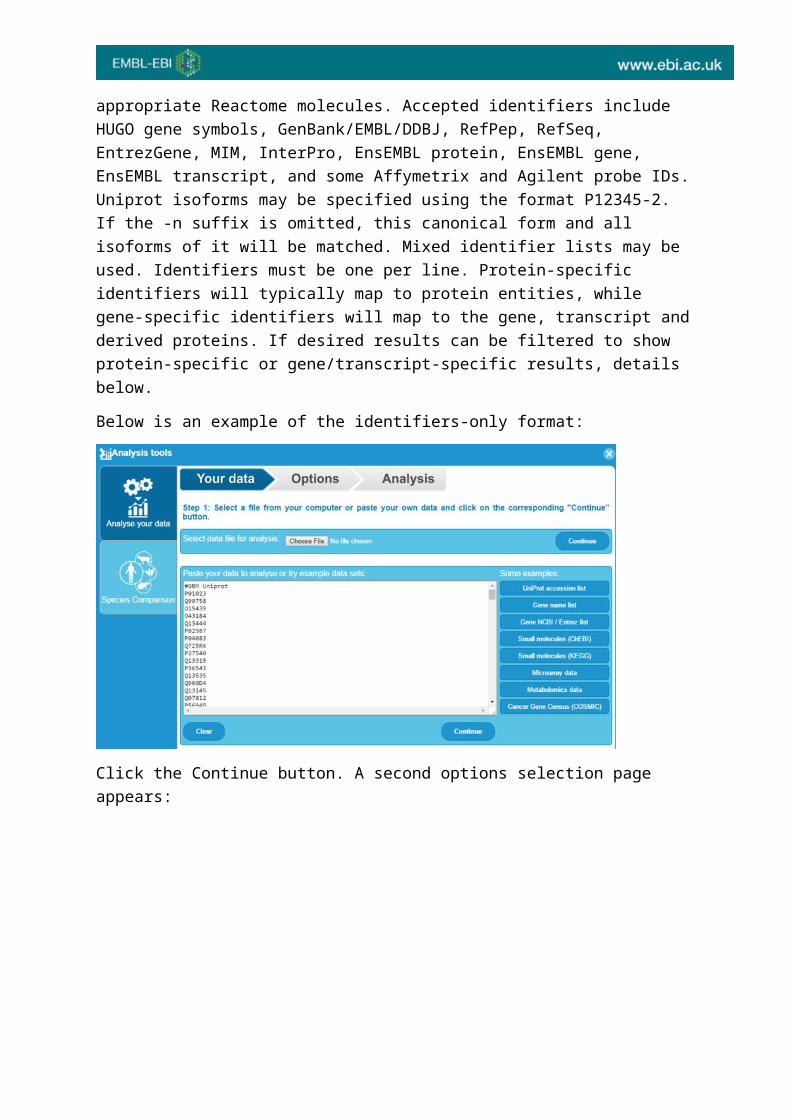
Identifier mapping The submission process recognises many types of identifiers. As part of the pre-analysis, they are mapped to Reactome molecules. The ideal identifiers to use are UniProt IDs for proteins, ChEBI IDs for small molecules, and either HGNC gene symbols or ENSEMBL IDs for DNA/RNA molecules, as these are our main external reference sources for proteins and small molecules. Many other identifiers are recognised and mapped to appropriate Reactome molecules. Accepted identifiers include HUGO gene symbols, GenBank/EMBL/DDBJ, RefPep, RefSeq, EntrezGene, MIM, InterPro, EnsEMBL protein, EnsEMBL gene, EnsEMBL transcript, and some Affymetrix and Agilent probe IDs. Uniprot isoforms may be specified using the format P12345-2. If the -n suffix is omitted, this canonical form and all isoforms of it will be matched. Mixed identifier lists may be used. Identifiers must be one per line. Protein-specific identifiers will typically map to protein entities, while gene-specific identifiers will map to the gene, transcript and derived proteins. If desired results can be filtered to show protein-specific or gene/transcript-specific results, details below.
Below is an example of the identifiers-only format:

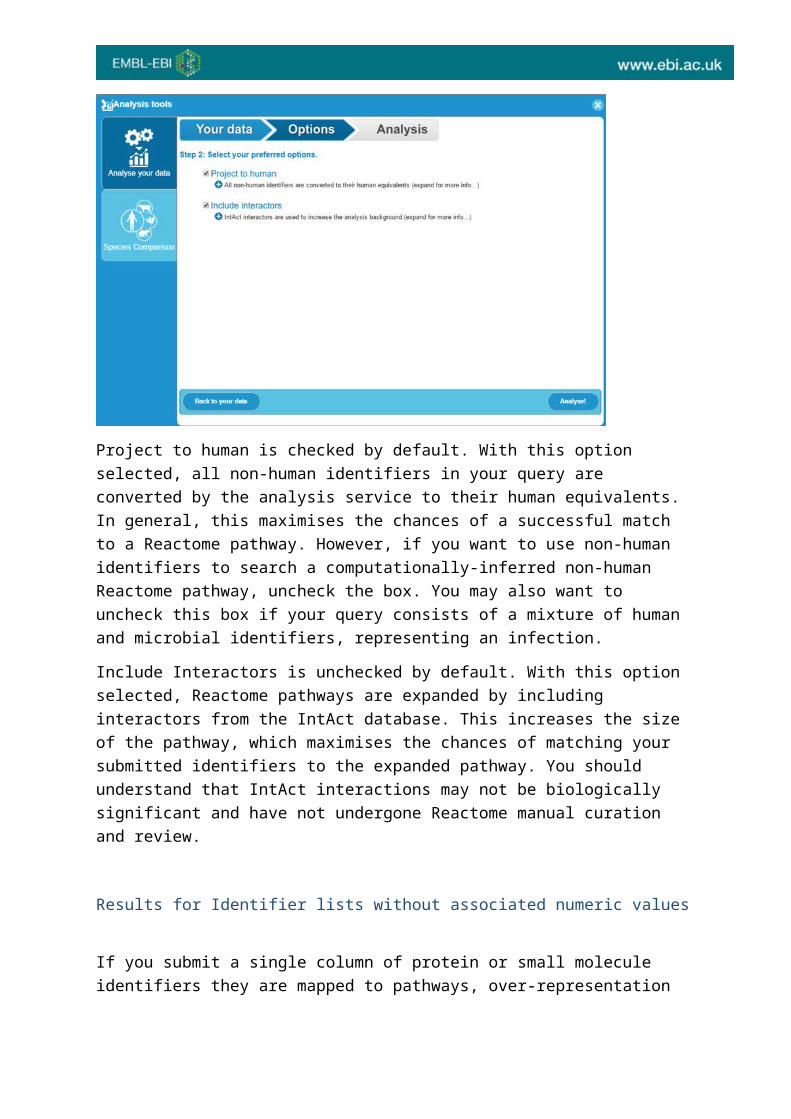
Click the Continue button. A second options selection page appears:
Project to human is checked by default. With this option selected, all non-human identifiers in your query are converted by the analysis service to their human equivalents. In general, this maximises the chances of a successful match to a Reactome pathway. However, if you want to use non-human identifiers to search a computationally-inferred non-human Reactome pathway, uncheck the box. You may also want to uncheck this box if your query consists of a mixture of human and microbial identifiers, representing an infection.
Include Interactors is unchecked by default. With this option selected, Reactome pathways are expanded by including interactors from the IntAct database. This increases the size of the pathway, which maximises the chances of matching your submitted identifiers to the expanded pathway. You should understand that IntAct
interactions may not be biologically significant and have not undergone Reactome manual curation and review.
Results for Identifier lists without associated numeric values
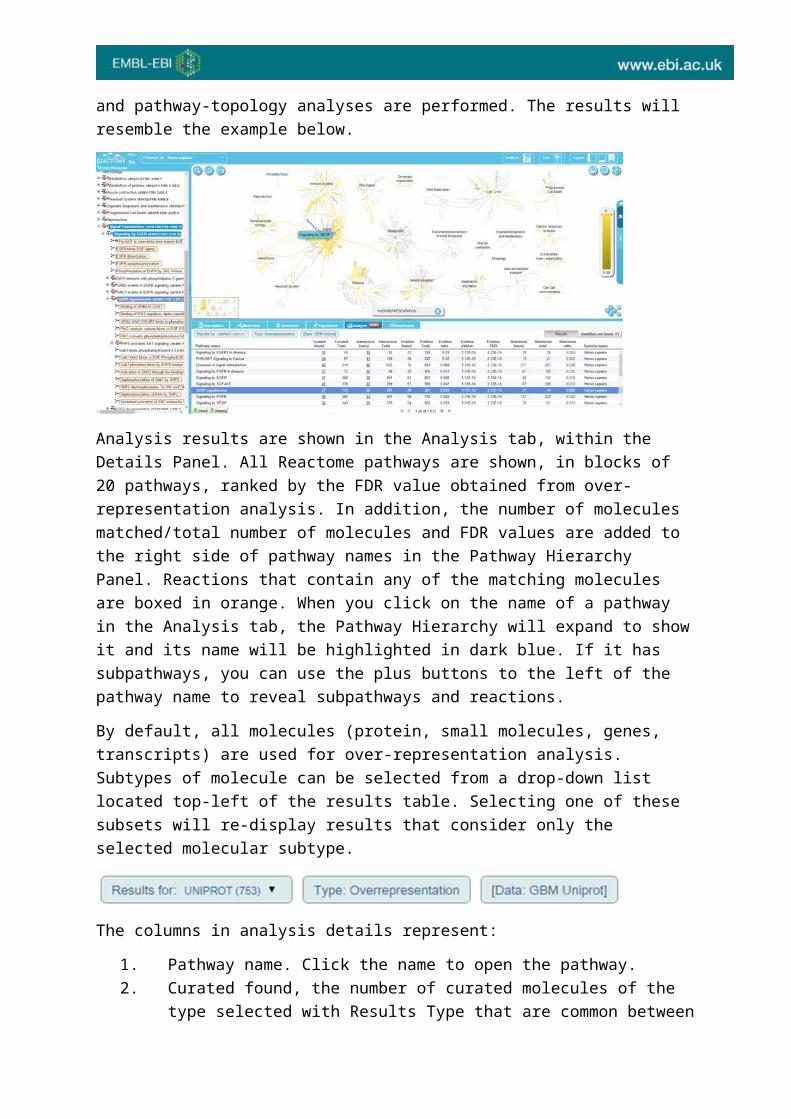
If you submit a single column of protein or small molecule identifiers they are mapped to pathways, over-representation and pathway-topology analyses are performed. The results will resemble the example below.
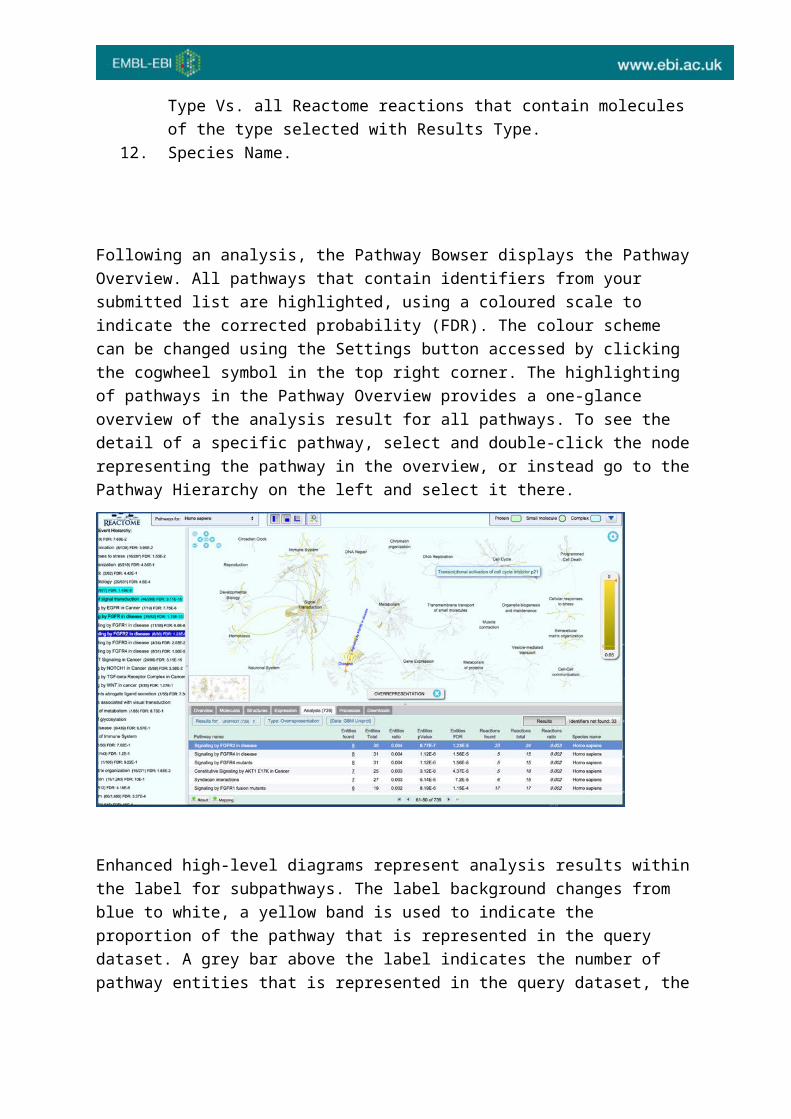
Analysis results are shown in the Analysis tab, within the Details Panel. All Reactome pathways are shown, in blocks of 20 pathways, ranked by the FDR value obtained from over-representation analysis. In addition, the number of molecules matched/total number of molecules and FDR values are added to the right side of pathway names in the Pathway Hierarchy Panel. Reactions that contain any of the matching molecules are boxed in orange. When you click on the name of a pathway in the Analysis tab, the Pathway Hierarchy will expand to show it and its name will be highlighted in dark blue. If it has subpathways, you can use the plus buttons to the left of the pathway name to reveal subpathways and reactions.
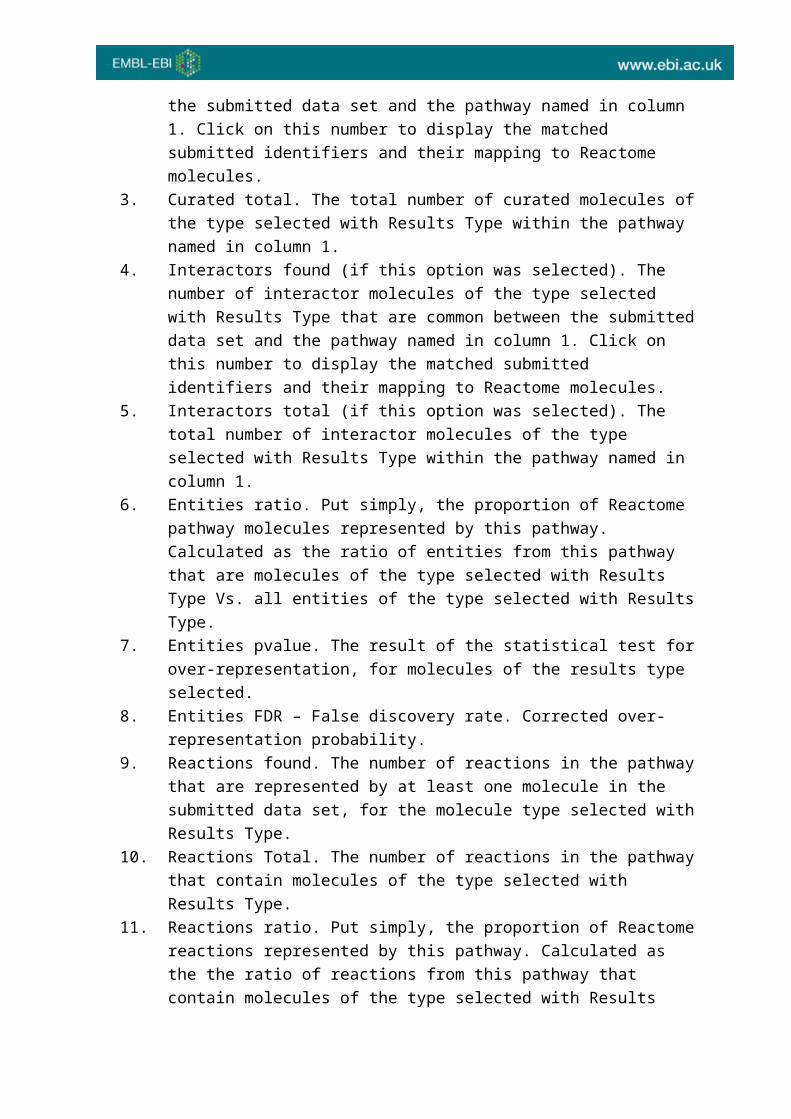
By default, all molecules (protein, small molecules, genes, transcripts) are used for over-representation analysis. Subtypes of molecule can be selected from a drop-down list located top-left of the results table. Selecting one of these subsets will re-display results that consider only the selected molecular subtype.
The columns in analysis details represent:
1. Pathway name. Click the name to open the pathway. 2. Curated found, the number of curated molecules of the type selected with
Results Type that are common between the submitted data set and the
pathway named in column 1. Click on this number to display the matched submitted identifiers and their mapping to Reactome molecules.
3. Curated total. The total number of curated molecules of the type selected with Results Type within the pathway named in column 1.
4. Interactors found (if this option was selected). The number of interactor molecules of the type selected with Results Type that are common between the submitted data set and the pathway named in column 1. Click on this number to display the matched submitted identifiers and their mapping to Reactome molecules.
5. Interactors total (if this option was selected). The total number of interactor molecules of the type selected with Results Type within the pathway named in column 1.
6. Entities ratio. Put simply, the proportion of Reactome pathway molecules represented by this pathway. Calculated as the ratio of entities from this pathway that are molecules of the type selected with Results Type Vs. all entities of the type selected with Results Type.
7. Entities pvalue. The result of the statistical test for over-representation, for molecules of the results type selected.
8. Entities FDR – False discovery rate. Corrected over-representation probability.
9. Reactions found. The number of reactions in the pathway that are represented by at least one molecule in the submitted data set, for the molecule type selected with Results Type.
10. Reactions Total. The number of reactions in the pathway that contain molecules of the type selected with Results Type.
11. Reactions ratio. Put simply, the proportion of Reactome reactions represented by this pathway. Calculated as the the ratio of reactions from this pathway that contain molecules of the type selected with Results Type Vs. all Reactome reactions that contain molecules of the type selected with Results Type.
12. Species Name.
Following an analysis, the Pathway Bowser displays the Pathway Overview. All pathways that contain identifiers from your submitted list are highlighted, using a coloured scale to indicate the corrected probability (FDR). The colour scheme can be changed using the Settings button accessed by clicking the cogwheel symbol in the top right corner. The highlighting of pathways in the Pathway Overview provides a one-glance overview of the analysis result for all pathways. To see the detail of a specific pathway, select and double-click the node representing the pathway in the overview, or instead go to the Pathway Hierarchy on the left and select it there.
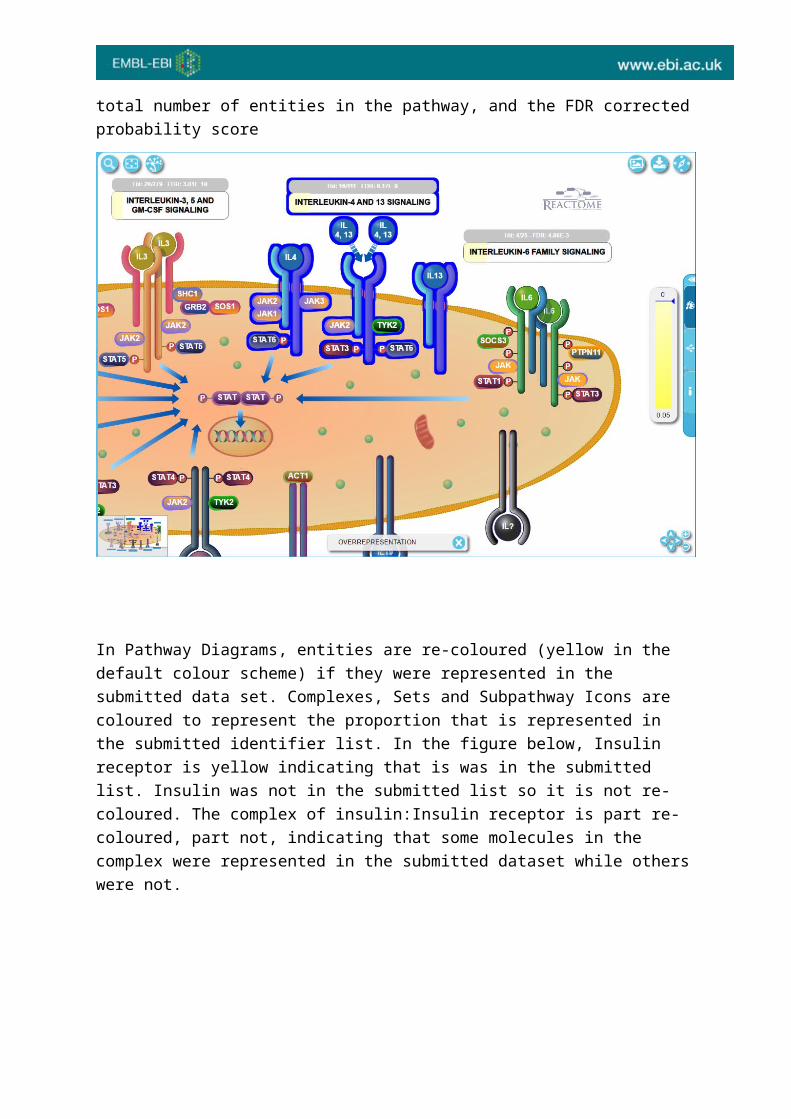
Enhanced high-level diagrams represent analysis results within the label for subpathways. The label background changes from blue to white, a yellow band is used to indicate the proportion of the pathway that is represented in the query dataset. A grey bar above the label indicates the number of pathway entities that is represented in the query dataset, the total number of entities in the pathway, and the FDR corrected probability score
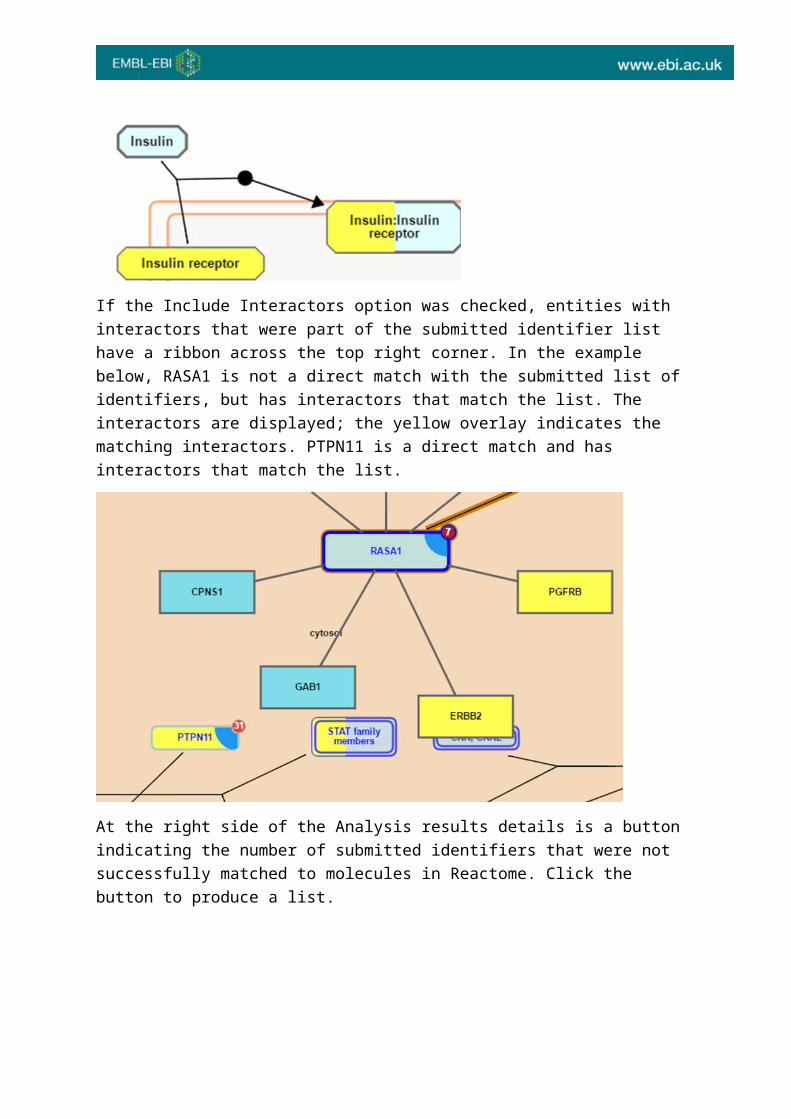
In Pathway Diagrams, entities are re-coloured (yellow in the default colour scheme) if they were represented in the submitted data set. Complexes, Sets and Subpathway Icons are coloured to represent the proportion that is represented in the submitted identifier list. In the figure below, Insulin receptor is yellow indicating that is was in the submitted list. Insulin was not in the submitted list so it is not re-coloured. The complex of insulin:Insulin receptor is part re-coloured, part not, indicating that some molecules in the complex were represented in the submitted dataset while others were not.
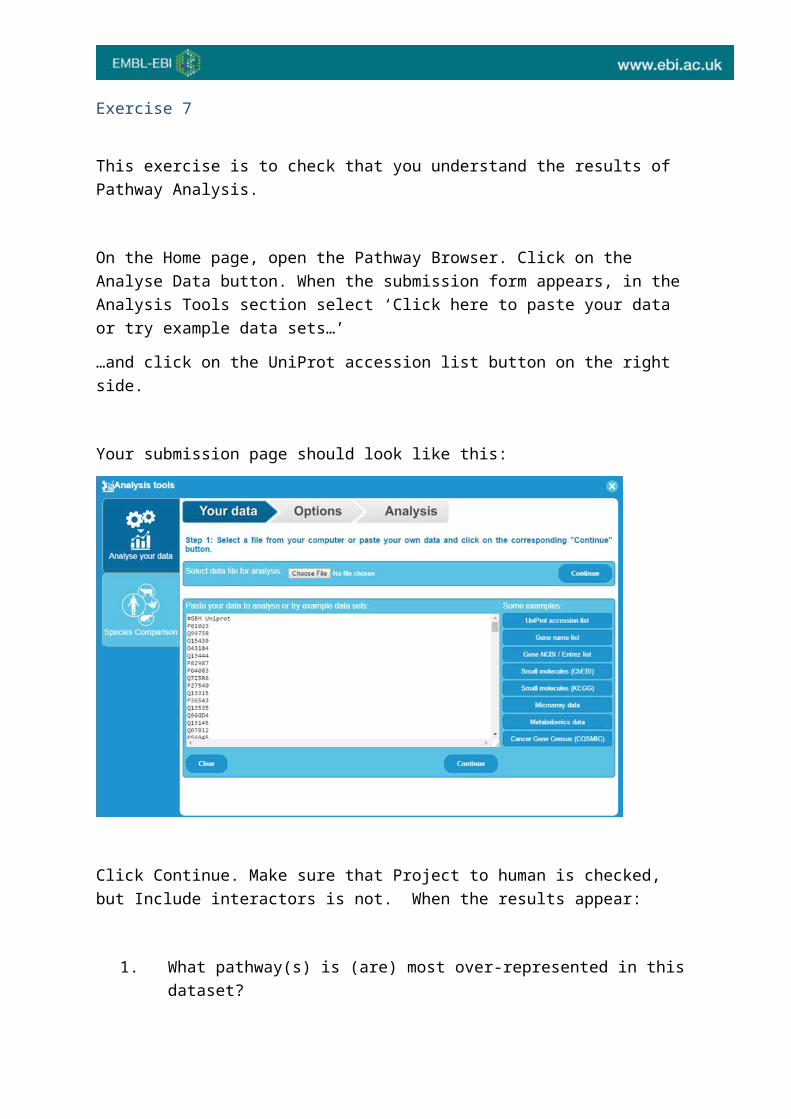
If the Include Interactors option was checked, entities with interactors that were part of the submitted identifier list have a ribbon across the top right corner. In the example below, RASA1 is not a direct match with the submitted list of identifiers, but has interactors that match the list. The interactors are displayed; the yellow overlay indicates the matching interactors. PTPN11 is a direct match and has interactors that match the list.
At the right side of the Analysis results details is a button indicating the number of submitted identifiers that were not successfully matched to molecules in Reactome. Click the button to produce a list.
Exercise 7
This exercise is to check that you understand the results of Pathway Analysis.
On the Home page, open the Pathway Browser. Click on the Analyse Data button. When the submission form appears, in the Analysis Tools section select ‘Click here to paste your data or try example data sets…’
…and click on the UniProt accession list button on the right side.
Your submission page should look like this:
Click Continue. Make sure that Project to human is checked, but Include interactors is not. When the results appear:
1. What pathway(s) is (are) most over-represented in this dataset? 2. How many IDs match the pathway at the top of the list?3. Roughly what proportion of molecules in the pathway are matched?4. What proportion of reactions are matched?5. Repeat the analysis but this time check the box to Include interactors. Are
the results the same? If not, why?
Results for Identifier lists with associated numeric values (expression representation)
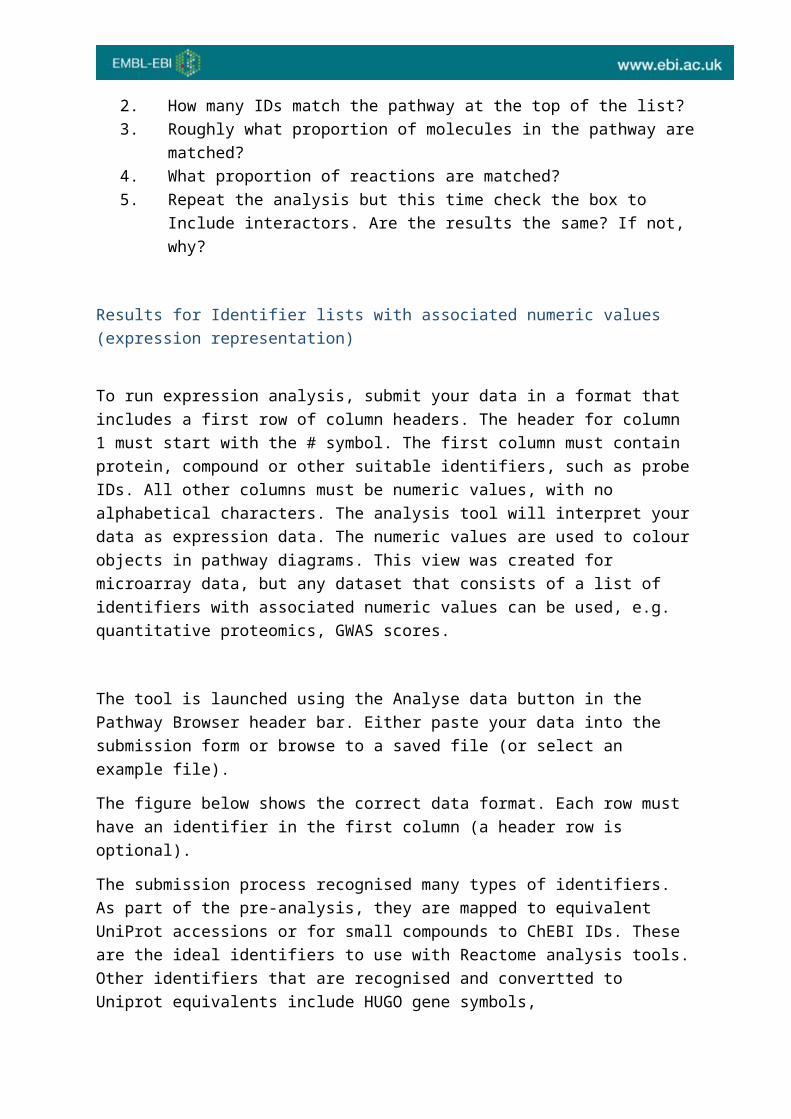
To run expression analysis, submit your data in a format that includes a first row of column headers. The header for column 1 must start with the # symbol. The first column must contain protein, compound or other suitable identifiers, such as probe IDs. All other columns must be numeric values, with no alphabetical characters. The analysis tool will interpret your data as expression data. The numeric values are used to colour objects in pathway diagrams. This view was created for microarray data, but any dataset that consists of a list of identifiers with associated numeric values can be used, e.g. quantitative proteomics, GWAS scores.
The tool is launched using the Analyse data button in the Pathway Browser header bar. Either paste your data into the submission form or browse to a saved file (or select an example file).
The figure below shows the correct data format. Each row must have an identifier in the first column (a header row is optional).
The submission process recognised many types of identifiers. As part of the pre-analysis, they are mapped to equivalent UniProt accessions or for small compounds to ChEBI IDs. These are the ideal identifiers to use with Reactome analysis tools. Other identifiers that are recognised and convertted to Uniprot equivalents include HUGO gene symbols, GenBank/EMBL/DDBJ, RefPep, RefSeq, EntrezGene, MIM and InterPro IDs, some Affymetrix and Agilent probe IDs, Ensembl protein, transcript and gene identifiers. Identifiers that contain only numbers such as those from OMIM and EntrezGene must be prefixed by the source database name and a colon e.g. MIM:602544, EntrezGene:55718. Mixed identifier lists may be used. Identifiers must be one per line.
By default, all non-human identifiers are mapped to their human equivalents, unless the Project to human checkbox is unselected.
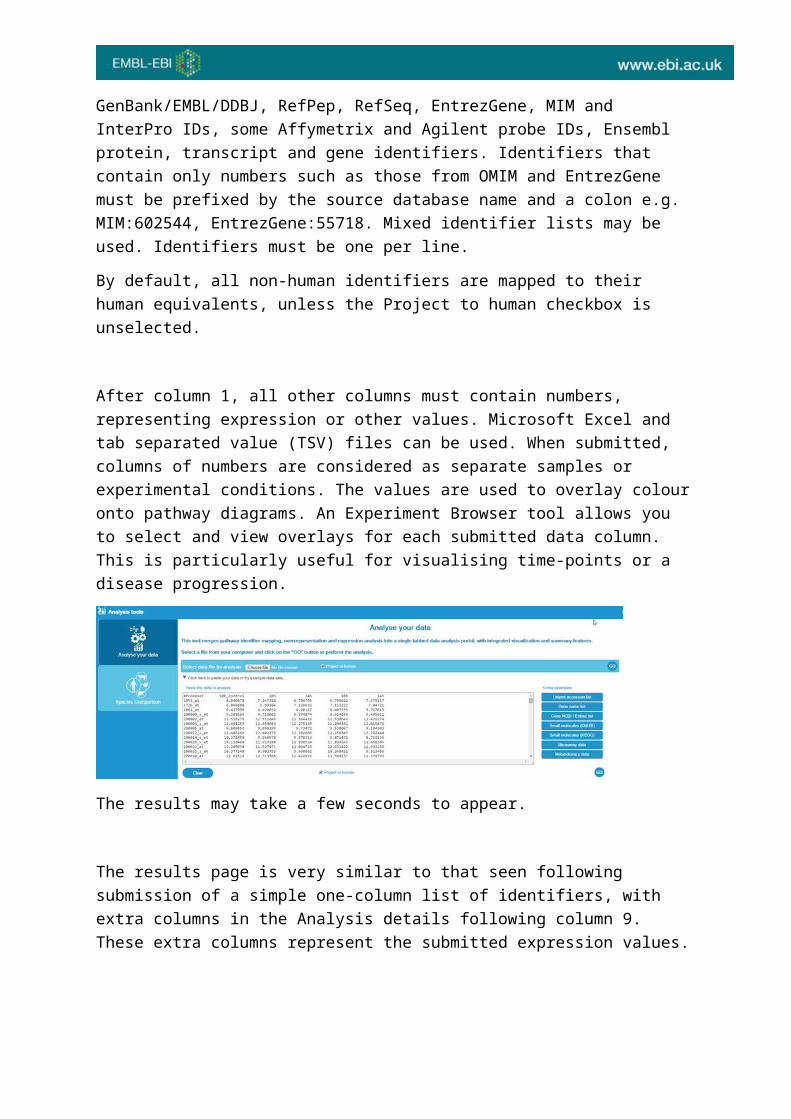
After column 1, all other columns must contain numbers, representing expression or other values. Microsoft Excel and tab separated value (TSV) files can be used. When submitted, columns of numbers are considered as separate samples or experimental conditions. The values are used to overlay colour onto pathway diagrams. An Experiment Browser tool allows you to select and view overlays for each submitted data column. This is particularly useful for visualising time-points or a disease progression.
The results may take a few seconds to appear.
The results page is very similar to that seen following submission of a simple one-column list of identifiers, with extra columns in the Analysis details following column 9. These extra columns represent the submitted expression values.
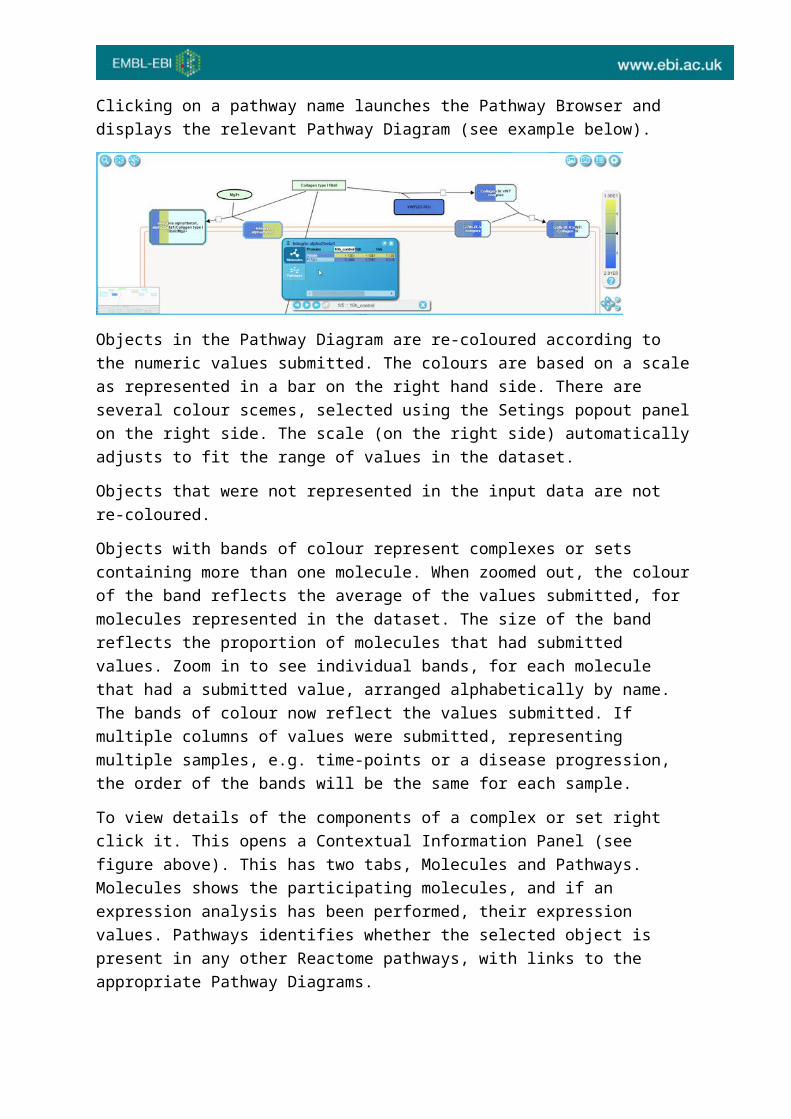
Clicking on a pathway name launches the Pathway Browser and displays the relevant Pathway Diagram (see example below).
Objects in the Pathway Diagram are re-coloured according to the numeric values submitted. The colours are based on a scale as represented in a bar on the right hand side. There are several colour scemes, selected using the Setings popout panel on the right side. The scale (on the right side) automatically adjusts to fit the range of values in the dataset.
Objects that were not represented in the input data are not re-coloured.
Objects with bands of colour represent complexes or sets containing more than one molecule. When zoomed out, the colour of the band reflects the average of the values submitted, for molecules represented in the dataset. The size of the band reflects the proportion of molecules that had submitted values. Zoom in to see individual bands, for each molecule that had a submitted value, arranged alphabetically by name. The bands of colour now reflect the values submitted. If multiple columns of values were submitted, representing multiple samples, e.g. time-points or a disease progression, the order of the bands will be the same for each sample.
To view details of the components of a complex or set right click it. This opens a Contextual Information Panel (see figure above). This has two tabs, Molecules and Pathways. Molecules shows the participating molecules, and if an expression analysis has been performed, their expression values. Pathways identifies whether the selected object is present in any other Reactome pathways, with links to the appropriate Pathway Diagrams.
Multiple CIPs can be opened and pinned so they remain visible when other entities are selected.
The browser remembers CIPs that were pinned on the last visit (for up to 5 diagrams).
The orange Experiment Browser toolbar (bottom left in the figure above) is used to step through the columns of your data, e.g. time-points or disease progression. Move between them by clicking the arrow buttons. The header of the data column (if present) is displayed between the arrows. The Pathway Diagram will re-colour to reflect the new values.
For an explanation of the results seen in the Identifier results tab see the explanation in the section Results for Identifier lists without associated numeric values.
Exercise 8
This exercise is to check that you can run and interpret the results of Expression Analysis.
Launch Expression Analysis and load the example dataset. Click GO When the results are displayed, find the pathway DNA Repair,
1. How many proteins are in this pathway?2. What proportion of these had expression data?3. What was the average expression at 24h?4. Which subpathway has the highest average expression value at 24h?
(Hint: move your mouse pointer over the pathway overview diagram, and look at the scale on the right side).
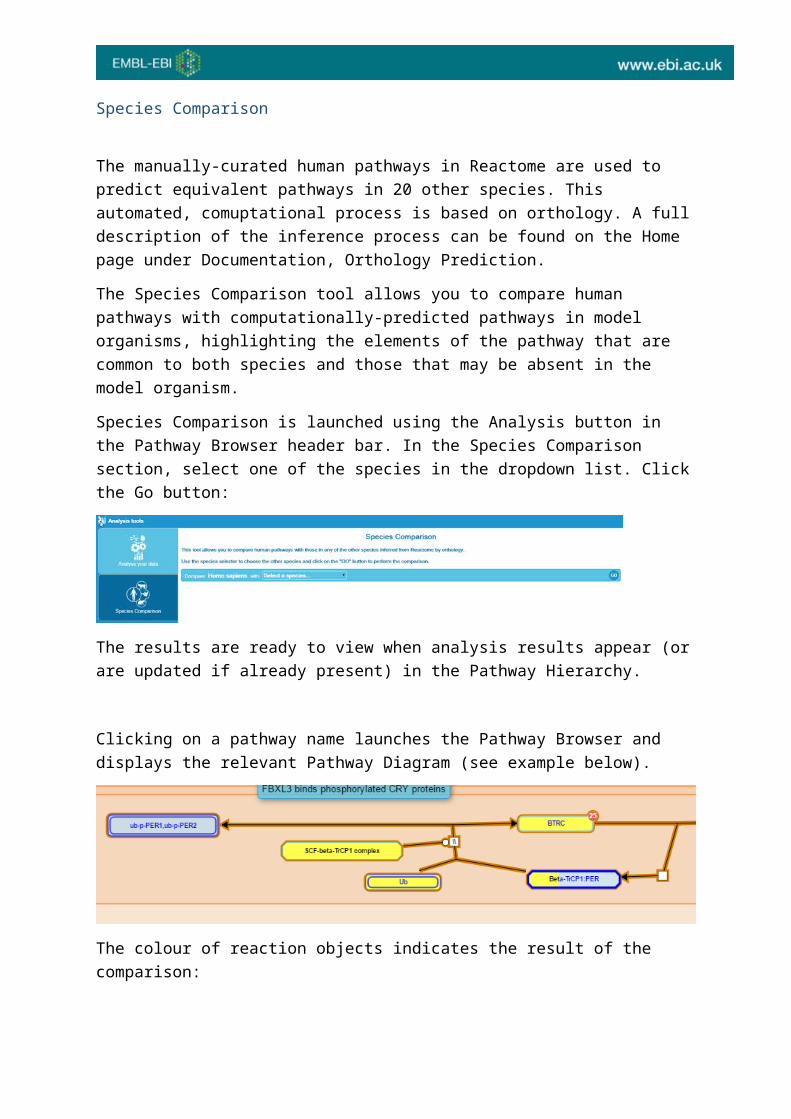
Species Comparison
The manually-curated human pathways in Reactome are used to predict equivalent pathways in 20 other species. This automated, comuptational process is based on orthology. A full description of the inference process can be found on the Home page under Documentation, Orthology Prediction.
The Species Comparison tool allows you to compare human pathways with computationally-predicted pathways in model organisms, highlighting the elements of the pathway that are common to both species and those that may be absent in the model organism.
Species Comparison is launched using the Analysis button in the Pathway Browser header bar. In the Species Comparison section, select one of the species in the dropdown list. Click the Go button:
The results are ready to view when analysis results appear (or are updated if already present) in the Pathway Hierarchy.
Clicking on a pathway name launches the Pathway Browser and displays the relevant Pathway Diagram (see example below).
The colour of reaction objects indicates the result of the comparison:
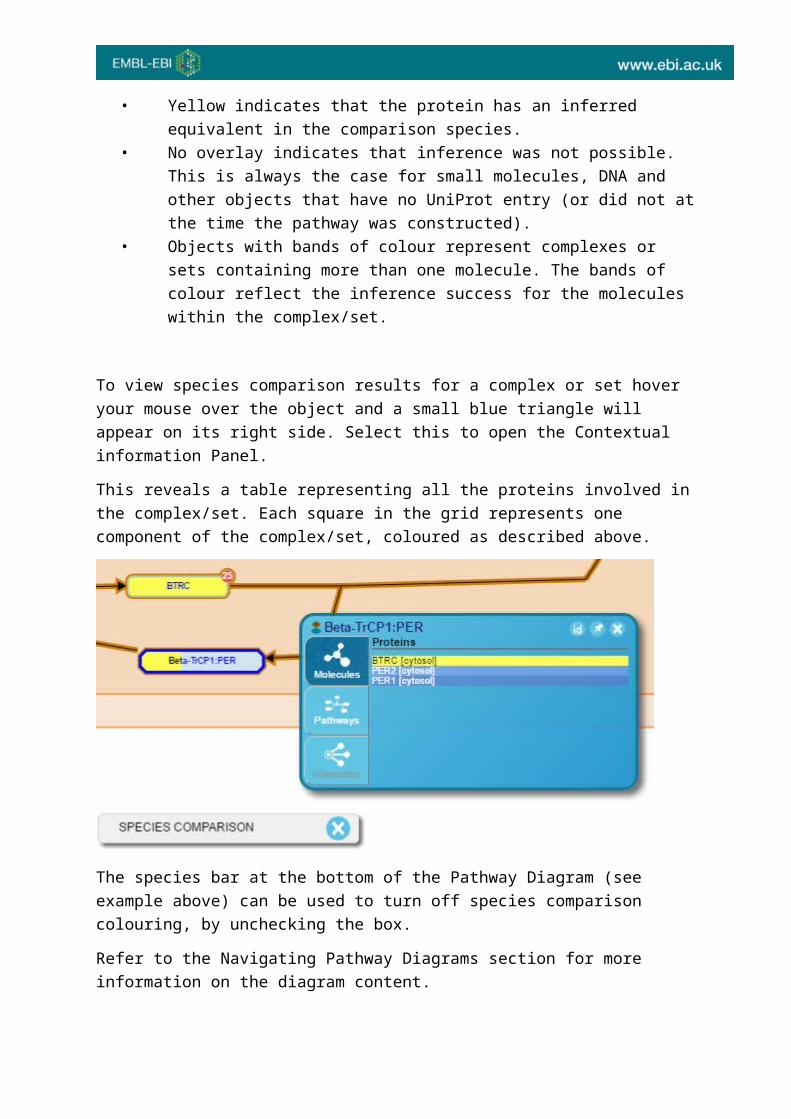
• Yellow indicates that the protein has an inferred equivalent in the comparison species.
• No overlay indicates that inference was not possible. This is always the case for small molecules, DNA and other objects that have no UniProt entry (or did not at the time the pathway was constructed).
• Objects with bands of colour represent complexes or sets containing more than one molecule. The bands of colour reflect the inference success for the molecules within the complex/set.
To view species comparison results for a complex or set hover your mouse over the object and a small blue triangle will appear on its right side. Select this to open the Contextual information Panel.
This reveals a table representing all the proteins involved in the complex/set. Each square in the grid represents one component of the complex/set, coloured as described above.
The species bar at the bottom of the Pathway Diagram (see example above) can be used to turn off species comparison colouring, by unchecking the box.
Refer to the Navigating Pathway Diagrams section for more information on the diagram content.
Exercise 9
This exercise is to check that you can run and interpret Species Comparison results.
Launch Species Comparison and select the species Danio rerio. When the results are displayed, use the Pathway Hierarchy to Navigate to ‘Hemostasis’, ‘Dissolution of fibrin clot’.
1. Find PLAT(36-562) top-right of the diagram - what colour is it and why? 2. Find HRG - what colour is it and why?3. Why is Zn2+ (upper left) uncoloured?

Molecular Interaction Overlay
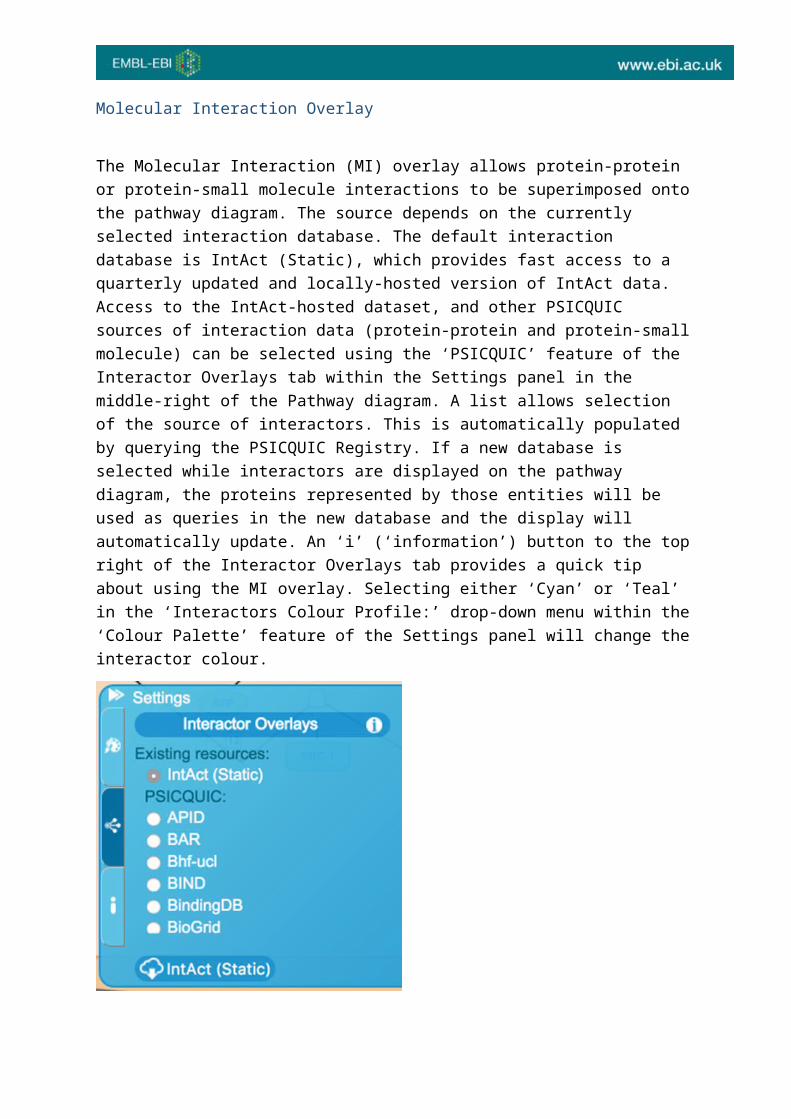
The Molecular Interaction (MI) overlay allows protein-protein or protein-small molecule interactions to be superimposed onto the pathway diagram. The source depends on the currently selected interaction database. The default interaction database is IntAct (Static), which provides fast access to a quarterly updated and locally-hosted version of IntAct data. Access to the IntAct-hosted dataset, and other PSICQUIC sources of interaction data (protein-protein and protein-small molecule) can be selected using the ‘PSICQUIC’ feature of the Interactor Overlays tab within the Settings panel in the middle-right of the Pathway diagram. A list allows selection of the source of interactors. This is automatically populated by querying the PSICQUIC Registry. If a new database is selected while interactors are displayed on the pathway diagram, the proteins represented by those entities will be used as queries in the new database and the display will automatically update. An ‘i’ (‘information’) button to the top right of the Interactor Overlays tab provides a quick tip about using the MI overlay. Selecting either ‘Cyan’ or ‘Teal’ in the ‘Interactors Colour Profile:’ drop-down menu within the ‘Colour Palette’ feature of the Settings panel will change the interactor colour.
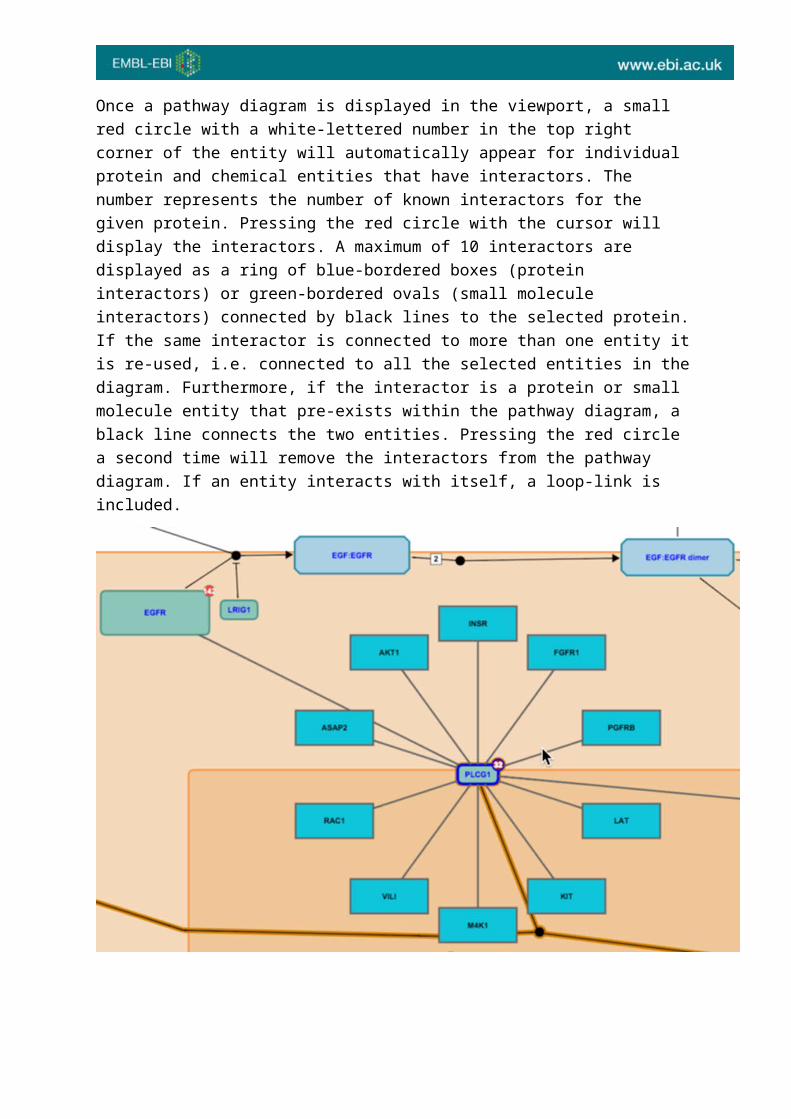
Once a pathway diagram is displayed in the viewport, a small red circle with a white-lettered number in the top right corner of the entity will automatically appear for individual protein and chemical entities that have interactors. The number represents the number of known interactors for the given protein. Pressing the red circle with the cursor will display the interactors. A maximum of 10 interactors are displayed as a ring of blue-bordered boxes (protein interactors) or green-bordered ovals (small molecule interactors) connected by black lines to the selected protein. If the same interactor is connected to more than one entity it is re-used, i.e. connected to all the selected entities in the diagram. Furthermore, if the interactor is a protein or small molecule entity that pre-exists within the pathway diagram, a black line connects the
two entities. Pressing the red circle a second time will remove the interactors from the pathway diagram. If an entity interacts with itself, a loop-link is included.
A number of clickable actions provide additional information about the interactor and its relationship to the protein entity. These include:
• Hovering the mouse pointer over a protein interactor produces a tooltip containing the name and UniProt identifier of the protein.
• Clicking on an interactor opens the database entry for the selected protein or chemical in a new window.
• Clicking on the line that connects the interactor to the pathway item opens a new window containing details of the interaction at the source database.
• Right-clicking the protein entity or selecting the blue triangle that appears on the right side when hovering the mouse pointer over it will open the Contextual Information Panel. Select the bottom Interactors tab to display a table of all the interactors for the selected entity. The interactive and scrollable table provides access to additional interactor information. Clicking the ‘Interactor’ name or accession identifier with connect to the UniProt or the interaction database, respectively. Clicking the ‘id’ button in the table will toggle the table to display either the interactor name or database identifier. Clicking the pin will lock the interactors table to the viewport. Clicking the ‘X’ in the table will close the table view.
Each binary interaction is scored, using a simple addition of the cumulated value of a weighted score for the interaction detection method and the interaction type for each interaction evidence associated with that binary pair. The default threshold is 0.45. Interactions with a confidence level equal to or above this threshold will be visible in the viewport. Moving the ‘Slider’ feature of the Molecular Overlay toolbar (light grey bar with dark grey slider at the bottom of the pathway diagram) to the right will adjust the confidence level and interactors below the displayed confidence level will disappear from the diagram. Moving the ‘Slider’ feature back to the left will result in the interactors reappearing with a confidence level equal to or above the threshold. Clicking the ‘X’ in the Molecular Overlay toolbar will remove the toolbar and all the interactors from the viewport.
Using the zoom in feature, to the bottom right corner of the Pathway Diagram or scrolling using the mouse, will increase relative size of the interactor icons. Once a size threshold is reached, a small image displaying the crystal structure of the protein or the chemical structure will appear in the interactor box or oval, respectively.
Details of all interactors for every protein in the pathway diagram can be downloaded as a tab-selected version file by selecting the ‘Cloud-like’ Download icon within the Molecular Overlay toolbar or the Interactor Overlays tab within the Settings panel.
Exercise 10
This exercise is to check that you can use and interpret Molecular Interaction Overlays
Open the Pathway Diagram for Netrin-1 Signaling.
1. Find the protein NEO1 (top left of the cytosol). How many interactors does it have?
2. What is the confidence score for the interaction between NEO1 and GD3? How many times has this interaction been documented? Hint: This detail is not in Reactome.
3. Find the protein PTPN11 (below and to the right of NEO1). How many interactors does it have? Display interactors for this protein. How many are there? Can you get a list of all of them?
4. What is the easiest way to remove interactors?
Viewing the Equivalent Pathway in another SpeciesReactome is human-centric and aims to represent human biology. Pathways in other species are electronically inferred from curated human pathways - a description of the inference process can be found here.
To view the predicted conservation of a pathway in another species, select the species of interest in the Species dropdown menu in the top left corner of the Pathway Browser. The dropdown buttonwill turn dark blue and the Pathway Browser will reset. Now select any pathway name from the Hierarchy to open the species-relevant computationally-predicted version of the human pathway. Any reaction events that could not be inferred from the human pathway will be absent. Use the dropdown again to switch to another species or back to human.
Details Views
Pathway Details
Pathway details appear in the Detail Panel at the bottom of the Pathway Browser.
The details are represented as boxes or panels, many contain additional levels of detail that can be expanded using a plus symbol on the right hand side. Note that there are often multiple levels of further details, which may not be apparent until the previous level is revealed. An icon to the left of molecule names will select that molecule in the diagram and reload the Details Panel with details of that molecule.
Pathway details always include a Summation, often with links to literature that provides general background for the pathway.
Other details within this section include:
Stable identifier – with the version number suffix removed, this can be used to refer to the pathway, providing a stable link that will not be affected by revisions. Click on the ID to see a revison history.
Authored - the expert biologists that contributed materials that allowed this pathway to be created in Reactome.
View computationally predicted event in – the dropdown list identifies the species that have been computationally predicted by the Reactome inference process to include this pathway.
References – this includes key literature sources that were used to create the pathway.
Reaction Details
Reaction details are similar to Pathway Details but have additional relevant sections:
Input/Output - identifies the input/output molecules, sets or complexes for this reaction. The composition of sets and complexes can be revealed using the Plus symbol on the right side of the panel.
Catalyst Activity – If the reaction has a catalyst this section identifies the molecule or complex, the associated GO Molecular Function term, and when relevant the molecule that has catalytic activity relevant to that function.
Cellular Compartment - identifies the cellular compartment for this reaction, with the associated GO term.
Preceding/Following Events - links to pathways that precede/follow this reaction.
View computationally predicted event in – provides a dropdown list of species that are computationally predicted to have a reaction that is functionally equivalent to the selected reaction.
Reviewed – names the expert that reviewed this reaction before it was added to the website.
Complex or Set Details
Details the members of the complex or set are displayed, similar to the details for reactions with some additional details:
Components - details the molecules that are part of the set or complex.
Produced by - details the reactions that generate the complex or set.
Consumed by - details the reactions that use the complex/set as an input.
Protein/Small molecule Details
Clicking on a single protein or small molecule in the Pathway Diagram, or where identified in the detail pane as part of a reaction, set or complex, updates the Detail Panel with details of that protein/small molecule.
The sections represented include:
External identifiers – lists cross-references in databases other than Reactome.
Coordinates in the Reference Sequence – identifies the peptide string that is represented, by reference to the peptide string available in the Primary External
Reference database. For human Peptides, this is UniProt. Note that several peptide molecules may be derived from the same UniProt reference, allowing Reactome to represent the result of cleavage and post-translational modification events.
Answers to Exercises
The answers may change as more data is added to Reactome; these are based on the October 2015 Reactome release.
Exercise 1
1. Select About, News on the Homepage. At time of writing, the latest item is ‘Reactome celebrates release of 10,000th annotated protein’.
2. Found via the Menu bar under Content, Statistics. At time of writing, 10212.
3. At time of writing the first topic is ATF6B (ATF6-beta) activates chaperones
4. Yes.5. 22 (6 are shown)6. Yes, 37. No, not at time of writing.
Exercise 2
1. The top pathway hit is ‘Signaling by PDGF’. Clicking on the + symbol to the left of the pathway name reveals 9 reactions, and 1 subpathway.
2. The subpathway ‘Downstream signal transduction’ has 16 reactions and 3 subpathways.
3. Following event(s) can be often be identified by simply following the connecting lines on the diagram, but not always! For a definitive answer, look in the Details View. This event has ‘dashed line’ connections with the inputs of 4 following events, meaning that at least one member of the output set is an input to the following event.
Exercise 3
1. The reaction node for this reaction is a solid circle, representing a binding reaction.
2. The reaction node symbol for this reaction is an open square, representing a ‘transition’ reaction.
3. Click on the reaction node to see Input and Output details in the Details Panel, the outputs are AA (the Reactome small molecule abbreviation used for Arachidonate), Glycerol and H+.
4. The name of the catalyst is the label for the catalyst object, MGLL (this is the HUGO gene name). To find the UniProt ID right-click on MGLL to see

its details in the Details pane. The second section of the Details Panel is Links to this entry in other databases, and it contains the UniProt ID, Q99685. If you click on this name it will expand and show more information about this protein, including alternative names (MGLL is also known as monoglyceride lipase).
Exercise 4
1. Either click on the subpathway name in the Hierarchy, or double-click the corresponding Subpathway Icon in the diagram.
2. ‘When you click on the sub-pathway, the events in the subpathway are selected, and the diagram zooms in to fit those events in the Diagram panel.
3. Clicking on ‘ATP binds P2X receptors’ will select just this reaction and centre the Pathway Diagram on this reaction.
Exercise 5
1. 'Activated type I receptor phosphorylates SMAD2/3 directly is part of the pathway ‘TGF-beta receptor signaling activates SMADs’.
2. You can often answer this question by looking at the diagram, but for a quick, definitive answer look for the Compartment section in the Details Panel. Click on the reaction in the pathway hierarchy or diagram, look at the Details panel for Cellular compartment - early endosome membrane.
3. Open the Catalyst section of the Details Panel. The associated GO molecular function is ‘transmembrane receptor protein serine/threonine kinase activity’.
4. The reference is ‘Phosphorylation of Smad signaling proteins by receptor serine/threonine kinases’ by Souchelnytski et al. 2002.
5. The answer can be found by looking in the Detail Panel at the section ‘View computationally predicted event in:’ Click here for a dropdown list of species where this event has been computationally inferred. Canis familiaris is in the list, but C. elegans is not, so yes for dog, no for worm.
6. Look at the Expression tab. None of the genes involved have significant expression in liver, so this event is unlikely to occur in liver.
7. Select the catalyst of this reaction, and then look in the Structures tab. Scroll down and you will find a link to en ePDB structure for TGFB1. Note that this is the ‘best’ structure available, based on measures set by ePDB. Other structures are also available via the link.
Exercise 6
1. Cancer and Bone development disease2. Expand the Functional status panel to see the details. The functional
status of the enzyme is ‘loss of function via point mutation’. 3. Still in the Functional status panel, expand the panel for the physical entity,
MMADHC mutants. Seven different mutations are listed.
Exercise 7
1. Using FDR corrected values, there are several pathways with the same value, statistically all are joint ‘best’ hit but if the number of matched entities is also considered, the top hit is Diseases of signal transduction.
2. 51, out of a total of 385 molecules 3. Roughly 0.13 (entities found divided by total entities in the pathway). Note
that this is NOT the same as the Entities ratio!4. 0.77 (225 reactions found divided by 291 total reactions in the pathway).
Note that this is NOT the same as the Reactions ratio!
Exercise 8
1. 83 proteins with expression data in the pathway. 2. 83 of 293 in the pathway, about 0.233. 6.8584. Fanconi anemia
Exercise 9
1. PLAT is yellow, indicating that it has been inferred to exist in Danio.2. HRG has no overlay, and as it is a protein, this indicates that it has not
been inferred to exist in Danio.3. Zn2+ is not coloured because it is a small molecule, species comparison is
not relevant. Other pathway objects that have no UniProt ID will also be uncoloured.
Exercise 10
1. NEO1 has 2 interactors.
2. 0.57, 3 times3. 34 interactors, 10 are displayed. Open the Setting slide-out panel on the
right to access the button for downloading all interactors for proteins in this pathway diagram.
4. Use the Close and clear interactors button on the Interactors control bar
Printable Key to Reactome Pathway Diagrams