Embed Size (px)
Citation preview

68Page Name
PROFILES
BUSINESS INSIGHTS ON-THE-FLY How Splunk Software Helped a Newly Merged Airline Take Off
Use Cases
• Improving Operational Efficiencies • Troubleshooting Services Delivery
PROFILES
69Business Insights On-The-Fly
Executive SummaryImagine that your company’s revenue depends on a com-
plex, ever-changing network of variable prices, discounts,
fees, regulatory requirements, taxes and international
politics. There is a finite amount of product that you can
sell, and the price of this product changes daily due to
competitive pressure. Imagine forces beyond your control
affecting the demand and supply of your product. A
volcano, a tornado, a hurricane, a snowstorm—literally
anywhere on the planet—and everything can change at
once. You have entered the world of the airline industry.
One Splunk customer, a major international airline, had
recently merged with another, forming a new airline with
over $5 billion in annual revenue. The newly formed airline
did not have visibility into which of its flights were earn-
ing money and which were losing money. It had routes
around the globe, with no insight into the best path to
profits. Worse yet, customer satisfaction was rapidly
plunging. The airline’s website, one of the most heavily
trafficked in the world, was losing customers—pages took
a long time to load and bookings would disappear right
before a potential passenger could confirm a purchase.
As a result, would-be passengers were taking flight—as in,
fleeing the site before booking—and the airline’s analytics
team could not determine why. Revenue was decreasing.
Market share was falling. The number of calls to customer
support—and the time it took staff to resolve problems—
were steadily increasing. All too often, the support team
could not mitigate a problem in time to save the booking.
Seats were sitting empty that could have been filled, un-
recoverable profit flying away forever. The airline needed
real-time, actionable visibility across multiple systems
in order to intercept problems before customers disem-
barked from the website, as well as insight into customer
behavior to maximize the value of each passenger trip.
Once the airline deployed Splunk software, it gained the
visibility into patterns of activity across airline-specific
logs and other homegrown machine data needed to
diagnose and repair the issues that were leading potential
passengers to leave the site. Because Splunk software can
follow transactions across virtually disconnected sys-
tems, it is now possible for the airline to answer questions
that impact customer satisfaction such as “Why did this
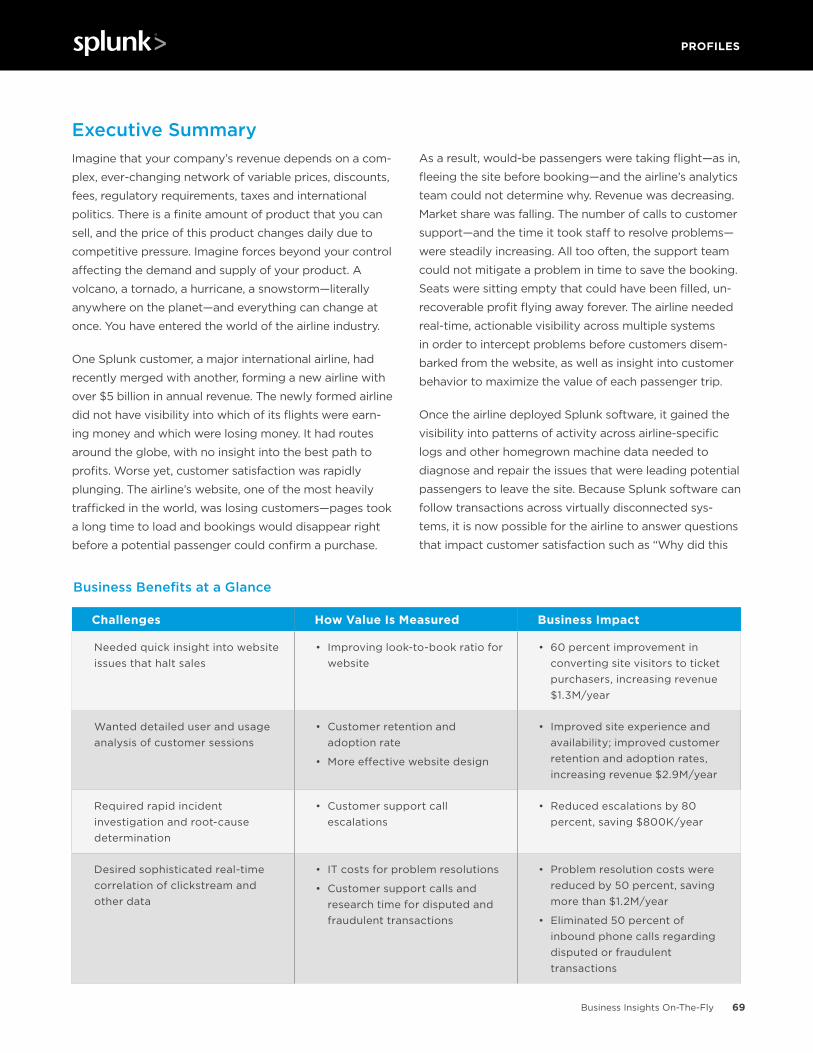
Challenges How Value Is Measured Business Impact
Needed quick insight into website issues that halt sales
• Improving look-to-book ratio for website
• 60 percent improvement in converting site visitors to ticket purchasers, increasing revenue $1.3M/year
Wanted detailed user and usage analysis of customer sessions
• Customer retention and adoption rate
• More effective website design
• Improved site experience and availability; improved customer retention and adoption rates, increasing revenue $2.9M/year
Required rapid incident investigation and root-cause determination
• Customer support call escalations
• Reduced escalations by 80 percent, saving $800K/year
Desired sophisticated real-time correlation of clickstream and other data
• IT costs for problem resolutions
• Customer support calls and research time for disputed and fraudulent transactions
• Problem resolution costs were reduced by 50 percent, saving more than $1.2M/year
• Eliminated 50 percent of inbound phone calls regarding disputed or fraudulent transactions
Business Benefits at a Glance

PROFILES
70Business Insights On-The-Fly
potential passenger drop off while a flight was in the
shopping cart, ready to be purchased?” and questions
that can lead to higher revenue such as “Which flights are
making the most profit, and how can we target potential
offers to passengers most likely to choose them?” As
a result, the airline received the operational visibility it
needed to resolve its website issues; moreover, it devel-
oped the tools to determine the most profitable flight
paths, and also to shape customer behavior toward the
most profitable choices. Splunk software enabled insights
to materialize from data that had been impossible to
understand, insights so critical to the airline that its initial
investment was recouped in the first four months. The
return on investment reached 300 percent by the end of
the first year.
Splunk software helped the customer gain:
• Digital customer experience insight. Because
Splunk dashboards provide visibility to see website
performance and troubleshoot issues in real time,
the airline analytics team continually improves the
site. Improved uptime and response time result in
increased user engagement. The airline has a pilot’s
view of its website infrastructure, improving the
monitoring of applications and critical processes,
and determining the fastest flight path to profits.
• Accelerated troubleshooting. Splunk dashboards
cut the cost of avoiding and resolving problems in
half, improving customer satisfaction and retention,
and leading to repeat sales. The airline’s analytics
team now receives real-time alerts for problems so
that they can intercept them before the client ever
sees the issues. In a business where customers can
change providers with the click of a mouse, real-time
corrections prevent millions in lost fares.
• Business analytics across the board. Splunk soft-
ware helped the airlines on both sides of the merger
get insights into critical aspects of the newly joined
entity. Splunk dashboards reveal which flights
make the most profit, which promotions work and
strategies that can increase revenue.
Unnecessary LossesIn most industries, if you miss an opportunity to sell
your product, you can recoup some of those losses.
Perhaps you can sell them at a discount or you can
give them away in a promotion. But there is no way to
recoup the value of an empty airline seat on a flight that
has already flown. And, a customer lost because of one
frustrating web experience could become a competitor’s
customer forever.
The newly merged airline had many customer issues
related to the merger: escalating support phone calls,
dropping revenue, rampant negative comments in social
media. But the airline had no way to diagnose what
was causing all of these problems.
The airline’s two major challenges revolved around
selling every seat. First, the airline didn’t want to lose
a sale that was sitting in a shopping cart because a
technical or user experience issue caused the purchaser
to give up. And secondly, the airline wanted to send
passengers to their destination along the path that was
the most profitable. But the airline had two problems:
• There were multiple front-ends, silos and systems behind the ordering process. The air-
line had multiple websites that were customized to
language preference. There were dozens of systems
recording web clicks and determining user path,
working with airline-specific data—too many places
to look to find out why customers were dropping off
the website.
• Lack of insight into flight profitability. When a
passenger enters “origin” and “destination” during
a booking process, the most profitable approach
for the airline is to offer fares that combine the best
revenue for the airline (good for profit margins) with
the best value for the passenger (good for passenger
retention and adoption). But fuel prices, local tariffs,
competitor prices and allowable fees shift daily in
this industry. The airline had no real-time visibility
into which flights were most profitable at a given
point in time.

PROFILES
71Business Insights On-The-Fly
It was clear that visitors were being successfully
attracted to the website, but leaving without purchas-
ing flights. The airline suspected that speed or stalled
processes might be the culprits, but the only way to
understand exactly what was happening was to analyze
log files from many different systems, including Sabre,
an airline industry system. The first goal was to identify
which process or step consumed most of the time of
the stalled transactions. But to do this, the airline would
have to see patterns from all of the different logs. This
was not only a technical issue, it was an organization-
al issue. Systems that interacted on the website had
totally unrelated purposes and totally unrelated log file
structures—and they were managed by different orga-
nizations within the airline. If one team needed the logs
of a system managed by another, it could take days to
get access to the appropriate logs. Even knowing how
to frame the question was difficult—how could you be
sure to get the logs you needed? And diagnosing any-
thing in real time—in time to prevent unsold passenger
seats? Impossible.
Enter SplunkWhen the team discovered that Splunk software could
ingest log file data from different systems, they re-
alized that the platform was the answer to their two
biggest challenges—optimizing the website to improve
customer retention and enhancing per-trip revenue.
They immediately signed up to explore a trial version
and realized that it was the answer to every merger’s
dilemma—how to make sense of disparate systems
with intersecting processes but disconnected log files.
After seeing what Splunk software could do, the airline
decided to move forward. Suddenly, due to Splunk’s
schema-on-the-fly, patterns were visible that had been
invisible before. No one had to wait days to see what
was happening in another part of a process.
Stopping the Flight of Website VisitorsSplunk software ingests log files from Sabre, log4j,
Apache, and other homegrown application and busi-
ness systems, and correlates similar fields between
different systems. With Splunk Enterprise, the air-
line’s analytics team ties together all of the pieces of
a transaction in a way that makes them visible. Now
they can measure total end-to-end transaction times
as well as times for a given segment.
Figures 1 and 2 show snippets of log files. The Sabre
log file (Figure 1) records one part of a customer session,
while a homegrown log file records another part. Without
Splunk software, making a connection between the two
files would be time consuming and labor-intensive. Mak-
ing a connection between thousands of such files at once,
in real time, would be impossible.
The customer can ingest dozens of logs like those shown
in Figures 1 and 2 into Splunk Enterprise to be indexed. By
correlating related fields so that all relevant information
about each customer session is available, the airline could
see the entire picture of what happened to customers
from the moment they first clicked on the site through the
time they purchased a flight—or left to visit a competitor.
Splunk dashboards also revealed big-picture information,
cutting through the details to reveal which issues were
causing the most customer frustrations.
Figure 1. Example Sabre log displays an error that prevents a successful purchase.
user= apid= reqid=hg03b201933367988741.667008 sid=xy246461367985631_J17IUKPUARExecuting Query: INSERT INTO booking_engine_var.sabre_vcr5_info(id_cashier, holding_client, pnr)
level=WARNdom=.SplunkAirlineCustomer.comlog_order=159script_name=cashier_notification.cgi url=/cgi-bin/cashier/notification.cgiuser= apid= reqid=hg03b201971367988741.667008sid=xy246461367985631_J17IUKPUARTicketer - getVcr5List – Missing holdingClient for the cashier [288746923]
Figure 2. Example custom log reveals the time it takes to complete a process.
For example, like most global companies, the airline
personalizes web experience based on language pref-
erence or point of origin. Until Splunk software arrived
at the airline, this factor was just another variable that
the airline suspected impacted customer experience,
but could not know for sure. For example, certain
marketing promotions seemed to work wonderfully on
one site, but not at all on another, even though other

PROFILES
72Business Insights On-The-Fly
research had revealed sufficient demand. After deploy-
ing Splunk software, the airline found that the high unsold
seat rate could not be fixed by tweaking the marketing
campaign; they found out that there was a remark-
ably different purchasing experience for customers
around the globe. Figure 3 illustrates that customers
in the process of purchasing a ticket spent many
minutes more on the transaction depending on the
website interface they accessed.
The color of the bars indicates trips with the same
origin-destination (OD). The dashboard illustrates
that passengers who purchased a ticket using the
German-based website spent six minutes on the pur-
chase, while passengers using the Spanish-based in-
terface to the website spent 17 minutes for the same
purchase. This helped the business understand a key
reason why certain websites were selling more tickets
than others, something that had seemed inexplicably
unrelated to marketing campaigns. The airline put
resources toward fixing the underperforming sites
immediately. Customer support calls began to drop
quickly and the customer experience between global-
ly customized websites improved.
It’s helpful to know where you have problems in your
customer’s experience, but what if you need more
information about why the problems are happening
in order to fix them? Figure 4, an “Unsold Passenger
Seats” dashboard, breaks down the reasons for delays
and unsold seats in even more detail. Now the airline
can understand the scope and causes of the problem
of unsold seats, organized by OD. This dashboard,
designed for the operations group, reveals reasons that
seats were left unsold in a way that makes it possible
to correct the problems systematically and strategically.
Here are some of the issues that Splunk dashboards
Figure 3. Time differences for similar trips based on geographic front-end.
revealed were causing customers to leave the site:
• Flight unavailable after clicking through all the
choices
• Dates selected early on in the process were in
fact not valid
• Website dropping customer mid-order
• Frequent stalls and hangs
Splunk dashboards revealed the impact, in unsold seats,
of website errors and issues. Once the team could see
where the issues were, they were able to triage on the
websites with the most expensive problems, turning
around the losses quickly in time to sell the empty
seats. Also because they had real-time insight to prob-
lems, they could alert the business to tie a particularly
empty route to a web-based promotion after fixing
issues that had stalled purchases of that flight. This
way, if a flight was undersold due to a web issue, the
business learned about it in time to quickly devise a
web-based promotion to sell the seats that would have
otherwise flown empty.
Learning the exact nature and location of the website
issues allowed the teams to drill down through Splunk
dashboards and events to discover root causes. Within
the first three months of deploying Splunk Enterprise,
dropped sessions had drastically decreased, and cus-
tomer satisfaction and retention had already improved.
By the end of the airline’s first year using Splunk soft-
ware, calls to support and expensive escalations had
dropped off by 80 percent. Airline business analysts
attributed over $3M in additional revenue to Splunk
software, just in the first year of use.
Figure 4. A comprehensive look at causes and impact of unsold passenger seats.

PROFILES
73Business Insights On-The-Fly
Solving the customer retention problem was the first
challenge that the customer addressed with Splunk
software. Now that the airline had made a significant
difference to this challenge, it wanted to address the
other challenge: discovering the most profitable routes
to promote.
Calculating Profit Margins Was Taxing For international flights and even some domestic ones,
each time an airliner lands or takes off, it is subject to
taxes and fees. Some of the fees are charged directly to
the passenger based on class of service, but others are
assessed to the airline directly. Some fees are based on
the airspace through which a flight passes; other fees
are assessed based on airports where the plane lands
and the time it stays at the airport. Rerouting connecting
flights through alternative airports can make the differ-
ence between profit and loss.
The airline realized that it could not figure out the
actual profit or cost from flights because the infor-
mation was not easy to see across a widely dispersed
and disparate infrastructure. The relevant information
changed frequently and came from different parts
of the organization. The airline’s executive staff didn’t
know which flights to promote and which flights to
consider rerouting or canceling. It was becoming
impossible to figure out how profits worked out per
flight segment, per consumer, per flight.
Once key IT staff was freed from endlessly fighting
support issues, they had the time to look at the problem
of taxes and regulations. To find out more about how
taxes and regulations impacted flights, web analytics
staff asked IT staff to ingest data into Splunk Enterprise
Figure 5. Splunk dashboard illustrating impact of fees and taxes on revenue per route.
that would give them specific details about the fees that
might apply to travel for the airline’s numerous routes.
In partnership, the two teams designed meaningful dash-
boards that explained where revenue was coming in at
every level of drilldown that the business needed. Figure 5
shows one Splunk dashboard that the airline created to
show the effects of taxes based on route traveled.
Business staff and business executives can now find out
the value of each trip, or see the big picture about the
true costs of channeling traffic through a specific hub.
This has helped them refine pricing and promotions,
so that the flights that appear first to a consumer
searching for fares on the website are the ones that are
the best value for both the airline and the consumer.
The airline can be more competitive and build loyalty
by offering better pricing to its customers.
Based on the most profitable route, the business now
designs promotions to persuade customers to select
routes that pay off for everyone—in real time, on the fly!
It is often a win-win, as customers may have no pref-
erence about the location of a stopover, but causing a
fuller flight to go to the stopover with fewer fees can
increase profits for the airline or make the price more
competitive for the passenger. The airline now has the
insight to set different fares, manage promotions that
maximize profits and increase revenues to the airline.
This also gives business executives at the highest level
the opportunity to add critical new variables to big
picture decisions. They can use insights from machine
data to optimize flight plans, determine new markets
to enter, new alliances to forge, and which offerings
to drop, refine or promote. This visibility has replaced
uncertainty with a clear competitive advantage.

About Splunk
Splunk Inc. (NASDAQ: SPLK) is the pioneer in analyzing machine data to deliver Operational Intelligence for security, IT and the business.
Splunk provides the enterprise machine data fabric that drives digital transformation. More than 12,000 customers in over 110 countries use
Splunk in the cloud and on-premises. Join millions of passionate users by trying a free trial of Splunk.
With Splunk, the Acquisition Took Off In this use case, we explored how Splunk software
brought clarity to the disparate systems that resulted
when two major airlines merged. When executives first
proposed the airline merger, they saw great promise
because it vastly, and literally, expanded the reach of
both airlines. The merger held the promise of simplifying
complex trips, for both domestic and international
travelers. But at first, before Splunk software entered
the picture, the merger only led to plunging customer
retention, rising support costs and lack of visibility
into the true cost of passenger trips. When Splunk
software was deployed to address these issues, the
synergy that the executives had originally envisioned
began to be a reality.
The airline realized that the value it obtained from
Splunk only increased the more data was ingested—the
amount of ingested data doubled after the first year.
Payback for the Splunk investment was calculated
at three months. Return on investment has already
reached $5 million in the first year of deployment, and
is projected to be over $15 million by the third year.
This use case demonstrated:
• Elimination of data silos. Because Splunk software
could index so many types of data without the
need to alter it, there was no need to phase out
systems just to get clarity. This made merging the
information technology departments much easier.
• Correlations drive analytics. Because Splunk
Enterprise correlates so many types of machine
data, the customer could follow transactions across
different systems to get a true understanding of
customer experience.
• Flexible analytics powered by a read-time schema. When the website logs were designed, they were
focused on capturing the information it took to ob-
tain a ticket and close a sale. But when the analysts
looked at the data through Splunk dashboards, they
could search it in novel ways that revealed insights.
• Value generation across multiple use cases. In addition to significantly improving MTTR and
customer website experience, Splunk Enterprise
allowed the airline to determine the best route to
increased profits.


![Profile of Sam Wei.pptx [Read-Only]](https://img.pdfslide.net/doc/110x75/625434e735a5ef5a03241d2b/profile-of-sam-weipptx-read-only.jpg)