Embed Size (px)
Citation preview

EVIDENCE OF THE IMPACT OF IMF FISCAL AND
MONETARY POLICIES ON THE CAPACITY TO ADDRESS HIV/AIDS AND TB CRISES IN KENYA
Research Team:
Julius Korir
Urbanus Kioko
Submitted to:
The Centre for Economic Governance and AIDS in Africa (CEGAA)
and
RESULTS Educational Fund (REF)
This study was supported by the Open Society Institute through REF, USA
June 2009
____________________________________________________________________________________________________________________________________________________________________________
EEvviiddeennccee ooff TThhee IImmppaacctt ooff IIMMFF FFiissccaall aanndd MMoonneettaarryy PPooll iicciieess oonn tthhee CCaappaaccii ttyy ttoo AAddddrreessss HHIIVV//AAIIDDSS aanndd TTBB CCrriisseess iinn KKeennyyaa
ii
ACKNOWLEDGEMENTS ..................................................................................................... v
ABBREVIATIONS AND ACRONYMS ............................................................................... vi
EXECUTIVE SUMMARY .................................................................................................... vii
CHAPTER ONE: INTRODUCTION ...................................................................................... 1
1.1 Background ....................................................................................................................... 1
3.1 Study Objectives ............................................................................................................... 2
1.1 Research Methodology .................................................................................................... 2
1.3.1 Scope of the Study .................................................................................................... 2
1.3.2 Population and sampling .......................................................................................... 2
1.3.3 Desk Review .............................................................................................................. 3
1.3.4 Development of Instrument and Data Collection Process ....................................... 3
1.3.5 Interviews .................................................................................................................. 4
1.3.6 Data Analysis ............................................................................................................. 4
1.2 Study Limitations .............................................................................................................. 4
CHAPTER TWO: THE SOCIO-ECONOMIC ENVIRONMENT .......................................... 5
2.1 Key Economic Performance Indicators ............................................................................ 5
2.1.1 Real GDP growth rate ............................................................................................... 5
2.1.2 Budget Deficits as a percentage of GDP ................................................................... 6
Figure 2.1: Budget deficit as a percentage of GDP 1963-2006 ............................................... 6
2.1.3 Public Debt ................................................................................................................ 7
2.2 Poverty in Kenya ............................................................................................................... 8
Figure 2.2: Poverty trends in Kenya......................................................................................... 9
2.3 Kenyan Health Sector ....................................................................................................... 9
2.3.1 Overview of the public health sector........................................................................ 9
2.3.2 HIV/AIDS in Kenya ................................................................................................... 10
CHAPTER THREE: STUDY FINDINGS ............................................................................. 13
3.1 Overview of IMF policies in Kenya ................................................................................. 13
3.1.1 Introduction ............................................................................................................. 13
3.1.2 The Trust Fund......................................................................................................... 13
3.1.3 Enhanced Structural Adjustment Facility (ESAF) ..................................................... 14
3.1.4 Poverty Reduction and Growth Facility (PRGF) ....................................................... 15
3.1.5 Recent Developments with the PRGF in Kenya ....................................................... 17

____________________________________________________________________________________________________________________________________________________________________________
EEvviiddeennccee ooff TThhee IImmppaacctt ooff IIMMFF FFiissccaall aanndd MMoonneettaarryy PPooll iicciieess oonn tthhee CCaappaaccii ttyy ttoo AAddddrreessss HHIIVV//AAIIDDSS aanndd TTBB CCrriisseess iinn KKeennyyaa
iii
3.2 Process of Formulation of the IMF Policies in Kenya ..................................................... 24
3.3 Implementation of the IMF- Policies through Budgeting Process ................................. 25
3.3.1 Introduction ............................................................................................................. 25
3.3.2 Major Players Involved In the Budget Process ........................................................ 25
3.4 The budgeting process ................................................................................................... 27
Figure 3.1: MTEF process ...................................................................................................... 27
3.5 Transparency of IMF Program Policies ........................................................................... 30
3.6 Trends in Government Health Budget Expenditure ....................................................... 32
3.7 Trend in HIV/AIDS Expenditure ...................................................................................... 34
Figure 4.1: Contribution of HIV/AIDS funds by source (2004/2005 –006/07) ..................... 36
3.8 Estimated Resource Requirements for HIV/AIDS Response .......................................... 36
3.8.1 Budget Ceilings ........................................................................................................ 38
3.8.2 Wage Bill Ceilings .................................................................................................... 42
3.8.3 Civil Service Reform Programme ............................................................................. 43
CHAPTER FOUR: CONNECTING THE DOTS: HOW IMF POLICIES IMPACT GOVERNEMENT
SPENDING ON HEALTH, HIV/AIDS AND TB ................................................................................ 45
CHAPTER FIVE: CONCLUSION AND RECOMMENDATIONS ........................................................ 51
4.1 Conclusion ...................................................................................................................... 51
4.2 Recommendations ......................................................................................................... 52
REFERENCES ............................................................................................................................... 54
____________________________________________________________________________________________________________________________________________________________________________
EEvviiddeennccee ooff TThhee IImmppaacctt ooff IIMMFF FFiissccaall aanndd MMoonneettaarryy PPooll iicciieess oonn tthhee CCaappaaccii ttyy ttoo AAddddrreessss HHIIVV//AAIIDDSS aanndd TTBB CCrriisseess iinn KKeennyyaa
iv
LIST OF TABLES
Table 1.1: Sampled organizations ................................................................................................... 3
Table 2.1: Selected key economic indicators-Kenya....................................................................... 5
Table 2.2: Trend in stock of public debt (Kshs billion) .................................................................... 7
Table 2.2: continued ....................................................................................................................... 8
Table 3.1 Fiscal deficits in Kenya................................................................................................... 17
Table 3.2 Net Domestic Assets (NDA) and Net International Reserves (NIR) in Kenya ................ 19
Table 3.3 Monetary Policy Indicators in Kenya ............................................................................ 20
3.1.6 Summary of the IMF Policies in Kenya................................................................................. 22
Table 3.4 Content of IMF Policies in Kenya .................................................................................. 22
Table 3.5: Ministry of health actual expenditure ........................................................................ 33
Table 3.6: HIV/ AIDS expenditures by specific sources ................................................................ 34
Table 3.7: Expenditure by major sources of funding .................................................................... 35
Table 3.8: Estimated financing requirements (Kshs. millions) ..................................................... 36
Table 3.8: Estimated financing requirements (Kshs. millions) continued .................................... 38
Table 3.9: Sectoral budget ceilings ............................................................................................... 40
Table 3.10: Absolute and percent wage bill ceilings 2006/07 ..................................................... 42
LIST OF FIGURES Figure 2.1: Budget deficit as a percentage of GDP 1963-2006 ................................................. 6
Figure 3.1: MTEF process ........................................................................................................ 27
Figure 4.1: Contribution of HIV/AIDS funds by source (2004/2005 –006/07) ....................... 36

____________________________________________________________________________________________________________________________________________________________________________
EEvviiddeennccee ooff TThhee IImmppaacctt ooff IIMMFF FFiissccaall aanndd MMoonneettaarryy PPooll iicciieess oonn tthhee CCaappaaccii ttyy ttoo AAddddrreessss HHIIVV//AAIIDDSS aanndd TTBB CCrriisseess iinn KKeennyyaa
v
ACKNOWLEDGEMENTS
Assistance received from several people made the compilation of this report possible. The
research team would like to thank all of the key informants from the Ministries of Finance,
Treasury, Planning and National Development and Health. In particular, the team is indebted to
Department of External Affairs, which provided invaluable insights into IMF policies and
macroeconomic policy-making process in Kenya. We would also like to express the contribution
of key contact people from the World Bank, the IMF and civil society organisations. The
collaboration of all of these respondents made the data collection exercise so much easier.
Also acknowledged is the assistance of ActionAid Kenya for making available some of the IMF
reports which provided useful insight on IMF policies in Kenya. We also wish to extend
appreciation to Dr. Urbanus Kioko and Teresa Guthrie from CEGAA for their comments and
suggestions.
The report draws heavily on the work of a collection of background papers undertaken to
improve the evidence of the effects of IMF policies on the public health sector in Kenya.
____________________________________________________________________________________________________________________________________________________________________________
EEvviiddeennccee ooff TThhee IImmppaacctt ooff IIMMFF FFiissccaall aanndd MMoonneettaarryy PPooll iicciieess oonn tthhee CCaappaaccii ttyy ttoo AAddddrreessss HHIIVV//AAIIDDSS aanndd TTBB CCrriisseess iinn KKeennyyaa
vi
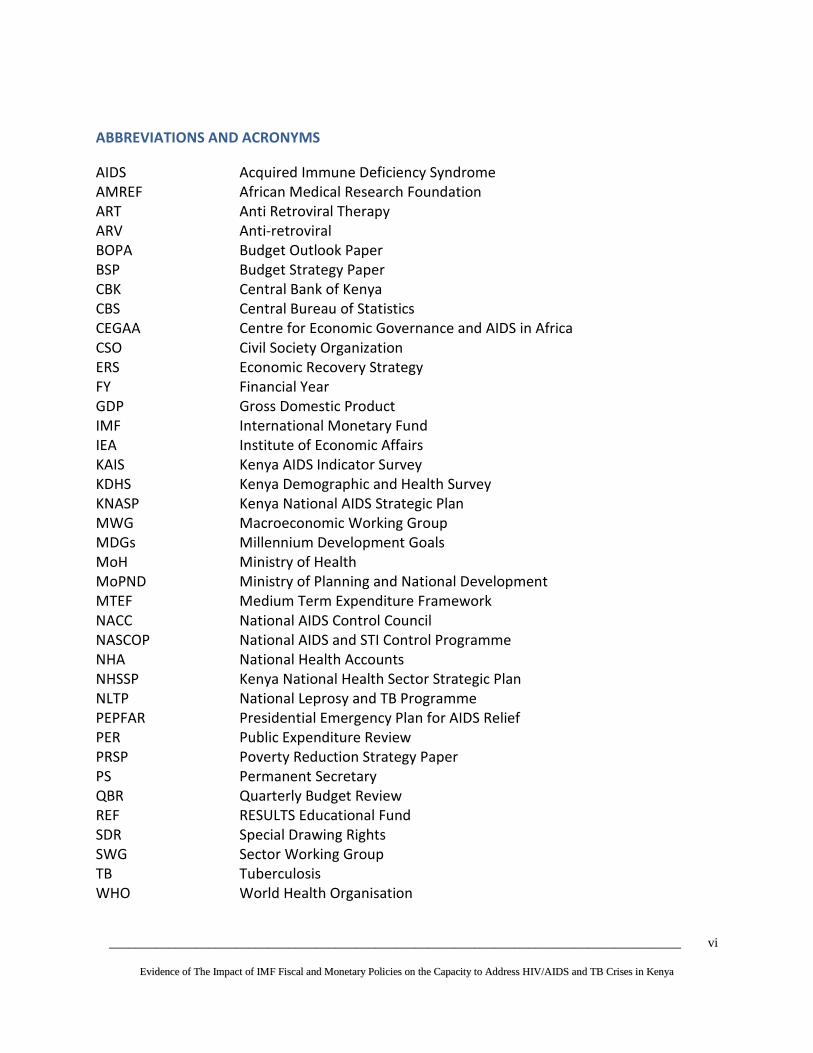
ABBREVIATIONS AND ACRONYMS
AIDS Acquired Immune Deficiency Syndrome
AMREF African Medical Research Foundation
ART Anti Retroviral Therapy
ARV Anti-retroviral
BOPA Budget Outlook Paper
BSP Budget Strategy Paper
CBK Central Bank of Kenya
CBS Central Bureau of Statistics
CEGAA Centre for Economic Governance and AIDS in Africa
CSO Civil Society Organization
ERS Economic Recovery Strategy
FY Financial Year
GDP Gross Domestic Product
IMF International Monetary Fund
IEA Institute of Economic Affairs
KAIS Kenya AIDS Indicator Survey
KDHS Kenya Demographic and Health Survey
KNASP Kenya National AIDS Strategic Plan
MWG Macroeconomic Working Group
MDGs Millennium Development Goals
MoH Ministry of Health
MoPND Ministry of Planning and National Development
MTEF Medium Term Expenditure Framework
NACC National AIDS Control Council
NASCOP National AIDS and STI Control Programme
NHA National Health Accounts
NHSSP Kenya National Health Sector Strategic Plan
NLTP National Leprosy and TB Programme
PEPFAR Presidential Emergency Plan for AIDS Relief
PER Public Expenditure Review
PRSP Poverty Reduction Strategy Paper
PS Permanent Secretary
QBR Quarterly Budget Review
REF RESULTS Educational Fund
SDR Special Drawing Rights
SWG Sector Working Group
TB Tuberculosis
WHO World Health Organisation

____________________________________________________________________________________________________________________________________________________________________________
EEvviiddeennccee ooff TThhee IImmppaacctt ooff IIMMFF FFiissccaall aanndd MMoonneettaarryy PPooll iicciieess oonn tthhee CCaappaaccii ttyy ttoo AAddddrreessss HHIIVV//AAIIDDSS aanndd TTBB CCrriisseess iinn KKeennyyaa
vii
EXECUTIVE SUMMARY
Introduction
This report is part of a multi-country assessment of the impact of International Monetary Fund
(IMF) fiscal and monetary policies on the capacity of governments to address the HIV/AIDS and
tuberculosis (TB) crises. It has been argued that the macroeconomic policies endorsed by the
IMF limit the options of developing countries to scale up public spending in order to meet
critical development challenges because they set restrictive ceilings on the national budget.
While the IMF counters these claims by arguing that the formulation and implementation of
macroeconomic policies are the responsibility of the government, health policy makers point
out that the budget ceiling set jointly by the IMF and the government is a key constraint
preventing the Government from investing more in health.
Recent studies have expressed concern that restrictive fiscal and monetary policies imposed on
developing countries by the International Monetary Fund (IMF) can impede the response to TB,
HIV/AIDS and other major health emergencies in Africa. With an eye toward reducing fiscal
deficits, inflation and other macroeconomic indicators below specified limits, the IMF promotes
conditionalities with countries receiving IMF financing. These conditionalities, which translate
into budget and wage bill ceilings, ultimately restrict health spending and public investment in
health, and thus undermine the country’s response to HIV/AIDS and TB. This study therefore
explores the impact of IMF policies on the Government of Kenya’s ability to respond with
increased budgetary allocations for health in general, with consequences for responding to
HIV/AIDS and TB.
This report explores previous and current IMF macroeconomic policies in Kenya’s IMF
programs, with a specific examination of the fiscal and monetary policy targets as they impact
national budgets. The report concludes that a significant scaling-up of public spending and
investment on public health is not possible under the current framework, which is designed and
formulated to constrain spending toward maintaining stabilization. The current macroeconomic
framework is therefore at odds with the internationally agreed goals of scaling up spending to
meet the MDGs and fight HIV/AIDS and TB.
The report also identifies and critically reviews several underlying assumptions of the policies in
the current neoliberal macroeconomic framework, finding many to be misguided and/or not
supported by the empirical literature. It is suggested that each of these assumptions and
policies informing the macroeconomic framework in Kenya be revisited and reconsidered by a
larger group of public stakeholders.

____________________________________________________________________________________________________________________________________________________________________________
EEvviiddeennccee ooff TThhee IImmppaacctt ooff IIMMFF FFiissccaall aanndd MMoonneettaarryy PPooll iicciieess oonn tthhee CCaappaaccii ttyy ttoo AAddddrreessss HHIIVV//AAIIDDSS aanndd TTBB CCrriisseess iinn KKeennyyaa
viii
The report finds that the current macroeconomic targets and conditions are set in a
nontransparent, non-participatory and unaccountable manner that sidelines key ministry of
health staff, key legislative committees and other key public stakeholders. Crucial decisions
affecting future growth and employment and future budgets are made behind closed doors
between the finance ministry and IMF without an informed public discussion of possible
alternative scenarios and their potential trade-offs.
The specific objectives of this study were to: 1) review the content, process and transparency of
the IMF policies under ESAF and PRGF loan programs; 2) identify the key stakeholders in the
process of accepting policies and conditionalities, their influence and power; 3) identify recent
trends in the total public (domestic) health expenditure; 4) more specifically identify trends in
the public (domestic) expenditure for TB and HIV/AIDS; 5) identify trends in the public
(domestic) expenditure for personnel for health, TB and HIV/AIDS, 6) identify trends in the
number of health professionals working in the health sector, in TB and HIV/AIDS; and 7) to
consider trends in accessing TB and HIV/AIDS treatment services.
This study combined both qualitative and quantitative data collection research methods to
examine how IMF polices determine the limits of national budget sizes, and consequently, their
impact on health funding and the Government’s response to the HIV/AIDS and TB crises in
Kenya. Information on IMF policies was obtained from relevant documents through a review of
existing documents and interviews with key officials. In addition, the study comprised budget
analysis through examination of recent national budget documents, the medium-term
expenditure frameworks (MTEFs), the public expenditure reviews (PERs), expenditure records
and face-to-face interviews with key informants. The results of analysis of the quantitative data
were used to make general observations on the impact of IMF policies in Kenya, with the
qualitative information providing a backup.
Overall, the report calls for a broad public review and reconsideration of the macroeconomic
framework in Kenya, its policies and their underlying assumptions. The costs and benefits of a
range of other possible more expansionary policy options for increasing public spending must
be considered, and must be done in an open, inclusive and transparent process that involves a
much broader group of public stakeholders.
Findings
• A major problem is that the overall policy priority of the current macroeconomic
framework is stabilization, not scaling-up. The framework is designed for constraining
public spending. It is not designed to enable the large scaling-up of public expenditure
envisaged by the MDGs.
• Specifically, the restrictive fiscal and monetary policy targets and the neoliberal reform
towards adoption of market-based interest rates, have greatly constrained the ability of

____________________________________________________________________________________________________________________________________________________________________________
EEvviiddeennccee ooff TThhee IImmppaacctt ooff IIMMFF FFiissccaall aanndd MMoonneettaarryy PPooll iicciieess oonn tthhee CCaappaaccii ttyy ttoo AAddddrreessss HHIIVV//AAIIDDSS aanndd TTBB CCrriisseess iinn KKeennyyaa
ix
the Government to engage in the more expansionary fiscal and monetary policy options
that will be required for any major scaling-up scenario.
• Such targets and policies in the current macroeconomic framework unduly limit the
Government’s potential fiscal space, by constraining the overall national resource
envelope. This in turn affects adversely allocations to the different ministries, including
the health ministry.
• The retrenchment in the public service in the 1990s, coupled with a freeze on
employment that has persisted to date, have also affected adversely the health sector.
Despite recent increases in health spending, the overall budget constraint stemming
from the policy targets of the macroeconomic framework continues to prevent the
Government from being able to fill personnel shortages due to lack financial resources
and the wage bill ceiling policy, which constrains wages at 6.5 percent of GDP. The
continuing scarcity of critical public human resources for health has largely contributed
to the ministry’s inability to fully implement effective HIV/AIDS and TB interventions.
• Civil society consultations for inputs into the PRSP documents do not include or permit
discussions about the macroeconomic framework.
• The policy decisions about the macroeconomic framework continue to be decided
elsewhere, confidentially and without broad public participation, scrutiny or
accountability.
Recommendations
• The process of deciding the policy priorities for Kenya’s macroeconomic framework
should be subject to a broader national public debate and discussion involving
parliament, academia, civil society, labor and the domestic media.
• Additionally, setting of specific fiscal and monetary targets should be made more
transparent and involve broader public discussions of the costs and benefits of
alternative policy options.
• The Finance Ministry and others should work with the IMF and other donors to open the
discussion to consider more alternative policy options, with the view to allow flexibility
in deficit financing geared specifically to mobilize more resources for the health sector.
• Kenya’s parliamentarians need to play a more active role in urging the Government to
demand the removal of all policy conditionalities in any future IMF lending
arrangements.
• Civil society in Kenya should work with economists and civil society networks in other
donor countries to collectively call on governments to take steps at the IMF Executive
Board level to change the current IMF policies on fiscal and monetary targets.
• CSOs must work to invest in macroeconomic literacy training efforts that are inclusive of
alternative ideas and involve multiple stakeholders such as parliamentarians, labor,
domestic businesses and the media.
____________________________________________________________________________________________________________________________________________________________________________
EEvviiddeennccee ooff TThhee IImmppaacctt ooff IIMMFF FFiissccaall aanndd MMoonneettaarryy PPooll iicciieess oonn tthhee CCaappaaccii ttyy ttoo AAddddrreessss HHIIVV//AAIIDDSS aanndd TTBB CCrriisseess iinn KKeennyyaa
1
CHAPTER ONE: INTRODUCTION
1.1 Background
Over two decades of evidence demonstrates that the restrictive fiscal and monetary policies
the International Monetary Fund has promoted in developing countries can limit government
spending. With an eye toward reducing fiscal deficits, inflation and other macroeconomic
indicators below specified limits, the IMF promotes conditionalities with countries participating
in an IMF program. These conditionalities, translated into budget and wage bill ceilings, can
ultimately restrict health spending and thus undermine the country’s response to HIV/AIDS and
TB, the achievement of the Millennium Development Goals (MDGs), and the number of, and
remuneration for, public sector health workers.
The IMF’s influence on health policy, in regards to developing countries in Africa, has been well
linked to Structural Adjustment Programs (SAPs). SAPs are a combination of structural reforms
that require that governments in developing countries implement a number of fiscal and
monetary policies as conditions for receiving loans or bilateral aid. Kenya’s involvement with
the Fund dates back to the early 1980s when the government faced a serious financial crisis
created by terms of trade shocks and lack of fiscal discipline. This made it impossible for the
government to finance many of its development policies. To meet its financial obligations, the
government sought financial assistance from the IMF. The disbursement of the funds was tied,
however, to the government’s adoption of aid conditionalities embodied in the SAPs. Through
the aid conditionalities by the IMF, the World Bank also required the government to implement
reforms focusing on reducing budget deficits, reducing domestic borrowing by the government,
increasing foreign reserves, and reducing inflation to a single digit (World Bank, 1994).
It has been argued that the macroeconomic policies endorsed by the IMF limit the ability of
developing countries to implement planned programs because a large proportion of their
budget is drained by debt repayments. Many more countries operate under macroeconomic
policies that set rigid spending ceilings for the social sectors and cannot accommodate minor
inflation. While the IMF counters these claims by arguing that the formulation and
implementation of macroeconomic policies are the responsibility of the government, health
policy makers point out that budget ceilings set jointly by the IMF and the government is a key
limiting factor for adequately investing in health. They further argue that macroeconomic
targets and conditions are set in a non-transparent and undemocratic manner and that the
process sidelines Ministry of Health staff while decisions are made without an informed
discussion of alternative scenarios and their trade-offs.
Thus the restrictive nature of the fiscal and monetary policies and the stringent conditionalities
that come with them negatively impact the capacity of governments in developing countries to
invest adequately in health. In Kenya, for example, the IMF blocked the implementation of a

____________________________________________________________________________________________________________________________________________________________________________
EEvviiddeennccee ooff TThhee IImmppaacctt ooff IIMMFF FFiissccaall aanndd MMoonneettaarryy PPooll iicciieess oonn tthhee CCaappaaccii ttyy ttoo AAddddrreessss HHIIVV//AAIIDDSS aanndd TTBB CCrriisseess iinn KKeennyyaa
2
social health insurance scheme intended to mobilize resources for health sector development
(CGD 2007). Furthermore, restrictions on the hiring of health workers have created a situation
where thousands of trained nurses and other health workers remain unemployed, despite a
health worker shortage across all health programs. In a 2006 meeting with REF and US
Congressional staff, the Minister of Health of Kenya at the time cited IMF-led wage bill
restrictions as a major impediment to the hiring of nurses.
This study therefore provides evidence of the impact of IMF policies on the government of
Kenya’s ability to scale up investment in health and thereby impact the HIV/AIDS and TB crises.
3.1 Study Objectives
This study set out to:
• Review the content, process and transparency of the IMF PRGF policies,
• Identify the key stakeholders in the process of accepting policies and conditionalities,
their influence and power,
• Identify trends in the total public (domestic) health expenditure,
• Identify trends in the public (domestic) expenditure for TB and HIV/AIDS,
• Identify trends in the public (domestic) expenditure for personnel for health, TB and
HIV/AIDS,
• Identify trends the number of health professionals working in the health sector, in TB
and HIV/AIDS,
• Consider trends in accessing TB and HIV/AIDS treatment services, and
• Identify other effects of IMF policies on country ability to respond to TB and HIV/AIDS
1.1 Research Methodology
1.3.1 Scope of the Study
The study focuses on IMF policies under the Enhanced Structural Adjustment Facility (ESAF) and
the Poverty Reduction and Growth Facility (PRGF) in Kenya. It provides a general description of
how policies relevant to health, HIV/AIDS and TB are formulated, the content and context in
which they were formulated, a description of the different stakeholders involved in the policy
process and the extent of their influence in the policy formulation process. The study focuses
only on public health, HIV/AIDS and TB allocations as indicated in budget documents and other
relevant documents; expenditure trends of public personnel for health, TB and HIV/AIDS as
indicated in budget documents or other relevant documents; and trends in the number of
personnel working in the health sector.
1.3.2 Population and sampling
____________________________________________________________________________________________________________________________________________________________________________
EEvviiddeennccee ooff TThhee IImmppaacctt ooff IIMMFF FFiissccaall aanndd MMoonneettaarryy PPooll iicciieess oonn tthhee CCaappaaccii ttyy ttoo AAddddrreessss HHIIVV//AAIIDDSS aanndd TTBB CCrriisseess iinn KKeennyyaa
3
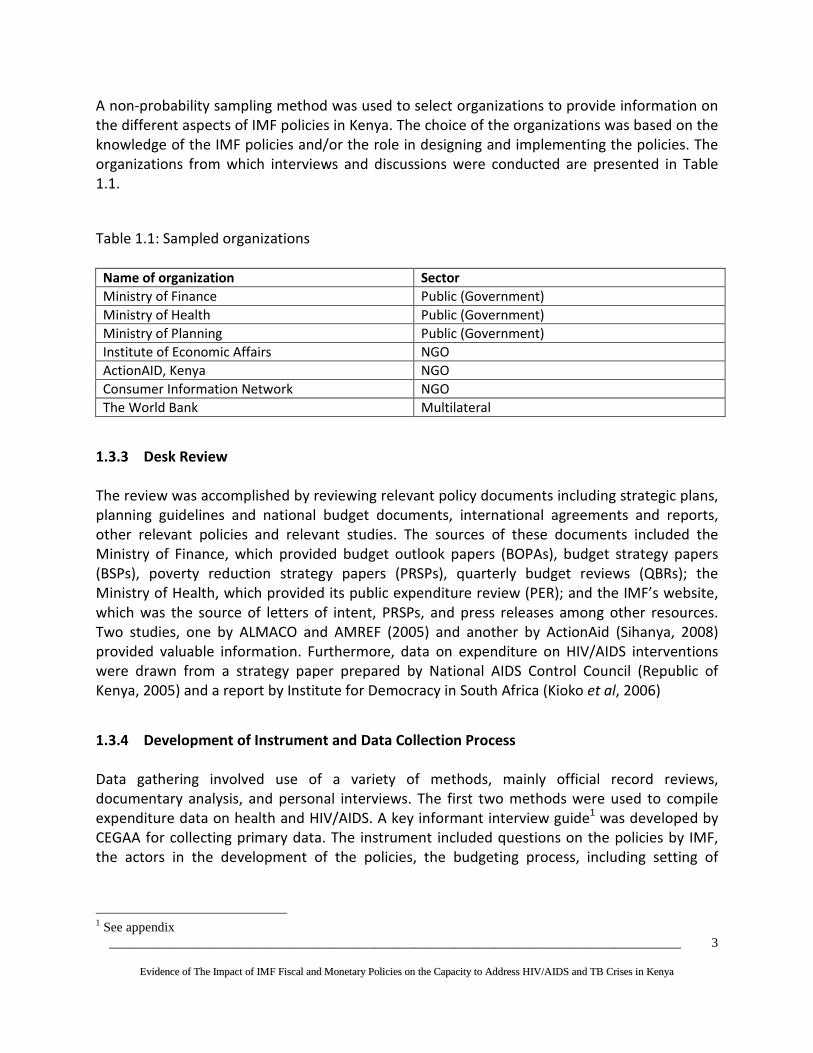
A non-probability sampling method was used to select organizations to provide information on
the different aspects of IMF policies in Kenya. The choice of the organizations was based on the
knowledge of the IMF policies and/or the role in designing and implementing the policies. The
organizations from which interviews and discussions were conducted are presented in Table
1.1.
Table 1.1: Sampled organizations
Name of organization Sector
Ministry of Finance Public (Government)
Ministry of Health Public (Government)
Ministry of Planning Public (Government)
Institute of Economic Affairs NGO
ActionAID, Kenya NGO
Consumer Information Network NGO
The World Bank Multilateral
1.3.3 Desk Review
The review was accomplished by reviewing relevant policy documents including strategic plans,
planning guidelines and national budget documents, international agreements and reports,
other relevant policies and relevant studies. The sources of these documents included the
Ministry of Finance, which provided budget outlook papers (BOPAs), budget strategy papers
(BSPs), poverty reduction strategy papers (PRSPs), quarterly budget reviews (QBRs); the
Ministry of Health, which provided its public expenditure review (PER); and the IMF’s website,
which was the source of letters of intent, PRSPs, and press releases among other resources.
Two studies, one by ALMACO and AMREF (2005) and another by ActionAid (Sihanya, 2008)
provided valuable information. Furthermore, data on expenditure on HIV/AIDS interventions
were drawn from a strategy paper prepared by National AIDS Control Council (Republic of
Kenya, 2005) and a report by Institute for Democracy in South Africa (Kioko et al, 2006)
1.3.4 Development of Instrument and Data Collection Process
Data gathering involved use of a variety of methods, mainly official record reviews,
documentary analysis, and personal interviews. The first two methods were used to compile
expenditure data on health and HIV/AIDS. A key informant interview guide1 was developed by
CEGAA for collecting primary data. The instrument included questions on the policies by IMF,
the actors in the development of the policies, the budgeting process, including setting of
1 See appendix

____________________________________________________________________________________________________________________________________________________________________________
EEvviiddeennccee ooff TThhee IImmppaacctt ooff IIMMFF FFiissccaall aanndd MMoonneettaarryy PPooll iicciieess oonn tthhee CCaappaaccii ttyy ttoo AAddddrreessss HHIIVV//AAIIDDSS aanndd TTBB CCrriisseess iinn KKeennyyaa
4
budget and wage ceilings, and perceived impact of the policies on the health sector, with
specific reference to health, HIV/AIDS and TB.
1.3.5 Interviews
The interviews were aimed at obtaining information on the content of IMF policies, the role of
various stakeholders in policy formulation and in the decision-making process on budget
ceilings. The questionnaires/interview guides were sent to the selected interviewees in
advance. After this, the consultants visited the interviewees and held discussions with the key
informant in the selected organizations.
1.3.6 Data Analysis
The qualitative data generated from the interview guide were summarized according to the
focal areas of the study: the roles of various actors, e.g. IMF, World Bank, WHO, civil society
and development partners in the policy formulation process, wage ceilings, the impact of IMF
policies on government spending on health, HIV/AIDS and TB.
1.2 Study Limitations
The main limitation of the study is the non-response from some key informants for varying
reasons, such as being out of the country or office, delayed responses, and deferring to senior
staff. Another limitation relates to the lack of information about IMF policies and processes,
especially from many CSO informants and the health personnel working in the TB and HIV/AIDS
programs. The data on health personnel are also not reported by specific programmatic areas.

____________________________________________________________________________________________________________________________________________________________________________
EEvviiddeennccee ooff TThhee IImmppaacctt ooff IIMMFF FFiissccaall aanndd MMoonneettaarryy PPooll iicciieess oonn tthhee CCaappaaccii ttyy ttoo AAddddrreessss HHIIVV//AAIIDDSS aanndd TTBB CCrriisseess iinn KKeennyyaa
5
CHAPTER TWO: THE SOCIO-ECONOMIC ENVIRONMENT
2.1 Key Economic Performance Indicators
2.1.1 Real GDP growth rate
A January 2009 review by Fitch Ratings gave Kenya a stable long-term outlook. The impact of
the post-election violence has been compounded by a global economic recession, which will
slow Kenya's recovery by reducing non-regional exports, tourism, remittances and capital
flows for much needed investment. After a contraction by 1% year-on-year in the first quarter
of 2008, growth recovered to 3.4% in the second quarter before easing to 2.1% in the third
quarter. Fitch estimates that Kenya's growth slowed to around just 2% for 2008 as a whole,
down from 7% in 2007. Fitch Ratings, nonetheless, believes that Kenyan growth will improve in
2009, supported by strong regional and domestic demand and a recovery of agriculture to
around 4 to 5% (Fitch, 2009).
Historically, Kenya’s economy recorded good performance in terms of economic growth in the
1960s and early 1970s, averaging 6.6% annual growth in GDP during 1964-73. The rapid
economic growth was attributed to implementation of public investment, encouragement of
smallholder agricultural production, and incentives for private, often foreign, industrial
investment. However, the impressive GDP growth was short-lived. The growth rate recorded a
downward trend from 1974 to 1995 due to inappropriate agricultural policies, inadequate
credit to agriculture, poor international terms of trade, import substitution policy, rising oil
prices, lack of export incentives, tight import controls, and foreign exchange controls.
Thereafter, the economy entered a period of slow or stagnant growth. However, in 2000 GDP
growth was negative. Under the guidance of the Economic Recovery Strategy for Wealth and
Employment Creation, the Kenyan economy recovered and resumed the path to rapid growth
(Republic of Kenya, 2007). The economy registered a growth rate of 2.8% in 2003, 4.3% in 2004,
5.0% in 2005 and 6.7% in 2006. The 2008 economic survey indicates that the estimated growth
rate in 2007 was 7%.
Table 2.1: Selected key economic indicators-Kenya
Indicator 2001 2002 2003 2004 2005
GDP growth rates 4.5 0.6 3 4.9 5.8
GDP at market prices (Kshs billion) 1,020 1,022.20 1,136.30 1,282.50 1,415.20
Wage employment ('000) 1,677.10 1,699.70 1,727.30 1,763.70 1,807.70
GDP per capita (current) Kshs) 33,767 32,434 35,327 39,091 42,313
GDP per capita (constant) Kshs, 2001=100) 33,767 32,549 32,845 33,764 35,045
GDP per capita (constant) US$, 2001=100) 450 433 437 450 467
GNP (Kshs Billion) 1,010.50 1,010.90 1,129.60 1,272.50 1,406.90
Inflation rate (% change in CPI) 5.80 2.00 9.80 11.30 10.30

____________________________________________________________________________________________________________________________________________________________________________
EEvviiddeennccee ooff TThhee IImmppaacctt ooff IIMMFF FFiissccaall aanndd MMoonneettaarryy PPooll iicciieess oonn tthhee CCaappaaccii ttyy ttoo AAddddrreessss HHIIVV//AAIIDDSS aanndd TTBB CCrriisseess iinn KKeennyyaa
6
Source: Economic Surveys, 2006 & 2007
2.1.2 Budget Deficits as a percentage of GDP
According to the January 2008 report by Fitch Ratings, public finances in Kenya have proven
resilient to the country's political crisis. The fiscal deficit in FY08 (July 2007-June 2008) came in
at 3.5% of GDP, below the projected 5.3% of GDP, reflecting strong revenue growth in the lead-
up to the crisis, while reduced capital spending offset increased spending on security. The
public debt ratio continued to decline to 43% of GDP from as high as 63% in FY04, although this
is higher than the 29% of GDP median for the 'B' category, where many countries, unlike Kenya,
have been beneficiaries of debt relief. Deficits are projected to widen due to increased
infrastructure investment, which is positive for longer-term creditworthiness but means that
debt ratios will decline more gradually going forward. In FY09 the planned Eurobond issue is
unlikely to go ahead due to tight global credit markets. This will delay some planned
infrastructure spending, and lower the deficit to around 4% of GDP compared with a budgeted
5.5% (Fitch, 2009).
Historically, the government of Kenya has run budget deficits since independence (see Figure
2.1). Budget deficits result from expenditures falling short of government revenues. This
shortfall is attributed to limited budgetary resources brought about by low economic
performance, among other causes. A significant proportion of budgetary resources are
internally generated through a myriad of taxes, with a huge proportion of financing devoted to
recurrent expenditures. Development or capital expenditures have over the years been funded
mainly by donors. The budget deficit is one of the variables influenced by IMF program policies.
Figure 2.1: Budget deficit as a percentage of GDP 1963-2006
Source: International Financial Statistics, and Economic surveys.
-10.0%
-8.0%
-6.0%
-4.0%
-2.0%
0.0%
2.0%1963
1965
1967
1969
1971
1973
1975
1977
1979
1981
1983
1985
1987
1989
1991
1993
1995
1997
1999
2001
2003
2005

____________________________________________________________________________________________________________________________________________________________________________
EEvviiddeennccee ooff TThhee IImmppaacctt ooff IIMMFF FFiissccaall aanndd MMoonneettaarryy PPooll iicciieess oonn tthhee CCaappaaccii ttyy ttoo AAddddrreessss HHIIVV//AAIIDDSS aanndd TTBB CCrriisseess iinn KKeennyyaa
7
The instability in the budget deficit shown in Figure 2.1 can be attributed to several factors,
including internal and external shocks, which sometimes require government intervention
through fiscal policy. Budget deficits have contributed to the weak economic performance, by
accumulating the high public debt and the associated high interest rates (Republic of Kenya,
2003b).
2.1.3 Public Debt
Table 2.2 shows that the stock of public debt has been increasing over the years in absolute
terms. The total stock of public debt increased from Kshs 466 billion in June 1996 to Kshs 801
billion in June 2007. As a percentage of GDP it increased from about 68% in June 1996 to about
79% in June 1999. Republic of Kenya (2007) indicates that the external debt fell from US$ 6,025
million in 1996 to US$ 5,701 million in 2005. Table 2.2 also shows the percentage of domestic
debt in the total public debt has been generally increasing over the years. For instance, it
increased from 26% in June 1996 to 51% in June 2007. As a percentage of GDP, total debt
declined from 68% in 1996 to 44% in 2007. The accumulation of debts was one of the causes of
economic crises that necessitated the involvement of the IMF.
Table 2.2: Trend in stock of public debt (Kshs billion)
Jun-96 Jun-97 Jun-98 Jun-99 Jun-00 07-Jun
EXTERNAL DEBT 346 308 323 408 396 397
Bilateral 128 114 108 148 139 138
Multilateral 188 164 179 220 231 240
Commercial Banks 29 26.3 34.9 35.8 24.9 0.3
Export Credit 1.4 3.5 0.9 3.9 1.5 18
(As a % of GDP) 50% 42% 40% 55% 51% 22%
(As a % of total debt) 74% 66% 65% 70% 66% 49%
DOMESTIC DEBT 120 159 172 174 206 405
(As a % of GDP) 18% 22% 21% 24% 27% 22%
(As a % of total debt) 26% 34% 35% 30% 34% 51%
TOTAL DEBT 466 467 495 582 602 801
(As a % of GDP) 68% 64% 61% 79% 77% 44%
Source: Annual Debt Management Reports for financial years 2005/06 and 2006/07.
____________________________________________________________________________________________________________________________________________________________________________
EEvviiddeennccee ooff TThhee IImmppaacctt ooff IIMMFF FFiissccaall aanndd MMoonneettaarryy PPooll iicciieess oonn tthhee CCaappaaccii ttyy ttoo AAddddrreessss HHIIVV//AAIIDDSS aanndd TTBB CCrriisseess iinn KKeennyyaa
8
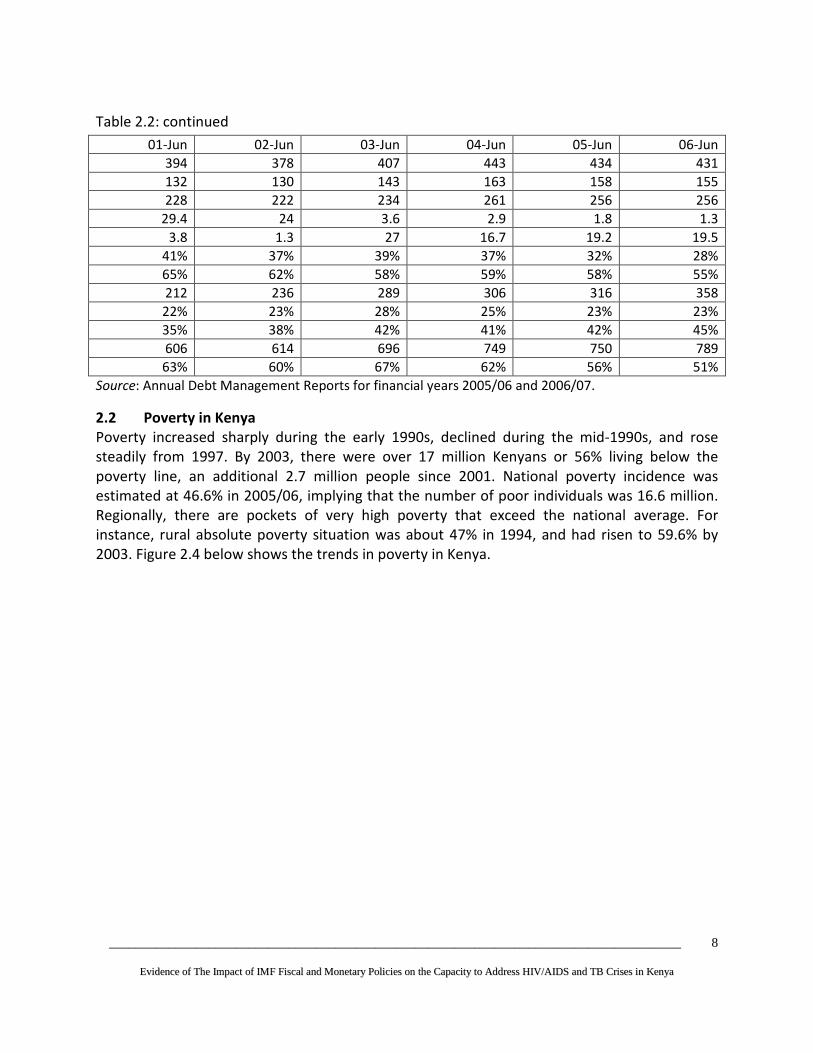
Table 2.2: continued
01-Jun 02-Jun 03-Jun 04-Jun 05-Jun 06-Jun
394 378 407 443 434 431
132 130 143 163 158 155
228 222 234 261 256 256
29.4 24 3.6 2.9 1.8 1.3
3.8 1.3 27 16.7 19.2 19.5
41% 37% 39% 37% 32% 28%
65% 62% 58% 59% 58% 55%
212 236 289 306 316 358
22% 23% 28% 25% 23% 23%
35% 38% 42% 41% 42% 45%
606 614 696 749 750 789
63% 60% 67% 62% 56% 51%
Source: Annual Debt Management Reports for financial years 2005/06 and 2006/07.
2.2 Poverty in Kenya
Poverty increased sharply during the early 1990s, declined during the mid-1990s, and rose
steadily from 1997. By 2003, there were over 17 million Kenyans or 56% living below the
poverty line, an additional 2.7 million people since 2001. National poverty incidence was
estimated at 46.6% in 2005/06, implying that the number of poor individuals was 16.6 million.
Regionally, there are pockets of very high poverty that exceed the national average. For
instance, rural absolute poverty situation was about 47% in 1994, and had risen to 59.6% by
2003. Figure 2.4 below shows the trends in poverty in Kenya.

____________________________________________________________________________________________________________________________________________________________________________
EEvviiddeennccee ooff TThhee IImmppaacctt ooff IIMMFF FFiissccaall aanndd MMoonneettaarryy PPooll iicciieess oonn tthhee CCaappaaccii ttyy ttoo AAddddrreessss HHIIVV//AAIIDDSS aanndd TTBB CCrriisseess iinn KKeennyyaa
9
Figure 2.2: Poverty trends in Kenya
Source: adapted from Kioko et al., 2007.
2.3 Kenyan Health Sector
2.3.1 Overview of the public health sector
After independence in 1963, the Government of Kenya pledged to fight diseases, ignorance and
poverty in the country. The commitment to combat diseases led the country to design policies
aimed at promoting coverage of and access to modern health care services. This commitment
stemmed from recognition by the Government that good health is a prerequisite to
socioeconomic development. The policies that the Government has pursued over the years
have had a direct impact in improving the health status of Kenyans. The crude death rate
dropped from 20 per 1000 at independence to 12 per 1000 in 1993 and the crude birth rate
from 50 per 1000 to 46 per 1000 over the same periods. The total fertility rate recorded an
increasing trend reaching 8.1 in the 1980s. However, between 1977 and 1992, the rate declined
to 5.4 and is currently estimated at 4.6. Infant mortality fell from 98 deaths per 1000 live births
during the mid-1970s to 63 deaths per 1000 live births between 1988 and 1993. Child mortality
was 93.2 deaths per 1000 live births in 1988-1993. These gains have been reversed, however,
due largely to the HIV/AIDS epidemic. For instance, infant mortality is currently estimated at 74,
child mortality at 112 and life expectancy at 48 years (Republic of Kenya, 1994; Owino, 1997;
Kazibwe et al., 1998; World Bank, 2000, 2002; Republic of Kenya, 2006d).
Despite the massive expansion of health infrastructure in the public health sector, the inability
of the Government to effectively provide health services became acute in the 1980s due to
steadily increasing demand for health services as a result of population growth, the AIDS
____________________________________________________________________________________________________________________________________________________________________________
EEvviiddeennccee ooff TThhee IImmppaacctt ooff IIMMFF FFiissccaall aanndd MMoonneettaarryy PPooll iicciieess oonn tthhee CCaappaaccii ttyy ttoo AAddddrreessss HHIIVV//AAIIDDSS aanndd TTBB CCrriisseess iinn KKeennyyaa
10
epidemic, increasing episodes of malaria, yellow fever, and cholera, and traffic accidents among
others (Republic of Kenya, 1994; Collins et al., 1996). Poor economic performance in the 1980s
exacerbated the problem of financing of health services in the public sector. As a result, the
MoH’s budget, although increasing in absolute terms over the years, declined as a proportion of
total Government spending. For instance, Collins et al., (1996) indicate that the MoH’s
recurrent budget as a proportion of total Government budget declined from 9.3% to 8.5%
between 1979/80 and 1991/92, with a low of 7.4% reached in 1988/89. This trend has not
changed significantly over the last five years, although the absolute allocation to MoH has
increased considerably.
The poor economic performance and unsustainable levels of public debt in the 1980s forced
Kenya to undertake IMF- and World Bank-led structural adjustment programs. Since the
adjustment programs called for reduction in government expenditure, especially in social
sectors including health, their implementation exacerbated the resource constraint that was
already being experienced in the public health sector. The structural programs also called for
health financing reform, resulting in the introduction of cost sharing (i.e., user fees) in the
public health sector in 1989 (Collins et al., 1996).
The problems which faced the public health sector led to recognition, by the Government, of
the need to undertake a bold programme of health sector reforms. This culminated in the
launching of Kenya’s Health Policy Framework (KHPF) in 1994. The KHPF is currently the blue
print for the development and management of the health sector. The overall goal of the health
sector reforms is the provision of affordable and accessible health services to all Kenyans
(Republic of Kenya, 1994).
The Kenya National Health Sector Strategic Plan I (NHSSP 1999-2004) and the current Kenya
Health Sector Strategic Plan II (2005-2010) was and is, respectively, anchored on KHPF. The
NHSSPI proposed a variety of actions to continue and strengthen the reform process, including
governance related issues; improved resource allocation; decentralization of district health
planning and implementation; shift of resources from curative to preventive and promotive
health care services; autonomy for the provincial and national hospitals; enhanced
collaboration with stakeholders under a Sector Wide Approach (SWAp) modality; and the
reconstitution of the Health Sector Reform Secretariat (HSRS) to spearhead and coordinate the
reform agenda. An evaluation of the NHSSP I concluded that the plan did not manage to make a
breakthrough in terms of transforming the critical health sector interventions and operations
towards meeting the most significant targets and indicators of health and socioeconomic
development which were expected. This was attributed to a set of factors, among them
inadequate funding (Republic of Kenya, 2006d). The NHSSP II is an integral part of the Economic
Recovery Strategy for Wealth and Employment Creation.
2.3.2 HIV/AIDS in Kenya

____________________________________________________________________________________________________________________________________________________________________________
EEvviiddeennccee ooff TThhee IImmppaacctt ooff IIMMFF FFiissccaall aanndd MMoonneettaarryy PPooll iicciieess oonn tthhee CCaappaaccii ttyy ttoo AAddddrreessss HHIIVV//AAIIDDSS aanndd TTBB CCrriisseess iinn KKeennyyaa
11
Kenya’s HIV prevalence has been declining over the last decade with the most recent modeling
of sentinel surveillance data indicating a prevalence of 5.1% among adults at the end of 2006
compared with 10% in 1997/98. The 2007 Kenya AIDS Indicator Survey (Republic of Kenya,
2008b) has shown that the national prevalence has started to level off with 7.8% of the adult
population 15-49 living with the virus. In 2003, KDHS estimated a prevalence of 6.7% among the
same age group. Three out of 5 HIV-infected Kenyans are female (Republic of Kenya, 2008b).
While HIV is occurring in all age groups, there are some differences in prevalence across the life
span. Among youth age 15-24, women are 4 times more likely to be infected than men (6.1%
compared to 1.5 %). A higher proportion of Kenyans ages 30-34 are currently infected with HIV
than in any other age category. The decline in prevalence among women after age 34, and
among men after age 44 could represent a decline in new infections in older age groups or an
increase in HIV-related deaths in these age groups. The burden of infections is statistically
higher among females than males until age 35, after which the ratio of male to female
infections starts to approach 1 to 1.
The Government of Kenya declared HIV/AIDS a national disaster in 1999 and established the
National AIDS Control Council. The NACC facilitated the development of the Kenya National
HIV/AIDS Strategic Plan 2000-2005 and the current Kenya National HIV/AIDS Strategic Plan
2005/06-2009/10, which set out a multi-sectoral response to the epidemic, jointly agreed by
stakeholders within Government, civil society, the private sector and development partners.
The combined effort by the Government and development partners, over the last decade, has
resulted in substantial progress in prevention and advocacy; treatment, continuum of care and
support; institutional arrangements, management and coordination; monitoring and evaluation
and research; and mitigation of the disease’s socio-economic impact. For instance, the ART
program has registered impressive scale-up in the last two years. KIAS indicates that currently
213,000 patients are on treatment with a monthly increase of 5,000 new patients. This
notwithstanding, KNASP outlines that the implementation of the multi-sectoral response in the
period 2000-2005 was hampered by, among many other factors, vulnerable groups not having
access to condoms, especially in rural areas, inadequate youth-friendly support services,
inadequate appropriate drugs for opportunistic infections, ARVs not available and accessible,
lack of food and nutritional supplements for people living with HIV/AIDS, lack of test kits for
HIV/AIDS in health facilities; inadequate financial resources, infrastructure and institutional
capacity of implementing agencies, poor geographical coverage of interventions due to
vastness of some regions, mitigation of socio-economic impact limited by high poverty levels
and unemployment, and shortage of trained personnel.
A 2006 survey on socioeconomic impact of HIV/AIDS in Kenya revealed that the impact of
HIV/AIDS was more severe among low income groups; the incidence of morbidity was higher in
female-headed households than male-headed households; and children from affected
households were more likely to drop out of school (36%) due to education related costs than
children from un-affected households (25%). Younger children, however, were more likely to
drop out of school due to HIV/AIDS related morbidity and mortality than older children. A very

____________________________________________________________________________________________________________________________________________________________________________
EEvviiddeennccee ooff TThhee IImmppaacctt ooff IIMMFF FFiissccaall aanndd MMoonneettaarryy PPooll iicciieess oonn tthhee CCaappaaccii ttyy ttoo AAddddrreessss HHIIVV//AAIIDDSS aanndd TTBB CCrriisseess iinn KKeennyyaa
12
common coping strategy, necessitated by reduced family incomes was withdrawal of children
from school for child labour either in their households or to work for wealthier relatives. Other
effects on the households were increased spending on medical care than unaffected
households; evidence suggested that household members with sick individuals spent less time
on agricultural activities than the non-affected members. This has led to the neglect of farm
areas and consequently a decrease in overall planted area (Republic of Kenya, 2006a).

____________________________________________________________________________________________________________________________________________________________________________
EEvviiddeennccee ooff TThhee IImmppaacctt ooff IIMMFF FFiissccaall aanndd MMoonneettaarryy PPooll iicciieess oonn tthhee CCaappaaccii ttyy ttoo AAddddrreessss HHIIVV//AAIIDDSS aanndd TTBB CCrriisseess iinn KKeennyyaa
13
CHAPTER THREE: STUDY FINDINGS
3.1 Overview of IMF policies in Kenya
3.1.1 Introduction
The country’s engagement with IMF dates back to1970s. The engagement has entailed lending
by the IMF to the country, based on the agreement that the country would implement
structural adjustments. Structural adjustment program (SAP) is a term used to describe the
policy changes implemented by developing countries under the support of the International
Monetary Fund and the World Bank. Structural adjustment programs (SAPs) emphasize neo-
liberal values which advocate for limited internal regulations to facilitate foreign investment,
emphasize export production as opposed to production for local consumption, abolish
agricultural subsidies in order to reduce government spending and finally call for reduced
spending on social sectors including health and education. SAPs require that a number of fiscal
and monetary policies be undertaken by the borrowing country before it is eligible for IMF
loans or bilateral aid. SAPs are also intended to help countries to make debt repayments on the
older debts owed to commercial banks, governments and the World Bank. From the late 1980s,
the World Bank began to attach conditions to structural adjustment or policy-based loans.
Generally, IMF policies centre on low one-digit inflation rates, high currency reserve levels,
reduction in government expenditure on the social sectors, reduction in government budget
deficits, ceilings on the overall national resource envelope and privatization of parastatals.
A serious financial crisis that the country faced in 1980s made it difficult for the government to
finance most of its development policies. In pursuance of this financing, the Kenya government
initiated a number of structural reforms aligned with the IMF’s policy conditionalities: reduction
in government spending, privatization of parastatals, financial sector reforms and civil service
reforms. The structural adjustment programs that have been implemented by the Government
of Kenya with the support of the IMF have been under the lending frameworks, consisting of
the Trust Fund, enhanced structural adjustment facility (ESAF), and poverty reduction and
growth facility (PRGF). The policies which have been implemented under these frameworks are
discussed in the sub-sections below.
3.1.2 The Trust Fund
The first structural adjustment loan borrowed by Kenya Government from the IMF, under the
Trust Fund, was in 1975. This was triggered by the financial imbalances created mainly the
terms of trade shocks. Worsening economic conditions forced the government to return to the
IMF in 1982 for the second structural adjustment loan under the fund. Although the economy
stabilized between 1982 and 1984, little or no progress was made toward structural
adjustment. While there were design and timing problems, the lack of compliance was
____________________________________________________________________________________________________________________________________________________________________________
EEvviiddeennccee ooff TThhee IImmppaacctt ooff IIMMFF FFiissccaall aanndd MMoonneettaarryy PPooll iicciieess oonn tthhee CCaappaaccii ttyy ttoo AAddddrreessss HHIIVV//AAIIDDSS aanndd TTBB CCrriisseess iinn KKeennyyaa
14
ultimately due to insufficient commitment. The unsatisfactory implementation led to a pause in
adjustment lending and nearly four years passed before another attempt (Swamy, 1994).
3.1.3 Enhanced Structural Adjustment Facility (ESAF2)
The government adopted SAPs in the context of a wide range of reforms through the
publication of Sessional Paper No. 1 of 1986 on Economic Management for Renewed Growth
under the support of the IMF and the World Bank (Swamy, 1994). The period 1992 to 1996
represented a time when the government showed a serious commitment to the
implementation of SAPs. The According to Policy Framework Paper of 1996 (Republic of Kenya,
1996), the government of Kenya began implementing an ambitious program of macroeconomic
and structural reform since 1993. The key features of this program included a reduction in the
fiscal deficit and enhanced monetary discipline; liberalization of external and internal markets;
initiation of parastatal reform based upon restructuring of strategic parastatals and divestiture
of non-strategic enterprises; and improved government management through reduction of the
size of the civil service and reorganizing key ministries. Most of the fiscal policy measures have
centered on reduction of budget deficits through reduced domestic borrowing, maintaining low
inflation and increasing foreign reserves.
Kenya experienced a major economic transformation during the period 1993-95. Direct controls
on domestic prices, internal marketing, external trade, and the exchange system were
eliminated, and the exchange rate and interest rates were left to be determined by market
forces. The government budget deficit (excluding grants) was reduced from 11.4 percent of
GDP in 1992/93 to 2.5 percent in 1994/95; money supply growth was brought under control
and confidence in the banking system was restored. However, economic reforms slowed in
1995, and some setbacks occurred. The budgetary targets for the first half of 1995/96 were not
met, mainly because of large off-budget outlays, and the restructuring of key parastatals was
delayed (IMF, 2008b).
The Government of Kenya and the IMF prepared the Policy Framework Paper in 1996 for the
IMF reforms that were planned for implementation in the period 1996-98 (Republic of Kenya,
1996). The economic program for 1996-98, supported by the ESAF loans, was focused on the
following key areas: (a) consolidation of the fiscal adjustment; (b) privatization and
restructuring of the parastatal sector; (c) avoidance of the recurrence of misuse of public funds;
and (d) further development of outward-looking competitive markets. The basic medium-term
macroeconomic goal was to raise the economic growth rate to about 6 percent by 1998; to
maintain inflation at 5 percent throughout the period; and to lower the external current
account deficit, excluding official transfers, to about 0.8 percent of GDP.
2 ESAF was established in 1987 has a facility through which the IMF provided low-interest loans to poor countries to undertake structural adjustment programs

____________________________________________________________________________________________________________________________________________________________________________
EEvviiddeennccee ooff TThhee IImmppaacctt ooff IIMMFF FFiissccaall aanndd MMoonneettaarryy PPooll iicciieess oonn tthhee CCaappaaccii ttyy ttoo AAddddrreessss HHIIVV//AAIIDDSS aanndd TTBB CCrriisseess iinn KKeennyyaa
15
To achieve these objectives, the Policy Framework Paper outlined how the authorities would
reduce the overall fiscal deficit (on a commitment basis and excluding grants) from 2.5 percent
of GDP in 1994/95 to 1.9 percent in 1995/96, and further to 1.6 percent in 1996/97. In addition,
total revenue was planned to be reduced in relation to GDP, while the tax base was to be
broadened. Price stability was the overriding objective of the planned monetary policy. The
main policy objectives in 1996 were: (a) further progress in privatization and restructuring of a
number of key enterprises; (b) divesture of roughly one-half of the remaining non-strategic
enterprises; (c) restructuring of the civil service; and (d) further strengthening of the financial
system, inter alia, by making the Central Bank of Kenya more independent and by converting
the National Social Security Fund into an autonomous pension fund (ibid.).
The Government of Kenya planned, in the period 1996-98, to target poverty measures and to
increase access to social services by the poor. The quality and availability of health services was
expected to improve as a result of the reallocation of budgetary resources from hospital care to
preventive and primary health care. It was also proposed that public resources would be
reallocated from university education toward primary and secondary education, particularly for
underprivileged students. However, it is noteworthy that for health services, it was only
reallocation but not additional budgetary allocation that was considered in the effort to fight
poverty. With this framework in place, the IMF approved a three-year loan for Kenya under the
enhanced structural adjustment facility (ESAF) equivalent to SDR 149.55 million (about $216
million), to support the Government's economic reform program for 1996-98.
3.1.4 Poverty Reduction and Growth Facility (PRGF)
The ESAF was renamed the PRGF in 1999. The Government of Kenya subscribed to the PRGF in
2000, and embarked on the preparation of the PRSP at the same time. According to ERS
(Republic of Kenya, 2004) the preparation was undertaken through wide-ranging consultations
and dialogue in order to build consensus on priority actions and activities necessary for
economic growth and poverty reduction. While wide consultations took place, the effectiveness
of players other than government in shaping the strategy has not been assessed. Since the
process was being undertaken for the first time, the consultation may have only a “buy in” of
the strategy already prepared by the government and the IMF.
The PRSP was preceded by the Interim Poverty Reduction Strategy Paper (IPRSP) released in
2001. A new government was elected in December 2002. The government prepared ERS in
2003 to provide the framework for economic recovery for the period 2003-2007. The ERS
became the new PRSP. The PRSP 2004 indicates that the ERS took into account existing
government policy documents, particularly the PRSP and NARC’s Manifesto and Post-Election
Action Plan. The development of ERS was also a result of wide-ranging consultations with
stakeholders. The stakeholders included parliamentarians, trade unions, professionals, financial
institutions, industrialists, ASALs, development partners, civil society, and government
(Republic of Kenya, 2004).

____________________________________________________________________________________________________________________________________________________________________________
EEvviiddeennccee ooff TThhee IImmppaacctt ooff IIMMFF FFiissccaall aanndd MMoonneettaarryy PPooll iicciieess oonn tthhee CCaappaaccii ttyy ttoo AAddddrreessss HHIIVV//AAIIDDSS aanndd TTBB CCrriisseess iinn KKeennyyaa
16
With the PRSP in place, the Executive Board of the IMF approved a three-year PRGF
arrangement in an amount equivalent to SDR3 175 million (about US$252.75 million) in
November 2003. As contained in IMF (2008), the Kenya government's economic strategies
under this PRGF loan included fiscal consolidation in order to reduce the domestic debt to a
sustainable level, and the restructuring of spending in favor of priority poverty reduction
outlays and investment. The measures proposed included strengthening revenue performance
through a speedy rebuilding of the integrity and capacity of the Kenya Revenue Authority and
rationalization of the tax system; reducing the wage bill as a share of total expenditure by
reforming the wage setting mechanism for public servants and continuing civil service reforms;
and restructuring the parastatal and financial sectors to increase efficiency and reduce the
government's contingent liabilities.
The Executive Board of the International Monetary Fund (IMF) completed the second review of
Kenya's economic performance under a three-year Poverty Reduction and Growth Facility
(PRGF) arrangement in April 2007. The completion of the review enabled the release of an
amount equivalent to SDR 37.5 million (about US$56.8 million), bringing total disbursements
under the arrangement to SDR 112.5 million (about US$170.4 million).
The PRGF loans were approved conditional upon reforms agreed upon by the government and
the IMF, as contained in the letter of intent and the PRSP 2004. Kenya’s fiscal strategy was
reformed to include three objectives: fiscal sustainability, in which the fiscal policy’s aim was to
maintain a level of expenditures that could be funded without either an increase in the present
value (NPV) of overall debt to GDP or an increase of external debt growth; expenditure
restructuring for growth and poverty reduction that proposed increasing the shares of
development expenditures, especially those targeting Government investments, core social
expenditures (education and health) and core poverty expenditures; and improving public
sector service delivery by enhancing both the efficiency and effectiveness of public expenditure
through a process of internalizing the Public Expenditure Review (PER) and carrying out Public
Expenditure Management (PEM) reform (Republic of Kenya, 2004). The fiscal strategy forms the
basis for defining a realistic medium-term Government finance framework covering revenues,
expenditures and financing, which would allow for an aggregate expenditure ceiling consistent
with the stated objectives.
The fiscal strategy was anchored on a revenue policy framework that sought to maintain
revenues at above 21 percent of GDP to enable the bulk of government expenditures to be met
from domestic resources excluding borrowing; an expenditure strategy that was proposed to
gradually reduce the level of recurrent expenditure to GDP to allow for a rapid increase in
development expenditures within a sustainable macro economic framework. Public
Expenditure management reforms and the ministries public expenditure reviews (MPERS) were
considered as means of redirecting expenditures to national priorities and away from low
3 Special Drawing Rights, an international reserve currency issued by the IMF.

____________________________________________________________________________________________________________________________________________________________________________
EEvviiddeennccee ooff TThhee IImmppaacctt ooff IIMMFF FFiissccaall aanndd MMoonneettaarryy PPooll iicciieess oonn tthhee CCaappaaccii ttyy ttoo AAddddrreessss HHIIVV//AAIIDDSS aanndd TTBB CCrriisseess iinn KKeennyyaa
17
priority areas and of reducing the budget deficit from 4 percent of GDP in 2003/04 to below 3
percent. PRSP 2004 also specified the measures to achieve the fiscal strategy: reducing the
wage bill from 8.7 percent of GDP in 2003/04 to 8.5 percent by 2005/06, with any awards being
matched by a proportionate downsizing of the civil service; raising of health expenditures at a
growth rate least 7.5 percent faster than overall expenditures; and attaining at least 12 percent
of total expenditures by 2010, among others. The fiscal strategy assumed that these health
expenditures would be focused on non-wage, non-transfer expenditures to enable the rapid
increase in basic health services.
In terms of monetary policy, the Kenya Government proposed to continue focusing on
maintaining stability in the general price level and fostering the functioning of a stable market-
based financial system. The Central Bank of Kenya would continue with its policy of keeping
overall inflation below 5 percent annually, while targeting underlying inflation of 3.5 percent. In
addition, the Kenya Government would continue the policy of a flexible market-determined
exchange rate regime, with exchange rate interventions limited to smoothing short-term
volatility (Republic of Kenya, 2004). The policies pursued under the current PRGF program are
similar, including a fiscal deficit target of 3% of GDP and an inflation rate target of 5 percent.
3.1.5 Recent Developments with the PRGF in Kenya
Current Fiscal Policy According to the IMF documents from October and July 2008, the Government’s 2008/09
budget is targeting a budget deficit of 5.3 percent of GDP, which includes an increase in public
investment. Although the IMF staff supported the emphasis on public investment, the IMF
prefers targeting a lower fiscal deficit of 4.5 percent of GDP.
Table 3.1 Fiscal deficits in Kenya
2007/08
IMF Estimate
2008/09
Govt. IMF
Budget
Projection
2009/10
IMF
Projection
2010/11
IMF Projection
Fiscal Deficit
As a % of GDP
4.8
5.3
4.6
3.8
3.8
Part of the Government’s projected fiscal deficit of 5.3 percent of GDP is to be financed by the
floating of an international bond for increased infrastructure investment. The IMF is proposing
that the measures for domestic debt and external debt be combined for a total debt-to-GDP
ratio to serve as the new medium-term fiscal anchor. The 2008 Budget Strategy Paper
envisaged a gradual reduction of the public debt-to-GDP ratio to 35 percent over the medium-
term—an objective that IMF staff supported. The authorities underscored that while overall

____________________________________________________________________________________________________________________________________________________________________________
EEvviiddeennccee ooff TThhee IImmppaacctt ooff IIMMFF FFiissccaall aanndd MMoonneettaarryy PPooll iicciieess oonn tthhee CCaappaaccii ttyy ttoo AAddddrreessss HHIIVV//AAIIDDSS aanndd TTBB CCrriisseess iinn KKeennyyaa
18
spending (relative to GDP) would decline over the medium-term, the composition would shift
toward development spending, in particular to address urgent infrastructure needs.
In 2009, the IMF continues to revise downward its growth projections for developing countries
as exports and commodity prices fall. Yet even as early as August 2008, a joint IMF/World Bank
debt sustainability analysis warned:
Taking all public debt into account, however, the DSA shows greater risk of
unfavorable debt developments, especially under a shock to GDP growth. Even
temporarily lower GDP growth would set the [net present value] of public debt-
to-GDP, the NPV of debt to-revenue, and the ratio of debt service-to-revenue on a
sharply increasing trend. … Considering that the nominal value of public debt
would be near, and in some years above the 40 percent of GDP that staff has
recommended as an anchor for fiscal policy, unchanged policies would indeed
imply some risk of debt distress. Potentially large but unreported contingent
liabilities also pose additional risks to the sustainability of public debt
(International Development Association/IMF, 2009).
The dangerous buildup of potentially significant public liabilities refers to other plans to get
financial support for infrastructure from the private sector, particularly under framework for
public-private partnerships (PPPs). The Kenyan authorities have recognized that PPPs could
play a useful role in infrastructure development, but are also reasonably concerned these
could entail fiscal and implementation risks—particularly the buildup of potential public
liabilities. In the context of many PPPs, while profits are being privatized, the risks are being
socialized through this process of public guarantees deemed necessary to attract private
partners.
In order to help achieve its main goals of keeping inflation under 5 percent per year and
keeping deficit spending contained, the IMF uses two important monetary targets to constrain
the amount of deficit financing that the government can engage in. The first target is a ceiling
or limit in the amount of credit that will be available in the economy in the year, called Net
Domestic Assets (NDA) or net domestic credit. This limited amount of available credit must be
shared between the government sector and the rest of the economy, including private sector
companies. The second target is a floor or basic required level of international hard currency
reserves at the central bank or within the domestic banking system, called Net International
Reserves (NIR).
Often the IMF will either lower the ceiling on available credit (NDA) or raise the floor
requirement on reserves (NIR), or both, as a way limiting the available credit that the
government can access for engaging in deficit spending. In Kenya’s case, they will tighten both
targets over the next few years. These two monetary targets restrict the government’s ability
to make the large, upfront increases in public spending and investment in the public health
system needed to build the foundation for a more successful fight against HIV/AIDS and TB
____________________________________________________________________________________________________________________________________________________________________________
EEvviiddeennccee ooff TThhee IImmppaacctt ooff IIMMFF FFiissccaall aanndd MMoonneettaarryy PPooll iicciieess oonn tthhee CCaappaaccii ttyy ttoo AAddddrreessss HHIIVV//AAIIDDSS aanndd TTBB CCrriisseess iinn KKeennyyaa
19
over the long-term. This idea must be critically revisited and reconsidered among a broader
group of public stakeholders.
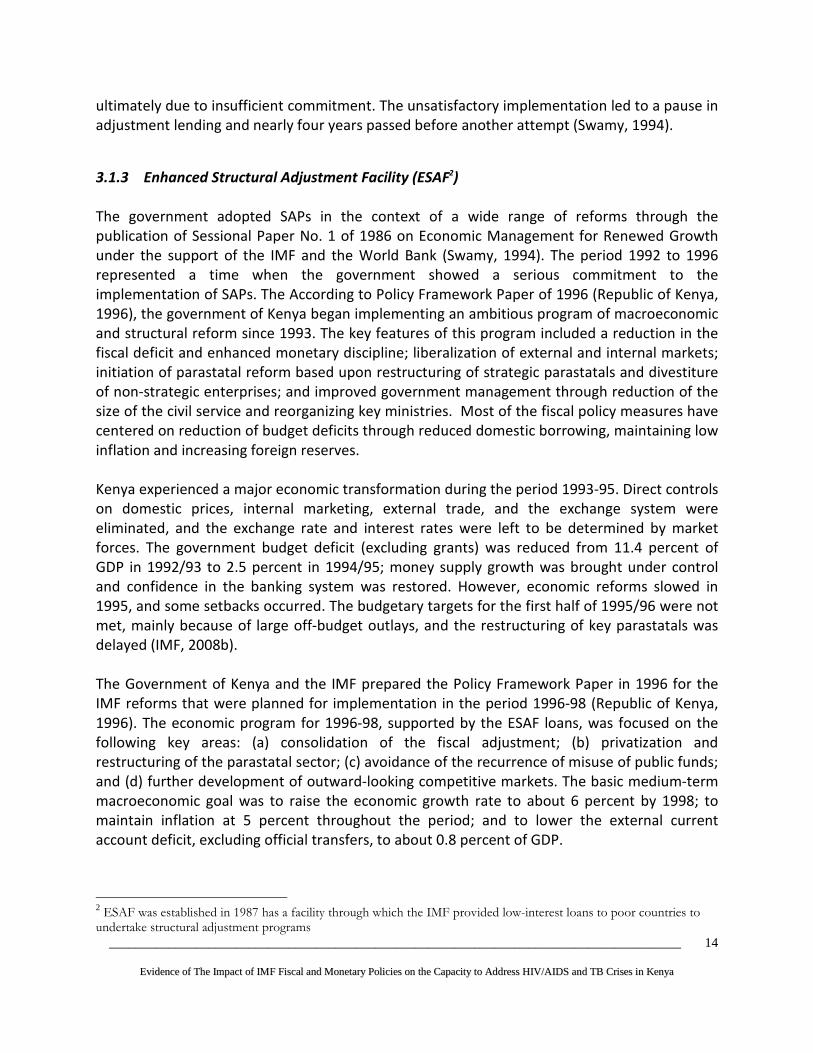
Table 3.2 Net Domestic Assets (NDA) and Net International Reserves (NIR) in Kenya
June June June June Sep Dec Mar June
2005 2006 2007 2008 2008 2008 2009 2009
Net Domestic Assets (NDA)
In Billions of Kenyan Shillings
Domestic Credit 466.3 521.7 607.1 712.8 693.6 767.6 820.6 864.4
Avail for Govt 112.3 117.9 157.2 132.7 158.2 185.7 172.6 171.9
Avail for Rest of Economy 354 403.8 450 580.1 535.4 581.9 647.9 692.5
Ratio of Credit Available to Govt vs Total 0.24 0.23 0.26 0.19 0.23 0.24 0.21 0.20
Net International Reserves (NIR)
BOK Net Foreign Assets in Millions of US $ 1,212 2,159 2,357 2,896 3,067 3,078 3,089 3,192
NDA/NIR Ratio 0.09 0.05 0.07 0.05 0.05 0.06 0.06 0.05
The latest data from IMF documents project that over the next few years, the IMF will have
Kenya lower the ceiling on available credit (NDA) while raising slightly the required floor for
international currency reserves (NIR), thereby squeezing away possibilities for greater “fiscal
space” which could enable a greater investment in health systems in order to address
HIV/AIDS and TB. The data indicate that the levels for NIR are intended to increase still further
to $4.1 billion in 2009/10; 4.6 billion in 2010/11; 5.1 billion in 2011/12; and $5.78 billion in
2012/13.
Current Monetary Policy:
Inflation below 5 percent per year continues to be the overall monetary policy goal. Recent
measures to tighten monetary policy were in the right direction in the face of high money
growth and inflationary pressures—and more steps are urgently needed to prevent second-
round effects of higher food and fuel prices. Political instability took a toll on economic activity
and exacerbated inflationary pressures in early 2008. First quarter GDP contracted by 1.3
percent (year-on-year), with tourist arrivals down by over 50 percent and most sectors
hampered by disruptions to supply chains and displacement of productive resources. The
resulting shortages compounded inflationary pressures arising from an earlier accommodative
monetary policy as well as from rising international fuel and food prices. Inflation for the
official headline consumer price index (CPI) was 26.5 percent in July (year-on-year).

____________________________________________________________________________________________________________________________________________________________________________
EEvviiddeennccee ooff TThhee IImmppaacctt ooff IIMMFF FFiissccaall aanndd MMoonneettaarryy PPooll iicciieess oonn tthhee CCaappaaccii ttyy ttoo AAddddrreessss HHIIVV//AAIIDDSS aanndd TTBB CCrriisseess iinn KKeennyyaa
20
Table 3.3 Monetary Policy Indicators in Kenya
2005/06
Estimate
2006/07
Estimate
2007/08
Estimate
2008/09
Projection
2008/09
Projection
2008/09
Projection
2008/09
Projection
2008/09
Projection
Inflation
Annual
average %
11.1
10.4
18.5
14.5
5.0
5.0
5.0
5.0
Reserve
Money
Growth
End of period
%
14.0
17.5
19.6
15.0
14.6
14.1
14.1
14.1
The IMF supports the centering of monetary policy around a reduction in the growth of
reserve money. According to the IMF (2008), “Monetary policy was tightened in June 2008 to
address rising inflationary pressures. For much of 2007/08, reserve money growth had
exceeded the authorities’ target and private sector credit growth had also remained robust.”
In early June, the Central Bank Rate (CBR) was raised by 0.25 percent to 9 percent in response
to continued inflationary pressures. The authorities explained that the June increase in the
CBR signaled their intention to let market rates rise. Staff stressed the need to employ
decisively all available instruments, including appropriate term-deposit auctions and foreign
exchange (FX) reserve sales, to slow reserve money growth to prevent “second round” effects
of higher food and fuel prices; in this regard, the planned introduction of the CBK’s own bills
could provide a further useful instrument. However, reserve money growth (19 percent, year-
on-years, in July) has remained above the level that the CBK and staff had considered
consistent with the envisaged decline in inflation during 2008/09.
According to the Bank of Kenya’s “Monthly Economic Review” on economic developments
through August 2008, reserve money increased by 18.9 percent in the year to July 2008
compared with 17.6 percent growth in a similar period in 2007 as shown in Table 2.5. The
increased expansion in reserve money was held as bank reserves and currency outside banks
increased by 30.4 percent and 12.0 percent respectively, compared with 16.5 percent and 18.3
percent in 2007. The amount of reserve money in July 2008 was Ksh 152.6 billion or Ksh 5.7
billion above target. The excess was held in bank reserves (Ksh 3.7 billion) and currency
outside banks (Ksh 2.0 billion).
According to the Review, although the economy grew by 7.0 percent in 2007 compared with
6.4 percent in 2006, overall 12-month inflation increased from 26.5 percent in July 2008 to
27.6 percent in August 2008 following higher prices of food items, as well as high imported
fuel and electricity costs. Similarly, average annual inflation increased from 19.6 percent in July
2008 to 20.8 percent in August 2008. Money supply, M3, grew by 19.2 percent in the year to

____________________________________________________________________________________________________________________________________________________________________________
EEvviiddeennccee ooff TThhee IImmppaacctt ooff IIMMFF FFiissccaall aanndd MMoonneettaarryy PPooll iicciieess oonn tthhee CCaappaaccii ttyy ttoo AAddddrreessss HHIIVV//AAIIDDSS aanndd TTBB CCrriisseess iinn KKeennyyaa
21
July 2008 compared with 15.2 percent in the year to July 2007 and was above the projected
growth of 17.3 percent for the quarter ending September 2008.
The Central Bank Rate (CBR) remained at 9 percent in August 2008. The average 91-day
Treasury bill rate fell slightly from 8.03 percent in July 2008 to 8.02 percent in August 2008,
while the 182-day Treasury bill rate also declined from 9.09 percent in July 2008 to 8.75
percent in August 2008. The average interbank rate declined from 8.06 percent in July 2008 to
6.92 percent in August 2008 as the liquidity situation in the market normalized. The
repurchase agreement rate also fell from 7.41 percent in July 2008 to 6.35 percent in August
2008. Commercial banks’ average lending rate fell from 13.91 percent in July 2008 to 13.66
percent in August 2008 while the overall deposit rate increased from 4.54 percent in July 2008
to 4.65 percent in August 2008. Consequently, the interest rate spread declined to 9.05
percent in August 2008.
Moving Towards an IT Regime:
The IMF discussions with Kenyan authorities also included alternatives to the money-based
monetary framework, including moving to a formal Inflation Targeting (IT) regime over the
medium term. While it is believed that monetary policy would benefit from a strong and
credible focus on a low inflation target, it was agreed that more work was needed before
initiating steps toward alternative frameworks, including possibly inflation targeting. In
particular, this would require the resolution of IMF concerns about the methodology currently
used for calculating Kenya’s CPI, but also a better understanding of the monetary transmission
mechanism and alternative institutional arrangements for monetary policy—areas where the
CBK planned further analytical work.
An August 2008 IMF Ex-Post Assessment (EPA) overview report of Kenya’s macroeconomic
policies between the years 1993-2007 examined four successive IMF arrangements (IMF
2008d). According to the report, “Kenya’s performance and relations with the IMF were
viewed as disappointing until a recent pick-up of growth and improved implementation of
structural reforms. Macroeconomic policy design was broadly appropriate and implementation
was generally sound. Growth slowed in the 1990s, but picked up after the 2002 elections,
reflecting buoyant global conditions, structural reforms, and a surge of private capital inflows.
Monetary policies were complicated by a reluctance to allow for full interest and exchange
rate flexibility. Fiscal policy advice and implementation were sound, although an earlier focus
on domestic debt consolidation would have been desirable. Progress was made in structural
reform, albeit often slower than programmed and with setbacks that raised doubts about
ownership. Reforms have focused on governance, civil service employment, parastatal
operations, revenue administration, public financial management (PFM), and financial sector
supervision and development. Extensive Fund technical assistance (TA) was moderately
effective.” (IMF 2008d).

____________________________________________________________________________________________________________________________________________________________________________
EEvviiddeennccee ooff TThhee IImmppaacctt ooff IIMMFF FFiissccaall aanndd MMoonneettaarryy PPooll iicciieess oonn tthhee CCaappaaccii ttyy ttoo AAddddrreessss HHIIVV//AAIIDDSS aanndd TTBB CCrriisseess iinn KKeennyyaa
22
The IMF Executive Board “broadly concurred” with the findings and recommendations of the
Ex-Post Assessment of Kenya’s long-term program engagement with the Fund, and they
“welcomed the consideration being given by the authorities to modalities for future
engagement with the Fund, possibly in the context of a Policy Support Instrument.”
3.1.6 Summary of the IMF Policies in Kenya
Table 3.4 Content of IMF Policies in Kenya
Name of policy
and year of
enactment
Focus of Policy Specific key
conditions of the
policy
Rationale for the
enactment of policy
Negative
consequences/outcomes
Structural
Adjustment
Programs
(SAPs): 1993 to
date
Reduction in
government
expenditure in social
sectors
Reduction in
government wage bill
Reduce external and
domestic debt
Reduce government
budget deficits
Budget ceilings in the
national resource
envelope
Privatisation of state
owned enterprises
Civil service reforms
Tight monetary
and fiscal policies
Wage
containment
Spend only when
you have the
money
Tight
management of
the recurrent
budget
Direct fiscal
conditionalities
included i) deficit
limits, ii) a cap on
the share of
public-sector
wages in GDP,
and
Increase
international
currency
reserves,
Reform civil
service,
privatization of
state enterprises
Control of huge fiscal
deficits
Bloated civil service
Economy was too
heavily driven by the
public sector in social
economic and
administrative
activities
To ensure that
government
expenditure is in line
with budget
Reduce high levels of
inflation
Retrenchment of civil
servants
Shortage of critical health
personnel
Poor health service
delivery
Reduction in real per
capita health expenditure
Limited budget allocation
to govt ministries which
has negatively affected
policy implementation.
Shortage of human
resources i.e. inadequate
number of personnel in
key areas of the health
sector an inequitable
distribution of health
personnel who are
available
High attrition of trained
personnel from the health
sector and from the
country
Budget Ceilings
Financing of
investment and
direct support of
economic growth and
poverty reduction
Ministries to
spend within the
established
ceilings
Focus on medium
National ceilings
constrains sectoral ceilings
Inadequate resources to
implement sector
priorities

____________________________________________________________________________________________________________________________________________________________________________
EEvviiddeennccee ooff TThhee IImmppaacctt ooff IIMMFF FFiissccaall aanndd MMoonneettaarryy PPooll iicciieess oonn tthhee CCaappaaccii ttyy ttoo AAddddrreessss HHIIVV//AAIIDDSS aanndd TTBB CCrriisseess iinn KKeennyyaa
23
Focus on ministerial
strategic priorities
from the ERS and
interventions
required to achieve
the MDGs
term strategic
objectives
Poverty
Reduction
Growth Facility
Poverty reduction
and growth
Interruption in the
construction of
infrastructure has often
resulted in abandoning
projects in process.
Use of government
resources for capital
expenditures decreased
from 11.9% of GDP in
2001 to 8.0% of GDP in
2006, and 4.3% of GDP in
2007.
Public Service
Reform
Programme
(PSRP) – 1993
“Rightsizing,”
capacity building,
decentralization, and
development of
appropriate
performance
management
systems
Lay off public
workers in order
to make the civil
service more
efficient
Increasing efficiency
and effectiveness of
the public service.
Central ministries
(head quarters) to
focus on policy
formulation, resource
mobilization and
monitoring of sector
performance
Massive loss of
employment in the public
service
Restructuring of the MOH
HQs in 2002. The partial
restructuring established a
new organization
structure for MOH-HQ
which was not
accompanied with new
performance
management systems.
Wage Policies
1993 to present
Employment freeze
Wage freeze
Down sizing
Quantitative
targets
government wage
bill to 5.2% of
GDP in 2000 to
8% between 2003
and 2006
Implement a
policy of
restraining
growth in wage
payments to free
resources for
development
purposes
Growth rate of the
civil service surpassed
the high annual
average growth in
population
Unsustainable wage
bill which stood at
over 70% in the 1990s
The Personnel
Emoluments (PE) and
Operational
Maintenance (OM)
ratio was accounting
for 70% of recurrent
expenditure, leaving
only 30% for,
equipment and
facilities required for
efficient delivery of
Loss of critical health
personnel through
voluntary early retirement
programme supported by
the IMF through SAPs
Loss of skilled staff to
other countries in search
of better working
conditions
MoH prevented from
hiring the required
personnel commensurate
with the human resources
demand to scale up HIV
and AIDS, TB
interventions.
Inadequate number of
staff to provide health

____________________________________________________________________________________________________________________________________________________________________________
EEvviiddeennccee ooff TThhee IImmppaacctt ooff IIMMFF FFiissccaall aanndd MMoonneettaarryy PPooll iicciieess oonn tthhee CCaappaaccii ttyy ttoo AAddddrreessss HHIIVV//AAIIDDSS aanndd TTBB CCrriisseess iinn KKeennyyaa
24
services
Bloated Kenyan
public sector
services
3.2 Process of Formulation of the IMF Policies in Kenya
The formulation process of the IMF policies can be analyzed in the context of ESAF and PRGF
programs. According to respondents from the Ministry of Finance, the consultations usually
involved the IMF giving “suggestions” to the Government on policies to be implemented. The
suggestions are usually taken into account without much alteration, implying that the IMF plays
a significant role in the policy formulation under the structural adjustment program. Under the
ESAF loans, the process of formulation of the policies implemented by Kenya over the period
1992-2002 did not involve a broad consultation. They were drawn based on discussions
between the government (mainly the treasury and the central bank) the IMF and the World
Bank. According to IMF (2008a), the ESAF programme, unlike the PRSP process under the PRGF
programme, involved limited consultation. It explains:
“It was intended that the PRSP approach would bring about substantive changes in the
way countries' economic plans were formulated. These changes would include policies
that are more clearly focused on growth and poverty reduction, a full integration
between the poverty reduction and macroeconomic elements of the program, and
greater degrees of participation by civil society and national ownership, which in turn
would lead to more consistent policy implementation.”
As earlier indicated, there was improved and wider consultation in developing the PRSP under
the PRGF program. In the development of the PRSP during the period 2001-2004, the
consultations followed a three-tiered approach: national, provincial and district levels. The
stakeholders in the consultations included the private sector, civil society, development
partners, and local communities. A national steering committee that included all the
stakeholders was formed to spearhead the process and ensure inclusion at all levels.
Participatory Poverty Assessments (PPAs) were carried out in ten sampled districts. The District
PRSP reports and PPA reports, together with inputs from the Sector Working Groups, were
incorporated in the PRSP (Republic of Kenya, 2004). It can be argued that the broad
consultation in drawing up the PRSP resulted in some health sector improvements. In the PRSP,
the health sector was identified as one of the core areas targeted in the poverty reduction
strategy. Government expenditure for the health sector was proposed to increase faster than
the growth in total government spending.
The PRSP for 2001-2004 largely informed the development of ERS, which formed the basis for
the Investment Programme for the period 2003-2007. The development of ERS was also a result
____________________________________________________________________________________________________________________________________________________________________________
EEvviiddeennccee ooff TThhee IImmppaacctt ooff IIMMFF FFiissccaall aanndd MMoonneettaarryy PPooll iicciieess oonn tthhee CCaappaaccii ttyy ttoo AAddddrreessss HHIIVV//AAIIDDSS aanndd TTBB CCrriisseess iinn KKeennyyaa
25
of wide-ranging consultations with stakeholders. The stakeholders included parliamentarians,
trade unions, professionals, financial institutions, industrialists, development partners, civil
society, and government. The Interim Investment Programme was discussed at a National
Investment Conference in November 2003, which was organized jointly by the government and
the private sector. The Investment Programme formed the basis of discussions at the Donor
Consultative Group meeting held in November 2003. A prioritization workshop was also held in
January 2004 where all the activities in the logical framework of the Programme were
prioritized in line with the sector objectives. Comments by the development partners, other
stakeholders and inputs from the National Investment Conference, the Donor Consultative
Group meeting and the prioritization workshops were used to generate the final version of the
Investment Programme (Republic of Kenya, 2004). The broader consultation did not change the
key fiscal and monetary policies followed under the IMF loans; they remained the same as
those the Government previously pursued. The macroeconomic framework, fiscal and
monetary policy targets have remained largely the same in both the ESAF and the PRGF
process.
3.3 Implementation of the IMF- Policies through Budgeting Process
3.3.1 Introduction
The process of formulation of IMF policies in section 3.1 mainly involves developing a
macroeconomic framework, desired fiscal and monetary policies, and evaluation criteria and
benchmarks. However, an analysis of IMF policies is not complete without considering the
processes that result in the implementation of the policies. The budget is a critical tool that is
used to translate the formulated fiscal and monetary policies in actions. The following
subsections provide an overview of the major players involved in the budgeting procedure and
the budget process itself.
3.3.2 Major Players Involved In the Budget Process
Since 2000, aspects of the budget process in Kenya have been undertaken in a consultative
manner. The key players and actors include Government ministries, the Kenya Revenue
Authority, the Central Bank of Kenya (CBK), the Parliament, interest groups, professional bodies
such the Kenya Private Sector Association (KEPSA) and Institute of Certified Public Accountants
of Kenya (ICPAK), and the citizens in general.
The Executive
In the budgeting process, the Executive’s role is to propose fiscal policy in terms of revenue
collection and expenditure. This is done in line with the broad national socio-political and
economic objectives, as contained in government policy documents such as ERS and PRSPs.
Once the budget has been approved by parliament, the executive arm of the government
____________________________________________________________________________________________________________________________________________________________________________
EEvviiddeennccee ooff TThhee IImmppaacctt ooff IIMMFF FFiissccaall aanndd MMoonneettaarryy PPooll iicciieess oonn tthhee CCaappaaccii ttyy ttoo AAddddrreessss HHIIVV//AAIIDDSS aanndd TTBB CCrriisseess iinn KKeennyyaa
26
implements it. The organizations under the executive involved in the process are the Kenya
Revenue Authority, charged with collection of revenue; the CBK which is the government’s
banker and advisor on monetary matters; and the Ministry of Finance. The Treasury, in the
Ministry of Finance, is identified by the Constitution as having delegated powers to propose
measures to raise and allocate resources. Besides being the lead player in the budget process,
Treasury is responsible for overseeing budget formulation, execution, collection and custody of
revenues and expenditure management. The Ministry of Finance provides support to Treasury
function and is responsible for implementing policies, programs and projects which support all
ministries and other government agencies (Institute of Economic Affairs, 2008).
Parliament
The Parliament is the sole authority on taxation, borrowing, and spending of public funds. The
constitution empowers the parliament to approve the measures proposed by the Minister for
Finance to raise government revenue and also the expenditure of the revenue collections.
Parliament is also expected to provide assurance to Kenyans that the systems employed by the
executive to mobilize, allocate and utilize resources are effective and that the executive is not
compromised either internally or externally. The parliament, therefore, occupies a central place
in the budgeting process. Parliament also acts as the citizens’ representatives, therefore
ensuring the Executive operates according to the principle of “no taxation without
representation” as well as the principle of separation of powers (ibid.).
To deal with the budget, Parliament has three key standing committees; the Fiscal Analysis and
Appropriations Committee (FACC), the Public Accounts Committee (PAC) and the Public
Investment Committee (PIC). The FACC was established in 2006 with the responsibility of
scrutinizing policies that drive the budget, tax proposals, resource allocations and budget
execution. Both PAC and PIC are long established institutions which deal with overall budget
outcomes. That is, whether budgeted expenditures are utilized according to parliamentary
authority and approval and whether they are compliant with the law and procedures. In
addition, there are currently eight Departmental Committees of Parliament, which play
complementary roles by scrutinizing the budgets of specific ministries and sectors that fall
within their mandates. All these Committees are required to report to Parliament and make
specific recommendations on their mandates (ibid.).
Non-state players
Among the key players in the budgeting process are the well-organized and informed major
economic actors, including associations like the Kenya Associations of Manufacturers (KAM),
Kenya Private Sector Alliance (KEPSA), Institute of Certified Public Accountants of Kenya
(ICPAK), Farmers Association and a host of NGOs, among others. They make submissions to the
Finance Minister on various fiscal issues, i.e., on expenditure and taxation, mainly on matters
that concern them ((Ibid. p.) Many health-focused CSOs are also involved in budget tracking
and advocacy, but they are not engaged at the macroeconomic policy level.

____________________________________________________________________________________________________________________________________________________________________________
EEvviiddeennccee ooff TThhee IImmppaacctt ooff IIMMFF FFiissccaall aanndd MMoonneettaarryy PPooll iicciieess oonn tthhee CCaappaaccii ttyy ttoo AAddddrreessss HHIIVV//AAIIDDSS aanndd TTBB CCrriisseess iinn KKeennyyaa
27
3.4 The budgeting process
The budgeting process is depicted in the Figure 3.1, with the discussions on the process
provided below.
Figure 3.1: MTEF process
Budget outlook paper (BOPA)
Budget Outlook Paper and MTEF guidelines– 1st draft
Budget Outlook Paper Stakeholder WorKshsop
Budget Outlook Paper finalised
MPER draft report format
MPER submission from each ministry
MPER SWG submission
BOP, MTEF guidelines, revised budget call circular all issued
Review of sectoralpriorities by MoF, MPND Estimates by all ministries
Sector Hearings
Finalisation of RevisedEstimates
Budget Strategy Paper
Stakeholder Consultations
Consultative Group Meeting
BSP to Cabinet
Each ministry submits itemised budget
Itemised budget to Treasury
Budget to Cabinet
2 4
53
6
7
8
9
10
11
12
Sep
Oct
Nov
Dec
Dec
Jan
Feb
Feb
Feb/Mar
Mar
Apr
Apr
Apr
May
May
District level inputs to MPND and ministries 1
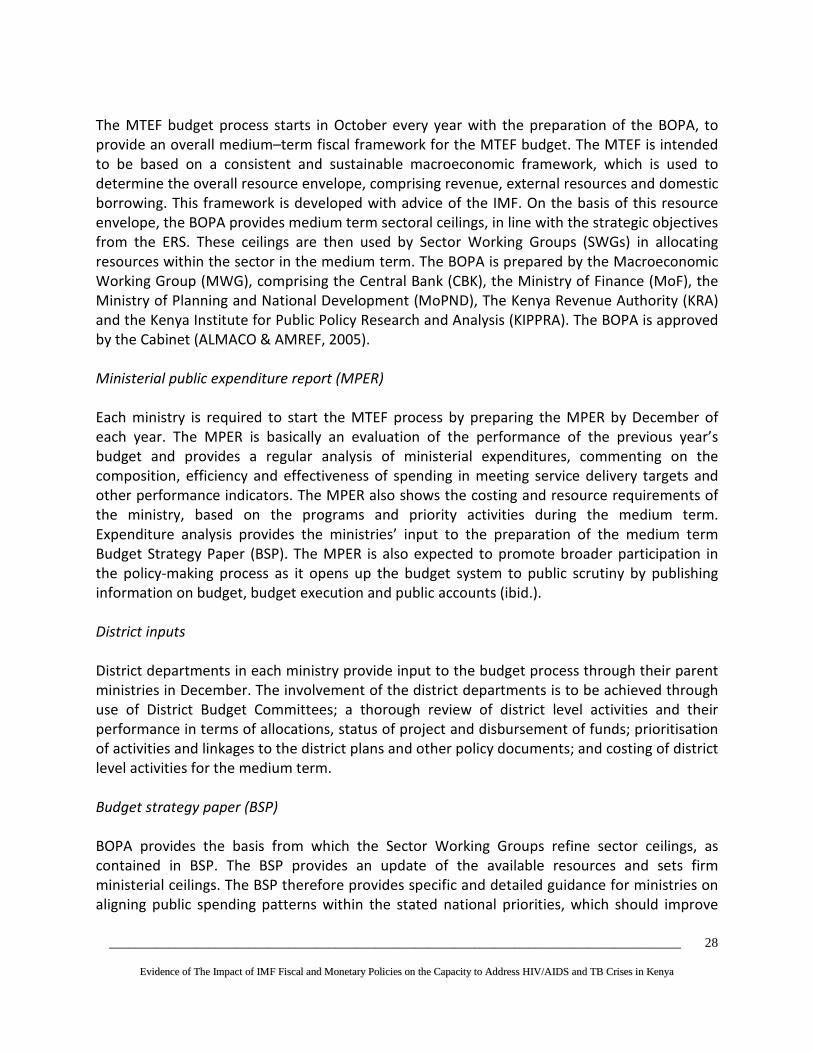
____________________________________________________________________________________________________________________________________________________________________________
EEvviiddeennccee ooff TThhee IImmppaacctt ooff IIMMFF FFiissccaall aanndd MMoonneettaarryy PPooll iicciieess oonn tthhee CCaappaaccii ttyy ttoo AAddddrreessss HHIIVV//AAIIDDSS aanndd TTBB CCrriisseess iinn KKeennyyaa
28
The MTEF budget process starts in October every year with the preparation of the BOPA, to
provide an overall medium–term fiscal framework for the MTEF budget. The MTEF is intended
to be based on a consistent and sustainable macroeconomic framework, which is used to
determine the overall resource envelope, comprising revenue, external resources and domestic
borrowing. This framework is developed with advice of the IMF. On the basis of this resource
envelope, the BOPA provides medium term sectoral ceilings, in line with the strategic objectives
from the ERS. These ceilings are then used by Sector Working Groups (SWGs) in allocating
resources within the sector in the medium term. The BOPA is prepared by the Macroeconomic
Working Group (MWG), comprising the Central Bank (CBK), the Ministry of Finance (MoF), the
Ministry of Planning and National Development (MoPND), The Kenya Revenue Authority (KRA)
and the Kenya Institute for Public Policy Research and Analysis (KIPPRA). The BOPA is approved
by the Cabinet (ALMACO & AMREF, 2005).
Ministerial public expenditure report (MPER)
Each ministry is required to start the MTEF process by preparing the MPER by December of
each year. The MPER is basically an evaluation of the performance of the previous year’s
budget and provides a regular analysis of ministerial expenditures, commenting on the
composition, efficiency and effectiveness of spending in meeting service delivery targets and
other performance indicators. The MPER also shows the costing and resource requirements of
the ministry, based on the programs and priority activities during the medium term.
Expenditure analysis provides the ministries’ input to the preparation of the medium term
Budget Strategy Paper (BSP). The MPER is also expected to promote broader participation in
the policy-making process as it opens up the budget system to public scrutiny by publishing
information on budget, budget execution and public accounts (ibid.).
District inputs
District departments in each ministry provide input to the budget process through their parent
ministries in December. The involvement of the district departments is to be achieved through
use of District Budget Committees; a thorough review of district level activities and their
performance in terms of allocations, status of project and disbursement of funds; prioritisation
of activities and linkages to the district plans and other policy documents; and costing of district
level activities for the medium term.
Budget strategy paper (BSP)
BOPA provides the basis from which the Sector Working Groups refine sector ceilings, as
contained in BSP. The BSP provides an update of the available resources and sets firm
ministerial ceilings. The BSP therefore provides specific and detailed guidance for ministries on
aligning public spending patterns within the stated national priorities, which should improve

____________________________________________________________________________________________________________________________________________________________________________
EEvviiddeennccee ooff TThhee IImmppaacctt ooff IIMMFF FFiissccaall aanndd MMoonneettaarryy PPooll iicciieess oonn tthhee CCaappaaccii ttyy ttoo AAddddrreessss HHIIVV//AAIIDDSS aanndd TTBB CCrriisseess iinn KKeennyyaa
29
the efficiency of public spending in the forthcoming budget and over the following two years
(ibid.).
Public/sector hearings
One major improvement in the MTEF process is the introduction of public/sector hearings,
which are held soon after the preparation of the BSP. The purpose of the public/sector hearings
is to provide a forum where various stakeholders engage in a debate about the BSP and
propose amendments they deem necessary before the BSP is presented to the cabinet for
approval. The BSP is disseminated to stakeholders and civil society in February through public
sector hearings organised by the Ministry of Finance. During the public hearings, the SWGs
present their budgets and comments are invited from the participants. The suggestions may be
used to improve the budget. Theoretically, this can result in an adjustment of sector ceilings or
allocations (if deemed warranted). After the public hearings, views are consolidated, and the
BSP is printed and submitted to the Cabinet for discussion and approval. Based on the approved
BSP, The Permanent Secretary, Ministry of Finance issues the Treasury Circular to
ministries/Departments to prepare detailed and itemised budgets, based on the ceilings set in
the BSP (ibid.).
Ministerial budgets
Between December and February, Ministries/Departments are involved in consultations with
the SWGs. The Treasury and other stakeholders are involved in negotiations that lead to a level
of resource requirements that satisfy the BSP ceilings. In March, the Treasury Circular, together
with the BSP and ceilings, are issued to all ministries, which are in turn expected to prepare
detailed annual and medium term estimates consistent with the BSP and submit the itemised
budgets to the Treasury by mid-April. The responsibility for preparing the ministerial budget lies
with the Ministerial MTEF Budget Committee. The ministry receives the budget circular from
the Treasury, which sets the budget ceiling for each sector and ministry, and the calendar for
preparing the budget. Based on the ceilings, the ministerial budgets are prepared by
departments and consolidated by the Ministerial Budget Committee, approved by the PS and
submitted to the Treasury (ibid.).
Final estimates
The Treasury receives detailed ministerial budgets, consolidates them in April and submits the
national budget to the Cabinet for approval in May. The annual estimates are then presented to
Parliament for debate in mid-June. Once the Minister of Finance has presented the budget to
Parliament, it becomes Parliament business. If Parliament passes the budget, the ministry can
proceed and implement it.

____________________________________________________________________________________________________________________________________________________________________________
EEvviiddeennccee ooff TThhee IImmppaacctt ooff IIMMFF FFiissccaall aanndd MMoonneettaarryy PPooll iicciieess oonn tthhee CCaappaaccii ttyy ttoo AAddddrreessss HHIIVV//AAIIDDSS aanndd TTBB CCrriisseess iinn KKeennyyaa
30
3.5 Transparency of IMF Program Policies
Before the government subscribed to the PRGF in 2000, IMF policies lacked transparency as the
formulation of the policies was not consultative. The policies used to be drawn by the
Government, IMF and the World Bank. However, with the development of the PRSP (2001-
2003) and the ERS, there was an improvement in transparency in terms of the way IMF policies
were formulated. In terms of availability of policy documents, it is imperative to note that a
number of policy documents such as PRSPs, which make reference to the IMF policies that were
decided elsewhere (outside of the PRSP process), are available in their final form on Treasury’s
website and the IMF website. Civil society consultations for inputs into the PRSP document do
not discuss the macroeconomic framework or propose possible alternative macroeconomic
policies. Furthermore, other documents related to Kenya’s PRGF loan program with the IMF,
such as the Letters of Intent (LOIs), are also available at the IMF website, but only after the
finance ministry has already signed.
Although there has been some improved transparency in the formulation of the IMF’s policies,
it is important to note that the process of determining inflation-reduction targets, deficit-
reduction targets and wage bill ceilings is still not transparent. They are based on a
macroeconomic framework that is only known to IMF and Kenya’s Macroeconomic Working
Group (MWG) at the Ministry of Finance.
Another contentious issue in terms of transparency relates to the failure by the IMF and the
MWG to avail macroeconomic policy documents to key stakeholders including officials at the
Ministry of Health. As noted earlier, discussions about macroeconomic policy take place within
a narrow circle of officials. This practice aggravates the lack of integration between MoH sector-
level policies, and those of other line ministries, and the overall macroeconomic framework.
Evidence from interviews conducted with key informants suggested that the key objectives and
overall macroeconomic policies, targets, and ceilings decisions involve a very limited number of
key government officials and visiting IMF Mission officials. Other key players such as the
ministry of health, as well as stakeholders outside official circles, often had limited input in the
macroeconomic decisions made. Those interviewed pointed out that decisions on the
macroeconomic policy framework are closed and the role of other stakeholders including
parliamentarians is very limited.
The IMF historically had no official policy on the release and disclosure of key documents
throughout the first 50 years of its history, and was traditionally one of the most secretive
international institutions. Its Articles of Agreement only mandated the publication of an annual
report. Advocacy by civil society organizations and some of the IMF’s member governments
finally started to create change in the late 1990s. The first instance of substantively increased
transparency came in April 1997. Given a country’s agreement, the IMF decided to issue Public
Information Notices (PINs) that summarize the Executive Board’s discussion of oversight reports
on a member’s economy. The IMF’s first wide-ranging information disclosure policy was put
into place in January 2001, and has seen some minor changes since then. Today the IMF’s policy
____________________________________________________________________________________________________________________________________________________________________________
EEvviiddeennccee ooff TThhee IImmppaacctt ooff IIMMFF FFiissccaall aanndd MMoonneettaarryy PPooll iicciieess oonn tthhee CCaappaaccii ttyy ttoo AAddddrreessss HHIIVV//AAIIDDSS aanndd TTBB CCrriisseess iinn KKeennyyaa
31
on document disclosure covers the publication of 24 types of documents by the organization. A
range of information is available that can be useful to civil society organizations, parliaments,
media and the general public, including on domestic economic policy, social spending, and
international relations (IMF 2005). Despite progress in recent years, there remain serious
limitations and restrictions on the publication of key documents and decision-making
procedures that fall short of compliance with modern standards of governance and
transparency that are expected of public institutions. There is also increasingly a divide
between developed and developing countries over transparency, as industrialized economies
publish more of their documents than developing countries. Industrial country governments
have accused developing countries of being obstacles to greater transparency.
Concern about the lack of transparency at the IMF and its sister institution, the World Bank, led
to the formation of the Global Transparency Initiative (GTI), which seeks to overcome the
secrecy surrounding the operations of the international financial institutions. The GTI drafted a
Transparency Charter that outlines nine principles that should govern access to information at
the IFIs in order to address this lack of transparency (see Annex 2).
The documents which detail IMF loan programs for low-income and middle-income countries
can contain controversial economic policy changes, which are often binding conditions for
accessing loans, including trade liberalizations, privatizations, liberalization of capital accounts
and banking sectors, as well as fiscal and monetary policy targets that can greatly constrain
growth rates, budget sizes and the levels of wages available for public sector employees.
Despite their importance, these documents and the information they contain are often not
understood by civil society globally. Recently, the GTI produced an extremely useful “Guide for
Civil Society on Getting Access to Information from the IMF” (GTI, 2007) as an attempt to help
civil society learn about which key documents held which kinds of vital information about IMF
loan programs and how to use the information held by the IMF, but also to provide
recommended improvements that could be advocated for which would significantly improve
the IMF's transparency policy.
Despite its recent progress on transparency, the IMF has moved backward in one of the most
important principles contained within the IFI Transparency Charter—that of automatic
disclosure. The first IMF publication policy, created in 2001, contained a protocol for disclosure
of four types of documents, including Letters of Intent and Memorandum of Economic and
Financial Policies. This policy meant that documents would automatically be published unless
countries took a step to block the disclosure. It provided that "if a member does not wish to
consent to Fund publication of a document, the member will need to notify its decision and
provide an explanation." However, the IMF’s 2003 revision of the policy redefined “voluntary
but presumed” to require an explicit written permission from country authorities before a
document can be published. In practice this results in a non-disclosure policy. The new
definition remains in place in the current policy.

____________________________________________________________________________________________________________________________________________________________________________
EEvviiddeennccee ooff TThhee IImmppaacctt ooff IIMMFF FFiissccaall aanndd MMoonneettaarryy PPooll iicciieess oonn tthhee CCaappaaccii ttyy ttoo AAddddrreessss HHIIVV//AAIIDDSS aanndd TTBB CCrriisseess iinn KKeennyyaa
32
The transparency policy does not cover crucial information about the structure, finances and
decision-making processes of the IMF. The IMF does publish information on its structure –
including Articles of Agreement, voting rights, and by-laws – but this is not mandated by its
transparency policy. In addition, the release of information must be separately authorized for
publication, violating the Transparency Charter’s second principle of automatic access.
Publication of information on the IMF’s finances is mandated by the IMF’s Articles of
Agreement.
The IMF transparency policy also clearly states: “Documents may be published under this
decision only after their consideration by the Executive Board" except for a few document
types such as Poverty Reduction Strategy Papers (PRSPs), which are considered country-owned
documents. This is a clear violation of the third principle of the Transparency Charter that
requires that draft documents, at least on some classes of documents, be published in advance
of decisions being taken by the board. This is to allow proper public stakeholder input into the
decision making process before final decisions are made.
The IMF transparency policy also contains further means by which information can be kept
away from the public. The policy makes provisions for the use of “side letters”, which are
strictly confidential, binding agreements between a borrowing country and the IMF containing
conditions and economic policy plans. While member countries may consent to the publishing
of official country documents in relation to a loan from the IMF, they can keep controversial
decisions with regards to government economic policy out of the published version by putting
them in a side letter.
Furthermore, in relation to surveillance and oversight of a country’s economy, the transparency
policy allows for selective “deletions” to take place. Member countries may seek deletions of
two types: “highly market-sensitive material” and “material not in the public domain, on a
policy the country authorities intend to implement, where premature disclosure of the
operational details of the policy would seriously undermine the ability of the member to
implement those policy intentions.” While deletions must be “requested” by the member
country, the IMF does not keep information on the number of deletion requests that are
rejected.
The current IMF transparency policy must be reviewed at least every 36 months, and the IMF
had scheduled its next review to take place before June 2008. However, just as civil society was
taking steps to weigh in on consultations on the scheduled review, the IMF announced it would
be delayed until sometime in 2009 to lighten the workload for the executive board. That leaves
in place unsatisfactory arrangements guaranteeing board secrecy for potentially another two
years (BWP 2007).
3.6 Trends in Government Health Budget Expenditure

____________________________________________________________________________________________________________________________________________________________________________
EEvviiddeennccee ooff TThhee IImmppaacctt ooff IIMMFF FFiissccaall aanndd MMoonneettaarryy PPooll iicciieess oonn tthhee CCaappaaccii ttyy ttoo AAddddrreessss HHIIVV//AAIIDDSS aanndd TTBB CCrriisseess iinn KKeennyyaa
33
Table 4.1 presents a summary of MoH expenditure during the financial years 2000/01 through
2006/07. The Table shows that total government (MoH) spending on health increased steadily
from 2000/01 through 2005/06. The total expenditure rose from about Kshs 12.1 billion in
2000/01 to about Kshs 23 billion in 2005/06 but declined to Kshs 21.1 billion in 2006/07. In the
financial years 2003/04, 2004/05 and 2005/06, the total MoH expenditure grew by increasing
rates of 7.1%, 16.5% and a 20.1% respectively, with a decline in the rate in 2006/07 of 8%. The
total MoH expenditure as a percentage of GDP was 1.44%, 1.65% and 1.49% in the FY 2000/01,
2001/02 and 2002/03 respectively. It declined to 1.37% in 2003/04 but slightly increased to
1.42% and 1.51% respectively in the FY 2004/05 and 2005/06. It decreased, however, to a low
of 1.23% in 2006/07 financial year. It is evident that the MOH expenditure as a percentage of
total GDP has been erratic and unpredictable.
It also shows that in the five years of the ERS, the per capita MoH expenditure generally
increased. It grew from Kshs 487.86 in 2002/03, to Kshs 646.26 in 2005/06, but declined to Kshs
576.45 in the 2006/07. The WHO Commission on Macroeconomics and Health and the UN
Millennium Project suggest that a basic effective public health system would require a
minimum level of spending of around US$40 per head (at current prices).
Table 3.5: Ministry of health actual expenditure
2000/01 2001/02 2002/03 2003/04 2004/05 2005/06 2006/07
Recurrent
Kshs
(million) 11,041 12,715 14,405 15,438 17,417 19,765 18,652
US
(million) 147 170 192 206 232 264
249
Development
Kshs
(million) 1,032 2,519 945 1,003 1,741 3,242 2,475
US
(million) 14 34
13 13 23 43
33
Total MoH
expenditure
Kshs
(million) 12,072 15,234 15,351 16,441 19,158 23,007 21,127
US
(million) 161 203 205 219 255 307
282
Per Capita MoH expenditure 395.49 488.44 481.97
487.86
552.90
646.26
576.45
Recurrent expenditure
growth 15% 13% 7% 13% 13% -6%
Total MoH expenditure
growth 26% 1% 7% 17% 20% -8%
MoH recurrent as % of total
ministries’ recurrent 7.7% 8.2% 8.7% 7.8% 7.7% 7.9% 7.1%
MoH development as % of
total ministries’
development 4.5% 17.2% 5.1% 2.8% 2.0% 5.3% 2.4%
Total MoH expenditure as % 7.2% 9.0% 8.3% 7.0% 6.1% 7.4% 5.8%

____________________________________________________________________________________________________________________________________________________________________________
EEvviiddeennccee ooff TThhee IImmppaacctt ooff IIMMFF FFiissccaall aanndd MMoonneettaarryy PPooll iicciieess oonn tthhee CCaappaaccii ttyy ttoo AAddddrreessss HHIIVV//AAIIDDSS aanndd TTBB CCrriisseess iinn KKeennyyaa
34
of total government
expenditure
Total MoH expenditure
(gross) as % of GDP 1.44% 1.65% 1.49% 1.37% 1.42% 1.51% 1.23%
Source: Ministry of Health’s PER 2007, QBR 4th quarter 2005/06 and 4th quarter 2006/07, and own
calculation. The GDP values and population figures used were for the years 2003, 2004, 2005, 2006 and
2007, and were obtained from the Economic Survey of 2008.
Note: An average exchange rate of Kshs 75 per US $1 used for each of the financial years.
3.7 Trend in HIV/AIDS Expenditure
The financing of HIV/AIDS interventions has relied heavily on the donor community. The
analysis of total expenditure on HIV/AIDS response in Kenya by major sources of finance during
2004/05, 2005/06 and 2006/07 financial years4, is presented in Tables 4.2 and 4.3. Table 4.2
shows a total amount of Kshs 12.5 billion was spent on HIV/AIDS interventions. In 2005/06, a
total of Kshs 11.5 billion was spent on interventions, an amount equivalent to about 0.8% of
GDP at current market prices and equivalent to approximately 80% of total expenditures for the
Ministry of Health (recurrent and development). In 2006/07 financial year, expenditures on
HIV/AIDS interventions from major sources more than doubled, totaling Kshs 23.4 billion, which
was equivalent to 1.3% of GDP and about 85% of total MOH actual expenditures. Although
expenditure data on some sources were not collected for the years 2005/06 and 2006/07,
these sources together contribute only about 3 % of the expenditure in 2004/05.
As shown in Table 4.4 and Figure 4.1, the bulk of HIV/AIDS funding came from international
sources. In 2006/07, funding from bilateral sources amounted to about 93.7% of total HIV/AIDS
resources, mainly because of the rapid increase in financial resources from PEPFAR, which are
mostly off-budget. Government contribution is minimal, accounting for about 2% of total
HIV/AIDS funding.
Table 3.6: HIV/ AIDS expenditures by specific sources
SOURCES 2005/06 2005/06
2006/07
Kshs (million) US $ (million) Kshs (million)
US $
(million) Kshs (million)
US $
(million)
GOK 219 3 581 8 270 4
PEPFAR 6,977 93 7,421 99 16,692 223
JICA 1,030 14 1,234 16 4,172 56
DFID 692 9 609 8 1,062 14
SIDA 81 1 No record No record No record No record
EU 24 0 No record No record No record No record
UNDP 1 0 9 0 4 0
4 Accounts reported in financial years running from July 2005 to June 2006 and July 2006 to June 2007

____________________________________________________________________________________________________________________________________________________________________________
EEvviiddeennccee ooff TThhee IImmppaacctt ooff IIMMFF FFiissccaall aanndd MMoonneettaarryy PPooll iicciieess oonn tthhee CCaappaaccii ttyy ttoo AAddddrreessss HHIIVV//AAIIDDSS aanndd TTBB CCrriisseess iinn KKeennyyaa
35
UNODC 5 0 15 0 15 0
UNICEF 85 1 3 0 3 0
UNFPA 149 2 No record No record No record No record
UNHCR 26 0 No record No record No record No record
UNIFEM 4 0 No record No record No record No record
WFP 100 1 No record No record No record No record
WHO 48 1 No record No record No record No record
FAO 3 0 No record No record No record No record
World Bank 1,907 25 - - 4 0
GLOBAL Fund 1,111 15 1,207 16 1,160 15
CLINTON
FOUNDATION - - 415 -
No record No record
OTHERS 13 0 18 0 14 0
Total 12,475 166 11,511 153 23,396 312
Source: Kioko et al. (2007); Korir and Nzoya, 2008.
Note: An average exchange rate of Kshs 75 per US $1 used for each of the financial years.
Table 3.7: Expenditure by major sources of funding
2004/05 2005/06 2006/07
Source of Funding Kshs (million) US $ (million) Kshs (million) US $ (million) Kshs (million) US $ (million)
GOK 219 2.92 581.17199 7.74896 270.26799 3.603573
Bilateral 8804 117.3867 9263.4469 123.5126 21925.897 292.3453
Multilateral 2327.97 31.0396 26.384144 0.351789 25.724056 0.342987
Global Fund 1111 14.81333 1207.4221 16.09896 1160.2337 15.46978
Others (international) 13 0.173333 432.49 5.766533 14.02 0.186933
Total 12474.97 166.3329 11510.915 153.4789 23396.142 311.9486
Source: Kioko et al. (2007); Korir and Nzoya, 2008.
Note: An average exchange rate of Kshs 75 per US $1 used for each of the financial years.

____________________________________________________________________________________________________________________________________________________________________________
EEvviiddeennccee ooff TThhee IImmppaacctt ooff IIMMFF FFiissccaall aanndd MMoonneettaarryy PPooll iicciieess oonn tthhee CCaappaaccii ttyy ttoo AAddddrreessss HHIIVV//AAIIDDSS aanndd TTBB CCrriisseess iinn KKeennyyaa
36
Figure 4.1: Contribution of HIV/AIDS funds by source (2004/2005 –006/07)
GOK1.16%
BILATERAL93.72%
MULTILATERAL 0.11%
GLOBAL FUND4.96% OTHER
INTERNATIONAL0.06%
3.8 Estimated Resource Requirements for HIV/AIDS Response
According to the Republic of Kenya (2005, KNASP) the cost of implementing the KNASP was
estimated to increase from Kshs 25 billion in 2005/06 to Kshs 45 billion in 2009/2010. Of this
total, 30% was allocated to prevention; 27% to improving the quality of life of those infected
and affected; 27% to mitigation of socio-economic impact; and 16% to support services (see
Table 4.4). The KNASP 2005/6-2009/10 estimated that approximately Kshs 25 billion would be
required in the year 2005/06 to finance various HIV and AIDS interventions. The financing
requirement was projected to increase to Kshs 30.74 billion in the year 2006/07. The
expenditures for the years 2005/06 and 2006/07 indicate that the requirements in the KNASP
were not achieved, even though expenditures by private sector and households were not
included. These two sources do not contribute a significant amount of financial resources to the
interventions contained in the strategy (see Figure 4.3). Figure 4.2 shows that there was a
significant closing of the gap in the year 2006/07, due to funds from PEPFAR (NACC, 2008,
UNGASS), although the expenditure lagged behind the requirement. Out of the over 40 billion
KSHS required to adequately fight HIV/AIDS in 2006/07, only 23 billion was spent, leaving a
funding shortfall of 17 billion or over 42.5%. This was mainly due to a lack of funds.
Table 3.8: Estimated financing requirements5 (Kshs. millions)
2005/06 2006/07 2007/08 2008/09 2009/10
PREVENTION
Youth focused interventions 1017 1416 1853 2341 2883
5 Constant 2005/06 prices
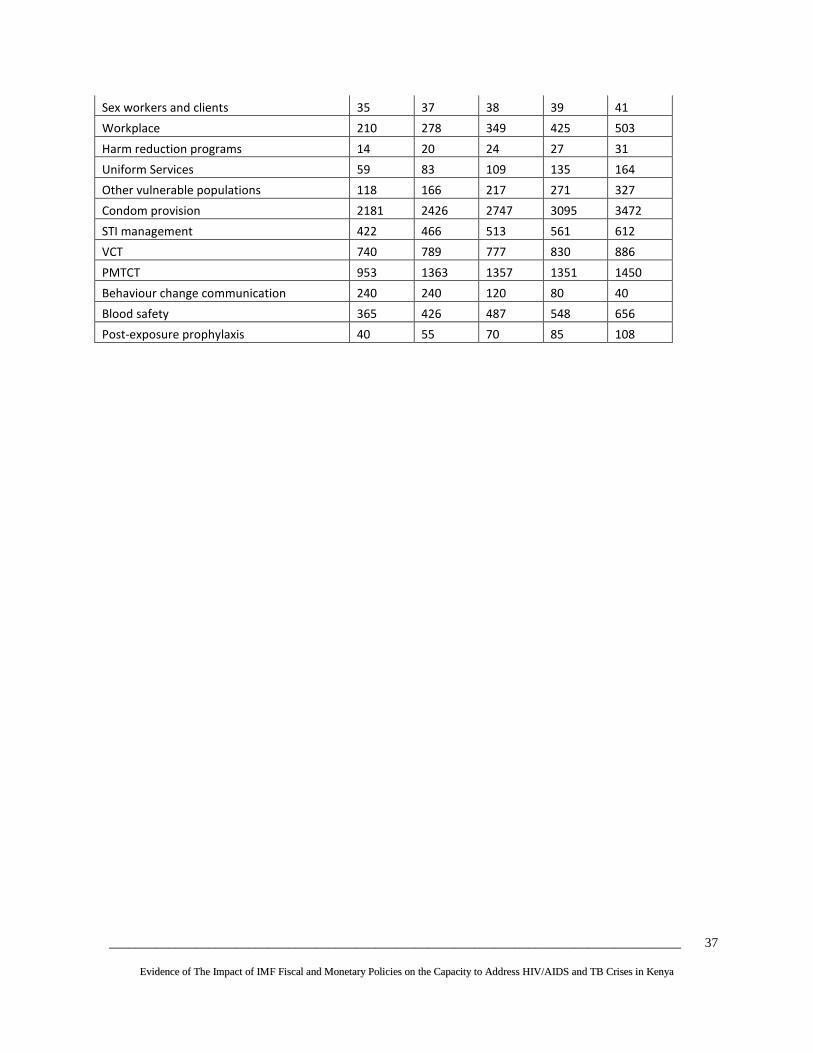
____________________________________________________________________________________________________________________________________________________________________________
EEvviiddeennccee ooff TThhee IImmppaacctt ooff IIMMFF FFiissccaall aanndd MMoonneettaarryy PPooll iicciieess oonn tthhee CCaappaaccii ttyy ttoo AAddddrreessss HHIIVV//AAIIDDSS aanndd TTBB CCrriisseess iinn KKeennyyaa
37
Sex workers and clients 35 37 38 39 41
Workplace 210 278 349 425 503
Harm reduction programs 14 20 24 27 31
Uniform Services 59 83 109 135 164
Other vulnerable populations 118 166 217 271 327
Condom provision 2181 2426 2747 3095 3472
STI management 422 466 513 561 612
VCT 740 789 777 830 886
PMTCT 953 1363 1357 1351 1450
Behaviour change communication 240 240 120 80 40
Blood safety 365 426 487 548 656
Post-exposure prophylaxis 40 55 70 85 108

____________________________________________________________________________________________________________________________________________________________________________
EEvviiddeennccee ooff TThhee IImmppaacctt ooff IIMMFF FFiissccaall aanndd MMoonneettaarryy PPooll iicciieess oonn tthhee CCaappaaccii ttyy ttoo AAddddrreessss HHIIVV//AAIIDDSS aanndd TTBB CCrriisseess iinn KKeennyyaa
38
Table 3.8: Estimated financing requirements6 (Kshs. millions) continued
IMPROVING OF QUALITY OF LIFE
Home-based care 265 323 345 380 423
Palliative care 163 217 116 158 176
Diagnostic testing 78 95 113 130 147
Treatment of opportunistic infections 1668 1712 1364 1384 1249
OI prophylaxis 117 163 212 261 314
Lab HAART 55 93 139 173 216
ARV therapy 4000 5231 7458 8352 9357
Training 27 39 57 69 81
Nutritional support 133 164 259 299 357
Protection of Human Rights 723 795 835 835 835
MITIGATION OF SOCIO-ECONOMIC IMPACT
Mitigation policy 883 1076 724 808 1352
Mitigation advocacy 1261 1537 1087 808 451
Livelihood and social security 1261 1537 1087 1213 1352
Mitigation programs 3153 3842 6881 8287 9236
Community empowerment 757 922 724 808 901
Human resource planning 252 307 362 202 225
Provision of support services 5311 6303 6203 6025 6627
Overall total (Kshs. million) 25226 30737 36218 40424 45054
Overall total (US$ million) 315 384 453 505 563
Source: Republic of Kenya, 2005.
3.8.1 Budget Ceilings
Budget and wage ceiling were introduced in Kenya as part of the MTEF process in 2000
(ALMACO & AMREF, 2005). Budget ceilings are set at the sector and ministerial level. The
sectoral ceilings are set by the MWG, to inform ministerial ceilings which are set by the SWG.
The ministerial budget ceilings in any sector cannot exceed the sectoral budget ceilings.
In the fiscal period 2003/04, 2004/05 and 2005/06, ceilings were set on eight sectors:
agriculture and rural development, physical infrastructure, general economic service, public
safety, law and order, public administration, health, education, and national security. During
the fiscal years 2006/07, 2007/08 and 2008/09 these sectors were reclassified as nine separate
sectors. Table 4.5 shows the sectors’ ceilings during the years 2006/07, 2007/08 and 2008/09.
The tables shows that the ceiling for the health sector increased from Kshs 35.048 billion in
2006/07 to Kshs 38.929 billion in 2007/08 but decline slightly to Kshs 37.400 billion in 2008/09.
6 Constant 2005/06 prices

____________________________________________________________________________________________________________________________________________________________________________
EEvviiddeennccee ooff TThhee IImmppaacctt ooff IIMMFF FFiissccaall aanndd MMoonneettaarryy PPooll iicciieess oonn tthhee CCaappaaccii ttyy ttoo AAddddrreessss HHIIVV//AAIIDDSS aanndd TTBB CCrriisseess iinn KKeennyyaa
39

____________________________________________________________________________________________________________________________________________________________________________
EEvviiddeennccee ooff TThhee IImmppaacctt ooff IIMMFF FFiissccaall aanndd MMoonneettaarryy PPooll iicciieess oonn tthhee CCaappaaccii ttyy ttoo AAddddrreessss HHIIVV//AAIIDDSS aanndd TTBB CCrriisseess iinn KKeennyyaa
40
Table 3.9: Sectoral budget ceilings
2006/07 2007/08 2008/09
Kshs
(million)
US $
(million) Kshs (million) US $ (million)
Kshs
(million)
US $
(millio
n)
Agriculture and rural
development
24
0.32 30 0.39 38
0.50
Education
108
1.44 119 1.59 131
1.75
General economic service
11
0.15 12 0.16 -
-
Health
35
0.47 39 0.52 37
0.50
National security
33
0.44 38 0.51 43
0.58
Physical infrastructure
81
1.08 119 1.59 111
1.48
Public administration
45
0.60 50 0.66 43
0.57
Public safety law and order
54
0.72 57 0.76 58
0.77
Information communication and
technology
2
0.03 2 0.03 6
0.08
Manpower and special programs
- - - - 17
-
TOTAL
394
5.25 466 6.21 485
6.46
Source: Budget strategy paper 2006, Budget outlook paper 2007, and Budget outlook paper 2008.
The SWGs convene and determine the ministerial ceilings using information from the BOPA
ceilings and MPER; these ceilings take into account available resources and viable strategies to
achieve the government’s medium-term strategic objectives (ALMACO & AMREF, 2005).
Because the Ministry of Health is a separate sector, the ministerial ceiling is done within the
ministry, with the Department of Planning and Policy taking the lead. Though the Ministry of
Health determines its own ministerial ceiling, it is constrained by the sector’s ceiling. However,
it does not influence the sector’s ceiling as it is not directly represented in the MWG.
Nevertheless, ALMACO and AMREF (2005) point out that the ministry can still influence its
ceilings in the preparation of its strategic plans that clearly show their priorities, on the basis of
which budgetary allocations will be made; the MPER process provides ministries with the
opportunity of influencing the level of ceilings they are allocated; ministries are given an
opportunity to negotiate with the Treasury on the sector and ministerial ceilings in the course
of the MTEF process. Both the BOPA and the BSP ceilings can be reviewed on the basis of
ministerial presentations; and the Treasury has given explicit instructions to ministries to
include district’s programs and activities and forward them for incorporation in the BSP.

____________________________________________________________________________________________________________________________________________________________________________
EEvviiddeennccee ooff TThhee IImmppaacctt ooff IIMMFF FFiissccaall aanndd MMoonneettaarryy PPooll iicciieess oonn tthhee CCaappaaccii ttyy ttoo AAddddrreessss HHIIVV//AAIIDDSS aanndd TTBB CCrriisseess iinn KKeennyyaa
41
IMF polices have continued to restrict budgetary allocations to the health sector. The Funds
policies affect the resource envelope that is available to the government for apportionment to
all of the sectors, including the health sector. According to interviews at the Treasury, the
resource envelope is made up of projected revenue, proceeds from privatization of state
enterprises, and concessional loans. The restrained resource envelope causes restricted
allocations to the individual sectors, accomplished through the setting of sectoral ceilings. The
IMF is not directly involved in the setting of the sectoral ceilings.
The need to maintain low rates of interest is the reason behind the need to reduce the deficit.
When the government borrows heavily in the domestic economy, interest rates increase as the
price of treasury bills grow, driving up the price of credit in the economy. In this case the
government would crowd out private investment, which is very critical in expanding productive
capacity in the economy. A casual observation lends support to this assertion in the case of
Kenya. In the last five years, the restricted government borrowing in the domestic economy
saw interest rates on loans fall. Furthermore, by reducing avenues available to commercial
banks to make huge profits, it forced the commercial banks to undertake aggressive campaigns
to “sell” loans to private individuals and firms. In spite of the positive benefits of reducing the
deficit, it is not clear whether different deficit scenarios have been considered in setting the
deficit targets that Kenya has been pursuing.
Though budget allocations to the Ministry of Health in the last five years have increased, the
ministry is still under funded. Although total government spending on health rose substantially
during the five-year period from 2001/02 through 2005/06, increasing from Kshs 15.2 billion in
2001/02 to Kshs 23 billion in 2005/06, the total amount of resource allocation as a percentage
of either gross domestic product or government spending has not increased. As a percent of
total government recurrent expenditure, public heath spending in fact declined slightly over the
period, being 8.23% in 2001/02 and 6.29% in 2005/06, though it rose briefly to 8.69 % in
2002/03. As a percent of GDP, total government health spending declined slightly over the
same period, being 1.65 % of GDP in 2001/02 and 1.55 % in 2004/05 of GDP and 1.50% in
2005/06. Actual expenditure falls short of the health sector budget ceiling. For instance, the
ceiling for the year Kshs 35.048 billion while the actual expenditure was Kshs 21.127 billion.
The total health expenditure per capita in Kenya is lower than the required minimum.
According to NHA 2001/02, the per capita health expenditure was US $ 19 in Kenya compared
to a required minimum of US $ 34. The per capita health expenditure has not increased
significantly in recent years (PER, 2006, 2007). The head of the health sector at the World Bank
country office said in an interview that he felt strongly that the government’s budget allocation
to the health sector was too low. He said that this reflected the Bank’s position.
As a result of inadequate resources, services in public health facilities have continued to
deteriorate. Some of the most common challenges include: i) unavailability of essential
medicine in public health facilities; ii) unavailability of doctors in public health facilities because

____________________________________________________________________________________________________________________________________________________________________________
EEvviiddeennccee ooff TThhee IImmppaacctt ooff IIMMFF FFiissccaall aanndd MMoonneettaarryy PPooll iicciieess oonn tthhee CCaappaaccii ttyy ttoo AAddddrreessss HHIIVV//AAIIDDSS aanndd TTBB CCrriisseess iinn KKeennyyaa
42
they are engaged in private practice; iii) patients being referred to private health facilities for
some specialized diagnostic tests; iv) general poor state of the services in public health facilities.
The MoH is the main provider of health services to a majority of Kenyans, especially the poor
and its ability to serve those in poverty is constrained by inadequate funding. Despite the fact
that the public sector serves most of poor, the government introduced user fees in MoH
facilities as a way of raising additional financial resources. It has been found that these fees
have had a negative effect on utilization of health services in government facilities, with the
poor being disproportionately affected. PER 2007 indicates that the need for cash payments in
order to receive health care compounded the population’s already inadequate access to health
facilities.
3.8.2 Wage Bill Ceilings
The policy of wage bill restrictions may be traced back to the implementation of the IMF
structural readjustment program and is the government’s current policy. Although the wage bill
ceiling is no longer a benchmark considered by the IMF, the Kenyan government continues its
implementation in order to maintain restrictive fiscal and monetary policies.
Table 4.6 shows that, during the financial year 2007/07, the educational sector had the highest
wage bill ceiling (67.02%) followed by public safety, law and order (60.47%) and the health
sector (51.22%), among others.
Table 3.10: Absolute and percent wage bill ceilings 2006/07
Sectors
Wages
Net recurrent
expenditure ceiling
% of
sectoral
recurrent
expenditure
ceiling
Kshs
(million)
US $
(million)
Kshs
(million)
US $
(million)
Agriculture and rural
development 6,206 83 14,112 188 43.98%
Education 64,580 861 96,360 1,285 67.02%
General economic service 2,150 29 7,116 95 30.21%
Health 10,784 144 21,054 281 51.22%
National security
- -
- -
-
Physical infrastructure 3,790 51 7,587 101 49.95%
Public administration 7,640 102 28,475 380 26.83%
Public safety law and order 22,320 298 36,912 492 60.47%
Information communication and 493 7 1,471 20 33.51%
____________________________________________________________________________________________________________________________________________________________________________
EEvviiddeennccee ooff TThhee IImmppaacctt ooff IIMMFF FFiissccaall aanndd MMoonneettaarryy PPooll iicciieess oonn tthhee CCaappaaccii ttyy ttoo AAddddrreessss HHIIVV//AAIIDDSS aanndd TTBB CCrriisseess iinn KKeennyyaa
43
technology
Source: BSP 2006
Table 4.6 notes that the 51.22% wage ceiling is not significantly different from the actual wage
spending in the sector. For instance, heath sector PER 2007 documents that, for the period
2001/02 through 2005/06, 52.7% of the MoH’s recurrent expenditure was on personnel
emoluments, 7.5% spent on operations and maintenance, about 3% on purchases of plants and
equipment, about 10.5% on drugs and medical supplies, and about 26.4% on “transfers” to
MOH parastatals.
Government policy, through its use of wage ceilings, has adversely affected the health sector.
Though a 52% wage bill over recurrent expenditure seems relatively high, the public health
sector has been experiencing a shortage of human resources due to the restricted total
recurrent expenditure, as informed by the IMF’s restrictive macroeconomic framework. This
suggests that the overall allocation to the public health sector is not adequate. In addition
Kenya faces a variety of health personnel problems, including an inadequate number of
personnel in key areas of the health sector, an inequitable distribution of those health
personnel who are available, and an attrition of trained personnel from the health sector and
from the country. These problems are even more daunting when seen in the light of the
additional health facilities that are being put up under constituency development fund (CDF),
with the expectation that the MoH will staff and equip them (Republic, 2007b).
3.8.3 Civil Service Reform Programme
The civil service reform program, which entails a reduction in civil service expenditures and a
freeze on public sector employment, started in 1993. The government implemented this policy
under both the ESAF and the PRGF programs. Civil service reform attempted to reduce the
overall size of the civil service, to contain costs, and to improve the civil service’s efficiency by
bettering working conditions. The reform involved departures from the civil service via regular
attrition or a voluntary retirement program. Additionally, a substantial reduction in the total
number of civil servants would be achieved through limits on new hiring (Republic of Kenya,
1996). The civil service reform has adversely affected delivery of services. Due to a lack of new
nurses, clinical officers and paramedical staff, available health personnel cannot provide
adequate health services at public facilities. An interview with a key respondent at Division of
TB and Leprosy (DTLP) revealed that one of the factors limiting the testing and diagnosis of TB
in Kenya is the shortage of laboratory technologists and technicians.
Human resource mapping for the year 2005 revealed that despite a necessary staff
establishment of 44,813, only 35,627, or 80 percent, of the posts were filled. The personnel
shortage could not be filled given the embargo on new staff under IMF policies. The Minister
for Medical Services, however, recently said that the ministry will employ about 6,000
additional health workers in 2008.

____________________________________________________________________________________________________________________________________________________________________________
EEvviiddeennccee ooff TThhee IImmppaacctt ooff IIMMFF FFiissccaall aanndd MMoonneettaarryy PPooll iicciieess oonn tthhee CCaappaaccii ttyy ttoo AAddddrreessss HHIIVV//AAIIDDSS aanndd TTBB CCrriisseess iinn KKeennyyaa
44
Brain drain in Kenya has been linked to wage ceilings, an employment freeze, and low pay..
Kenya, like most African countries, does not meet the WHO’s standard of 1 doctor per 5,000
population. Health personnel are leaving the medical profession for other professions, while
others are joining the private sector or are leaving the country to work in developed countries.
In 2001, it was estimated that 167 medical doctors from Kenya were working in developed
countries, but the number has increased over the years. According to the Ministry of Health,
out of a total of 6000 doctors trained, only 600 are employed in public health hospitals. This is
far below the number required for effective delivery of services. By 2003, over 4000 nurses had
left the country for the United Kingdom or the US. Other effects of brain drain include: i) a
decline in the quality of public health care services; ii) increased workload for the few health
personnel available in the public health facilities; iii) inefficiency in resource utilization including
health infrastructure and; iv) the inability to effectively fight the HIV/AIDS epidemic due to
shortage of trained medical personnel.
____________________________________________________________________________________________________________________________________________________________________________
EEvviiddeennccee ooff TThhee IImmppaacctt ooff IIMMFF FFiissccaall aanndd MMoonneettaarryy PPooll iicciieess oonn tthhee CCaappaaccii ttyy ttoo AAddddrreessss HHIIVV//AAIIDDSS aanndd TTBB CCrriisseess iinn KKeennyyaa
45
CHAPTER FOUR: CONNECTING THE DOTS: HOW IMF POLICIES IMPACT
GOVERNEMENT SPENDING ON HEALTH, HIV/AIDS AND TB
It is important to examine the series of critical connections to see how IMF macroeconomic
policies constrain spending for any particular sector such as health. First, the IMF
macroeconomic policies limit the ability of the economy to grow at higher economic growth
rates and raise more revenues, so overall national budgets are smaller than they otherwise
could be. Second, the IMF policies limit how much deficit spending governments can engage in,
again keeping the overall national budgets smaller than they otherwise could be. Third, the IMF
policies can make it difficult for countries to fully use all of the ODA inflows.
All of these outcomes then lead to smaller national budgets, which in turn translate into smaller
sector budgets and less money for public sector wages. By the time the macroeconomic policies
have been decided, the size and limits of the national budget have largely been determined.
The national budget process and PER do not provide scope for major changes after the
framework has been set. To realize their goals of significantly increased health sector funding in
the future, advocates must seek to change the IMF’s macroeconomic framework.
Critical Review of Main Problems with the Underlying Assumptions of the IMF Macroeconomic
Framework in Kenya
For health advocates, the most important problem to understand is that the policy priorities
that inform the design of Kenya’s macroeconomic framework are to maintain a restrictive
degree of macroeconomic stability as the IMF defines it: inflation at 5 percent per year and
deficits below 3 percent of GDP. Health advocates must be aware that this particular policy
priority subordinates other social goals and, consequently, the IMF’s framework does not allow
for any substantial “scaling up” of ODA inflows or increases in domestic spending of the kind
projected to be needed to achieve the MDGs or fight HIV/AIDS and TB effectively. The current
framework does make room for an adequate scaling up of public investment in the health
sector. If health advocates want to see substantially increased public spending and investment
on health budgets, they will need to get different macroeconomic policies that are informed by
different policy priorities. We must move beyond 30 years of frameworks based on
“stabilization” and adopt new frameworks that will enable a scaling-up in spending and
investment, but this cannot happen until current IMF policy priorities are changed.
This report critically reviewed several fundamental assumptions that underpin the IMF
approach to monetary policy in Kenya that deserve greater public scrutiny by a broader group
of public stakeholders.
1. The IMF makes an assumption that IMF-defined macroeconomic stabilization must take
priority and be constantly maintained thereafter and that this will create the conditions
necessary for higher growth and poverty reduction over the long term. It is assumed that in the

____________________________________________________________________________________________________________________________________________________________________________
EEvviiddeennccee ooff TThhee IImmppaacctt ooff IIMMFF FFiissccaall aanndd MMoonneettaarryy PPooll iicciieess oonn tthhee CCaappaaccii ttyy ttoo AAddddrreessss HHIIVV//AAIIDDSS aanndd TTBB CCrriisseess iinn KKeennyyaa
46
short-term and medium term, the goals of maintaining low deficits and low inflation must take
precedence over achieving the MDGs and fighting AIDS effectively. It is assumed that these
social and health goals will be achieved eventually after a sustained long-term commitment to
maintaining low deficits and low inflation.
According to the assumptions of this orthodox approach, the main monetary policy goal should
be an inflation-focused monetary policy; other important goals, such as rapid economic growth
and employment creation, are seen as inappropriate direct targets of central bank policy.
Therefore, this orthodox approach to monetary policy focuses on stabilization rather than
growth or development, with an implicit assumption that once stabilization is achieved higher
rates of economic growth, employment creation, and poverty reduction will follow. This view
not only specifies the appropriate target of monetary policy, but also the appropriate tools or
instruments. The orthodox approach emphasizes the use of “indirect”, market-based
instruments of policy, such as short-term interest rates, as the primary and often exclusive tool
of monetary policy. This is in contrast to the “direct” quantitative tools often used by central
banks which have involved credit allocation methods, interest rate ceilings, and other ways to
direct credit to priority economic sectors and goals. In short, the IMF-sponsored orthodox
approach has narrowed the goals, options and tools of monetary policy in Kenya.
The IMF approach of targeting very low inflation (often 5 percent or lower) informs the type of
conditionality that the IMF imposes. The IMF states that "conditionality in Fund-supported
programs is intended primarily to ensure that Fund resources are used to support adjustment
toward sustained external viability, and thereby to safeguard the capacity to repay the Fund.
Traditionally, monetary conditionality consists of limits on monetary aggregates - specifically, a
floor is set for the level of net international reserves (NIR) and a ceiling is established on the net
domestic assets (NDA) or on base money” (IMF 2006). Under the standard IMF financial
programming methods, target ceilings are set for central bank monetary and credit expansion
and floors are established on net foreign reserves. The original motivation for these restrictions
was to ensure the ability of countries to reduce their foreign debt and remain solvent, including
the protection of the IMF’s ability to be repaid. Recently the IMF has emphasized other goals
such as reducing inflation, increasing foreign exchange reserves, and "creating room for private
investment."
The IMF is concerned, however, that this NDA-NIR approach could allow for higher inflation if,
for example, larger than necessary increases in net international reserves result from inflows of
capital (including foreign aid) (Epstein 2006). As a result, some IMF programs require a further
tightening of monetary conditions in order to maintain inflation rates in the low single digits.
Financial programming has been used since the 1970s as part of the IMF's lending program to
least developed countries. This programming has now been folded into the PRSP and HIPC
processes without much alteration. The programming uses a set of "identities" and extremely
simple models (or set of assumptions about the structure of the economy) to establish a set of
targets that the IMF will monitor and the government will have to meet in order to receive the
____________________________________________________________________________________________________________________________________________________________________________
EEvviiddeennccee ooff TThhee IImmppaacctt ooff IIMMFF FFiissccaall aanndd MMoonneettaarryy PPooll iicciieess oonn tthhee CCaappaaccii ttyy ttoo AAddddrreessss HHIIVV//AAIIDDSS aanndd TTBB CCrriisseess iinn KKeennyyaa
47
next installment of IMF loans, or qualify for HIPC relief and other donor support (Easterly,
2002).
The typical program connects balance of payments constraints, the government fiscal deficit,
and central bank policy in order to attempt to reduce indebtedness to a sustainable level,
primarily by keeping economic growth in line with likely available foreign resources from export
receipts, aid and capital inflows. Increasingly, reducing inflation into the low single-digits has
become a central focus. Therefore, a central assumptions of these program are (1) that
inflation rates between 10 and 20 per cent are bad for economic growth and reducing inflation
below that level will not reduce economic growth; and (2) that reducing government spending
is good for the economy, because more government spending crowds out private investment.
Regarding the first assumption on inflation, it is important for readers to know that the IMF has
very little empirical evidence in the economics literature to justify pushing inflation down to the
5-7 percent level, with lower growth, lower taxes and lower spending as results. This is often
considered surprising, given the widespread belief that the IMF is the expert on such matters.
While everyone agrees that high inflation is bad and must be brought down, a more relevant
question is how low must inflation be brought and at what level it should be maintained. On
this point, the IMF’s position that inflation must be maintained at the 5-7 percent range is not
backed up by the empirical literature or historical record.
At least 9 major studies have examined this question and have tried to find the “kink” in the
inflation-growth relationship, or at what level inflation begins to hurt a country’s long-term GDP
growth rates: 1) Fischer (1993) found the point to be between 15-30 percent; 2) Bruno (1995)
cites a major unpublished World Bank study of the link between inflation and economic growth
in 127 countries from 1960 to 1992 that found that inflation rates below 20 percent had no
obvious negative impacts for long-term economic growth rates; 3) Barro (1996) found that an
increase by 10 percentage points in the annual inflation rate is associated on impact with a
decline by only 0.24 percent in the annual growth rate of GDP but says nothing about the
disinflation policy targets; 4) Sarel (1996) found the danger point at 8 percent; 5) Bruno and
Easterly (1998) found the danger point to be as high as 40 percent; 6) Ghosh and Phillips (1998),
found inflation-growth relationship is convex, so that the decline in growth associated with an
increase from 10 percent to 20 percent inflation is much larger than that associated with
moving from 40 percent to 50 percent inflation, but this says nothing about disinflation policy
targets; 7) Khan and Senhadji (2001) found the danger point for inflation at between 11
percent-12 percent for developing countries and 1-3 percent for industrialized countries); 8)
Gylfason and Herbertsson (2001) found the danger point for inflation at between 10-20
percent; and 9) Pollin and Zhu (2005) found the danger point to be between 14-16 percent (for
middle and low-income countries).
What these 9 major studies show is that not only do the estimates widely diverge and show
that further research is still needed, but as Pollin and Zhu note, “There is no justification for
inflation-targeting policies as they are currently being practiced throughout the middle- and

____________________________________________________________________________________________________________________________________________________________________________
EEvviiddeennccee ooff TThhee IImmppaacctt ooff IIMMFF FFiissccaall aanndd MMoonneettaarryy PPooll iicciieess oonn tthhee CCaappaaccii ttyy ttoo AAddddrreessss HHIIVV//AAIIDDSS aanndd TTBB CCrriisseess iinn KKeennyyaa
48
low-income countries” (Pollin and Zhu, 2005). The same literature was reviewed by a 2007
study from the Washington-based Center for Global Development which found, “Empirical
evidence does not justify pushing inflation to these levels in low-income countries” (CGD, 2007)
and by the House Financial Services Committee of the US Congress, which wrote to the IMF in
2007, “We are concerned by the IMF’s adherence to overly-rigid macroeconomic targets” and,
“It is particularly troubling to us that the IMF’s policy positions do not reflect any consensus
view among economists on appropriate inflation targets” (Financial Services Committee 2007).
This approach has been the policy for 25 years; it has been effective at stabilization but has
done very poorly at generating higher economic growth that translates into poverty reduction,
job creation and increased public investment as a percent of GDP. While it might seem obvious
that stabilization-focused central bank policy represents the only proper role for central banks,
looking at history casts serious doubt on this claim. Far from being the historical norm, Epstein
(2007) notes this focus by central banks on stabilization to the exclusion of development
represents a sharp break from historical practice, not just in the developing world but also in
the now developed countries as well. In many of the successful currently developed countries,
as well as in many developing countries in the post-Second World War period, development
was seen as a crucial part of the central bank's tasks. Now, by contrast, development has
dropped off the “to-do list” of central banks in most developing countries (Epstein 2006).
This approach underscores why the IMF should not be in the “development business,” is not a
“development organization,” and should not be involved in an ongoing way with LICs. As the
2007 IEO report explained, there were differences of views among the members of the IMF
Executive Board about the IMF’s role and policies in poor countries, and that after more than 7
years after adopting PRSPs and renaming their ESAFs into PRGFs and ostensibly claiming to back
the MDGs, the leadership never gave any indication on how to change any of the
macroeconomic policies to create an scaling-up environment. “Lacking clarity on what they
should do” the IMF staff “tended to focus on macroeconomic stability, in line with the
institution’s core mandate and their deeply ingrained professional culture” (IEO, 2007). If this
approach remains intact, countries will not reduce poverty or achieve the MDGs or get the
health personnel in place needed to fight HIV/AIDS and other diseases.
2. The second assumption, that reducing government spending is beneficial to the economy, is
based on the IMF assumption that increased deficit spending by the government “crowds out”
the limited available credit in the country and limits the ability for further private sector
investment, thereby leading to inflation.
There is little empirical evidence that deficits lead to higher inflation while there is mounting
evidence for the reverse of “crowding out” effect, as noted even by IMF’s Sanjeev Gupta, et al.,
(2006). Depending on the nature of the public investments, public spending can actually have a
“crowding-in” effect that creates new opportunities for private investment (IMF 2006; Roy, et
al, 2006). However, the IMF’s belief in crowding out has led to overly restrictive regulations on
____________________________________________________________________________________________________________________________________________________________________________
EEvviiddeennccee ooff TThhee IImmppaacctt ooff IIMMFF FFiissccaall aanndd MMoonneettaarryy PPooll iicciieess oonn tthhee CCaappaaccii ttyy ttoo AAddddrreessss HHIIVV//AAIIDDSS aanndd TTBB CCrriisseess iinn KKeennyyaa
49
the government’s ability to draw from the limited supply of credit in the economy and restrains
the government’s capacity to finance increased public spending and investment.
3. The IMF’s third major macroeconomic assumption is that inflation can be effectively
controlled by the central bank’s careful restriction and modulation of the growth rate of the
economy’s money supply. However, the empirical evidence shows that in most developing
countries:
• Central banks have influence over a small portion of the money supply—only the
currency and reserves of the banking system;
• Monetary policy is not always effective. Central banks may have limited influence over
all of the multiple factors that contribute to the growth of the money supply (broadly
defined);
• The link between the money supply and inflation is often weak;
• Uncontrollable growth of the money supply will lead to hyper-inflation, but such targets
often cannot “fine tune” low rates of inflation;
• Richer countries (like the US & Europe, Brazil, South Africa) target interest rates, not the
money supply;
• Inflationary pressures in most low-income countries tend to come from price shocks
(food, energy price increases, etc) and therefore monetary policy is not effective in
managing this type of inflation (non-monetary shocks).
• Adopting a tight monetary policy in response to a negative price shock can make the
situation worse, but this is what Kenya is doing in the face of a global economic
downturn;
• Many African countries have a history of fairly stable inflation, so the obsession with the
need to constantly monitor and restrict inflation is misplaced;
• Other IMF reforms (like devaluing the currency) can actually contribute to inflation
4. The IMF’s fourth presumption of the macroeconomic framework is that monetary policy
should be dominant and fiscal policy goals should be limited accordingly in order to allow the
monetary goal to be achieved. This policy approach does not allow developmental fiscal policy
frameworks to be prioritized or realized; fiscal policy must follow the constraints of the adopted
monetary policy. As long as monetary policies are geared for tight stabilization goals, any
“scaling up” of public spending or investment to meet the MDGs or fight HIV/AIDS will be
limited and significant spending increases will not be possible.
5. The IMF’s macroeconomic framework’s fifth major assumption is that inflation-reduction, or
“price stability,” should be the only monetary policy target. This ideological preference of the
monetarist school within neoclassical economics neglects alternate possibilities. According to
the Political Economy Research Institute (PERI) at the University of Massachusetts, different

____________________________________________________________________________________________________________________________________________________________________________
EEvviiddeennccee ooff TThhee IImmppaacctt ooff IIMMFF FFiissccaall aanndd MMoonneettaarryy PPooll iicciieess oonn tthhee CCaappaaccii ttyy ttoo AAddddrreessss HHIIVV//AAIIDDSS aanndd TTBB CCrriisseess iinn KKeennyyaa
50
targets can also be included in the central bank’s mandate. For example, the US Federal
Reserve has targets for inflation as well as employment, and balances the two objectives.
6. A sixth assumption of the macroeconomic framework is that the private-sector will lead in
job creation. The IMF does not address the crisis of unemployment and underemployment in
Kenya, despite the fact that almost all economists agree that the best way to decrease poverty
is to create jobs. The neoclassical assumption, however, is that jobs should be created by the
dynamism of the private sector instead of been provided by the government.
7. A seventh assumption of the macroeconomic framework is that the bond investors in the
open market should set interest rates. According to the IMF, the state should not interfere in
the free market by setting interest rates. This assumption was the basis for the first- generation
IMF reforms in Kenya which called for the gradual liberalization of interest rates. Health
advocates should consider that it is high, market-determined interest rates that prevent
governments from being able to affordably engage in higher deficit finance or health spending.
While Kenya is forced by IMF structural adjustments to accept high, market-determined
interest rates, industrialized countries use various mechanisms to create lower interest rates
for public investments.

____________________________________________________________________________________________________________________________________________________________________________
EEvviiddeennccee ooff TThhee IImmppaacctt ooff IIMMFF FFiissccaall aanndd MMoonneettaarryy PPooll iicciieess oonn tthhee CCaappaaccii ttyy ttoo AAddddrreessss HHIIVV//AAIIDDSS aanndd TTBB CCrriisseess iinn KKeennyyaa
51
CHAPTER FIVE: CONCLUSION AND RECOMMENDATIONS
4.1 Conclusion
IMF policies implemented by Kenya have restricted the fiscal space available to the
government, which has led to the government’s inability to effectively implement and scale-up
health interventions, including the scaling up of HIV/AIDS and TB interventions.
This study combined both qualitative and quantitative data collection research methods to
examine how IMF polices determine the size of the national budget, and consequently, their
impact on health funding and the government’s response to the HIV/AIDS and TB crisis in
Kenya.
As described in this report, a major problem with the current macroeconomic framework is that
it is designed for public-spending stabilization, not scaling-up. The restrictive fiscal and
monetary policy targets and the adoption of market-determined interest rates have greatly
constrained the ability of the government to engage in the more expansionary fiscal and
monetary policy options that will be required for any major scaling-up scenarios as are needed
to meet the MDGs.
Such targets and policies in the current macroeconomic framework limit the government’s
potential fiscal space by constraining the overall national resource envelope. These restrictions
adversely affect allocations to the different ministries, including health ministry. Public service
retrenchment in the 1990s, coupled with a freeze on employment that has persisted until now,
has also negatively impacted the health sector. Despite recent increases in health spending,
overall budget constraints continue to prevent the government from being able to fill the
shortage due to lack financial resources and the wage bill ceiling policy (wages are constrained
at 6.5 percent of GDP). The continuing shortage of critical public human resources for health
has largely contributed to the ministry’s inability to fully implement effective HIV/AIDS and TB
interventions.
Civil society consultations for inputs into the PRSP documents do not include or permit
discussions about the macroeconomic framework. The policy decisions about the
macroeconomic framework continue to be decided elsewhere, behind closed doors and
without broad public participation, scrutiny or accountability.
Efforts must be made to begin a broad public review and reconsideration of the
macroeconomic framework in Kenya, its policies and their underlying assumptions. The costs
and benefits of a range of other possible more expansionary policy options for increasing public

____________________________________________________________________________________________________________________________________________________________________________
EEvviiddeennccee ooff TThhee IImmppaacctt ooff IIMMFF FFiissccaall aanndd MMoonneettaarryy PPooll iicciieess oonn tthhee CCaappaaccii ttyy ttoo AAddddrreessss HHIIVV//AAIIDDSS aanndd TTBB CCrriisseess iinn KKeennyyaa
52
spending must be considered, and must be done in an open, inclusive and transparent process
that involves a much broader group of public stakeholders.
4.2 Recommendations
1). Open Macroeconomic Policy Decision Making to a Broader Group of Public Stakeholders
The process of deciding the policy priorities for Kenya’s macroeconomic framework –
stabilization or scaling-up – should be subject to a broader national public debate and
discussion involving parliament, academia, civil society, labor and the domestic media.
Additionally, setting of specific fiscal and monetary targets should be made more transparent
and involve broader public discussions of the costs and benefits of alternative policy options.
The implementation and evaluation of policy reforms should be participatory and inclusive with
all the stakeholders.
2) Alternative Policies for Increased Public Spending & Investment Must Be Considered
The underlying assumptions and policies informing the current macroeconomic framework in
Kenya should be revisited, explored and reconsidered by a larger group of public stakeholders.
The tight fiscal policy and monetary policy targets should be reviewed along with alternative
policy options that could allow more flexibility in deficit financing, geared specifically to
mobilize more resources for the health sector. For instance, within the IMF policies, there
should be provisions that allow the country to increase deficit financing to generate resources
for scaling up health interventions. The IMF must allow the government to explore and adopt
more expansionary fiscal and monetary policy options, especially in the context of exogenous
shocks such as last year’s commodity price increases and the current continuing global
economic and financial crisis.
Excellent examples of how Kenya could adopt alternative, more expansionary policies to scale-
up spending in public health have been proposed by major joint studies by the Political
Economy Research Institute (PERI) of the University of Massachusetts and the UNDP, including
“Expanding Decent Employment in Kenya: The Role of Monetary Policy, Inflation Control and
the Exchange Rate” (IPC, 2007a) and “An Employment-Targeted Economic Program for Kenya,”
by the UNDP’s International Poverty Center (IPC, 2007b).
3.) Conduct IMF Macroeconomic Literacy Trainings:
The CSOs, parliamentarians, labor unions, line ministry staff, academics and the domestic
media all need to play a more active role in urging the government to negotiate demand for
removal of all conditionalities that prevent the government from increasing investment in
health and particularly on HIV/AIDS and TB. For this policy to work however, IMF should show
flexibility in involving key stakeholders in developing alternative policy scenarios and in

____________________________________________________________________________________________________________________________________________________________________________
EEvviiddeennccee ooff TThhee IImmppaacctt ooff IIMMFF FFiissccaall aanndd MMoonneettaarryy PPooll iicciieess oonn tthhee CCaappaaccii ttyy ttoo AAddddrreessss HHIIVV//AAIIDDSS aanndd TTBB CCrriisseess iinn KKeennyyaa
53
formulating policy decisions. They should be represented, especially in the MWG, since this
group determines allocations to the different sectors.
It is imperative for the CSOs in the country to be familiar with IMF program policies, the content
of the policies, the context in which they are introduced and the effects of the policies in
relation to health care delivery. The lead CSOs should therefore create awareness among the
CSOs so as to increase knowledge of the IMF policies and their effects in order to collectively
advocate for macroeconomic policies that more effectively reduce poverty and advance the
health of Kenyans. There is a large need for education of CSOs, and senior officials within the
government who are responsible for mobilizing and spending resources for health about not
only IMF issues, but even about basic economics.
4). Eliminate the Wage Bill Ceiling:
In addition to a broader review o the whole policy framework, one immediate short-term step
that could be taken is to remove the current wage bill restriction. The cap on the wage bill was
shown to be one of the critical factors limiting the Ministry of Health efforts to recruit adequate
personnel for the scale up of HIV/AIDS and TB services. In view of this, CSOs in collaboration
with MPs, other national stakeholders and international advocacy partners need to advocate
for the removal of wage bill ceilings by the Government. This will enable the Government the
flexibility to employ additional personnel for the scaling up of health, HIV/AIDS and TB
interventions.
____________________________________________________________________________________________________________________________________________________________________________
EEvviiddeennccee ooff TThhee IImmppaacctt ooff IIMMFF FFiissccaall aanndd MMoonneettaarryy PPooll iicciieess oonn tthhee CCaappaaccii ttyy ttoo AAddddrreessss HHIIVV//AAIIDDSS aanndd TTBB CCrriisseess iinn KKeennyyaa
54
REFERENCES
1. ALMACO AND AMREF (2005). Budget Ceiling and Health: The Kenya Case Study. Nairobi:
AMREF.
2. Barro, J. (1996) ‘Inflation and Economic Growth’, Federal Reserve Bank of St. Louis
Review, Vol. 78, pp. 153-169.
3. Bruno, M. (1995) “Does Inflation Really Lower Growth?” Finance & Development. Vol.
32, No. 3 September, pp. 35-38.
4. Bruno, M. and Easterly, W. (1998) ‘Inflation Crises and Long-Run Growth’, Journal of
Monetary Economics, Vol. 41, pp. 3-26.
5. BWP (2007) “Ungovernable debate over Fund governance reform,” Bretton Woods
Project Update 58. December 4, 2007. http://www.brettonwoodsproject.org/art-
558762
6. CGD (2007) “Does the IMF Constrain Health Spending in Poor Countries? Evidence and
an Agenda for Action Report of the Working Group on IMF Programs and Health
Spending” Center for Global Development, Washington.
7. Collins D. H. et al. (1996). Health Financing Reform in Kenya: The Fall and Rise of Cost
Sharing, 1989-94. Boston: Management Science for Health.
8. Easterly (2002) “An Identity Crisis? Testing IMF Financial Programming”, Center for
Global Development. Working Paper No. 2. August.
9. Epstein (2006) “At Issue: Too much, too soon: IMF conditionality and inflation
targeting”, Bretton Woods Project Update, No. 52. 11 September.
10. Epstein (2007) “Central banks as agents of employment creation,” UN Department of
Economic and Social Affairs (DESA) Working Paper No. 38. June 2007.
11. Financial Services Committee (2007) Letter to the Managing Director of the IMF from
the House Financial Services Committee of the US Congress, November 14, 2007.
12. Fischer, S. (1993) ‘The Role of Macroeconomic Factors in Growth’, Journal of Monetary
Economics, Vol. 32, pp. 45-66.

____________________________________________________________________________________________________________________________________________________________________________
EEvviiddeennccee ooff TThhee IImmppaacctt ooff IIMMFF FFiissccaall aanndd MMoonneettaarryy PPooll iicciieess oonn tthhee CCaappaaccii ttyy ttoo AAddddrreessss HHIIVV//AAIIDDSS aanndd TTBB CCrriisseess iinn KKeennyyaa
55
13. Fitch (2009) “Kenya: Press Release: Fitch Changes Kenya Outlook to Stable,” Tuesday,
20 January 2009.
14. Ghosh, A. and Phillips, S. (1998), ‘Warning: Inflation May be Harmful to Your Growth’,
IMF Staff Papers, Vol. 45, pp. 672-710.
15. GTI (2007) “Transparency at the IMF: Guide for Civil Society on Getting Access to
Information from the IMF” by Global Transparency Initiative. October 2007.
http://www.brettonwoodsproject.org/art-557777
16. Gylfason, T. and Herbertsson, T. (2001) ‘Does Inflation Matter for Growth?, Japan and
the World Economy, Vol. 13, pp. 405-428.
17. IEO (2007) “The IMF and Aid to Sub-Saharan Africa”, Independent Evaluation Office,
The International Monetary Fund, Washington, April.
18. IMF (2005) “Transparency–publication policies”, Decision No. 13564-(05/85),
International Monetary Fund. October 5, 2005.
http://www.imf.org/external/pubs/ft/sd/index.asp?decision=13564-(05/85)
19. IMF (2006) “Macroeconomic Challenges of Scaling Up Aid to Africa: A Checklist for
Practitioners”, by Sanjeev Gupta, Robert Powell, and Yongzheng Yang. The International
Monetary Fund, Washington, August.
20. IMF (2008a) http://www.imf.org/external/np/exr/facts/prgf.htm.
21. IMF (2008b) (http://www.imf.org/external/np/sec/pr/1996/pr9621.htm)
22. IMF (2008c) “Kenya: 2008 Article IV Consultation—Staff Report; Staff Supplement;
Public Information Notice on the Executive Board Discussion; and Statement by the
Executive Director for Kenya,” IMF Country Report No. 08/339, International Monetary
Fund October 2008.
23. IMF (2008d) “Kenya: Ex Post Assessment of Longer-Term Program Engagement,” IMF
Country Report No. 08/338, International Monetary Fund, October 2008.
24. IPC (2007a) “Expanding Decent Employment in Kenya: The Role of Monetary Policy,
Inflation Control and the Exchange Rate” 31. Country Study published by International
Poverty Center, No.6 by Robert Pollin and James Heintz, Department of Economics and
Political Economy Research Institute (PERI), University of Massachusetts-Amherst.
25. IPC (2007b) “An Employment-Targeted Economic Program for Kenya,” by the UNDP’s
International Poverty Center

____________________________________________________________________________________________________________________________________________________________________________
EEvviiddeennccee ooff TThhee IImmppaacctt ooff IIMMFF FFiissccaall aanndd MMoonneettaarryy PPooll iicciieess oonn tthhee CCaappaaccii ttyy ttoo AAddddrreessss HHIIVV//AAIIDDSS aanndd TTBB CCrriisseess iinn KKeennyyaa
56
26. Julius Korir and Dhim Nzoya (2008). Domestic and International AIDS Spending in Kenya
2005/05 – 2006/07. A Report Submitted by to National AIDS Control Council, Nairobi.
27. Kazibwe, Sam et al. (1998). Health Sector Status Analysis 1998. Nairobi: Ministry of
Health and African Medical Research Foundation (AMREF).
28. Khan, M. and Senhadji, A. (2001) ‘Threshold effects in the Relation between Inflation
and Growth’, IMF Staff Papers, Vol. 48, pp. 1-21.
29. Kiert, T. (2004). Third Kenya Human Development Report: A Discussion Paper, USAID
Kenya.
30. Kioko et al. (2007). Tracking HIV and AIDS Resources in Kenya. A Draft Report
Presented to the Institute for Democracy in South Africa (IDASA).
31. Owino, W. (1997). “Delivery and Financing of Health Care Services in Kenya: Critical
Issues and Research Gaps”. IPAR Discussion Paper No. 7/97, Nairobi: Institute of Policy
Analysis and Research.
32. Rono, K. J. (2002). “The impact of the structural Adjustment Programs on Kenyan
Society.” Journal of Social Development in Africa, Vol. 17 No. 1.
33. Republic of Kenya (1965). Economic Survey 1965. Nairobi: Government printer.
34. Republic of Kenya (1977). Economic Survey 1977. Nairobi: Government printer.
35. Republic of Kenya (1980). Economic Survey 1980. Nairobi: Government printer.
36. Republic of Kenya (1982). Economic Survey 1982. Nairobi: Government printer.
37. Republic of Kenya (1984). Economic Survey 1984. Nairobi: Government printer.
38. Republic of Kenya (1986). Sessional Paper No. 1 of 1986 on Economic Management for
Renewed Growth. Nairobi: Government printer.
39. Republic of Kenya (1989). Economic Survey 1989. Nairobi: Government printer.
40. Republic of Kenya (1994). Kenya Health Policy Framework Paper. Nairobi: Government
Printer.
41. Republic of Kenya (1995). Economic Survey 1995. Nairobi: Government printer.
____________________________________________________________________________________________________________________________________________________________________________
EEvviiddeennccee ooff TThhee IImmppaacctt ooff IIMMFF FFiissccaall aanndd MMoonneettaarryy PPooll iicciieess oonn tthhee CCaappaaccii ttyy ttoo AAddddrreessss HHIIVV//AAIIDDSS aanndd TTBB CCrriisseess iinn KKeennyyaa
57
42. Republic of Kenya (1996). Kenya Economic Reforms for 1996- 1998: The Policy
Framework Paper. Nairobi: Government Printer.
43. Republic of Kenya (1997a). Kenya National Development Plan 1997-2001. Nairobi:
Government printer.
44. Republic of Kenya, 1997b, Economic Surveys, Nairobi, Government printer.
45. Republic of Kenya (1997b). Economic Survey 1997. Nairobi: Government printer.
46. Republic of Kenya (1998). Economic Survey 1998. Nairobi: Government printer.
47. Republic of Kenya (1999). Economic Survey 1999. Nairobi: Government printer.
48. Republic of Kenya (2000). Economic Survey 2000. Nairobi: Government printer.
49. Republic of Kenya (2001). Economic Survey 2001. Nairobi: Government printer.
50. Republic of Kenya (2002). National Development Plan 2002 – 2007. Nairobi:
Government printer.
51. Republic of Kenya (2003a). Economic Recovery Strategy for Wealth and Employment
Creation, 2003-2007. Nairobi: Government printer.
52. Republic of Kenya (2003b). Economic Survey 2003. Nairobi: Government printer.
53. Republic of Kenya (2004). Investment Programme for the Economic Recovery Strategy
for Wealth and Employment Creation 2003-2007: Kenya: Poverty Reduction Strategy
Paper. Washington, D.C., International Monetary Fund.
54. Republic of Kenya (2005). 2005b KNASP Office of the President. Kenya National AIDS
Strategic Plan 2005/06-2009/10. Nairobi: NACC; 2005.
55. Republic of Kenya (2006a). Assessment of the Socio-Economic Impact of HIV and AIDS
on Key Sectors in Kenya. Nairobi: National AIDS Control Council, Office of the President.
56. Republic of Kenya (2006b). Economic Survey 2006. Nairobi: Government printer.
57. Republic of Kenya (2006c). The Medium-Term Budget Strategy Paper 2006/07 –
2008/09. Nairobi: Ministry of Finance.
58. Republic of Kenya (2006d). The National Health Strategic Plan II-2005-2010. Nairobi:
Ministry of Health; 2006

____________________________________________________________________________________________________________________________________________________________________________
EEvviiddeennccee ooff TThhee IImmppaacctt ooff IIMMFF FFiissccaall aanndd MMoonneettaarryy PPooll iicciieess oonn tthhee CCaappaaccii ttyy ttoo AAddddrreessss HHIIVV//AAIIDDSS aanndd TTBB CCrriisseess iinn KKeennyyaa
58
59. Republic of Kenya (2006e). Quarterly Budget Review Fourth Quarter 2005/2006.
Nairobi: Ministry of Finance.
60. Republic of Kenya (2007a). Annual Public Debt Management Report July 2005 – June
2006. Nairobi: Debt Management Department, Ministry of Finance.
61. Republic of Kenya (2007b). Budget Outlook Paper 2007/08 – 2009/10. Nairobi: Ministry
of Finance.
62. Republic of Kenya (2007c). Public Expenditure Review 2007. Nairobi: Ministry of Health.
63. Republic of Kenya (2007d). Quarterly Budget Review Fourth Quarter 2006/2007.
Nairobi: Ministry of Finance.
64. Republic of Kenya (2008b). Annual Public Debt Management Report July 2006 – June
2007. Nairobi: Debt Management Department, Ministry of Finance.
65. Republic of Kenya (2008a). Kenya AIDS Indicator Survey 2007: Preliminary Report.
Nairobi: National AIDS and STI Control Programme, Ministry of Health, Kenya. KAIS,
2007
66. Republic of Kenya (2008). Economic Survey 2008. Nairobi: Government printer.
67. Republic of Kenya (2008). Budget Outlook Paper 2009/10 – 2011/12. Nairobi: Ministry
of Finance.
68. Sihanya, Ben (ed) (2008). The Impact of IMF policies on Education, Health and Women’s
Rights in Kenya. Nairobi: Action Aid Kenya.
69. Swamy (1994) Gurushri Swamy Kenya Structural Adjustment in the 1980s, The World
Bank, Chief Economists Office, Africa Regional Office
70. (World Bank, 1994).
71. World Bank (2000). World Development Report 2000/2001: Attacking Poverty.
Washington D.C.: World Bank.
72. World Bank (2002). World Development Report 2002: Building Institutions for Markets.
Washington D.C.: World Bank.