Embed Size (px)
Citation preview

Reading in the
Content Areas
Mathematics Texts
Dr. William McBride
National Educational Consultant
Author of Entertaining an Elephant

2
Copyright (2001) William McBride. All Rights Reserved.

Survey Techniques
Previewing Textbooks and Chapters
7
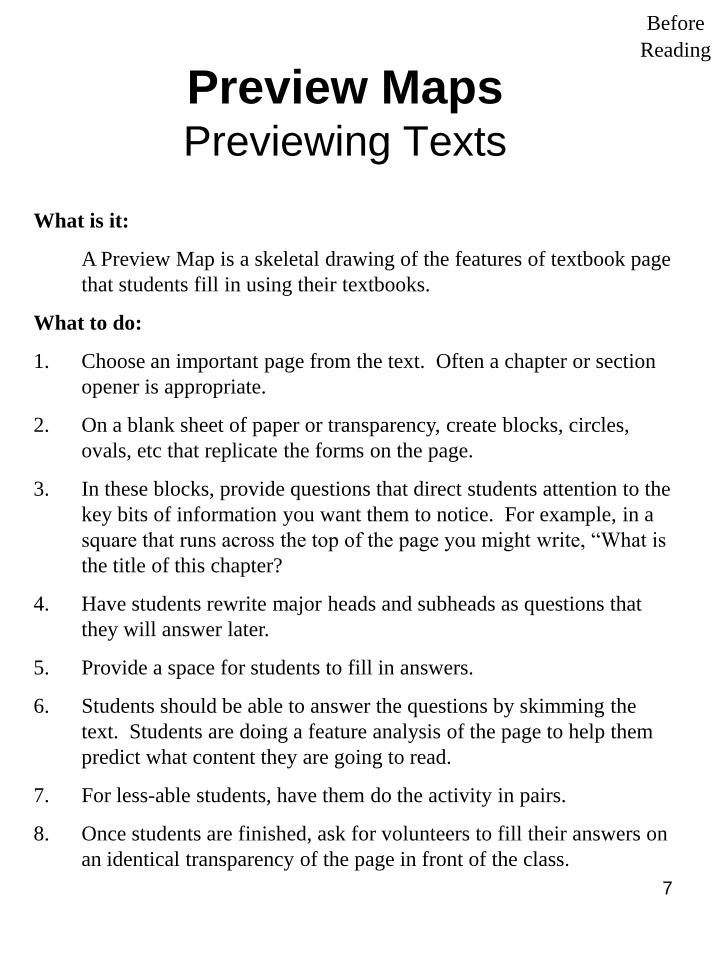
Preview MapsPreviewing Texts
What is it:
A Preview Map is a skeletal drawing of the features of textbook page
that students fill in using their textbooks.
What to do:
1. Choose an important page from the text. Often a chapter or section
opener is appropriate.
2. On a blank sheet of paper or transparency, create blocks, circles,
ovals, etc that replicate the forms on the page.
3. In these blocks, provide questions that direct students attention to the
key bits of information you want them to notice. For example, in a
square that runs across the top of the page you might write, “What is
the title of this chapter?
4. Have students rewrite major heads and subheads as questions that
they will answer later.
5. Provide a space for students to fill in answers.
6. Students should be able to answer the questions by skimming the
text. Students are doing a feature analysis of the page to help them
predict what content they are going to read.
7. For less-able students, have them do the activity in pairs.
8. Once students are finished, ask for volunteers to fill their answers on
an identical transparency of the page in front of the class.
Before
Reading
9
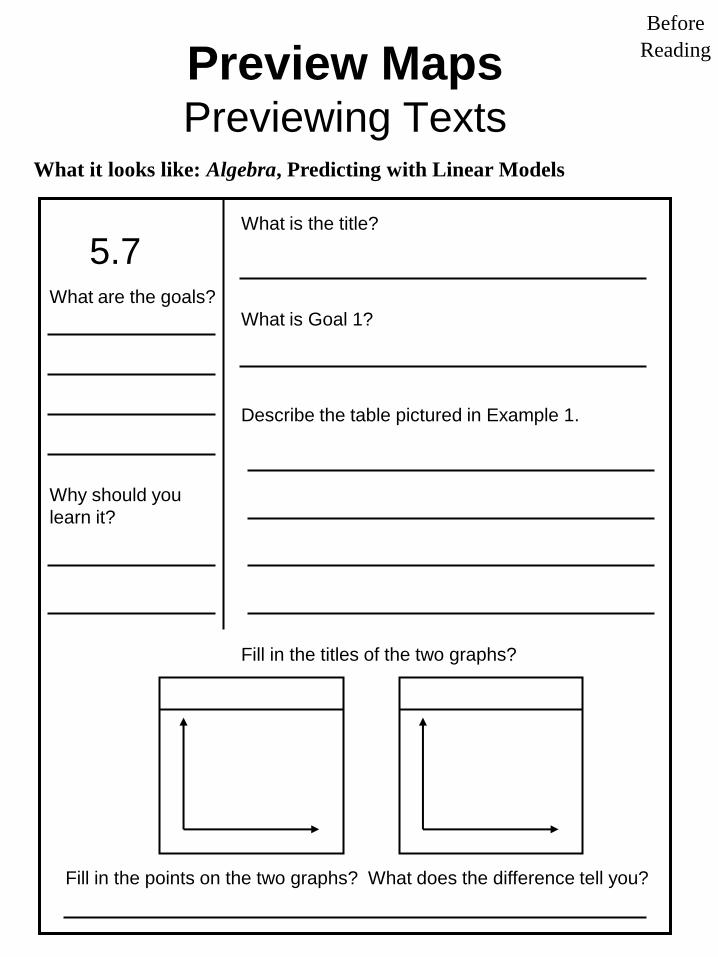
What it looks like: Algebra, Predicting with Linear Models
Preview MapsPreviewing Texts
Before
Reading
What is the title?
5.7What are the goals?
Why should you
learn it?
What is Goal 1?
Describe the table pictured in Example 1.
Fill in the titles of the two graphs?
Fill in the points on the two graphs? What does the difference tell you?

Before Reading
ActivitiesPreteaching Vocabulary
and
Identifying Prior Knowledge

11
You MUST Remember
ThisPreteaching Key Points
What is it:
You MUST Remember This simplifies the main points from a
chapter in easy-to-understand language.
What to do:
1. Choose a chapter from the text.
2. Summarize the most important points of each section in 1 or 2
statements.
3. Rewrite these points in the form of questions.
4. In writing the questions, use a level of language that is at the
independent reading level of most of your students, i.e. students
understand at least 99% of the words.
5. If you must use a difficult term, use the term in a sentence with good
context clues and have students guess the meaning. Write this
meaning under the question.
6. After the questions on the wall or board, leaving space for answers.
7. Before reading the chapter, tell students that they must know the
answers to these questions by the end of the chapter. Whenever a
student recognizes that a question is being answered during class
time, he or she is to raise his or her hand.
8. At this point, give ALL students time to find the answer in their own
texts.
9. Have students share their responses and allow one student to fill in
the answer below the appropriate question that is displayed.
10. These questions should be a major part of their final test.
Before
Reading
12
You MUST Remember
ThisPreteaching Key Points
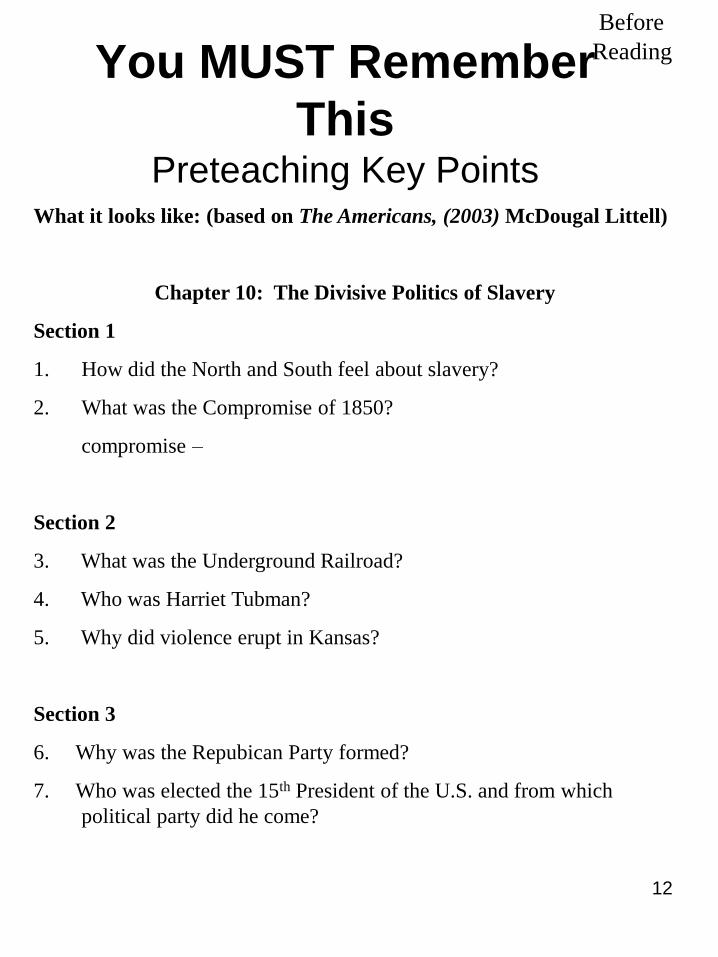
What it looks like: (based on The Americans, (2003) McDougal Littell)
Chapter 10: The Divisive Politics of Slavery
Section 1
1. How did the North and South feel about slavery?
2. What was the Compromise of 1850?
compromise –
Section 2
3. What was the Underground Railroad?
4. Who was Harriet Tubman?
5. Why did violence erupt in Kansas?
Section 3
6. Why was the Repubican Party formed?
7. Who was elected the 15th President of the U.S. and from which
political party did he come?
Before
Reading

13
Rotation ReviewReviewing Concepts
What is it:
Rotation Review is a “bell work” activity in which students begin
class by reviewing problems they had the day before and are
introduced to a new concept.
What to do:
1. Monday – Place 4 problems from the previous day’s lesson on the
board. Students are to begin working on these as soon as they take
their seats.
2. Monday – Add a 5th problem that they will learn how to solve in
today’s lesson. Students may should try to do the new problem.
3. Tuesday – Delete the 1st problem from the top of Monday’s list.
Add a new problem from Tuesday’s lesson. Students should still
do all 5 problems when the enter the room.
4. Wednesday – Delete the 1st problem from the top of Tuesday’s list.
Add a new problem from Wednesday’s lesson. Students should
still do all 5 problems when they enter the room.
5. Thursday – Delete the 1st problem from the top of Wednesday’s list.
Add a new problem from Thursday’s lesson. Students should still
do all 5 problems when they enter the room.
6. Friday – Delete the 1st problem from the top of Thursday’s list.
Add a new problem from Friday’s lesson. Students should still do
all 5 problems when they enter the room.
Before
Reading

14
Rotation ReviewReviewing Concepts
What it looks like:
Monday: (Solving Equations Using Addition and Subtraction)
1. x = 4 – 9 (Review)
2. x + 5 = 10
3. 11 = r – 4
4. –9 = 2 + y
5. ½ = a – ¼ (New Skill: Using fractions)
Tuesday: 1. x + 5 = 10 (Review)
2. 11 = r – 4
3. –9 = 2 + y
4. ½ = a – ¼
5. x/5 = – 30 (New Skill: Solving Equations Using
Multiplication and Division)
Wednesday: 1. 11 = r – 4 (Review)
2. –9 = 2 + y
3. ½ = a – ¼
4. x/5 = – 30
5. ½ x + 6 = –8 (New Skill: Solving Multi-Step
Equations)
Before
Reading

15
Knowledge RatingPreteaching Vocabulary
What is it:
Knowledge Rating is a Before Reading activity to ascertain how
well students know key words in a unit of study. Using discussion,
students share what they already know and don’t know about these
terms.
What to do:
1. Choose key words from a small section of text that will later be
read in class.
2. Prepare an activity sheet like the one pictured on the next page with
your key terms listed in the left-hand column.
3. Read the list aloud, one word at a time. Ask students to put an X in
the appropriate box showing whether they know it well, have heard
or seen it but are unsure of its meaning, or don’t know it at all.
4. Divide the class into mixed-ability pairs. Call out the words again,
giving students 1 minute to share their responses on their charts and
what they know about the terms.
5. Call on pairs to offer definitions of words they think they know.
Ask students to write the best definition of each of the words in the
right-hand column.
6. As students read the chapter, have students compare their
definitions with the way the word is used in the text.
Source: Blachowicz, C. (1986) Making connections: Alternatives
to the vocabulary notebook. Journal of Reading, 29, 543-549.
Before
Reading

16
Knowledge RatingPreteaching Vocabulary
What it looks like: Topic: Organizing Data
Knowledge Rating Scale
Key Term Know
It
Not
Sure
Don’t
Know
Before
Reading
Definition
range
domain
scatter plot
integer
strong correlation
function
matrix
slope
x-axis
rational numbers

17
Knowledge RatingPreteaching Vocabulary
Topic:
Knowledge Rating Scale
Key Term Know
It
Not
Sure
Don’t
Know
Before
Reading
Definition

21
Contextual RedefinitionPreteaching Vocabulary
What is it:
Contextual Redefinition is a Before Reading activity in which
students compare what they think a word means with how it is used
in the text.
What to do:
1. Choose key words from a small section of text that will later be read
in class.
2. Ask the class to suggest definitions for the key words. When a
definition is given, ask the student to tell also how they think they
know the word. For example, “A triangle has three sides. I know
because Jeff plays one in the marching band.”
3. Write these statements on the board for each of the key words. Then
under each statement, write the sentence from the textbook that
contains the same word. If the textbook sentence doesn’t give a good
context clue, make up a sentence that does instead.
4. Using the information from the student’s definition and from the
sentence from the text, ask for a volunteer to come up with a more
precise definition of the key word. Write this definition on the board.
5. If students are still unsure of a word’s meaning, have someone look it
up in the dictionary.
6. If helpful, have students then draw a picture of the word.
Source: Readence, J.E., Bean, T.W., & Baldwin, R.S. (1992) Content
area reading: An integrated approach (4ed.). Dubuque, IA:
Kendall/Hunt
Before
Reading

22
Contextual Redefinition
What it looks like: Topic: Angles
Key Word: angle
Student Definition: An angle is the amount of
space when two lines meet.
Textbook Sentence: An angle is formed by two
rays that begin at the same point. The point is the
vertex of the angle, and the rays are the sides of
the angle.
Contextual Redefinition: An angle is the space
formed by two rays, or lines, meeting at a point
called the vertex.
Dictionary Definition: A figure formed by two
lines diverging from a common point.
Example or Picture:
26
People SearchIdentifying Prior Knowledge
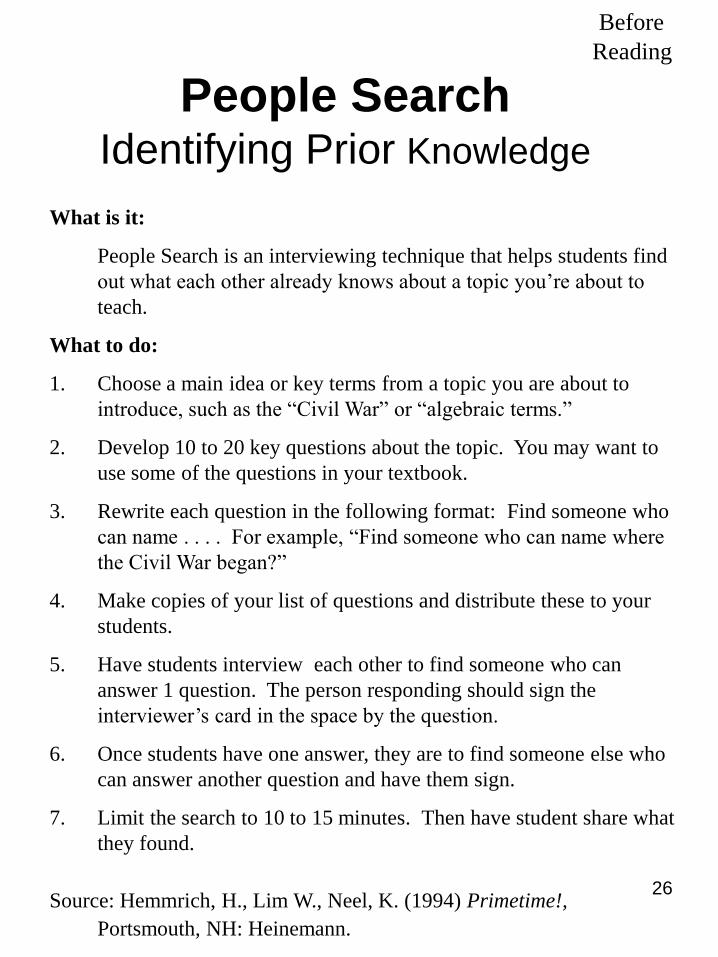
What is it:
People Search is an interviewing technique that helps students find
out what each other already knows about a topic you’re about to
teach.
What to do:
1. Choose a main idea or key terms from a topic you are about to
introduce, such as the “Civil War” or “algebraic terms.”
2. Develop 10 to 20 key questions about the topic. You may want to
use some of the questions in your textbook.
3. Rewrite each question in the following format: Find someone who
can name . . . . For example, “Find someone who can name where
the Civil War began?”
4. Make copies of your list of questions and distribute these to your
students.
5. Have students interview each other to find someone who can
answer 1 question. The person responding should sign the
interviewer’s card in the space by the question.
6. Once students have one answer, they are to find someone else who
can answer another question and have them sign.
7. Limit the search to 10 to 15 minutes. Then have student share what
they found.
Source: Hemmrich, H., Lim W., Neel, K. (1994) Primetime!,
Portsmouth, NH: Heinemann.
Before
Reading

27
People SearchIdentifying Prior Knowledge
What it looks like: Topic: Algebra 1: Chapter 1
Instructions: You are to find other classmates who can each
answer one of the questions on this sheet.
1. Find someone who can tell you what
a variable is.
2. Find someone who can tell you what
an exponent is.
3. Find someone who can define data.
4. Find someone who can explain
input and output.
5. Find someone who can draw a
picture of a bar graph on the back
of this sheet of paper.
6. Find someone who can draw a line
graph on the back of this sheet of
paper.
7. Find someone who can explain the
word domain.
8. Find someone who can write a
mathematical equation in the
answer line.
9. Find someone who can define
range.
10. Find someone who can define order
of operations.
Answer Responder
___________ ___________
______________ _______________
______________ _______________
______________ _______________
______________ _______________
______________ _______________
______________ _______________
______________ _______________
______________ _______________
______________ _______________
Before
Reading

28
People SearchIdentifying Prior Knowledge
Topic: __________________
Instructions: You are to find other classmates who can each
answer one of the questions on this sheet.
1. _____________________________
_____________________________
2. _____________________________
_____________________________
3. _____________________________
_____________________________
4. _____________________________
_____________________________
5. _____________________________
_____________________________
6. _____________________________
_____________________________
7. _____________________________
_____________________________
8. _____________________________
_____________________________
9. _____________________________
_____________________________
10. _____________________________
_____________________________
Answer Responder
___________ ___________
______________ _______________
______________ _______________
______________ _______________
______________ _______________
______________ _______________
______________ _______________
______________ _______________
______________ _______________
______________ _______________
Before
Reading

During Reading
Activities
Guided Reading and Listening
and
Decoding Word Problems

38
Read Aloud/Think AloudModeling Comprehension
What is it:
Read Aloud/Think Aloud is a strategy in which the teacher reads
sections of text aloud, modeling how comprehension happens.
What to do:
1. Choose a small section of text that contains important information
students need to know and remember.
2. Identify difficult terms students may not know. Read to see if any
context clues are given for these terms. Identify any signal words
that might indicate a specific type of text structure, such as
cause/effect, chronological order, spatial order, compare/contrast,
order of importance, or classification.
3. When the class comes to this section of text, tell them that you are
going to read this section aloud. First scan the page, speaking your
thoughts out loud. Describe any visual information, such as graphs,
tables, pictures, or charts. Note bold terms.
4. Tell the students that as you read, you are going to “model for them
how your brain makes sense of text.” If possible, make a
transparency of the text so students can follow as you point out how
you use context, reread, and connect to prior knowledge.
5. When you come to any signal words, point them out and show how
they help you make meaning. Also help students distinguish if visual
information provides examples, models, or new data.
6. When you finish reading the section, reflect on the text by
summarizing out loud for the students what you have read and stating
any thoughts or questions you now have.
During
Reading

40
Read Aloud/Think AloudModeling Comprehension
What it looks like: Predicting with Linear Models
Teacher Reads Aloud: Deciding When to Use a Linear Model (heading of
section)
Teacher says: “Well, I think the word linear means line. In fact, I can see the
word line in it. So, this model must show a line somehow. As I look
down the page I see an example with a chart and a solution with two
different graphs. This should explain linear models for me.”
Teacher Reads Aloud: Two of your major goals in this course are to learn
about different types of models and to learn which type of model to
use in a specific real-life situation. In this lesson you will learn how
to decide when a linear model can be used to represent real-life
data.
Teachers says: “So, I’m going to learn about two kinds of models. And the
one on this page I’ll be able to use in real-life situations.”
Teacher Reads Aloud: Example 1: Which Data Set is More Linear? The
amount (in millions of dollars) spent on advertising in broadcast
television and on the Internet from 1995 through 2001 is given in
the table. Which data are better modeled with a linear model?
Teacher says: “It says that the table is comparing the amount of money spent
on advertising on television with that spent on the Internet. I need to
look at the table now and figure out the difference between the two. . . .
Well, as I read across the row about television, the numbers are much
larger and they go up a small amount each year. So more is spent on
television advertising. The numbers in the Internet row are much
smaller, but they grow at a much bigger rate. What does this mean? It
seems that Internet advertising is growing very fast.”
During
Reading

41
Read Aloud/Think AloudModeling Comprehension
What it looks like: Predicting with Linear Models
Teacher Reads Aloud: Solution: A good way to decide whether data can
be represented by a linear model is to draw a scatter plot of the
data.
Teacher says: “We learned about scatter plots earlier. That’s when you plot
pairs of numbers on an x and y graph and look for any pattern. The
graphs come next so I’ll see what they show. . . . The first one is
Television Advertising. They put the dollar amounts on the vertical
axis and the years on the horizontal axis. Wow, when they plot the
points it forms almost a straight line. Now, the Internet Advertising
graph looks different. The points do not form a straight line. I’ll keep
reading.”
Teacher Reads Aloud: From the two scatter plots, you can see that
broadcast television data fall almost exactly on a line. The Internet
data are much less linear. That is, the data points don’t lie as close
to a straight line.
Teachers says: “So, I’m going to learn about two kinds of models. And the
one on this page I’ll be able to use in real-life situations.”
Teacher Reads Aloud: Example 1: Which Data Set is More Linear? The
amount (in millions of dollars) spent on advertising in broadcast
television and on the Internet from 1995 through 2001 is given in
the table. Which data are better modeled with a linear model?
Teacher says: “So, why is it important that the data fall in a straight line?
Let me think back. The section title is “Predicting with a Linear
Model.” Maybe, if the line is straight, it’s easier to predict an outcome
because the change is so regular.
During
Reading

42
Guided ReadingWhat Did I Read?
What is it?
What Did I Read? is a strategy that leads students through small
chunks of text while they take notes and respond orally.
What to do:
1. Select a key section of text that needs to be understood by all
students. The section can be as small as a paragraph or as long as
two or three pages. If possible, make a photocopy of the section for
students to mark up.
2. Review with students what concepts, events, or problems were
covered prior to this section of text.
3. Tell students that you are going to read part of this text, unless it is
one paragraph, then read the entire piece. As you read, students are
to underline key words or ideas if they have a copy of the text. If
not, they are to jot down any key words or ideas they hear.
4. Stop after a paragraph or two and say, “What did I read? Students,
write down for two minutes some notes of what I read.”
5. Tell students that if something is unclear, to note exactly where in
the text they lost their understanding.
6. Now begin calling on students by name. Ask them to tell you what
you read. Call on at least four students. Students will not know
who you are going to call on each time. Ask students to try to give
facts that others have not already mentioned.
7. After the fourth student has answered, ask the class if anyone has
any more information to add.
8. Then begin reading the next one or two paragraphs of the section
and follow the same procedure.
During
Reading

43

44
What it looks like: Coordinates and Scatter Plots
Teacher says: “Class, remember that we just learned about rates, ratios, and
percents. Now we’re going to learn how to plot points on a graph. Okay,
I’ll read. You watch your text and take notes.”
Teacher Reads Aloud: A coordinate plane is formed by two real numbers
that intersect at a right angle. Each point on the plane corresponds to
an ordered pair of real numbers. (Pause) The first number in an
ordered pair is the x-coordinate and the second number is the y-
coordinate. The ordered pair (3, -2) has an x-coordinate of 3 and a y-
coordinate of -2 as shown in the graph at the left below.
Teachers says: “What did I read? Everyone take two minutes to make some
notes about what I just read. Be sure to look at the graph on the left. If
you don’t understand something, tell me exactly where in the text you lost
your comprehension.”
Teacher says: [after two minutes] “Steven, tell me one thing about what I just
read. Remember to tell me if you don’t understand something.”
Steven says: “A coordinate plane is formed by two real numbers.”
Teacher says: “Good. Maria, what did I read?”
Maria says: “The numbers meet at a right angle.”
Teacher says: “Good. Kim, what did I read?
Kim says: “Each point matches an ordered pair. What’s an ordered pair?”
Teacher says: “Can someone tell Kim what an ordered pair is?”
Kevin says: “It’s two numbers you use to plot something on a graph.”
Teacher says: “Good. Have we covered all the information? . . . Yes, Pam?
Pam says: “You plot the first number of the pair on the x axis and the second
number on the y axis.”
During
ReadingGuided ReadingWhat Did I Read?
49
G.I.S.T.Summarizing Essential Information
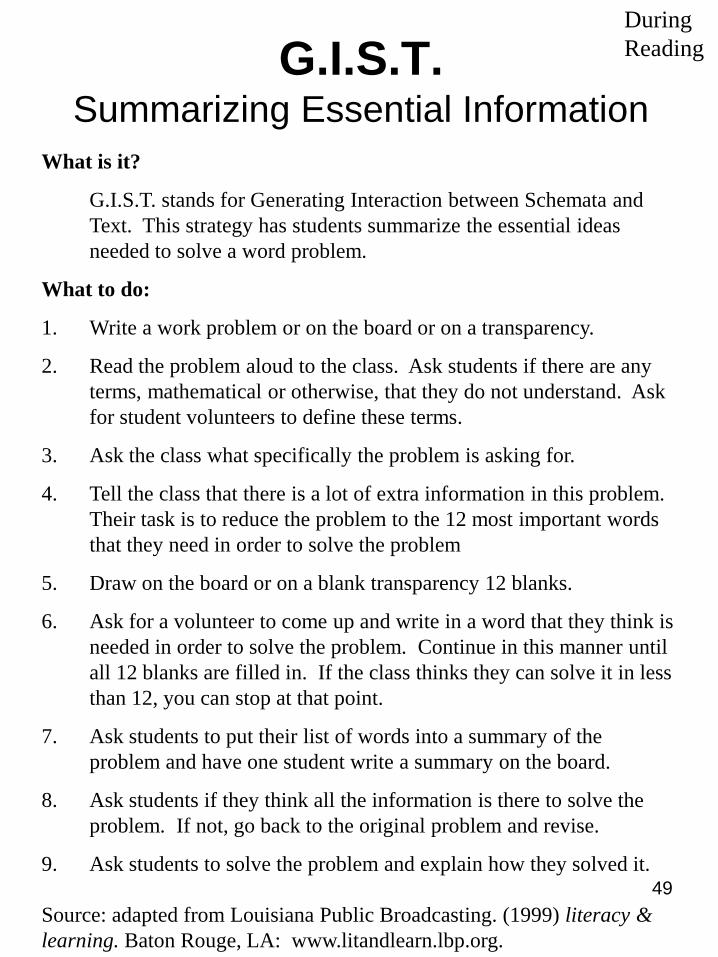
What is it?
G.I.S.T. stands for Generating Interaction between Schemata and
Text. This strategy has students summarize the essential ideas
needed to solve a word problem.
What to do:
1. Write a work problem or on the board or on a transparency.
2. Read the problem aloud to the class. Ask students if there are any
terms, mathematical or otherwise, that they do not understand. Ask
for student volunteers to define these terms.
3. Ask the class what specifically the problem is asking for.
4. Tell the class that there is a lot of extra information in this problem.
Their task is to reduce the problem to the 12 most important words
that they need in order to solve the problem
5. Draw on the board or on a blank transparency 12 blanks.
6. Ask for a volunteer to come up and write in a word that they think is
needed in order to solve the problem. Continue in this manner until
all 12 blanks are filled in. If the class thinks they can solve it in less
than 12, you can stop at that point.
7. Ask students to put their list of words into a summary of the
problem and have one student write a summary on the board.
8. Ask students if they think all the information is there to solve the
problem. If not, go back to the original problem and revise.
9. Ask students to solve the problem and explain how they solved it.
During
Reading
Source: adapted from Louisiana Public Broadcasting. (1999) literacy &
learning. Baton Rouge, LA: www.litandlearn.lbp.org.

50
G.I.S.T.Summarizing Essential Information
What it look like: Topic: Word Problem
Problem: Your mom gives you money for your birthday. You go to the
pet store with $25. You decide to buy 2 red-tail fish for $3.69 each
and fish food for $4.19. Rounded tanks are $11.48. However, you
like square-shaped tanks, which are $14.89. Estimate you total cost
to find which tank you can buy.
During
Reading
$25.00
tank
square
$4.19 $3.69
buy 2 fish
round
$14.89 which
$11.48
food
Summary: You have $25.00. You want to buy 2 fish at $3.69 each
and food for $4.19. Round tanks cost $11.48. Square tanks cost
$14.89. Which tank can you buy?

53
Possible SolutionsModeling Critical Thinking
What is it?
Possible Solutions is an activity in which students think through the
possible answers to a mathematical problem, deleting those that do
not make sense.
What to do:
1. Write a work problem or mathematical equation on the board or on a
transparency.
2. Read the problem aloud to the class. Ask students if there are any
terms, mathematical or otherwise, that they do not understand. Ask
for student volunteers to define these terms.
3. Ask the class what specifically the problem is asking for.
4. Make up at least 4 possible solutions to the problem. One should be
correct; one should be possible, and two should be not possible. For
example, if the question calls for an answer in “feet,” make one of
the answers in “cubic centimeters.”
5. Tell the class that they are to decide which answers are not possible
first. Ask for a volunteer to choose one of the answers and explain
how he or she knows it is incorrect. In this way, students model
their own thinking processes for each other.
6. Once the two “impossible” solutions are identified and explained,
ask the class to solve the problem.
7. Have a volunteer show how he or she solved the problem by
explaining the steps and thinking he or she followed.
During
Reading
Source: adapted from Louisiana Public Broadcasting. (1999) literacy &
learning. Baton Rouge, LA: www.litandlearn.lbp.org.
54
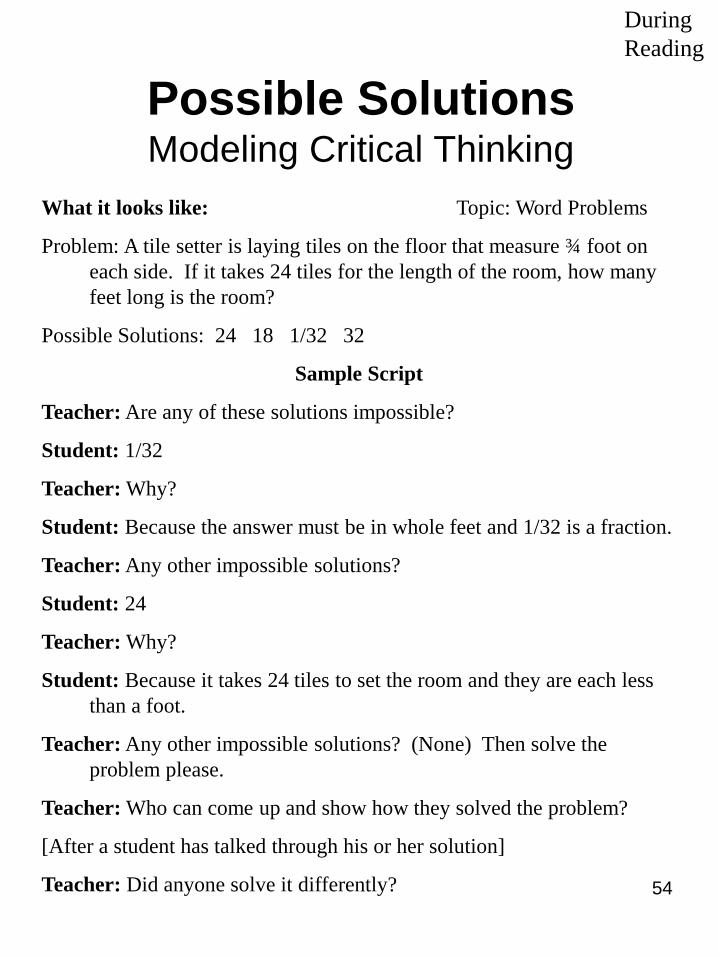
Possible SolutionsModeling Critical Thinking
What it looks like: Topic: Word Problems
Problem: A tile setter is laying tiles on the floor that measure ¾ foot on
each side. If it takes 24 tiles for the length of the room, how many
feet long is the room?
Possible Solutions: 24 18 1/32 32
Sample Script
Teacher: Are any of these solutions impossible?
Student: 1/32
Teacher: Why?
Student: Because the answer must be in whole feet and 1/32 is a fraction.
Teacher: Any other impossible solutions?
Student: 24
Teacher: Why?
Student: Because it takes 24 tiles to set the room and they are each less
than a foot.
Teacher: Any other impossible solutions? (None) Then solve the
problem please.
Teacher: Who can come up and show how they solved the problem?
[After a student has talked through his or her solution]
Teacher: Did anyone solve it differently?
During
Reading

55
Word Problem RouletteGroup Problem Solving
What is it?
Word Problem Roulette is a group activity in which students write
out solutions to word problems without using symbols.
What to do:
1. Divide the class into small groups or three or four students.
2. Pass out a different word problem to each group written on an index
card. Have one member read the problem aloud to the rest of the
group in “two-foot voices.”.
3. Tell the groups that they must solve their problem verbally without
writing anything down. One member will start by offering one
simple statement of how to begin solving the problem. Moving
clockwise, the next member will pick up where that member left off
and explain the next step.
4. If a member is stumped, he or she may say “Pass” or “Help” once to
get assistance from a neighbor in the group.
5. The group continues moving around the circle until there is
agreement on how to solve it.
6. Now the group will write down their solution. Beginning again with
the first member to speak initially, he or she writes down one
sentence of the solution, then passes the paper clockwise for the
next member to add the next step of the solution. Continue around
the circle until the solution is written out in its entirety.
7. Have one member read aloud the problem and the solution while
another member writes the solution on the board in symbols.
During
Reading
Source: adapted from Davis, S.J. & Gerber, R. “Open to suggestion: Content area
strategies in sec. mathematics classrooms.” Journal of Reading, 38 (1), 55-57.

56
What is it?
A Three-Column Journal is a graphic organizer on which students record
textual information, visual information, and supporting details or reactions.
What to do:
1. Select a section of text that contains visual information as a model.
2. Introduce the Three-Column graphic organizer to the students. A copy
master of this graphic appears on page 00. Make a transparency of this
graphic for modeling the activity.
3. Model the activity by reading the first section of text. As you read, make
notes of main ideas, key terms, or key formulas in the far left column.
4. Ask students if they see any visual information, such as graphs, tables,
pictures, or charts on the page that goes with what you just read. If so,
write down their descriptions in the middle column.
5. Now reread the information in the left-hand column. Model for students
how to rewrite this information in your own words, to define key terms, or
to rewrite formulas. You might begin with the phrase, “This part means . . .
6. Move to the second section of text and follow the same procedure.
7. When students come to a set of problems, tell them to write down a
description of the types of problems they will be doing. Leave the middle
column blank.
8. In the right-hand column, students should describe the strategy they used to
solve the problem.
9. Once students have learned how to fill out the graphic, have them do the
next section on their own and then share with the class what they wrote.
During
ReadingThree-Column Journal
Note Taking

57
Rewrite Headings as
Questions. Copy bold
words.
Read to answer the
questions and define the
bold words in column 1.
Summary of what you learned in this section:
During
Reading
Chapter:______________________________ Pages: ________
Copy the captions of:
pictures, tables,
charts, or graphs.
Three-Column Journal
Note Taking

58
Compare/Contrast “Y” NotesSummarizing Differences and Similarities
What is it?
Compare/Contrast “Y” Notes is an activity that helps students
discern similarities and differences between two topics of study
while reading.
What to do:
1. Tell students that they will read the next section of text to learn
how ____ (topic) and ____ (topic) are alike and how they are
different.
2. Pass out the Y graphic organizer for Compare/Contrast “Y”
Notes.
3. Ask students to fill in the two topics at the top of the Y.
4. As students read, have them list details about each topic in the
lines provided in the branches of the Y. They should not write
below the dotted line labeled “similarities.”
5. When they have finished taking notes, tell students to move any
details that appear in both branches to the bottom part of the Y.
After moving a detail down, they should draw a line through it in
the two top branches.
6. When complete, the Y diagram will show the differences between
the two topics in the top branches of the Y and the similarities in
the bottom section.
After
Reading

59
Compare/Contrast “Y”
Notes Summarizing Differences and Similarities
What it looks like: Topic: Parallelograms and Squares
After
Reading
Topic:______________ Topic:______________
Similarities:
Parallelograms Squares
Four sides
Opposite angles are equal
All four sides are equal
Opposite sides are equal
Opposite angles are equal
A special type of rectangle
All angles are 90 degrees
Rectangles are special cases
Sum of all angles is 360 degrees
Incumbent Senator Four sides
Sum of all angles is 360 degrees
Four sides
Opposite angles are equal
Sum of all angles is 360 degrees

60
Compare/Contrast “Y”
Notes Summarizing Differences and Similarities
After
Reading
Topic:______________ Topic:______________
Similarities:

After Reading
Activities
Summarizing

62
Summary ABC’sReviewing Vocabulary
What is it:
Summary ABC’s is an activity in which students review the key terms
in two chapters by first associating the terms with the chapter title.
What to do:
1. Choose the key terms from two chapters that you have just covered.
2. Write the title of the two chapters at the top of the organizer. The
graphic organizer presents twelve squares with the alphabet divided
among the squares. Write these key terms in the appropriate box by
alphabetical order and place a line beside each term to write in the
chapter or unit number. Also prepare a copy for every two students.
3. Introduce the Summarizing ABC’s graphic organizer to the class as an
overhead transparency. Point to any key term on the graphic. Ask
students to write on their copy which chapter the term came from.
4. Then ask for a volunteer to respond and to define the term. Students
can define a term in words, in a picture, such as a graph, or by an math
example found in the text. If the definition is inadequate, ask for help
from other students.
5. Have students in pairs fill out the chapter numbers on the rest of the
chart.
6. Then have pairs test each other’s knowledge of the terms. If students
are unable to define a term, they can go back to the text and look it up.
7. As a whole class activity, review the students’ answers by calling on
students randomly to respond.
After
Reading
Source: adapted from Allen, J. (1999) Words, words, words: Teaching
vocabulary words in grades 4-12. York, ME: Stenhouse.

63
Summary ABC’sReviewing Vocabulary
What it looks like: Algebra, Reviewing Chapters 3 and 4.
Directions: Decide in which of the two chapters you studied each term.
Write the chapter number by the term in the blank provided.
Then, with a partner, test each other on the definitions.
After
Reading
Chapters: Chp 3: Solving Linear Equations
Chp 4: Graphing Linear Functions and Equations
A-B G-HE-FC-D
O-PM-NK-LI-J
WXYZU-VS-TQ-R
coordinate
plane _____
constant of
variation _____
direct
variation _____
equivalent
equations _____
function
notation _____
linear equation
in one
variable _____
origin _____
ordered
pair _____
properties of
inequality _____
unit rate _____
inverse
operations _____
quadrants _____
relation _____
round-off
error _____
slope-intercept
form _____
similar
triangles _____
x axis ____
y coordinate ____
graph of an
ordered
pair _____
4
4
4
44
3
3
3
3

64
Summary ABC’sReviewing Vocabulary
After
Reading
Chapter _____: ______________________________________________
Chapter _____: ______________________________________________
A-B G-HE-FC-D
O-PM-NK-LI-J
WXYZU-VS-TQ-R
Directions: Decide in which of the two chapters you studied each term.
Write the chapter number by the term in the blank provided.
Then, with a partner, test each other on the definitions.

74
Frames
Summarizing Information What is it?
A method to teach summarizing by providing students with a
skeletal paragraph for them to fill in.
What to do:
1. Choose a small section of text you’d like students to summarize.
2. Write your own summary of this section. Include important
names and dates as well as important relationships and outcomes.
3. Cross through some of the names and dates. Cross through part
of a relationship, such as the effect of a cause. Cross through an
outcome.
4. If the subject of a sentence is particularly important, you might
cross through that but leave the predicate, or vice versa.
5. End your paragraph with the phrase, In summary, . . .
6. Present to students only the skeletal paragraph with blanks for the
words and phrases you crossed out. Ask them to use their text for
guidance and complete the paragraph.
7. When students are finished, ask for volunteers to share their
completed summaries with the class. Accept reasonable answers.
Source: Yell, Michael. (November, 2002). Putting Gel Pen to Paper.
Educational Leadership. (pp63-66) Alexandria, VA: ASCD.
After
Reading
75
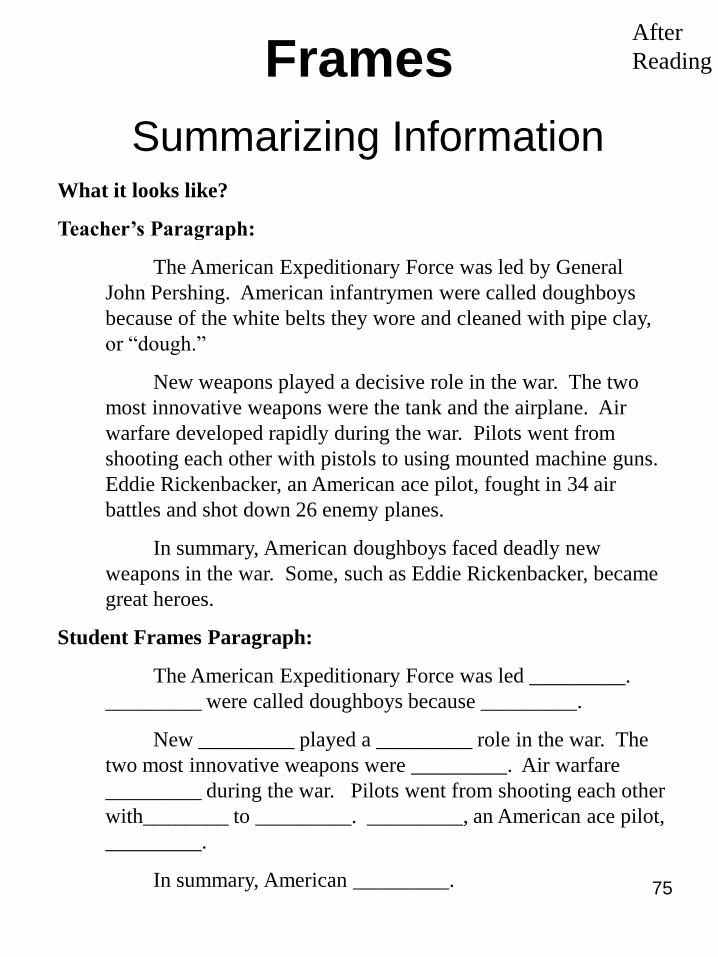
Frames
Summarizing Information What it looks like?
Teacher’s Paragraph:
The American Expeditionary Force was led by General
John Pershing. American infantrymen were called doughboys
because of the white belts they wore and cleaned with pipe clay,
or “dough.”
New weapons played a decisive role in the war. The two
most innovative weapons were the tank and the airplane. Air
warfare developed rapidly during the war. Pilots went from
shooting each other with pistols to using mounted machine guns.
Eddie Rickenbacker, an American ace pilot, fought in 34 air
battles and shot down 26 enemy planes.
In summary, American doughboys faced deadly new
weapons in the war. Some, such as Eddie Rickenbacker, became
great heroes.
Student Frames Paragraph:
The American Expeditionary Force was led _________.
_________ were called doughboys because _________.
New _________ played a _________ role in the war. The
two most innovative weapons were _________. Air warfare
_________ during the war. Pilots went from shooting each other
with________ to _________. _________, an American ace pilot,
_________.
In summary, American _________.
After
Reading

76
Sentence Synthesis
Summarizing Information What is it?
A method to teach summarizing by providing students with only
a few key words from a section of text.
What to do:
1. Choose a small section of text you’d like students to summarize.
2. Select two to five key words that capture the main ideas of the
section of text selected. Choose words that students will be able
to put together into a sentence.
3. Display the words to the students. Ask them to write one or two
sentences that summarize what they have just read. Tell students
they must use all the words displayed. Students may also use a
form of any word, such as a verb form of a noun.
4. Be sure to model the activity the first time you present it to the
class.
5. If applicable, also ask students to make a drawing that includes
all four words with the words labeled.
6. When students are finished, ask for volunteers to share their
completed summaries and drawings with the class. Accept
reasonable answers.
Source: adapted from Yell, Michael. (November, 2002). Putting Gel
Pen to Paper. Educational Leadership. (pp63-66) Alexandria,
VA: ASCD.
After
Reading

77
Sentence Synthesis
Summarizing Information
What it looks like? Coordinates and Scatter Plots
Teacher’s Words:
coordinate plane
ordered pair
x-coordinate
y-coordinate
Sample Student Sentence:
Points on a coordinate plane correspond to an ordered pair of
real numbers. The first number is the x-coordinate and the
second is the y-coordinate.
Sample Student Sentence:
The x-coordinate and y-coordinate are the points of an ordered
pair plotted on a coordinate plane.
Sample Student Drawing:
After
Reading
.
1 2 3
3
2
1
. (3, 2)
coordinate
plane
x-coordinatey-coordinate
ordered pair