Embed Size (px)
Citation preview
Reading Pie Reading Pie ChartsCharts
Teach GCSE Maths
oilseed rape10%
barley24%
other crops8%
wheat42%
horticulture7%
sugar beet4%
5%peas & beans
Crops Grown in the UK, 2003
"Certain images and/or photos on this presentation are the copyrighted property of JupiterImages and are being used with permission under license. These images and/or photos may not be copied or downloaded without permission from JupiterImages"
© Christine Crisp
Reading Pie Charts
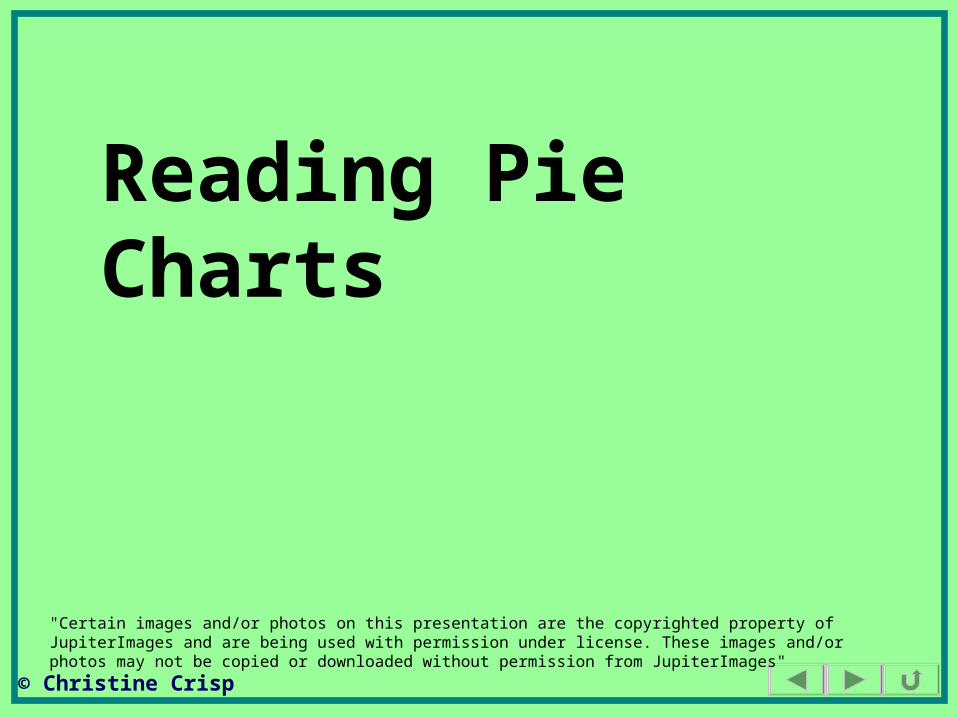
Pie charts are used to display qualitative data.
If we had the colours of a collection of cars, the size of each slice could represent the number of cars of a given colour.
If we had the names of TV “soaps”, the size of a slice could show how many of a group of viewers liked that one best.
red
blue
black
white
green
other
EastEnders
Corrie
Emmerdale
Casualty
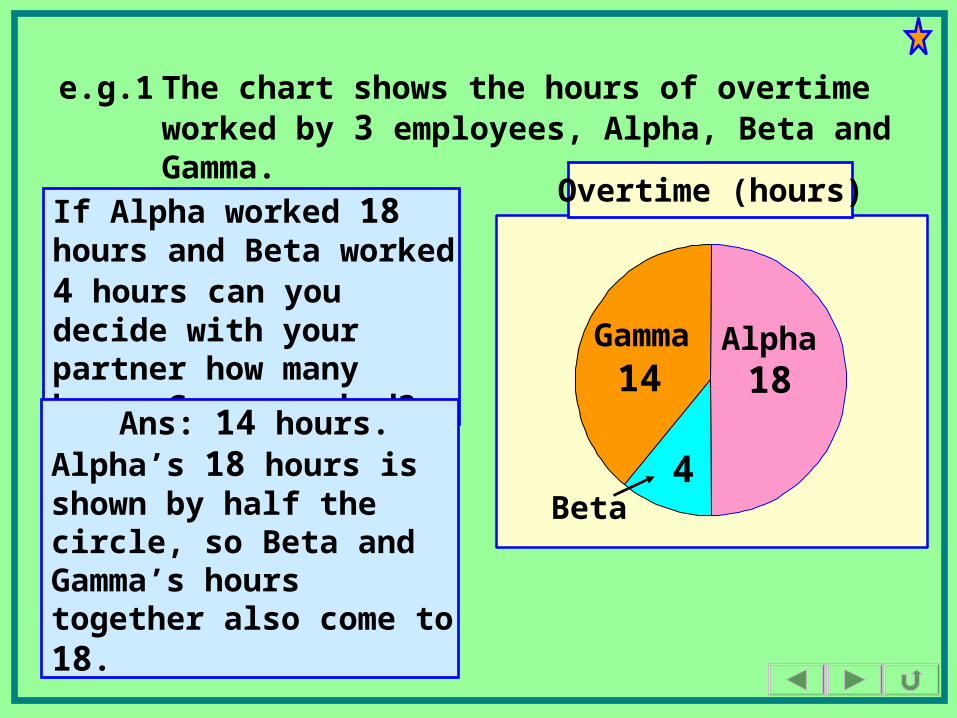
e.g.1 The chart shows the hours of overtime worked by 3 employees, Alpha, Beta and Gamma.
If Alpha worked 18 hours and Beta worked 4 hours can you decide with your partner how many hours Gamma worked?
Ans: 14 hours.Alpha’s 18 hours is shown by half the circle, so Beta and Gamma’s hours together also come to 18.
Overtime (hours)
14 18
4
Alpha
Beta
Gamma
How many degrees is the angle in the final slice?
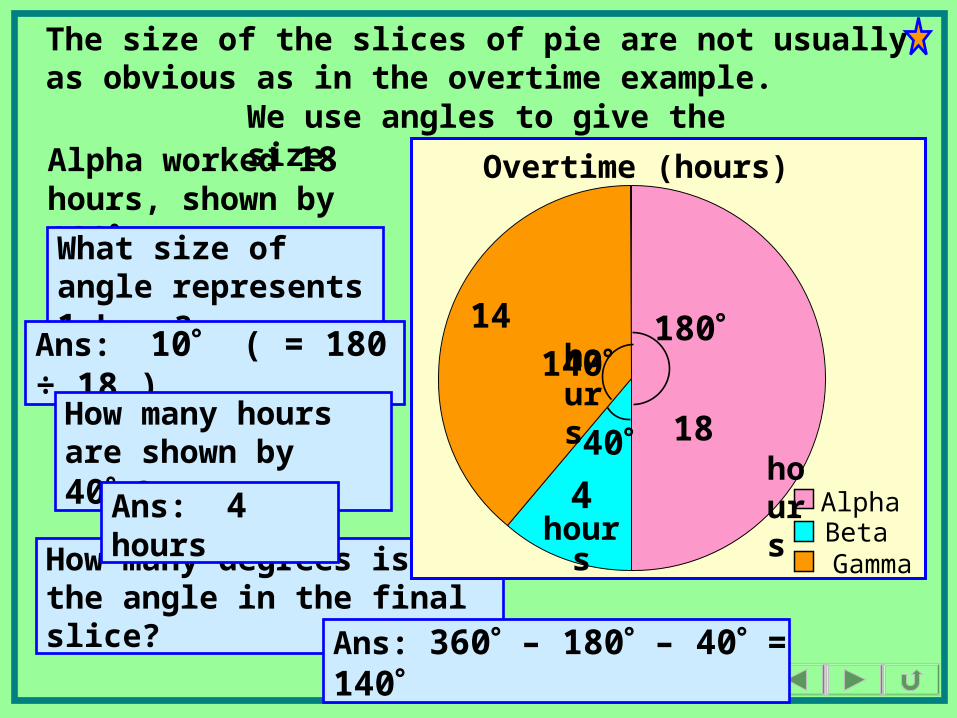
The size of the slices of pie are not usually as obvious as in the overtime example.
We use angles to give the size. Overtime (hours)
AlphaBetaGamma
180140
40
Alpha worked 18 hours, shown by 180.What size of angle represents 1 hour?Ans: 10 ( = 180 ÷ 18 )
How many hours are shown by 40 ?
Ans: 4 hours
18 hours
4 hour
s
Ans: 360 – 180 – 40 = 140
14 hours
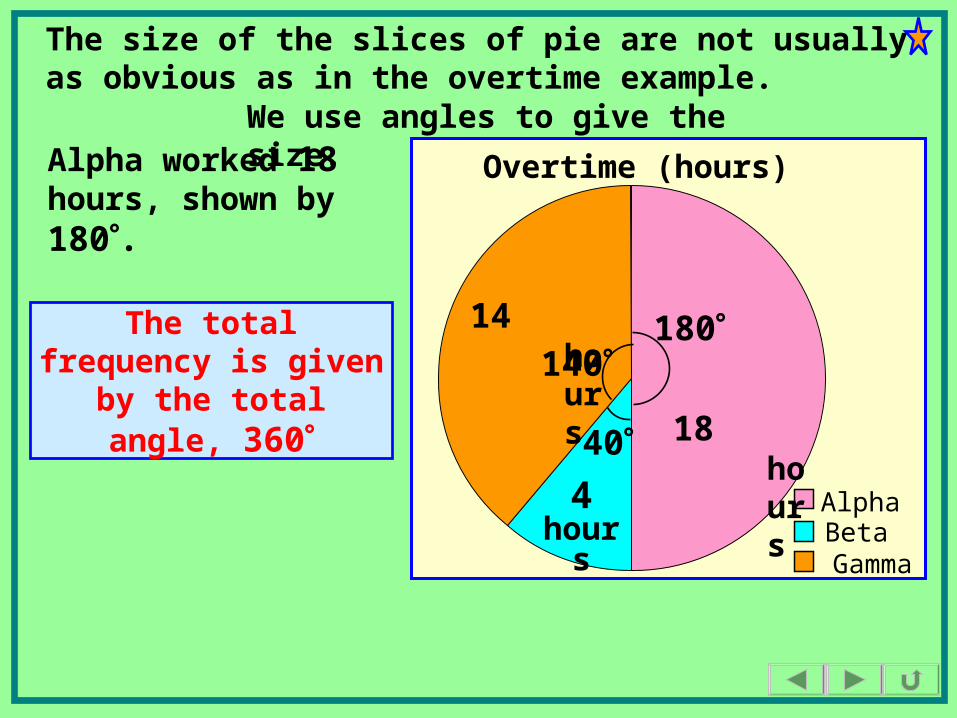
The size of the slices of pie are not usually as obvious as in the overtime example.
We use angles to give the size. Overtime (hours)
AlphaBetaGamma
180140
40
Alpha worked 18 hours, shown by 180.
18 hours
4 hour
s
The total frequency is given by the total
angle, 360
14 hours
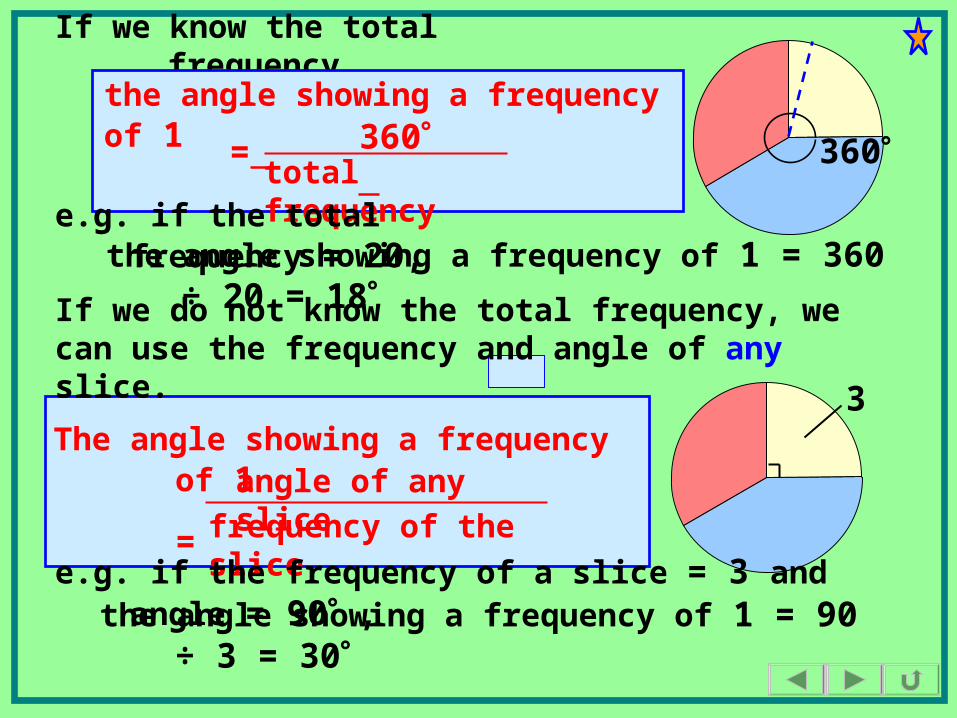
The angle showing a frequency of 1
= frequency of the slice
angle of any slice
If we know the total frequency,
If we do not know the total frequency, we can use the frequency and angle of any slice.
the angle showing a frequency of 1 360
total frequency
=
e.g. if the total frequency = 20,
360
3
e.g. if the frequency of a slice = 3 and angle = 90 , the angle showing a frequency of 1 = 90 ÷ 3
= 30
the angle showing a frequency of 1 = 360 ÷ 20 = 18
total frequency = 60
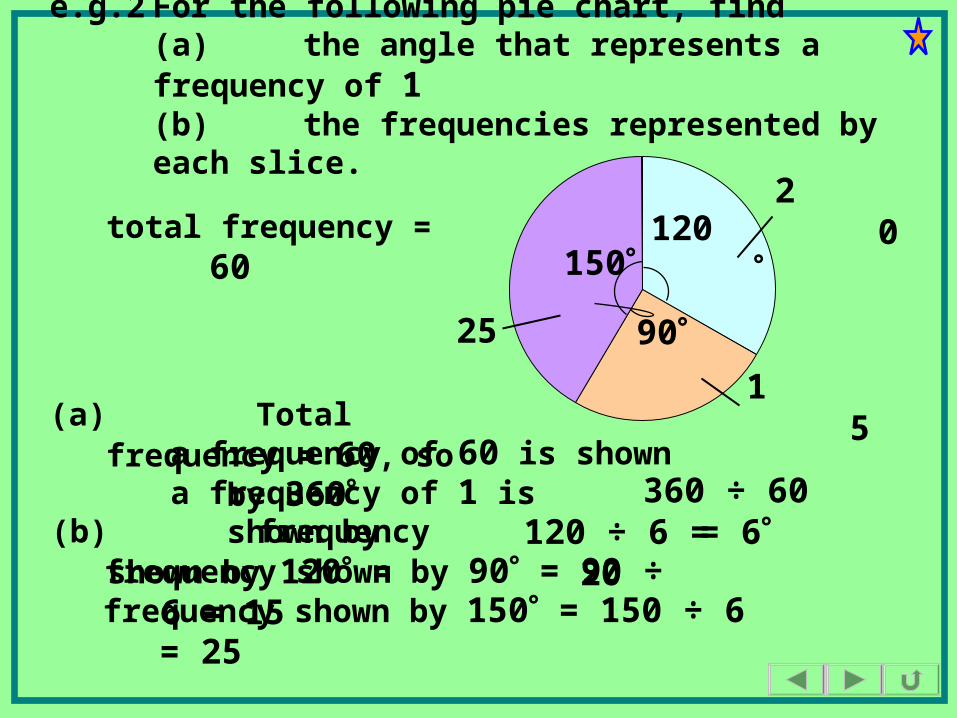
e.g.2 For the following pie chart, find(a) the angle that represents a frequency of 1(b) the frequencies represented by each slice.
120
90
150
(a) Total frequency = 60, so a frequency of 60 is shown by
360a frequency of 1 is shown by
360 ÷ 60 = 6(b)frequency shown by
120 =frequency shown by 90 = 90 ÷ 6 = 15frequency shown by 150 = 150 ÷ 6 = 25
20
15
25
120 ÷ 6 = 20
frequency, 7
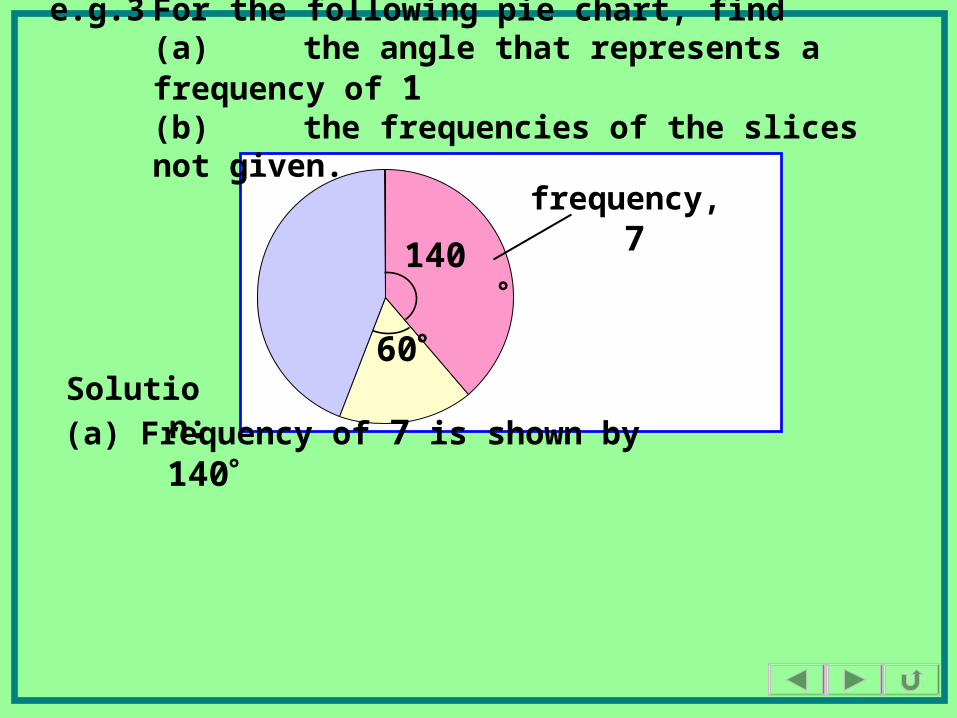
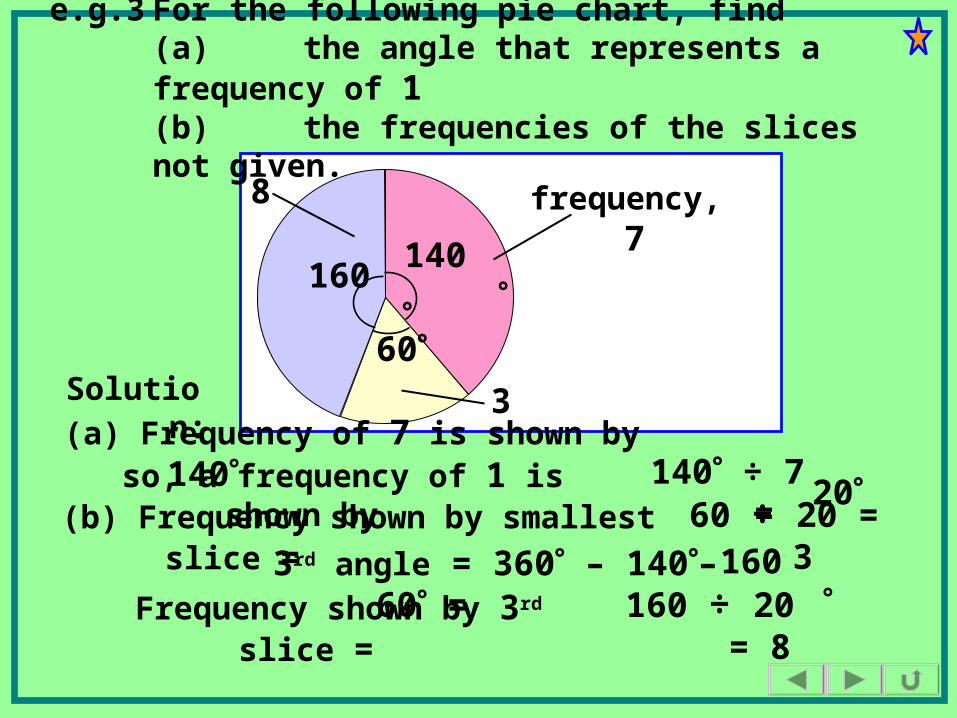
e.g.3 For the following pie chart, find(a) the angle that represents a frequency of 1(b) the frequencies of the slices not given.
140
(a) Frequency of 7 is shown by 140
Solution:
60
frequency, 7140
(a) Frequency of 7 is shown by 140so, a frequency of 1 is
shown by140 ÷ 7 =
Solution:
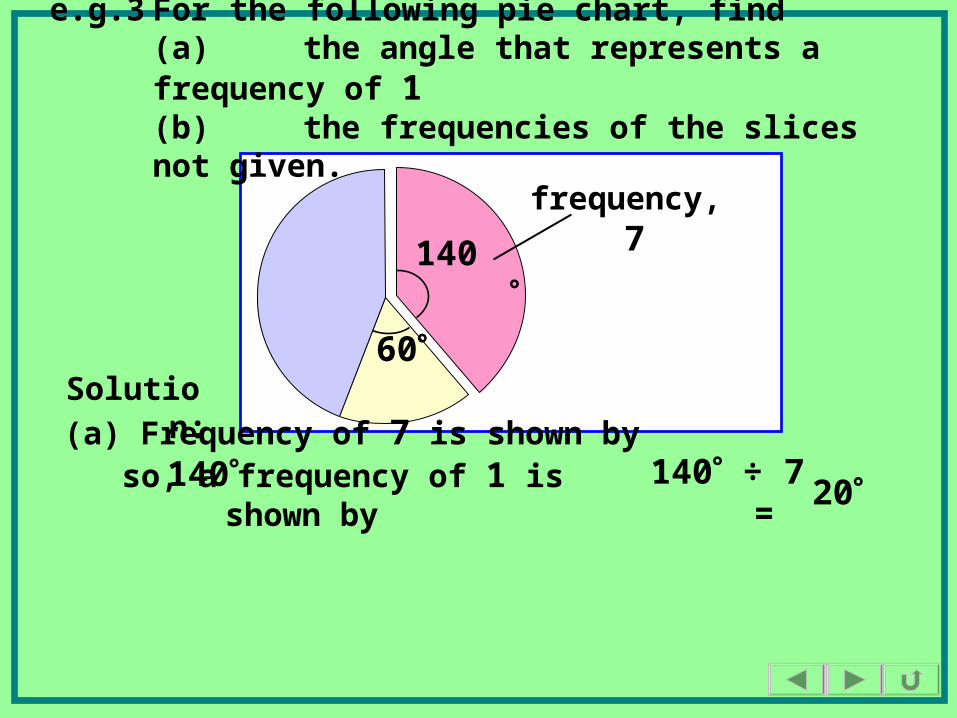
20
60
e.g.3 For the following pie chart, find(a) the angle that represents a frequency of 1(b) the frequencies of the slices not given.
frequency, 7
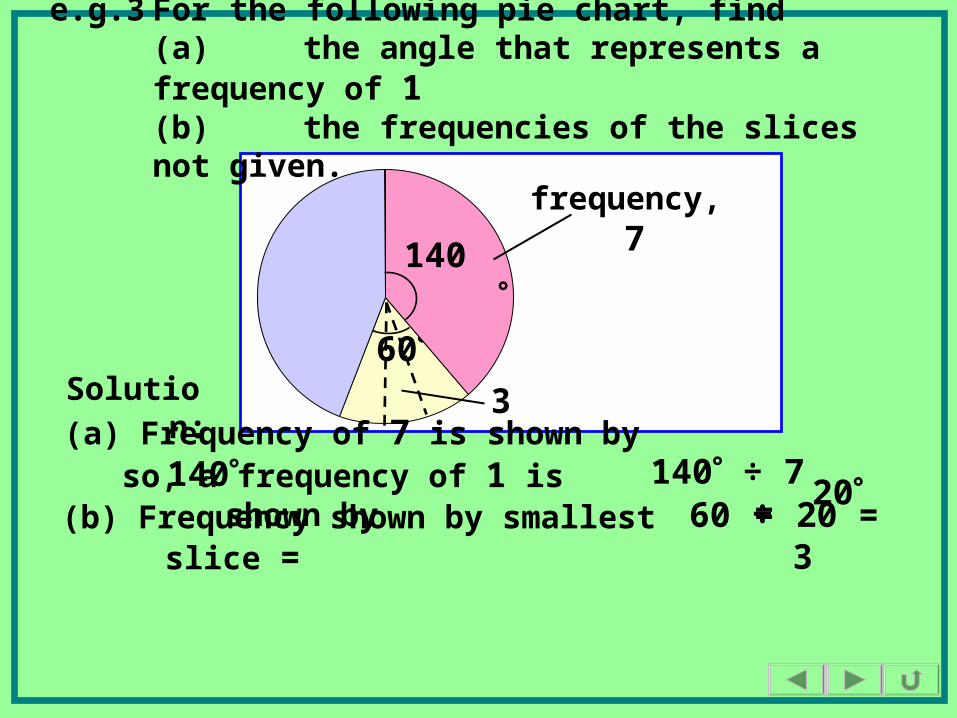
(a) Frequency of 7 is shown by 140so, a frequency of 1 is
shown by140 ÷ 7 =
(b) Frequency shown by smallest slice =
60Solutio
n:3
20
140
60 ÷ 20 = 3
e.g.3 For the following pie chart, find(a) the angle that represents a frequency of 1(b) the frequencies of the slices not given.
frequency, 7140
(a) Frequency of 7 is shown by 140so, a frequency of 1 is shown
by140 ÷ 7 =
(b) Frequency shown by smallest slice =
60
160
Solution:
3rd angle = 360 – 140– 60 = 160Frequency shown by 3rd
slice =
60 ÷ 20 = 3
160 ÷ 20 = 8
3
8
20
e.g.3 For the following pie chart, find(a) the angle that represents a frequency of 1(b) the frequencies of the slices not given.
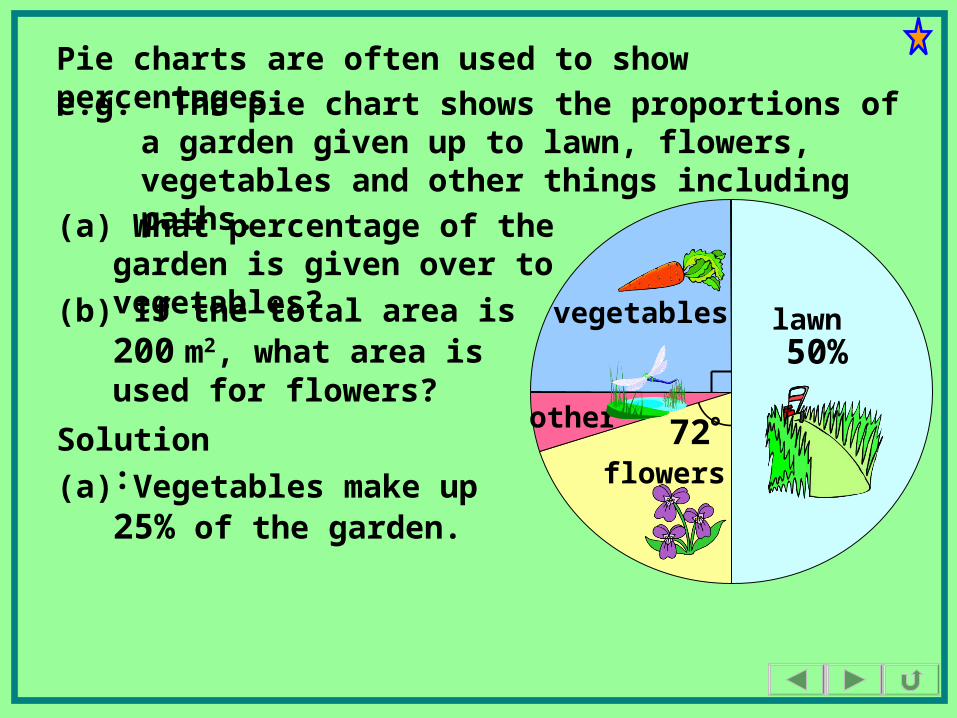
Pie charts are often used to show percentages.e.g. The pie chart shows the proportions of a
garden given up to lawn, flowers, vegetables and other things including paths.
(b) If the total area is 200
m2, what area is used for flowers?
(a) What percentage of the garden is given over to vegetables?
Solution:(a) Vegetables make up 25% of the garden.
flowers
other
vegetables lawn
72
50%
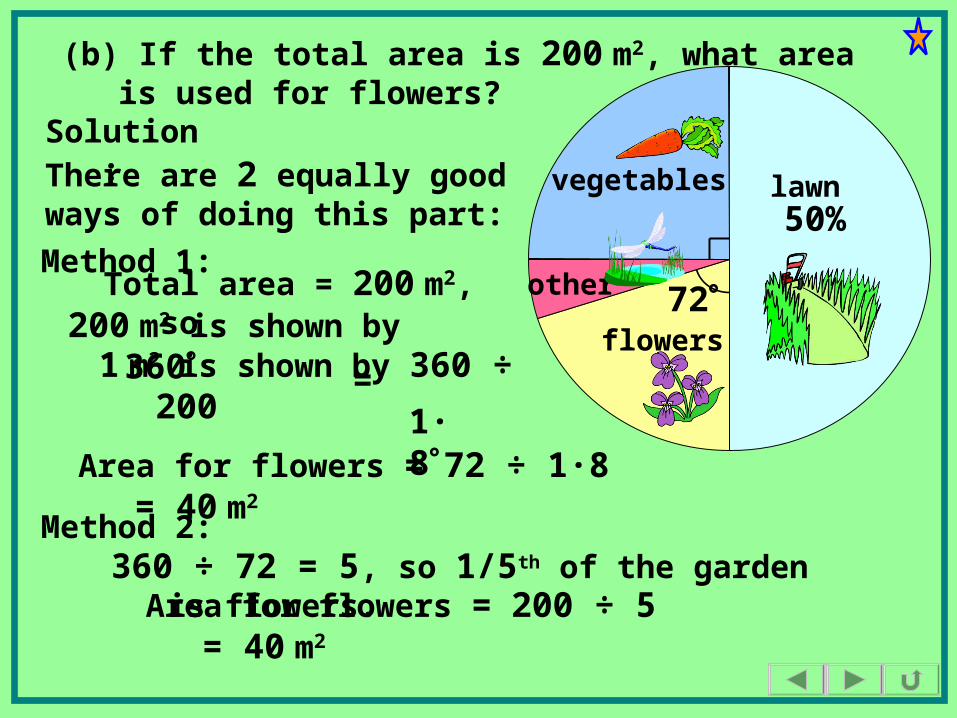
(b) If the total area is 200 m2, what area is used for flowers?
Solution:
360 ÷ 72 = 5, so 1/5th of the garden is flowers.Area for flowers = 200 ÷ 5 = 40
m2
There are 2 equally good ways of doing this part:
Method 1:Total area = 200 m2,
so200 m2 is shown by 3601 m2 is shown by 360 ÷
200
flowers
other
vegetables lawn
72
50%
= 1·8Area for flowers = 72 ÷ 1·8 = 40
m2
Method 2:
A slice of pie represents a frequency.
SUMMARY
We use angles to measure frequencies. To find an unknown angle or an unknown frequency, we can use the angle given by a frequency of 1. We can find the angle used to show a frequency of 1, either by• dividing 360 by the total
frequency, or• dividing any angle by the frequency it represents.
Pie charts can be used to show percentages.
Exercise
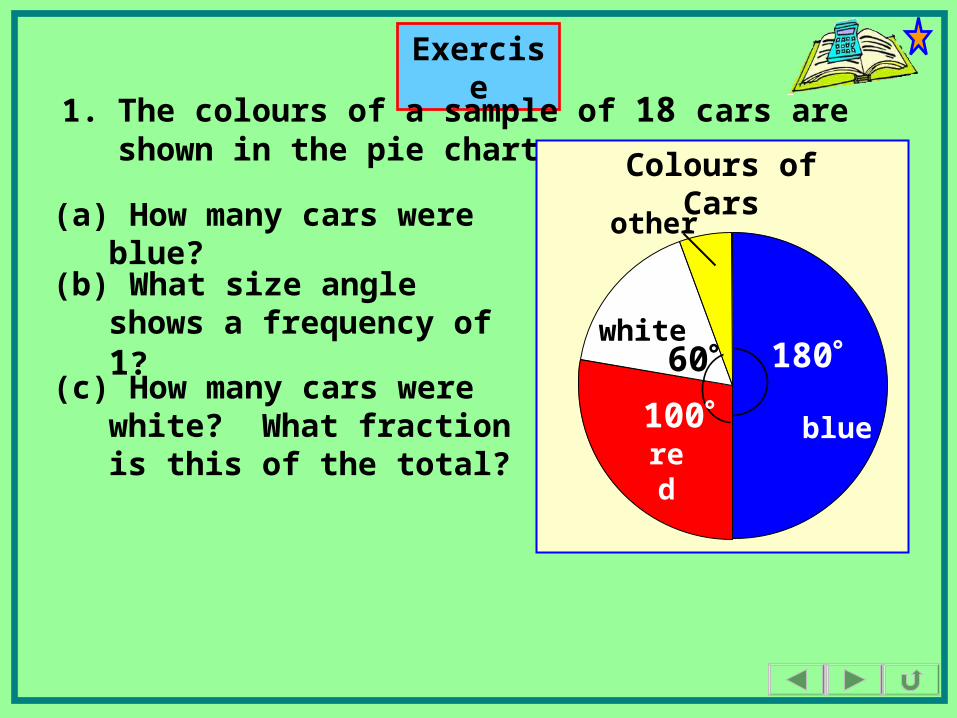
1. The colours of a sample of 18 cars are shown in the pie chart.
(a) How many cars were blue?
(b) What size angle shows a frequency of 1?
(c) How many cars were white? What fraction is this of the total?
blue
180
100
60
red
white
other
Colours of Cars
Exercise
blue
180
100
60
red
white
other
Colours of Cars
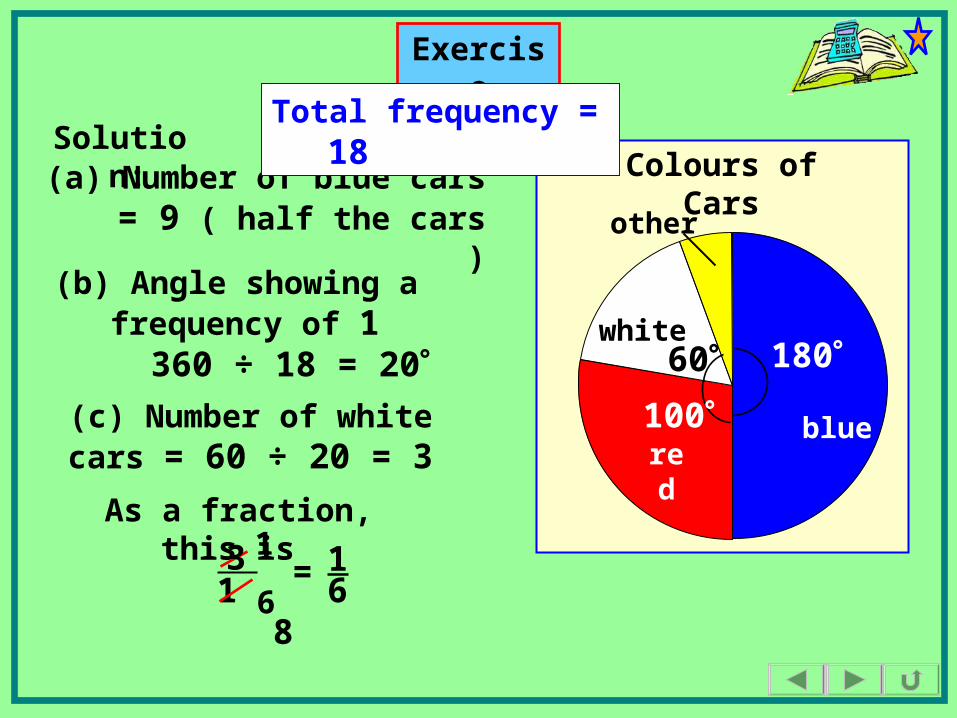
Solution:(a) Number of blue cars
= 9 ( half the cars )
(b) Angle showing a frequency of 1
360 ÷ 18 = 20(c) Number of white
cars = 60 ÷ 20 = 3
As a fraction, this is
18 6
1
Total frequency = 18
61=3
Exercise
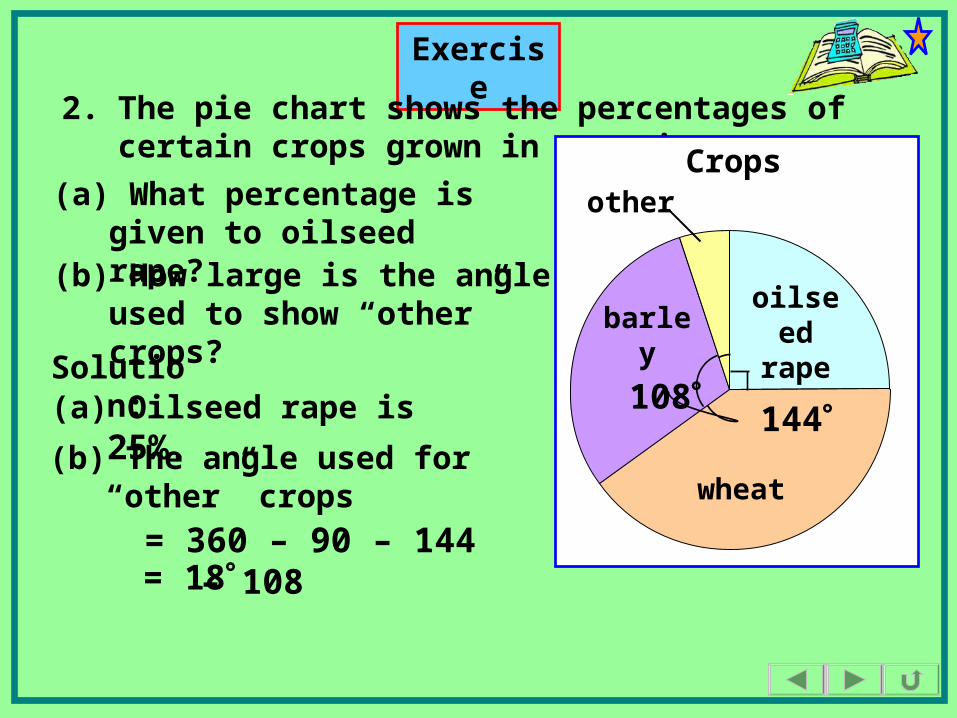
2. The pie chart shows the percentages of certain crops grown in a region.
(a) What percentage is given to oilseed rape?(b) How large is the angle used to show “other” crops?
(a) Oilseed rape is 25%.
Solution:
(b) The angle used for “other” crops
= 360 – 90 – 144 – 108 = 18
Crops
wheat
barley
other
oilseed
rape
144108