Embed Size (px)
Citation preview
1 23
Applied Health Economics and HealthPolicy ISSN 1175-5652Volume 12Number 6 Appl Health Econ Health Policy (2014)12:573-585DOI 10.1007/s40258-014-0124-7
Using Decision Trees to Manage HospitalReadmission Risk for Acute MyocardialInfarction, Heart Failure, and Pneumonia
John P. Hilbert, Scott Zasadil, DonnaJ. Keyser & Pamela B. Peele

1 23
Your article is protected by copyright and
all rights are held exclusively by Springer
International Publishing Switzerland. This e-
offprint is for personal use only and shall not
be self-archived in electronic repositories. If
you wish to self-archive your article, please
use the accepted manuscript version for
posting on your own website. You may
further deposit the accepted manuscript
version in any repository, provided it is only
made publicly available 12 months after
official publication or later and provided
acknowledgement is given to the original
source of publication and a link is inserted
to the published article on Springer's
website. The link must be accompanied by
the following text: "The final publication is
available at link.springer.com”.
PRACTICAL APPLICATION
Using Decision Trees to Manage Hospital Readmission Riskfor Acute Myocardial Infarction, Heart Failure, and Pneumonia
John P. Hilbert • Scott Zasadil • Donna J. Keyser •
Pamela B. Peele
Published online: 27 August 2014
� Springer International Publishing Switzerland 2014
Abstract To improve healthcare quality and reduce costs,
the Affordable Care Act places hospitals at financial risk for
excessive readmissions associated with acute myocardial
infarction (AMI), heart failure (HF), and pneumonia (PN).
Although predictive analytics is increasingly looked to as a
means for measuring, comparing, and managing this risk,
many modeling tools require data inputs that are not readily
available and/or additional resources to yield actionable
information. This article demonstrates how hospitals and
clinicians can use their own structured discharge data to
create decision trees that produce highly transparent, clin-
ically relevant decision rules for better managing readmis-
sion risk associated with AMI, HF, and PN. For illustrative
purposes, basic decision trees are trained and tested using
publically available data from the California State Inpatient
Databases and an open-source statistical package. As
expected, these simple models perform less well than other
more sophisticated tools, with areas under the receiver
operating characteristic (ROC) curve (or AUC) of 0.612,
0.583, and 0.650, respectively, but achieve a lift of at least
1.5 or greater for higher-risk patients with any of the three
conditions. More importantly, they are shown to offer
substantial advantages in terms of transparency and inter-
pretability, comprehensiveness, and adaptability. By
enabling hospitals and clinicians to identify important fac-
tors associated with readmissions, target subgroups of
patients at both high and low risk, and design and imple-
ment interventions that are appropriate to the risk levels
observed, decision trees serve as an ideal application for
addressing the challenge of reducing hospital readmissions.
Key Points for Decision Makers
Given their high level of transparency and ease of
use, decision trees are well suited for supporting
hospitals and clinicians in their efforts to manage the
financial risk of excessive readmissions associated
with acute myocardial infarction, heart failure, and
pneumonia.
Decision trees can be constructed using readily
available hospital discharge data and provide
clinically relevant information to help guide
important decisions regarding which patients to
target for what types of interventions.
The usefulness of the decision rules created through
these models outweighs their limitations with respect
to predictive performance.
1 Introduction
Hospital readmissions, or the number of patients who are
readmitted to a hospital within a certain period of time after
discharge, are viewed as important indicators of the quality
and efficiency of hospital care. Since 2009, the Centers for
J. P. Hilbert � S. Zasadil � P. B. Peele
Department of Health Economics, UPMC Health Plan,
U.S. Steel Tower, 9th Floor, 600 Grant Street,
Pittsburgh, PA 15219, USA
D. J. Keyser (&)
UPMC Center for High-Value Health Care, U.S. Steel Tower,
40th Floor, 600 Grant Street, Pittsburgh, PA 15219, USA
e-mail: [email protected]
P. B. Peele
Department of Health Policy and Management, Graduate School
of Public Health, University of Pittsburgh, U.S. Steel Tower,
55th Floor, 600 Grant Street, Pittsburgh, PA 15219, USA
Appl Health Econ Health Policy (2014) 12:573–585
DOI 10.1007/s40258-014-0124-7
Author's personal copy

Medicare and Medicaid Services (CMS) has been publicly
reporting the performance of Medicare-certified hospitals
on 30-day risk-standardized readmission measures for
acute myocardial infarction (AMI), heart failure (HF), and
pneumonia (PN) [1, 2]. Nationally, these conditions have a
high volume of index stays (more than 500,000 per con-
dition) and relatively high readmission rates (over 15 % on
average) across institutions [3], leading to a large number
of costly and potentially preventable readmissions annually
[4]. In October 2012, the Hospital Readmissions Reduction
Program established through the Affordable Care Act
authorized CMS to lower reimbursement to hospitals with
excess risk-standardized readmission rates for Medicare
patients with these conditions [5, 6].
As the systematic collection of health information
about individual patients and populations has become
more routine, predictive analytics is increasingly looked
to as a means for measuring, comparing, and managing
this risk. An array of modeling tools are available for
analyzing current and historical data in order to make
predictions about future, or otherwise unknown, events [7,
8]. While some of these tools have higher predictive
power than others, in many cases, they require data inputs
that are not readily available [9, 10]. Moreover, only a
calculated probability of a certain outcome is seen by the
end user. Further resources are then needed to analyze and
investigate the results in order to yield actionable infor-
mation. More transparent and easily understood modeling
tools may be better suited to help hospitals and clinicians
address the challenge of reducing hospital readmissions.
Decision trees, for example, create rules, or conditional
probabilities, that serve as the basis for the model’s pre-
dictions, such as ‘‘If a patient has finding A, B, or C, then
they will probably have outcome X.’’ Patient populations
are specified in a transparent manner for end users to
investigate, thus reducing evaluation and implementation
time.
This article demonstrates how hospitals and clinicians
can use their own structured discharge data to create
decision trees that produce highly transparent, clinically
relevant decision rules for better managing readmission
risk associated with AMI, HF, and PN. Similar to other
supervised learning processes [11], input data containing
both predictor (independent) and response (dependent)
variables are used to learn how to predict the value of the
response based on the predictors. The data are recursively
partitioned, enabling the formation of subgroups within a
population for which the value of the response variable is
relatively homogenous on the basis of values of the pre-
dictor variables and statistically dissimilar from other
subgroups. The resulting decision rules, summarized by a
graphical tree, can be used as a ‘‘check list’’ to support easy
implementation of the model.
2 Methods
2.1 Data Sources and Variable Computation
Convenience data from the publicly available California
State Inpatient Databases (SID) [12] of the Healthcare Cost
and Utilization Project (HCUP) [13] were used for this
demonstration. Derived from administrative data, HCUP
databases represent the largest collection of longitudinal
hospital care data in the USA. The SID contain more than
100 uniformly formatted clinical and nonclinical variables
[14] extracted from hospital discharge records for all
patients, regardless of insurer, that are routinely collected
across most hospital settings. Currently, 28 SID are avail-
able through HCUP.
SID data were purchased from the HCUP Central Dis-
tributor [15] for the years 2010 and 2011. The 2010 data
served as the decision tree training set, where known
readmissions for AMI, HF, and PN were given to the model
in order to train the decision rules. The 2011 data served as
the decision tree testing set, where only predictor values for
patients were passed to the algorithm. Because the model
was not optimized with this dataset, predictions were then
compared with observed outcomes to assess the model’s
predictive ability. Throughout the demonstration, admis-
sion leading to readmission served as the unit of
observation.
Only patients initially admitted with AMI, HF, and PN
diagnoses for general care and discharged to home were
included in the analyses. CMS classifies these patients
using International Classification of Diseases, Clinical
Modification (ICD-9-CM) codes associated with over
14,000 potential diagnoses [16]. To simplify the classifi-
cation procedure, CMS diagnosis-related group (CMS-
DRG) codes were used [17]. These codes classify hospital
cases into one of approximately 500 groups expected to
have similar hospital resource use based on ICD-9-CM
diagnoses, procedures, age, sex, discharge status, and the
presence of complications or comorbidities. Conditions
were defined by triplet DRGs, representing AMI, HF, or
PN with (1) a major complicating or comorbid condition
(MCC), (2) a complicating or comorbid condition (CC), or
(3) without an MCC or CC. Specifically, AMI was defined
by DRGs 280, 281, and 282, HF by DRGs 291, 292, and
293, and PN by DRGs 193, 194, and 195.
Discharges with readmission were classified as those
having a 30-day readmission into any (the same or other)
acute care facility within the California SID. Every quali-
fying hospital stay was counted as a separate index (start-
ing point) admission. In addition, following standard
methodology [18, 19], index admissions did not require a
prior ‘‘clean period’’ with no hospitalizations; that is, a
hospital stay could be a readmission for a prior stay and the
574 J. P. Hilbert et al.
Author's personal copy
index admission for a subsequent readmission. December
admissions for both 2010 and 2011 were removed because
of a lack of subsequent data to determine if a 30-day
readmission had occurred. Other exclusions included
patients who were discharged against medical advice, died
during hospitalization, or were transferred to another
facility. Table 1 shows the total number of admissions
leading to readmissions for each condition based on these
combined classification procedures.
Among the many variables available in the SID, those
representing important demographic, clinical, and health-
care utilization factors that have been previously associated
with readmission risk [20] were selected for this demon-
stration. A subset of the variables deemed too sparse to
define statistically significant partitions, such as hospital
birth or homeless indicators, were removed. Although
many of the selected variables were extracted directly from
the SID, a few were specially created or transformed in
order to facilitate the modeling process. For example,
30-day readmission was created by using the VISITLINK
and DAYSTOEVENT variables, and ICD-9-CM codes,
originally ranked in the SID per record, were transformed
into indicator variables per code per record. Use of the
Clinical Classifications Software (CCS) for ICD-9-CM
[21], developed as part of the HCUP, was also helpful for
collapsing the multitude of ICD-9-CM codes into a smaller
number of clinically meaningful categories. In order to
achieve sufficient balance between detail and size of the
data set, these codes were aggregated to the highest and
second highest multi-level CCS (MCCS).
2.2 Model Training and Testing
Model training and testing were performed in the R statis-
tical environment [22], using the standard, open-source
rpart package [23]. The algorithm was initiated with all of
the 2010 training data residing in the first node or root. An
initial split was made on the basis of the best predictor
variables, and subsequent splits were made from the
resultant child nodes until the trees reached the terminal
node where no more splits were made. Although decision
trees can be trained until each terminal node contains only a
single observation, this would create a vastly ‘‘over-fitted’’
model which begins to memorize the training data rather
than learning to generalize. Automated pruning by the
algorithm is typically incorporated. However, as this dem-
onstration was conducted for illustrative purposes only and
purposively designed to be as straightforward as possible,
each tree was arbitrarily limited to a depth of six levels, and
splits were constrained to occur only on partitions larger
than 4 % of the admissions of the group. Cross-validation
indicated that this approach was generally sufficient for
each condition. Because of these restrictions, at most 63
variables or nodes could be used to construct any one tree.
Model performance was determined by comparing the
area under the receiver operating characteristic (ROC)
curve (or AUC) and lift curves. The ROC curve illustrates
the performance of the classifier system as its discrimina-
tion (predicted risk) threshold is varied. These curves were
created by plotting the fraction of true positives out of the
total actual positives (TPR = true positive rate) versus the
fraction of false positives out of the total actual negatives
(FPR = false positive rate) at various threshold settings.
The AUC (C-statistic) aggregates performance across the
entire range of trade-offs between the TPR and FPR and
serves as the de facto standard for goodness of fit. Models
with a higher AUC have better performance, with 0.50
indicating random performance and 1.00 indicating perfect
performance. Another measure of model performance is
the lift of a subset of the population, or the ratio of the
predicted response rate for that subset to the predicted
response rate for the population. When seeking to manage
readmission risk, the population subset of interest is that
which, for any given condition, has the highest predicted
risk of being readmitted. A model is performing well if the
response within that subset is better than the average
response for the population. Since lift curves are typically
plotted and ordered by predicted risk (i.e., 0–10 % on the
curve represents the 10 % of the population predicted to be
most at risk by the model), they clearly show how different
segments are ‘‘lifted’’ above the baseline (random selec-
tion). These results are particularly meaningful to end users
who are seeking to define and investigate program outreach
populations.
Prior to creation of the final model, several trees were
built using different sets of variables and then evaluated
Table 1 Number of acute myocardial infarction, heart failure, and pneumonia admissions leading to readmission from the California State
Inpatient Databases
2010 (training) 2011 (testing)
Admissions Readmit rate (%) Admissions Readmit rate (%)
Acute myocardial infarction 10,848 20.6 10,701 19.7
Heart failure 39,682 25.5 38,409 25.2
Pneumonia 40,760 12.4 38,477 12.8
Using Decision Trees to Manage Hospital Readmission Risk 575
Author's personal copy
using the 2010 data. Since decision trees inherently choose
the best variable at each node, variable selection is less
essential to the modeling process than assessing the spe-
cific clinical levels to be used. Given their hierarchical
structure, the use of broad clinical levels can result in
overlap and yield redundant information, while finer
specification may result in over-fitting or obscure general
population features. Consequently, a number of compari-
sons were conducted using DRG, MCCS level 1, MCCS
level 2, procedure class, and co-morbidities in the model
while consistently including age, gender, emergency
department use, length of stay (LOS), and counts of
chronic conditions, procedures, and diagnoses. Perfor-
mance between sets varied at most by a 3 % gain in AUC
to no gain at all, because of the inherent nature of the
algorithm. In cross-validation, the AUC varied as much as
7 %. Table 2 lists the final set of variables used, which
includes DRG and MCCS level 1 since these clinical levels
yielded the largest gain in AUC from the standard set of
variables and the least variance in cross-validation across
all conditions.
3 Results
3.1 Performance
Table 3 provides the AUC and standard error of each tree
for each condition during training and testing. The best
performing condition was PN, with a testing AUC of 0.650,
which decreased only 1.22 % from training. Conversely,
HF was the worst performing condition, with a testing
AUC of 0.583, representing a 1.85 % drop from training.
AMI had a relatively high AUC in training, but decreased
in testing by 5.56 % to an AUC of 0.612. Figure 1 illus-
trates the lift for each condition in training and testing
versus the rate of positive prediction. Again, AMI varies
the most between training and testing. For higher-risk
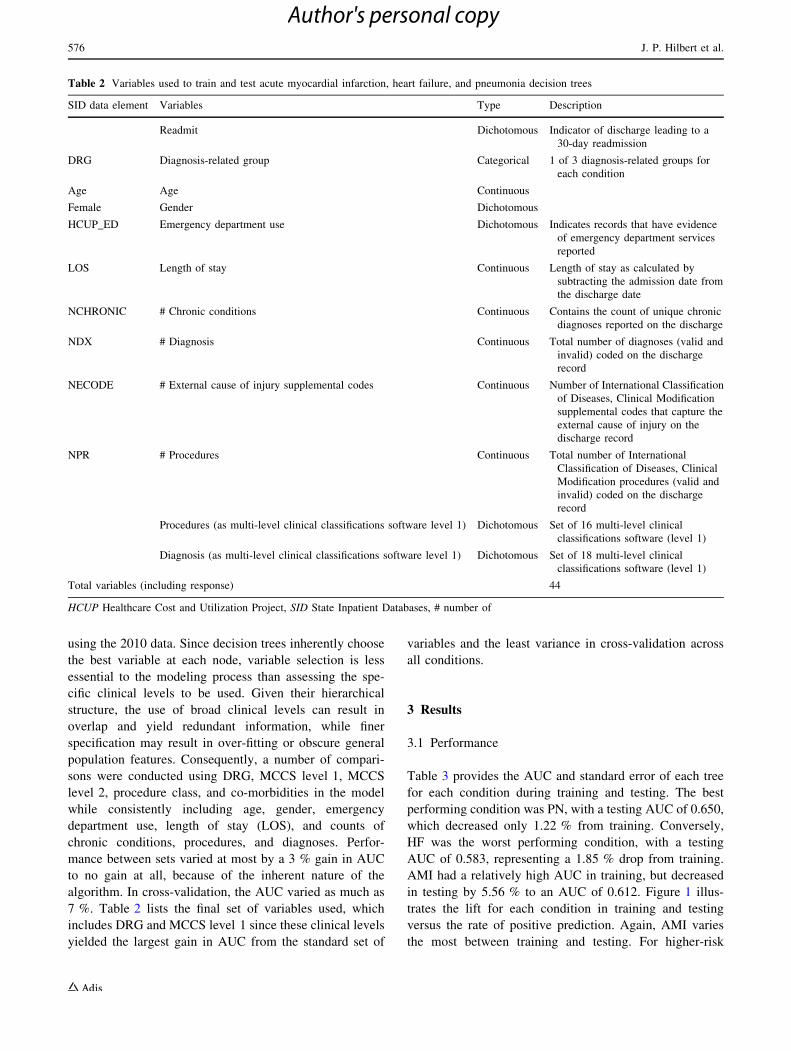
Table 2 Variables used to train and test acute myocardial infarction, heart failure, and pneumonia decision trees
SID data element Variables Type Description
Readmit Dichotomous Indicator of discharge leading to a
30-day readmission
DRG Diagnosis-related group Categorical 1 of 3 diagnosis-related groups for
each condition
Age Age Continuous
Female Gender Dichotomous
HCUP_ED Emergency department use Dichotomous Indicates records that have evidence
of emergency department services
reported
LOS Length of stay Continuous Length of stay as calculated by
subtracting the admission date from
the discharge date
NCHRONIC # Chronic conditions Continuous Contains the count of unique chronic
diagnoses reported on the discharge
NDX # Diagnosis Continuous Total number of diagnoses (valid and
invalid) coded on the discharge
record
NECODE # External cause of injury supplemental codes Continuous Number of International Classification
of Diseases, Clinical Modification
supplemental codes that capture the
external cause of injury on the
discharge record
NPR # Procedures Continuous Total number of International
Classification of Diseases, Clinical
Modification procedures (valid and
invalid) coded on the discharge
record
Procedures (as multi-level clinical classifications software level 1) Dichotomous Set of 16 multi-level clinical
classifications software (level 1)
Diagnosis (as multi-level clinical classifications software level 1) Dichotomous Set of 18 multi-level clinical
classifications software (level 1)
Total variables (including response) 44
HCUP Healthcare Cost and Utilization Project, SID State Inpatient Databases, # number of
576 J. P. Hilbert et al.
Author's personal copy
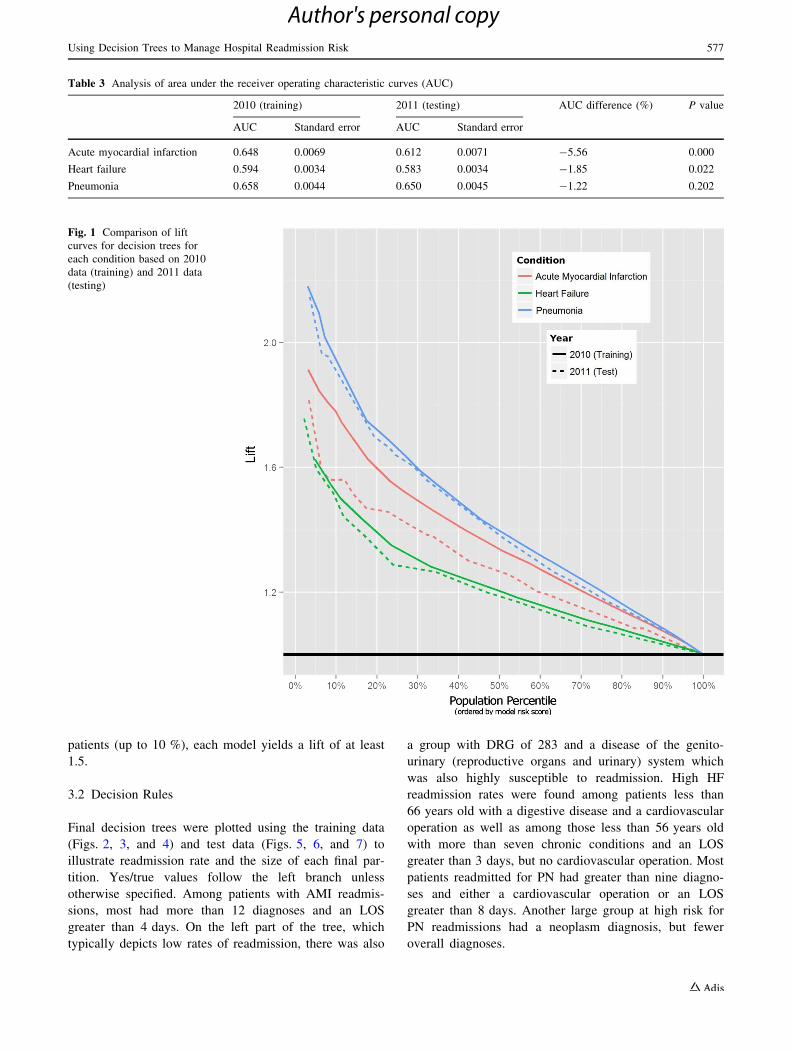
patients (up to 10 %), each model yields a lift of at least
1.5.
3.2 Decision Rules
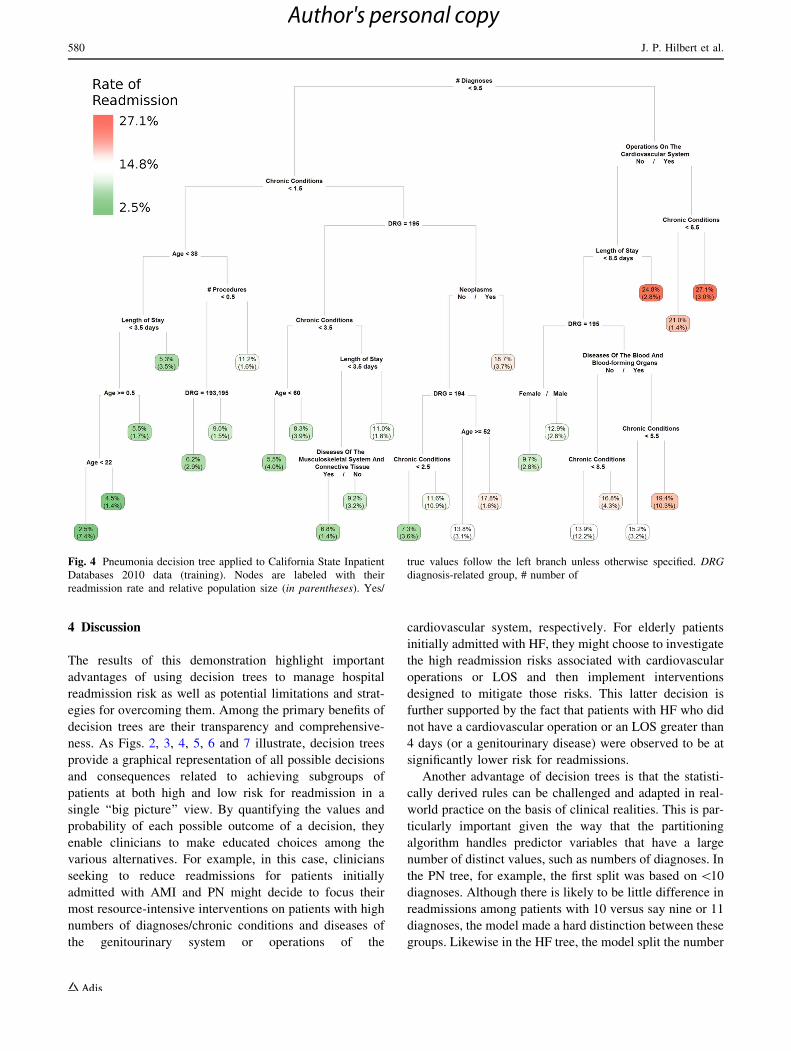
Final decision trees were plotted using the training data
(Figs. 2, 3, and 4) and test data (Figs. 5, 6, and 7) to
illustrate readmission rate and the size of each final par-
tition. Yes/true values follow the left branch unless
otherwise specified. Among patients with AMI readmis-
sions, most had more than 12 diagnoses and an LOS
greater than 4 days. On the left part of the tree, which
typically depicts low rates of readmission, there was also
a group with DRG of 283 and a disease of the genito-
urinary (reproductive organs and urinary) system which
was also highly susceptible to readmission. High HF
readmission rates were found among patients less than
66 years old with a digestive disease and a cardiovascular
operation as well as among those less than 56 years old
with more than seven chronic conditions and an LOS
greater than 3 days, but no cardiovascular operation. Most
patients readmitted for PN had greater than nine diagno-
ses and either a cardiovascular operation or an LOS
greater than 8 days. Another large group at high risk for
PN readmissions had a neoplasm diagnosis, but fewer
overall diagnoses.
Table 3 Analysis of area under the receiver operating characteristic curves (AUC)
2010 (training) 2011 (testing) AUC difference (%) P value
AUC Standard error AUC Standard error
Acute myocardial infarction 0.648 0.0069 0.612 0.0071 -5.56 0.000
Heart failure 0.594 0.0034 0.583 0.0034 -1.85 0.022
Pneumonia 0.658 0.0044 0.650 0.0045 -1.22 0.202
Fig. 1 Comparison of lift
curves for decision trees for
each condition based on 2010
data (training) and 2011 data
(testing)
Using Decision Trees to Manage Hospital Readmission Risk 577
Author's personal copy
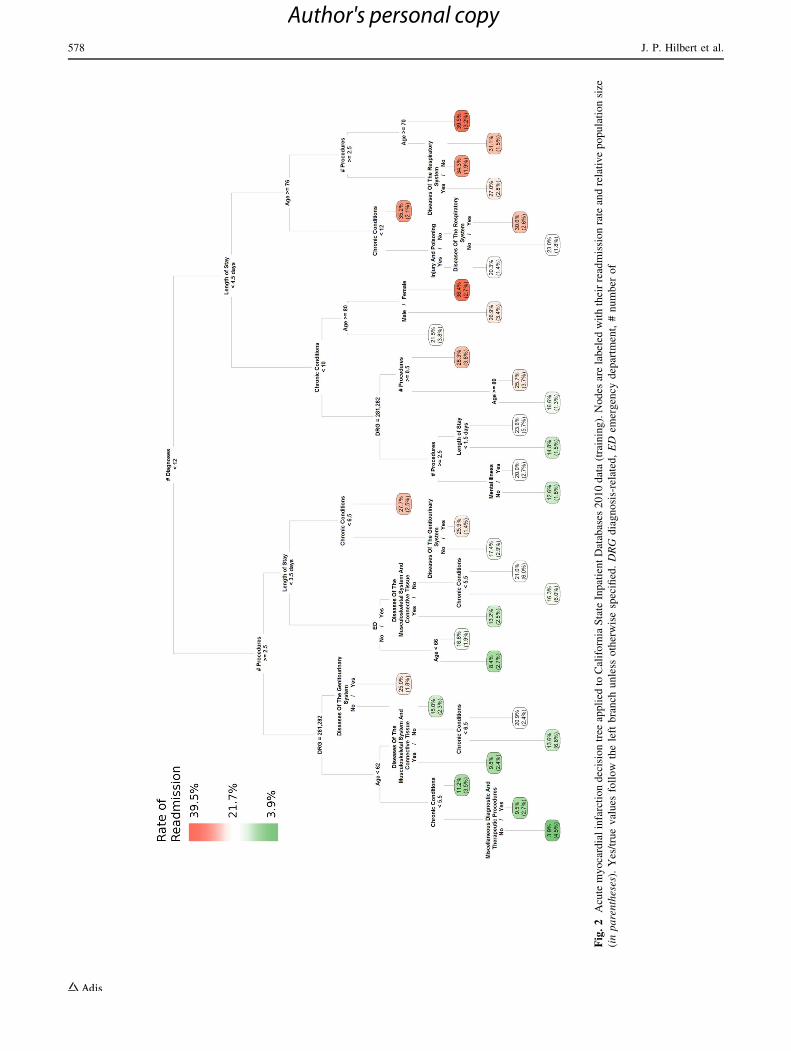
Fig
.2
Acu
tem
yo
card
ial
infa
rcti
on
dec
isio
ntr
eeap
pli
edto
Cal
ifo
rnia
Sta
teIn
pat
ien
tD
atab
ases
20
10
dat
a(t
rain
ing
).N
od
esar
ela
bel
edw
ith
thei
rre
adm
issi
on
rate
and
rela
tiv
ep
op
ula
tio
nsi
ze
(in
pa
ren
thes
es).
Yes
/tru
ev
alu
esfo
llo
wth
ele
ftb
ran
chu
nle
sso
ther
wis
esp
ecifi
ed.
DR
Gd
iag
no
sis-
rela
ted
,E
Dem
erg
ency
dep
artm
ent,
#n
um
ber
of
578 J. P. Hilbert et al.
Author's personal copy
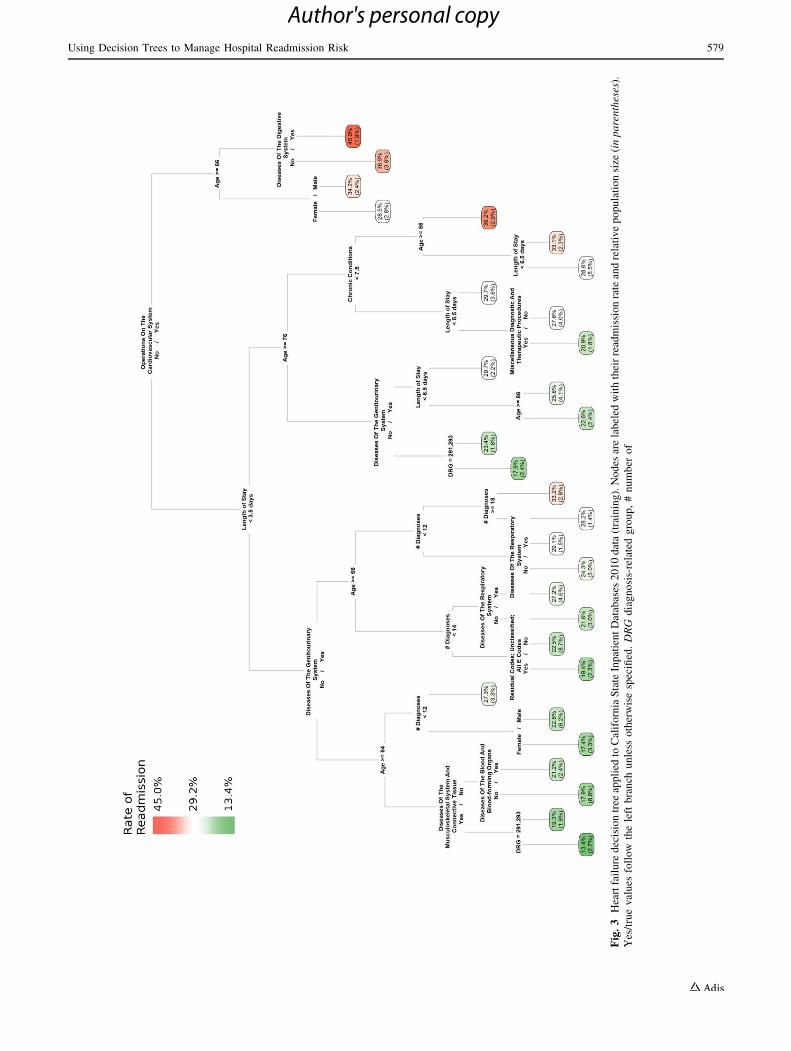
Fig
.3
Hea
rtfa
ilu
red
ecis
ion
tree
app
lied
toC
alif
orn
iaS
tate
Inp
atie
nt
Dat
abas
es2
01
0d
ata
(tra
inin
g).
No
des
are
lab
eled
wit
hth
eir
read
mis
sio
nra
tean
dre
lati
ve
po
pu
lati
on
size
(in
pa
ren
thes
es).
Yes
/tru
ev
alu
esfo
llo
wth
ele
ftb
ran
chu
nle
sso
ther
wis
esp
ecifi
ed.
DR
Gd
iag
no
sis-
rela
ted
gro
up
,#
nu
mb
ero
f
Using Decision Trees to Manage Hospital Readmission Risk 579
Author's personal copy
4 Discussion
The results of this demonstration highlight important
advantages of using decision trees to manage hospital
readmission risk as well as potential limitations and strat-
egies for overcoming them. Among the primary benefits of
decision trees are their transparency and comprehensive-
ness. As Figs. 2, 3, 4, 5, 6 and 7 illustrate, decision trees
provide a graphical representation of all possible decisions
and consequences related to achieving subgroups of
patients at both high and low risk for readmission in a
single ‘‘big picture’’ view. By quantifying the values and
probability of each possible outcome of a decision, they
enable clinicians to make educated choices among the
various alternatives. For example, in this case, clinicians
seeking to reduce readmissions for patients initially
admitted with AMI and PN might decide to focus their
most resource-intensive interventions on patients with high
numbers of diagnoses/chronic conditions and diseases of
the genitourinary system or operations of the
cardiovascular system, respectively. For elderly patients
initially admitted with HF, they might choose to investigate
the high readmission risks associated with cardiovascular
operations or LOS and then implement interventions
designed to mitigate those risks. This latter decision is
further supported by the fact that patients with HF who did
not have a cardiovascular operation or an LOS greater than
4 days (or a genitourinary disease) were observed to be at
significantly lower risk for readmissions.
Another advantage of decision trees is that the statisti-
cally derived rules can be challenged and adapted in real-
world practice on the basis of clinical realities. This is par-
ticularly important given the way that the partitioning
algorithm handles predictor variables that have a large
number of distinct values, such as numbers of diagnoses. In
the PN tree, for example, the first split was based on \10
diagnoses. Although there is likely to be little difference in
readmissions among patients with 10 versus say nine or 11
diagnoses, the model made a hard distinction between these
groups. Likewise in the HF tree, the model split the number
Fig. 4 Pneumonia decision tree applied to California State Inpatient
Databases 2010 data (training). Nodes are labeled with their
readmission rate and relative population size (in parentheses). Yes/
true values follow the left branch unless otherwise specified. DRG
diagnosis-related group, # number of
580 J. P. Hilbert et al.
Author's personal copy
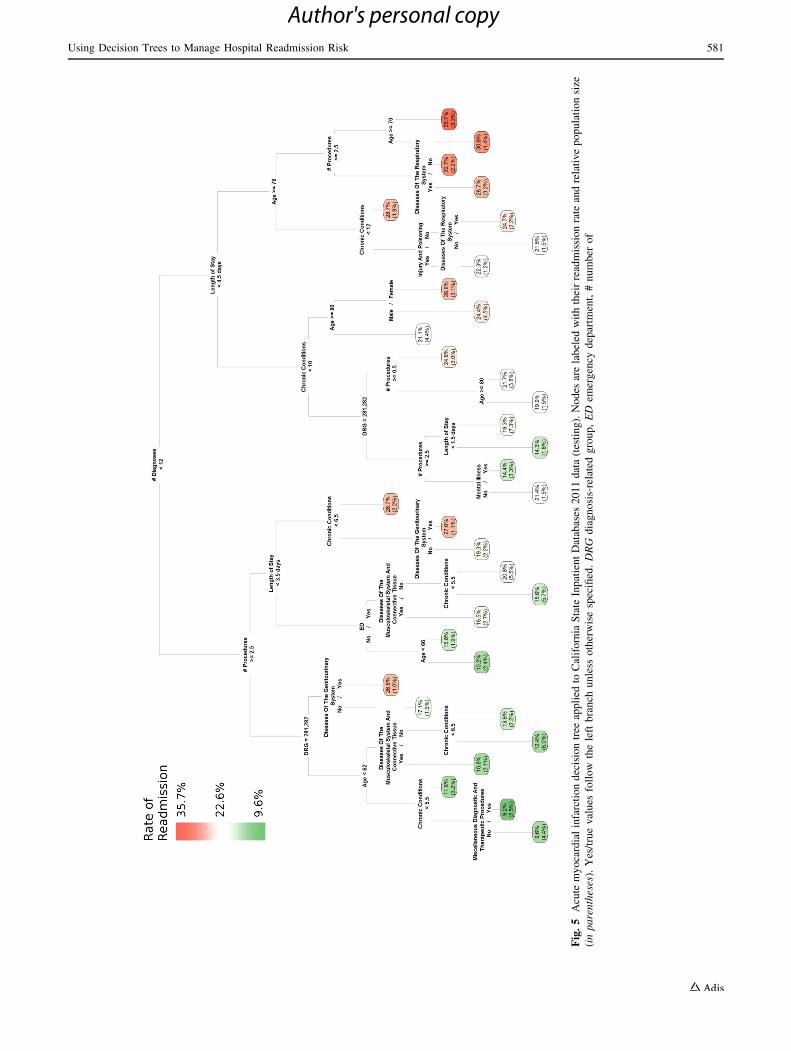
Fig
.5
Acu
tem
yo
card
ial
infa
rcti
on
dec
isio
ntr
eeap
pli
edto
Cal
ifo
rnia
Sta
teIn
pat
ien
tD
atab
ases
20
11
dat
a(t
esti
ng
).N
od
esar
ela
bel
edw
ith
thei
rre
adm
issi
on
rate
and
rela
tiv
ep
op
ula
tio
nsi
ze
(in
pa
ren
thes
es).
Yes
/tru
ev
alu
esfo
llo
wth
ele
ftb
ran
chu
nle
sso
ther
wis
esp
ecifi
ed.
DR
Gd
iag
no
sis-
rela
ted
gro
up
,E
Dem
erg
ency
dep
artm
ent,
#n
um
ber
of
Using Decision Trees to Manage Hospital Readmission Risk 581
Author's personal copy
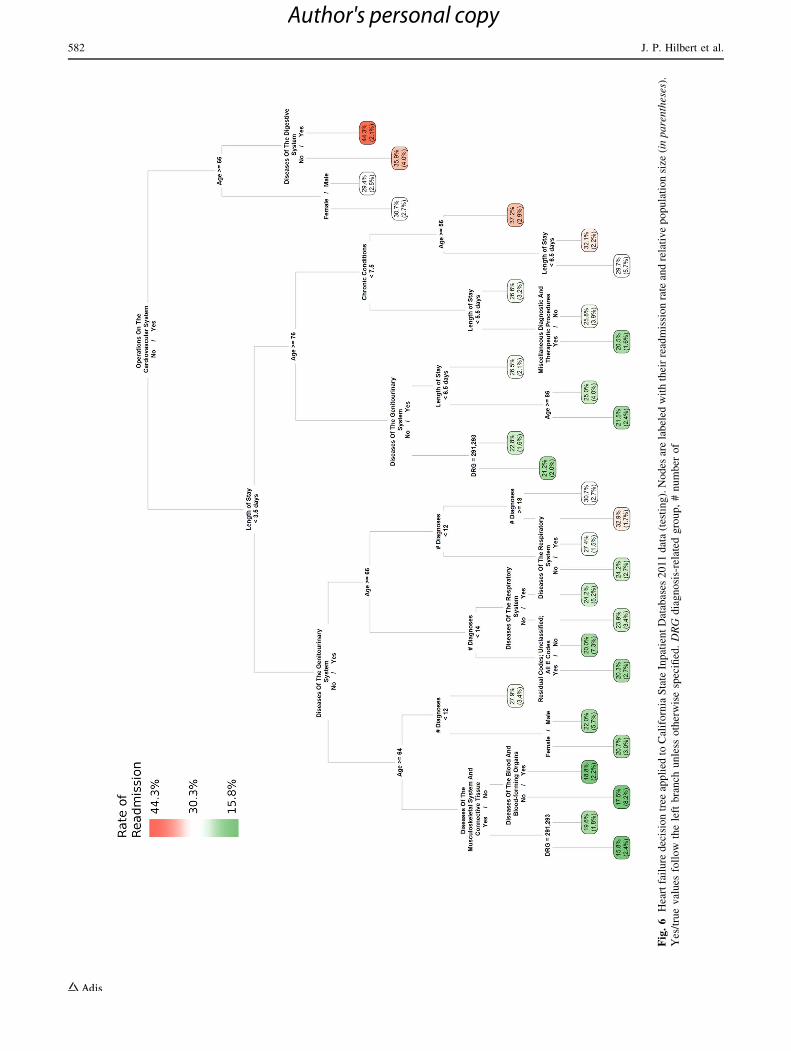
Fig
.6
Hea
rtfa
ilu
red
ecis
ion
tree
app
lied
toC
alif
orn
iaS
tate
Inp
atie
nt
Dat
abas
es2
01
1d
ata
(tes
tin
g).
No
des
are
lab
eled
wit
hth
eir
read
mis
sio
nra
tean
dre
lati
ve
po
pu
lati
on
size
(in
pa
ren
thes
es).
Yes
/tru
ev
alu
esfo
llo
wth
ele
ftb
ran
chu
nle
sso
ther
wis
esp
ecifi
ed.
DR
Gd
iag
no
sis-
rela
ted
gro
up
,#
nu
mb
ero
f
582 J. P. Hilbert et al.
Author's personal copy
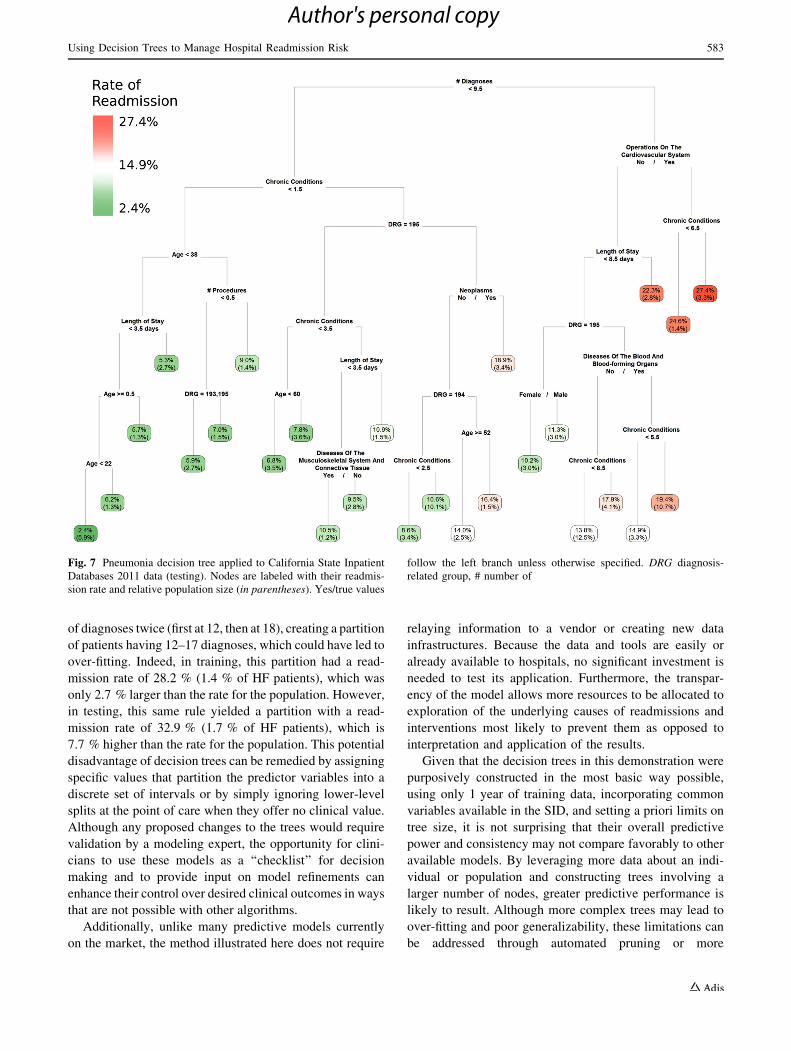
of diagnoses twice (first at 12, then at 18), creating a partition
of patients having 12–17 diagnoses, which could have led to
over-fitting. Indeed, in training, this partition had a read-
mission rate of 28.2 % (1.4 % of HF patients), which was
only 2.7 % larger than the rate for the population. However,
in testing, this same rule yielded a partition with a read-
mission rate of 32.9 % (1.7 % of HF patients), which is
7.7 % higher than the rate for the population. This potential
disadvantage of decision trees can be remedied by assigning
specific values that partition the predictor variables into a
discrete set of intervals or by simply ignoring lower-level
splits at the point of care when they offer no clinical value.
Although any proposed changes to the trees would require
validation by a modeling expert, the opportunity for clini-
cians to use these models as a ‘‘checklist’’ for decision
making and to provide input on model refinements can
enhance their control over desired clinical outcomes in ways
that are not possible with other algorithms.
Additionally, unlike many predictive models currently
on the market, the method illustrated here does not require
relaying information to a vendor or creating new data
infrastructures. Because the data and tools are easily or
already available to hospitals, no significant investment is
needed to test its application. Furthermore, the transpar-
ency of the model allows more resources to be allocated to
exploration of the underlying causes of readmissions and
interventions most likely to prevent them as opposed to
interpretation and application of the results.
Given that the decision trees in this demonstration were
purposively constructed in the most basic way possible,
using only 1 year of training data, incorporating common
variables available in the SID, and setting a priori limits on
tree size, it is not surprising that their overall predictive
power and consistency may not compare favorably to other
available models. By leveraging more data about an indi-
vidual or population and constructing trees involving a
larger number of nodes, greater predictive performance is
likely to result. Although more complex trees may lead to
over-fitting and poor generalizability, these limitations can
be addressed through automated pruning or more
Fig. 7 Pneumonia decision tree applied to California State Inpatient
Databases 2011 data (testing). Nodes are labeled with their readmis-
sion rate and relative population size (in parentheses). Yes/true values
follow the left branch unless otherwise specified. DRG diagnosis-
related group, # number of
Using Decision Trees to Manage Hospital Readmission Risk 583
Author's personal copy
sophisticated algorithms, such as boosted or ensemble
trees, which were not employed here. However, as these
techniques may compromise the transparency of decision
trees, the tradeoff between predictability and interpret-
ability should be carefully considered.
5 Conclusions
In the current healthcare environment, hospitals and clini-
cians must find new ways to manage financial risk, par-
ticularly the high costs associated with preventable
readmissions for AMI, HF, and PN. Among the numerous
predictive modeling tools that can be used to support these
efforts, decision trees may be the most uniquely suited to
hospital and clinician needs and constraints. These tools
can be easily constructed using readily available hospital
discharge data and, even in their most basic form, provide
easy-to-understand, clinically relevant information for
identifying important factors associated with readmissions,
targeting subgroups of patients at both high and low risk,
and designing and implementing interventions that are
appropriate to the risk levels observed.
In applications of predictive modeling where the accuracy
of a prediction is more important than the ability to explain the
reason for a decision, it may still be appropriate for less
transparent and more complex models to continue to serve as
the technique of choice. However, in order to manage read-
mission risk, hospitals and clinicians not only need to know
what is going to happen in the future, but how to take
advantage of existing information in clinically meaningful
ways. The decision tree algorithm serves as an ideal appli-
cation for addressing these unique healthcare challenges.
Acknowledgments This work was funded by the UPMC Health
Plan. The authors have no conflicts of interest that are directly rele-
vant to the contents of this article.
Author contributions John P. Hilbert conceptualized and planned
the work that led to the development of this manuscript and conducted
the modeling and analyses. All authors made substantial contributions
to analyzing and interpreting the results and revising the manuscript
for important intellectual content. While the first author is the guar-
antor of the overall content, all authors have approved the final ver-
sion of the manuscript.
References
1. Medicare.gov. Measures Displayed on Hospital Compare. 2013.
http://www.medicare.gov/hospitalcompare/Data/Measures-Displayed.
html. Accessed February 25, 2014.
2. QualityNet. About complication measures, Frequently asked
questions: CMS publicly reported risk-standardized outcome
measures AMI, HF, and pneumonia mortality and readmission
hospital-wide all-cause unplanned readmission THA/TKA
readmission and complication. https://staging.qualitynet.org/dcs/
ContentServer?c=Page&pagename=QnetPublic%2FPage%2FQ
netTier3&cid=1228772780555. Accessed February 26, 2014.
3. Elixhauser A, Steiner C. Readmissions to US hospitals by diag-
nosis, 2010. Healthcare Cost and Utilization Project Website.
2013. http://www.hcup-us.ahrq.gov/reports/statbriefs/sb153.pdf.
Accessed February 25, 2014.
4. Medicare Payment Advisory Commission. Report to the Con-
gress: promoting greater efficiency in Medicare. Washington,
DC: Medicare Payment Advisory Commission (MEDPAC);
2007.
5. American College of Emergency Physicians. Medicare’s Hospital
Readmission Reduction Program FAQ. Washington, DC. 2013.
https://www.acep.org/Legislation-and-Advocacy/Practice-Manage-
ment-Issues/Physician-Payment-Reform/Medicare-s-Hospital-
Readmission-Reduction-Program-FAQ/. Accessed February
25, 2014.
6. Centers for Medicare and Medicaid Services. Readmissions
Reduction Program. Balitmore, MD. 2013. http://www.cms.gov/
Medicare/Medicare-Fee-for-Service-Payment/AcuteInpatientPPS/
Readmissions-Reduction-Program.html. Accessed February 24,
2014.
7. Nyce C. Predictive analytics white paper. Malvern: American
Institute for CPCU/Insurance Institute of America; 2007.
8. Eckerson WW. Predictive analytics: extending the value of your
data warehousing investment. Data Wareh Inst Best Pract Rep.
2007;1:1–36.
9. MEDai insights. Data rich, analytics poor: predicting and
avoiding preventable 30-day re-hospitalizations. 2011. http://
www.writersstudio.com/samples/whitepapers/30-Day%20Read
missions_White%20Paper.pdf. Accessed June 11, 2014.
10. Kansagara D, Englander H, Salanitro A, Kagen D, Theobald C,
Freeman M, et al. Risk prediction models for hospital readmis-
sion: a systematic review. JAMA. 2011;306(15):1688–98.
11. Mohri M, Rostamizadeh A, Talwalkar A. Foundations of machine
learning. Cambridge, MA: MIT Press; 2012.
12. HCUP State Inpatient Databases (SID). Healthcare Cost and
Utilization Project (HCUP). Agency for Healthcare Research and
Quality, Rockville, MD. December 2013. www.hcup-us.ahrq.
gov/sidoverview.jsp. Accessed February 26, 2014.
13. HCUP Overview. Healthcare Cost and Utilization Project
(HCUP). Agency for Healthcare Research and Quality, Rockville,
MD. February 2014. http://www.hcup-us.ahrq.gov/overview.jsp.
Accessed March 7, 2014.
14. HCUP Central Distributor. Description of data elements—mul-
tiple variables for all states Healthcare Cost and Utilization
Project (HCUP). Agency for Healthcare Research and Quality,
Rockville, MD. 2008. http://www.hcup-us.ahrq.gov/db/state/
siddist/sid_multivar.jsp. Accessed February 26, 2014.
15. HCUP Central Distributor. Healthcare Cost and Utilization Pro-
ject (HCUP). Agency for Healthcare Research and Quality,
Rockville, MD. 2014. http://www.hcup-us.ahrq.gov/tech_assist/
centdist.jsp. Accessed February 26, 2014.
16. Centers for Medicare and Medicaid Services. ICD-9-CM and
ICD-10. Centers for Medicare and Medicaid Services, Baltimore,
MD. 2014. http://www.cms.gov/Medicare/Coding/ICD9Provider
DiagnosticCodes/index.html. Accessed February 26, 2014.
17. Centers for Medicare and Medicaid Services. List of diagnosis
related groups (DRGS), FY2008. Baltimore, MD. 2013. http://
www.cms.gov/Research-Statistics-Data-and-Systems/Statistics-
Trends-and-Reports/MedicareFeeforSvcPartsAB/downloads/
DRGdesc08.pdf. Accessed February 26, 2014.
18. HCUPnet. Calculating readmissions for HCUPnet. Agency for
Healthcare Research and Quality, Rockville, MD. November 1,
2012. http://hcupnet.ahrq.gov/HCUPnet.app/Methods-HCUPnet
%20readmissions.pdf. Accessed March 7, 2014.
584 J. P. Hilbert et al.
Author's personal copy

19. America’s Health Insurance Plans, Center for Policy and
Research. Working Paper: simple methods for measuring hospital
readmissions rates. Washington, DC: America’s Health Insurance
Plans; 2012.
20. Lee EW. Selecting the best prediction model for readmission.
J Prev Med Public Health. 2012;45(4):259–66.
21. HCUP Clinical Classifications Software (CCS) for ICD-9-CM.
Healthcare Cost and Utilization Project (HCUP). Agency for
Healthcare Research and Quality, Rockville, MD. January 2014.
www.hcup-us.ahrq.gov/toolssoftware/ccs/ccs.jsp. Accessed Feb-
ruary 26, 2014.
22. R Project. The R Project for Statistical Computing. 2014. http://
www.r-project.org/. Accessed February 26, 2014.
23. R Project. Package ‘rpart’: recursive partitioning and regression
trees. January 2014. http://cran.r-project.org/web/packages/rpart/
rpart.pdf. Accessed February 26, 2014.
Using Decision Trees to Manage Hospital Readmission Risk 585
Author's personal copy