Embed Size (px)
Citation preview
Hindawi Publishing CorporationJournal of Aging ResearchVolume 2012, Article ID 631310, 8 pagesdoi:10.1155/2012/631310
Research Article
Ready-to-Eat Cereal Consumption Patterns:The Relationship to Nutrient Intake, Whole Grain Intake,and Body Mass Index in an Older American Population
Ann M. Albertson,1 A. Christine Wold,2 and Nandan Joshi3
1 General Mills: Bell Institute of Health and Nutrition, James Ford Bell Technical Center, 9000 Plymouth Avenue North,Minneapolis, MN 55427, USA
2 General Mills: Quality & Regulatory Operations, 1 General Mills Boulevand, BT 10-D-1, Minneapolis, MN 55426, USA3 General Mills India Pvt. Ltd., 601-Prudential, Hiranandani Business Park, Powai, Mumbai 400076, India
Correspondence should be addressed to Ann M. Albertson, [email protected]
Received 13 April 2012; Revised 21 July 2012; Accepted 3 September 2012
Academic Editor: Nadine Sahyoun
Copyright © 2012 Ann M. Albertson et al. This is an open access article distributed under the Creative Commons AttributionLicense, which permits unrestricted use, distribution, and reproduction in any medium, provided the original work is properlycited.
Objective. To investigate the relationship between ready-to-eat (RTE) breakfast cereal consumption patterns and body massindex (BMI), nutrient intake, and whole grain intake in an older American population. Design. A cross-sectional survey of UShouseholds, collected by the NPD Group via the National Eating Trends (NET) survey. Main outcome measures include BMI,nutrient intake, and whole grain intake. Subjects/Setting. The sample included 1759 participants age 55 and older, which wasdivided into approximate quartiles based on intake of RTE breakfast cereal for the 2-week period (0 servings, 1–3 servings, 4–7servings, and ≥8 servings). Results. In the multivariate linear regression analysis adjusted for energy and age; intake of dietaryfiber, whole grains, and the majority of micronutrients examined were found to be positively associated with frequent RTEcereal consumption. The proportion of participants consuming less than the Estimated Average Requirement (EAR) was lowerfor the highest quartile of RTE cereal consumers compared to nonconsumers, for the majority of vitamins and minerals examined.Significant differences in BMI between RTE breakfast cereal intake groups were found for men. Conclusion. Results suggest thatready-to-eat breakfast cereals may contribute to the nutritional quality of the diets of older Americans. Prospective studies andexperimental trials are needed to better evaluate the role of RTE cereal consumption in energy balance.
1. Introduction
According to US Department of Health and Human Services,Administration on Aging population estimates, the numberof older Americans is expected to grow dramatically. By 2030,the number of adults aged 60+ is expected to increase toapproximately 25% of the population, while the number ofthe oldest old (age 85+) is expected to double [1]. Adequatenutrition is an important factor in continued health andindependence for older adults [2, 3].
Homebound elderly people who skip breakfast are morelikely to have inadequate nutrient intakes [2]. Caloric needstypically drop with advancing age, while needs for certainmicronutrients such as calcium, vitamin D, and vitamin B12
increase [4]. Thus the importance of choosing nutrient dense
foods increases for this population. Several cross-sectionalstudies have found positive associations between breakfastconsumption and RTE breakfast cereal consumption, andincreased nutrient intake for adult and elderly adult popu-lations [5–8]. RTE cereal provides a convenient and easy toprepare breakfast option, which can provide whole grainsand dietary fiber, along with many vitamins and minerals.RTE breakfast cereal is also an important contributor ofwhole grain in the US diet, providing approximately 30% ofdaily whole grain intake [9]. Recently, whole grain intake wasfound to be inversely associated with BMI and abdominalbody fat in an older American population [10].
Similar to other age groups, the prevalence of overweightand obesity in the elderly population is increasing [11]. Anestimated 76.5% of men and 73.5% of women ≥60 years old
2 Journal of Aging Research
are currently overweight or obese (BMI ≥ 25) while 36.6%of men and 42.3% of women ≥60 years old are estimated tobe obese (BMI ≥ 30) [12]. Based on recent NHANES data,McKeown estimates 62.5% of men and 74.9% of women ages60 to 69 years old are abdominally obese [10]. It has beensuggested that abdominal obesity may be a better measureof obesity than BMI in an older population, since after theage of 60 this population tends to lose lean body mass, whileincreasing visceral body fat [13].
A number of cross-sectional studies have examined theassociation of ready-to-eat (RTE) cereal intake with nutrientintake and body weight status. RTE cereal consumptionhas been found to be positively associated with intake of arange of vitamins and minerals and inversely associated withbody mass index (BMI) in child and adolescent populations[14, 15]. In addition, eating breakfast along with a pattern offrequent ready-to-eat cereal consumption is associated withlower BMI, higher nutrient intakes, and weight maintenancein adults [7, 16–19]. Research in older adults is lacking. Thus,we examined the association of RTE cereal consumptionpatterns with nutrient intake in a sample of older adults whoparticipated in a cross-sectional survey. The association ofRTE cereal consumption with BMI and percent overweightor obese (BMI ≥ 25) was also examined in this study.
2. Methods
Data collected as part of the National Eating Trends (NET)survey were analyzed. The NET survey is conducted bythe NPD Group, a marketing information company thathas been monitoring the intake of US households since1980 through this survey [20]. As described previously, theGeneral Mills Bell Institute of Health and Nutrition (BIHN)has developed a proprietary method for combining datafrom the NET survey’s 14-day food diary data, with portionsize estimates from the National Health and NutritionExamination Survey (NHANES) 1999–2004, and nutrientand food group data from the University of Minnesota’sNutrient Data System for Research (NDSR) Version 34, 2008(Nutrition Coordinating Center, Minneapolis, MN) [14].This combined dataset allows for population based, foodpattern comparisons of usual intake, based on categories offoods consumed.
2.1. Food Consumption Data. Annually, the NET surveysamples 2,000 households representing approximately 10,000individuals, and data from the March 2006 through February2008 survey were used for this study. To be included inthis study, the subjects must have completed at least 7 daysof food reporting and have provided height and weightdata for calculation of BMI. The NET survey included 1905participants age 55 and older, of these 1759 completed at least7 days of food diaries and provided height and weight data(92%). Of these 1759 participants, 46% were male, 54% werefemale, and 22% were ≥75 years old.
For the NET survey, each year the NPD Group collab-orates with a third party to establish a mail access panelthat is a cross-sectional group of US households (nonin-stitutionalized people in the contiguous 48 states). Survey
targets are set for the following demographic factors (familyversus nonfamily, age, household income, household size,age of head of household, employment status, race, andcensus region) based on US Census Bureau statistics. NPDuses historical response data to over-sample households withlower expected response rates and adjusts the target levelsquarterly to obtain a demographically and geographicallybalanced sample. Panelists are recruited using mailing listsand mall interventions, and NET survey panelists are thenrandomly selected from active mail panelists (those whohave returned at least 1 other survey). Participant incentivesinclude selection from a range of gifts ($25 to $30 value).Approximately 72% of households provide completed sur-veys for at least 10 of the 14 days of the annual survey.
Recruitment and data collection were conducted acrossall 52 weeks of the year. Each household member wasrequired to document food and beverage intake by main-taining a daily eating diary. The “person most responsiblefor meal preparation” was responsible for documenting thename and brand of all food consumed for all householdmembers, including any additions with cooking or foodpreparation. Description of the meal occasion (breakfast,lunch, snack, etc.) and location (at home, away from home)was included in the diary along with food names, flavordescriptors, brand names, package types, product form,special nutritional attributes, and other details. Food diaryrecords were mailed back on a daily basis for the 14 dayperiod.
2.2. Food Diary Data Entry. The University of Minnesota’sNutrition Database System for Research (NDS-R) providedthe nutrient and food group data for this study. The NDS-R system provides a comprehensive database of completenutrient data for 156 nutrients or components, for over18,000 foods. The database is updated on an ongoing basisand contains over 7,000 brand name products. NDS-Rhas over 100 food groups in the database and each foodis assigned a food group. Completed food diaries wereentered into NDS-R for calculation of nutrient intake andfood groups. Foods reported by NET survey panelists werematched, based on food diary descriptions to foods includedin the NDS-R database. The recipe module of the NDSsoftware was used to assign nutrient values to foods withspecial attributes (low fat, calcium fortified, reduced sodium,etc.) which were not found in the database and each recipewas assigned an appropriate food group.
2.3. Portion-Size Data. NET panelists record the foods andbeverages consumed by household members but not thequantities. This procedure is standard for panel surveys tominimize recorder burden and thus increase reliability. Por-tion-sizes were estimated by combining data from theNHANES 1999–2004. Serving weights for individual foodcodes were aggregated and then collapsed for like-foods tostrengthen cell sizes, and smoothed to eliminate outliers.Age and gender-specific mean serving weights were therebydetermined for over 800 food types; these portions weresubsequently assigned to each food recorded and coded inthe NET diary.
Journal of Aging Research 3
2.4. Data Tabulation. Of the 1905 older American adultswho were included in the NET survey, 146 participants wereexcluded for not meeting the inclusion criteria. 94% of thosein the analytic sample provided complete (14 days) fooddiaries. For the 6% of participants with 7 to 13 days ofdietary information the estimated servings of RTE cerealwere normalized to 14 to allow for placement in the studyquartiles. The pattern established over the 7- to 13-dayperiod was assumed to be constant for the full 14 days.For example if no RTE cereal was consumed in the dayscollected, no servings would be included for the full 14 days,or if 2 servings were consumed in 7 days, 4 servings wouldbe assumed for the full 14-day period. Self-reported valuesfor height and weight were provided by each individual inthe study. BMI was calculated by using the formula: BMI =weight (lb)/height (in)2 × 703.
Servings of whole grains consumed by study partici-pants were estimated based on food group assignments inthe NDS-R database. All grain-based foods in the NDSRdatabase are categorized as being either “whole grain,” “somewhole grain” or “refined grain”. To be assigned to the “wholegrain” category the first grain ingredient in the product mustbe a whole grain. Foods assigned to the “some whole grain”category are products that contain whole grain ingredients,but the first grain ingredient is not a whole grain. “Refinedgrain” products are those that contain no whole grainingredients. In this paper servings of whole grains werecalculated by summing serving of foods classified as “wholegrain” in the database.
2.5. Statistical Analysis. To examine whether RTE cerealconsumption was associated with BMI, body weight status,whole grain, and nutrient intake a series of analysis ofvariance (ANOVA) models were conducted by approximatequartiles of RTE cereal intake. Slightly greater than onequarter of the participants were nonconsumers, whichmade breaks in intake levels approximate rather than exactquartiles of RTE cereal intake (Table 1).
Logistic regression modeling was conducted to examinethe association between RTE cereal consumption patternand odds of falling below Estimated Average Requirement(EAR) for micronutrients with an established intake level.Covariates included within the ANOVA and logistic regres-sion models were energy and age. Values were adjusted forenergy to see if RTE cereal consumption was associated witha more nutrient dense diet. Age was included as a covariate,because it is associated with both RTE cereal consumptionand nutrient intake. The contrasts were examined betweenthe possible pairs of cereal consumption categories using theWald chi-square test.
Logistic regression was used to compare odds of beingoverweight or obese by level of RTE cereal consumption. Thecontrasts were examined between the possible pairs of cerealconsumption categories using the Wald chi-square test. Forboth the ANOVA and logistic regression models examiningthe association of RTE cereal consumption with body weightage and age2 were included as covariates. Age2 was includedbecause the relationship between BMI and age is not linear,around 60 years of age this relationship can change [13]. All
analyses were stratified by sex, because it was hypothesizedthat the association of RTE cereal consumption with themeasured outcomes may vary by sex.
An alpha level of 0.01 was used to determine thesignificance for the analysis of variance comparisons, exceptwhere otherwise noted. All analyses were performed usingSAS version 9.2 (SAS Institute, Cary, NC).
3. Results
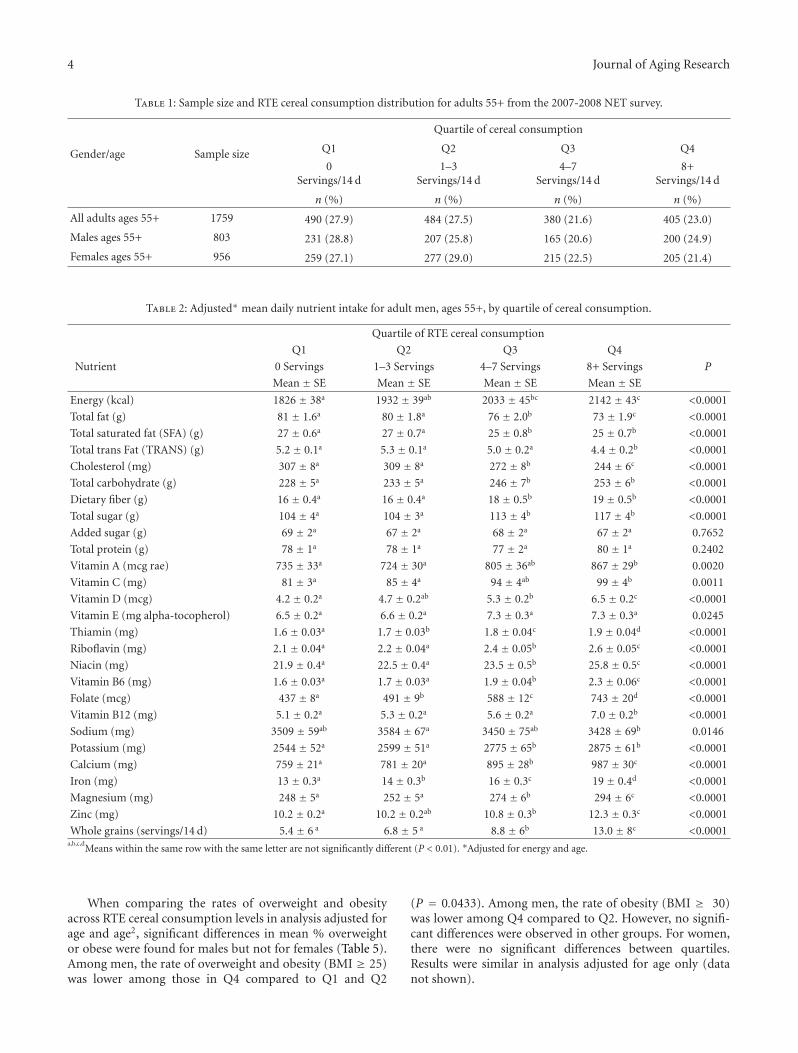
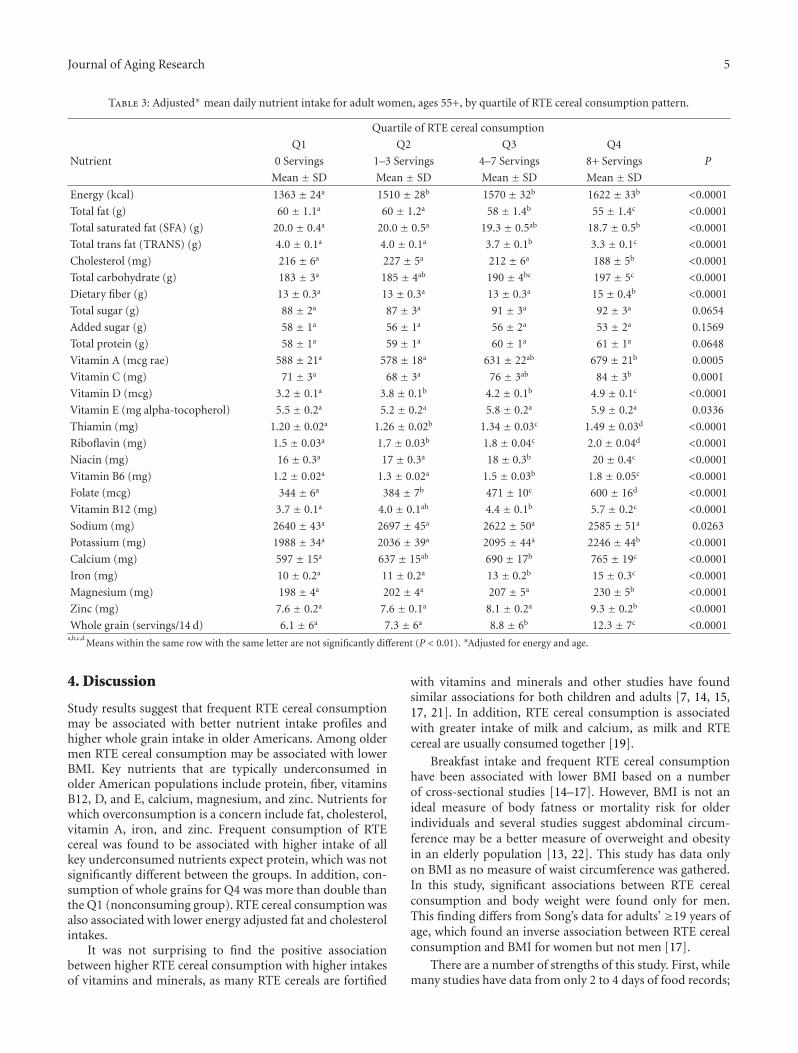
The sample size and RTE cereal consumption distributionare displayed in Table 1. With respect to findings related tofood and nutrient intake, the objective of this study was todetermine the relationship between RTE cereal quartile ofconsumption to nutrient intake. For both men and womenin the sample, significant differences in nutrient intakesbetween the fourth quartile (Q4) compared to the lowesttwo quartiles (Q1 and Q2) of RTE cereal consumption wereseen for most nutrients examined (Table 2). For males, Q4intake of energy was higher compared to Q1 and Q2. Afteradjusting for energy and age there was a significantly lower(P < 0.01) intake of total fat, total saturated fat, total transfat, and cholesterol among those in Q4 compared to Q1 andQ2. In addition among men, intakes of total carbohydrate,dietary fiber, total sugar, vitamin A, vitamin C, vitaminD, thiamin, riboflavin, niacin, vitamin B6, folate, vitaminB12, potassium, calcium, iron, magnesium, and zinc weresignificantly higher (P < 0.01) among those in Q4 comparedto those in Q1 and Q2. There were no significant differencesbetween intake of total protein, added sugar, or vitamin Eacross consumption patterns of RTE cereal. Sodium intakewas not significantly different between the highest and lowestquartiles of intake. Similar relationships were found forwomen age 55+ (Table 3), with the exception of total sugarintake which was not significantly different across quartilesof RTE cereal intake.
In addition to significant differences in nutrient intake,this study found whole grain intake to be positively associat-ed with RTE cereal consumption. For both men and women,average whole grain intake among those in Q4 of RTE cerealconsumption was nearly double the whole grain intake ofthose in the Q1 (the nonconsumers) (Tables 2 and 3).
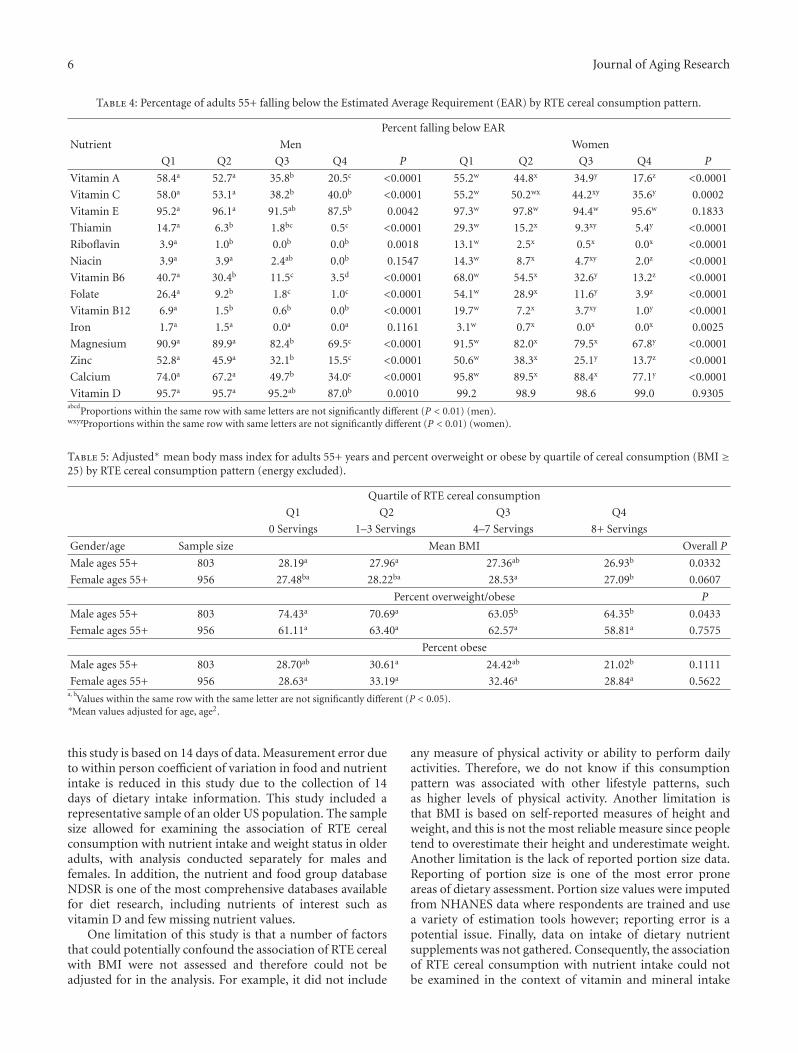
The percentage of participants in each quartile that fellbelow Estimated Average Requirement (EAR) for nutrientswith established EAR amounts was examined (Table 4). Asignificant inverse linear relationship was found between thefrequency of RTE cereal consumption and the percentageof participants failing to consume the EAR for a numberof nutrients. In women, this relationship was found for allnutrients examined except vitamin D and E and for men, allbut niacin and iron.
In examining the relationship of RTE cereal consumptionpatterns and BMI there were some significant differencesfound in mean BMI for all men and all women (Table 5).With respect to men, the adjusted mean BMI was signifi-cantly lower among those in Q4 compared to Q1 and Q2(P = 0.0332). For women, there were significant differencesbetween Q3 and Q4, but no significant differences betweenthe highest and lowest quartiles of RTE cereal intake.
4 Journal of Aging Research
Table 1: Sample size and RTE cereal consumption distribution for adults 55+ from the 2007-2008 NET survey.
Gender/age Sample size
Quartile of cereal consumption
Q1 Q2 Q3 Q4
0Servings/14 d
1–3Servings/14 d
4–7Servings/14 d
8+Servings/14 d
n (%) n (%) n (%) n (%)
All adults ages 55+ 1759 490 (27.9) 484 (27.5) 380 (21.6) 405 (23.0)
Males ages 55+ 803 231 (28.8) 207 (25.8) 165 (20.6) 200 (24.9)
Females ages 55+ 956 259 (27.1) 277 (29.0) 215 (22.5) 205 (21.4)
Table 2: Adjusted∗ mean daily nutrient intake for adult men, ages 55+, by quartile of cereal consumption.
Quartile of RTE cereal consumption
Q1 Q2 Q3 Q4
Nutrient 0 Servings 1–3 Servings 4–7 Servings 8+ Servings P
Mean ± SE Mean ± SE Mean ± SE Mean ± SE
Energy (kcal) 1826 ± 38a 1932 ± 39ab 2033 ± 45bc 2142 ± 43c <0.0001
Total fat (g) 81 ± 1.6a 80 ± 1.8a 76 ± 2.0b 73 ± 1.9c <0.0001
Total saturated fat (SFA) (g) 27 ± 0.6a 27 ± 0.7a 25 ± 0.8b 25 ± 0.7b <0.0001
Total trans Fat (TRANS) (g) 5.2 ± 0.1a 5.3 ± 0.1a 5.0 ± 0.2a 4.4 ± 0.2b <0.0001
Cholesterol (mg) 307 ± 8a 309 ± 8a 272 ± 8b 244 ± 6c <0.0001
Total carbohydrate (g) 228 ± 5a 233 ± 5a 246 ± 7b 253 ± 6b <0.0001
Dietary fiber (g) 16 ± 0.4a 16 ± 0.4a 18 ± 0.5b 19 ± 0.5b <0.0001
Total sugar (g) 104 ± 4a 104 ± 3a 113 ± 4b 117 ± 4b <0.0001
Added sugar (g) 69 ± 2a 67 ± 2a 68 ± 2a 67 ± 2a 0.7652
Total protein (g) 78 ± 1a 78 ± 1a 77 ± 2a 80 ± 1a 0.2402
Vitamin A (mcg rae) 735 ± 33a 724 ± 30a 805 ± 36ab 867 ± 29b 0.0020
Vitamin C (mg) 81 ± 3a 85 ± 4a 94 ± 4ab 99 ± 4b 0.0011
Vitamin D (mcg) 4.2 ± 0.2a 4.7 ± 0.2ab 5.3 ± 0.2b 6.5 ± 0.2c <0.0001
Vitamin E (mg alpha-tocopherol) 6.5 ± 0.2a 6.6 ± 0.2a 7.3 ± 0.3a 7.3 ± 0.3a 0.0245
Thiamin (mg) 1.6 ± 0.03a 1.7 ± 0.03b 1.8 ± 0.04c 1.9 ± 0.04d <0.0001
Riboflavin (mg) 2.1 ± 0.04a 2.2 ± 0.04a 2.4 ± 0.05b 2.6 ± 0.05c <0.0001
Niacin (mg) 21.9 ± 0.4a 22.5 ± 0.4a 23.5 ± 0.5b 25.8 ± 0.5c <0.0001
Vitamin B6 (mg) 1.6 ± 0.03a 1.7 ± 0.03a 1.9 ± 0.04b 2.3 ± 0.06c <0.0001
Folate (mcg) 437 ± 8a 491 ± 9b 588 ± 12c 743 ± 20d <0.0001
Vitamin B12 (mg) 5.1 ± 0.2a 5.3 ± 0.2a 5.6 ± 0.2a 7.0 ± 0.2b <0.0001
Sodium (mg) 3509 ± 59ab 3584 ± 67a 3450 ± 75ab 3428 ± 69b 0.0146
Potassium (mg) 2544 ± 52a 2599 ± 51a 2775 ± 65b 2875 ± 61b <0.0001
Calcium (mg) 759 ± 21a 781 ± 20a 895 ± 28b 987 ± 30c <0.0001
Iron (mg) 13 ± 0.3a 14 ± 0.3b 16 ± 0.3c 19 ± 0.4d <0.0001
Magnesium (mg) 248 ± 5a 252 ± 5a 274 ± 6b 294 ± 6c <0.0001
Zinc (mg) 10.2 ± 0.2a 10.2 ± 0.2ab 10.8 ± 0.3b 12.3 ± 0.3c <0.0001
Whole grains (servings/14 d) 5.4 ± 6 a 6.8 ± 5 a 8.8 ± 6b 13.0 ± 8c <0.0001a,b,c,d
Means within the same row with the same letter are not significantly different (P < 0.01). ∗Adjusted for energy and age.
When comparing the rates of overweight and obesityacross RTE cereal consumption levels in analysis adjusted forage and age2, significant differences in mean % overweightor obese were found for males but not for females (Table 5).Among men, the rate of overweight and obesity (BMI ≥ 25)was lower among those in Q4 compared to Q1 and Q2
(P = 0.0433). Among men, the rate of obesity (BMI ≥ 30)was lower among Q4 compared to Q2. However, no signifi-cant differences were observed in other groups. For women,there were no significant differences between quartiles.Results were similar in analysis adjusted for age only (datanot shown).
Journal of Aging Research 5
Table 3: Adjusted∗ mean daily nutrient intake for adult women, ages 55+, by quartile of RTE cereal consumption pattern.
Quartile of RTE cereal consumption
Q1 Q2 Q3 Q4
Nutrient 0 Servings 1–3 Servings 4–7 Servings 8+ Servings P
Mean ± SD Mean ± SD Mean ± SD Mean ± SD
Energy (kcal) 1363 ± 24a 1510 ± 28b 1570 ± 32b 1622 ± 33b <0.0001
Total fat (g) 60 ± 1.1a 60 ± 1.2a 58 ± 1.4b 55 ± 1.4c <0.0001
Total saturated fat (SFA) (g) 20.0 ± 0.4a 20.0 ± 0.5a 19.3 ± 0.5ab 18.7 ± 0.5b <0.0001
Total trans fat (TRANS) (g) 4.0 ± 0.1a 4.0 ± 0.1a 3.7 ± 0.1b 3.3 ± 0.1c <0.0001
Cholesterol (mg) 216 ± 6a 227 ± 5a 212 ± 6a 188 ± 5b <0.0001
Total carbohydrate (g) 183 ± 3a 185 ± 4ab 190 ± 4bc 197 ± 5c <0.0001
Dietary fiber (g) 13 ± 0.3a 13 ± 0.3a 13 ± 0.3a 15 ± 0.4b <0.0001
Total sugar (g) 88 ± 2a 87 ± 3a 91 ± 3a 92 ± 3a 0.0654
Added sugar (g) 58 ± 1a 56 ± 1a 56 ± 2a 53 ± 2a 0.1569
Total protein (g) 58 ± 1a 59 ± 1a 60 ± 1a 61 ± 1a 0.0648
Vitamin A (mcg rae) 588 ± 21a 578 ± 18a 631 ± 22ab 679 ± 21b 0.0005
Vitamin C (mg) 71 ± 3a 68 ± 3a 76 ± 3ab 84 ± 3b 0.0001
Vitamin D (mcg) 3.2 ± 0.1a 3.8 ± 0.1b 4.2 ± 0.1b 4.9 ± 0.1c <0.0001
Vitamin E (mg alpha-tocopherol) 5.5 ± 0.2a 5.2 ± 0.2a 5.8 ± 0.2a 5.9 ± 0.2a 0.0336
Thiamin (mg) 1.20 ± 0.02a 1.26 ± 0.02b 1.34 ± 0.03c 1.49 ± 0.03d <0.0001
Riboflavin (mg) 1.5 ± 0.03a 1.7 ± 0.03b 1.8 ± 0.04c 2.0 ± 0.04d <0.0001
Niacin (mg) 16 ± 0.3a 17 ± 0.3a 18 ± 0.3b 20 ± 0.4c <0.0001
Vitamin B6 (mg) 1.2 ± 0.02a 1.3 ± 0.02a 1.5 ± 0.03b 1.8 ± 0.05c <0.0001
Folate (mcg) 344 ± 6a 384 ± 7b 471 ± 10c 600 ± 16d <0.0001
Vitamin B12 (mg) 3.7 ± 0.1a 4.0 ± 0.1ab 4.4 ± 0.1b 5.7 ± 0.2c <0.0001
Sodium (mg) 2640 ± 43a 2697 ± 45a 2622 ± 50a 2585 ± 51a 0.0263
Potassium (mg) 1988 ± 34a 2036 ± 39a 2095 ± 44a 2246 ± 44b <0.0001
Calcium (mg) 597 ± 15a 637 ± 15ab 690 ± 17b 765 ± 19c <0.0001
Iron (mg) 10 ± 0.2a 11 ± 0.2a 13 ± 0.2b 15 ± 0.3c <0.0001
Magnesium (mg) 198 ± 4a 202 ± 4a 207 ± 5a 230 ± 5b <0.0001
Zinc (mg) 7.6 ± 0.2a 7.6 ± 0.1a 8.1 ± 0.2a 9.3 ± 0.2b <0.0001
Whole grain (servings/14 d) 6.1 ± 6a 7.3 ± 6a 8.8 ± 6b 12.3 ± 7c <0.0001a,b,c,d
Means within the same row with the same letter are not significantly different (P < 0.01). ∗Adjusted for energy and age.
4. Discussion
Study results suggest that frequent RTE cereal consumptionmay be associated with better nutrient intake profiles andhigher whole grain intake in older Americans. Among oldermen RTE cereal consumption may be associated with lowerBMI. Key nutrients that are typically underconsumed inolder American populations include protein, fiber, vitaminsB12, D, and E, calcium, magnesium, and zinc. Nutrients forwhich overconsumption is a concern include fat, cholesterol,vitamin A, iron, and zinc. Frequent consumption of RTEcereal was found to be associated with higher intake of allkey underconsumed nutrients expect protein, which was notsignificantly different between the groups. In addition, con-sumption of whole grains for Q4 was more than double thanthe Q1 (nonconsuming group). RTE cereal consumption wasalso associated with lower energy adjusted fat and cholesterolintakes.
It was not surprising to find the positive associationbetween higher RTE cereal consumption with higher intakesof vitamins and minerals, as many RTE cereals are fortified
with vitamins and minerals and other studies have foundsimilar associations for both children and adults [7, 14, 15,17, 21]. In addition, RTE cereal consumption is associatedwith greater intake of milk and calcium, as milk and RTEcereal are usually consumed together [19].
Breakfast intake and frequent RTE cereal consumptionhave been associated with lower BMI based on a numberof cross-sectional studies [14–17]. However, BMI is not anideal measure of body fatness or mortality risk for olderindividuals and several studies suggest abdominal circum-ference may be a better measure of overweight and obesityin an elderly population [13, 22]. This study has data onlyon BMI as no measure of waist circumference was gathered.In this study, significant associations between RTE cerealconsumption and body weight were found only for men.This finding differs from Song’s data for adults’ ≥19 years ofage, which found an inverse association between RTE cerealconsumption and BMI for women but not men [17].
There are a number of strengths of this study. First, whilemany studies have data from only 2 to 4 days of food records;
6 Journal of Aging Research
Table 4: Percentage of adults 55+ falling below the Estimated Average Requirement (EAR) by RTE cereal consumption pattern.
Percent falling below EAR
Nutrient Men Women
Q1 Q2 Q3 Q4 P Q1 Q2 Q3 Q4 P
Vitamin A 58.4a 52.7a 35.8b 20.5c <0.0001 55.2w 44.8x 34.9y 17.6z <0.0001
Vitamin C 58.0a 53.1a 38.2b 40.0b <0.0001 55.2w 50.2wx 44.2xy 35.6y 0.0002
Vitamin E 95.2a 96.1a 91.5ab 87.5b 0.0042 97.3w 97.8w 94.4w 95.6w 0.1833
Thiamin 14.7a 6.3b 1.8bc 0.5c <0.0001 29.3w 15.2x 9.3xy 5.4y <0.0001
Riboflavin 3.9a 1.0b 0.0b 0.0b 0.0018 13.1w 2.5x 0.5x 0.0x <0.0001
Niacin 3.9a 3.9a 2.4ab 0.0b 0.1547 14.3w 8.7x 4.7xy 2.0z <0.0001
Vitamin B6 40.7a 30.4b 11.5c 3.5d <0.0001 68.0w 54.5x 32.6y 13.2z <0.0001
Folate 26.4a 9.2b 1.8c 1.0c <0.0001 54.1w 28.9x 11.6y 3.9z <0.0001
Vitamin B12 6.9a 1.5b 0.6b 0.0b <0.0001 19.7w 7.2x 3.7xy 1.0y <0.0001
Iron 1.7a 1.5a 0.0a 0.0a 0.1161 3.1w 0.7x 0.0x 0.0x 0.0025
Magnesium 90.9a 89.9a 82.4b 69.5c <0.0001 91.5w 82.0x 79.5x 67.8y <0.0001
Zinc 52.8a 45.9a 32.1b 15.5c <0.0001 50.6w 38.3x 25.1y 13.7z <0.0001
Calcium 74.0a 67.2a 49.7b 34.0c <0.0001 95.8w 89.5x 88.4x 77.1y <0.0001
Vitamin D 95.7a 95.7a 95.2ab 87.0b 0.0010 99.2 98.9 98.6 99.0 0.9305abcd
Proportions within the same row with same letters are not significantly different (P < 0.01) (men).wxyzProportions within the same row with same letters are not significantly different (P < 0.01) (women).
Table 5: Adjusted∗ mean body mass index for adults 55+ years and percent overweight or obese by quartile of cereal consumption (BMI ≥25) by RTE cereal consumption pattern (energy excluded).
Quartile of RTE cereal consumption
Q1 Q2 Q3 Q4
0 Servings 1–3 Servings 4–7 Servings 8+ Servings
Gender/age Sample size Mean BMI Overall P
Male ages 55+ 803 28.19a 27.96a 27.36ab 26.93b 0.0332
Female ages 55+ 956 27.48ba 28.22ba 28.53a 27.09b 0.0607
Percent overweight/obese P
Male ages 55+ 803 74.43a 70.69a 63.05b 64.35b 0.0433
Female ages 55+ 956 61.11a 63.40a 62.57a 58.81a 0.7575
Percent obese
Male ages 55+ 803 28.70ab 30.61a 24.42ab 21.02b 0.1111
Female ages 55+ 956 28.63a 33.19a 32.46a 28.84a 0.5622a, b
Values within the same row with the same letter are not significantly different (P < 0.05).∗Mean values adjusted for age, age2.
this study is based on 14 days of data. Measurement error dueto within person coefficient of variation in food and nutrientintake is reduced in this study due to the collection of 14days of dietary intake information. This study included arepresentative sample of an older US population. The samplesize allowed for examining the association of RTE cerealconsumption with nutrient intake and weight status in olderadults, with analysis conducted separately for males andfemales. In addition, the nutrient and food group databaseNDSR is one of the most comprehensive databases availablefor diet research, including nutrients of interest such asvitamin D and few missing nutrient values.
One limitation of this study is that a number of factorsthat could potentially confound the association of RTE cerealwith BMI were not assessed and therefore could not beadjusted for in the analysis. For example, it did not include
any measure of physical activity or ability to perform dailyactivities. Therefore, we do not know if this consumptionpattern was associated with other lifestyle patterns, suchas higher levels of physical activity. Another limitation isthat BMI is based on self-reported measures of height andweight, and this is not the most reliable measure since peopletend to overestimate their height and underestimate weight.Another limitation is the lack of reported portion size data.Reporting of portion size is one of the most error proneareas of dietary assessment. Portion size values were imputedfrom NHANES data where respondents are trained and usea variety of estimation tools however; reporting error is apotential issue. Finally, data on intake of dietary nutrientsupplements was not gathered. Consequently, the associationof RTE cereal consumption with nutrient intake could notbe examined in the context of vitamin and mineral intake
Journal of Aging Research 7
for all sources. It is unknown if supplementation may helpbridge the gap between usual nutrient intakes and dietaryrecommendations. RTE cereals are generally fortified and cancontribute a significant proportion of nutrients to those whoconsume them.
Overconsumption of certain vitamins and minerals suchas vitamin A, iron, and zinc can be a risk for olderAmericans who eat fortified products and use vitamin andmineral supplements [23]. A recent study found 37% ofmen and 47% of women age ≥51 years consume at leastone vitamin or mineral supplement each day [23]. Datafrom the 1999-2000 NHANES found 63% of individuals≥60years in age consume some type of daily dietary supplements[24]. Many older Americans may be unaware of the riskof overconsumption of vitamins and minerals and moreeducation about this concern is needed. In addition, foodmanufacturers need to consider this concern for the elderlypopulation when deciding on how to fortify RTE cerealproducts.
The food grouping estimates in the NDSR database arenot ideal of determining whole grain intake. Food items thatwere grouped as “some whole grain” were not included inthis study due to the uncertainty of the amount of wholegrain in the food. Foods grouped as “whole grain” werecounted as all whole grain, when the food may have otheringredients and also may include some refined grains. Thefinding of higher levels of whole grain in the highest quartileof RTE cereal consumption makes sense considering thehigher intake of fiber for this group and since RTE cereal isan important contributor of whole grain in the US diet.
5. Conclusion
Results suggest that ready-to-eat breakfast cereals maycontribute to the nutritional quality of the diets of olderAmericans. Prospective studies and experimental trials areneeded to better evaluate the role of RTE cereal consumptionin energy balance.
Authors’ Contribution
A. M. Albertson and N. Joshi contributed to research design.A. C. Wold wrote the introduction and discussion for thepaper. A. M. Albertson wrote the methods and results for thepaper. N. Joshi did the data analysis. All authors read andapproved the final paper.
Acknowledgment
The authors acknowledge Arohi Bapna for helping in editingthe paper.
References
[1] US Department of Health and Human Services, Administra-tion on Aging, Aging Statistics Census Data & Population Esti-mates, http://www.aoa.gov/AoARoot/Aging Statistics/futuregrowth/future growth.aspx.
[2] J. R. Sharkey, L. G. Branch, N. Zohoori, C. Giuliani, J. Busby-Whitehead, and P. S. Haines, “Inadequate nutrient intakesamong homebound elderly and their correlation with indi-vidual characteristics and health-related factors,” AmericanJournal of Clinical Nutrition, vol. 76, no. 6, pp. 1435–1445,2002.
[3] B. E. Millen, J. C. Ohls, M. Ponza, and A. C. McCool, “TheElderly Nutrition Program: an effective national frameworkfor preventive nutrition interventions,” Journal of the AmericanDietetic Association, vol. 102, no. 2, pp. 234–240, 2002.
[4] S. Park, M. A. Johnson, and J. G. Fischer, “Vitamin andmineral supplements: barriers and challenges for older adults,”Journal of Nutrition for the Elderly, vol. 27, no. 3-4, pp. 297–317, 2008.
[5] J. M. Kerver, E. J. Yang, S. Obayashi, L. Bianchi, and W. O.Song, “Meal and snack patterns are associated with dietaryintake of energy and nutrients in US adults,” Journal of theAmerican Dietetic Association, vol. 106, no. 1, pp. 46–53, 2006.
[6] E. A. Gollub and D. O. Weddle, “Improvements in nutritionalintake and quality of life among frail homebound older adultsreceiving home-delivered breakfast and lunch,” Journal of theAmerican Dietetic Association, vol. 104, no. 8, pp. 1227–1235,2004.
[7] M. A. Galvin, M. Kiely, and A. Flynn, “Impact of ready-to-eat breakfast cereal (RTEBC) consumption on adequacy ofmicronutrient intakes and compliance with dietary recom-mendations in Irish adults,” Public Health Nutrition, vol. 6, no.4, pp. 351–363, 2003.
[8] K. J. Morgan and M. E. Zabik, “The influence of ready-to-eat cereal consumption at breakfast on nutrient intakes ofindividuals 62 years and older,” Journal of the American Collegeof Nutrition, vol. 3, no. 1, pp. 27–44, 1984.
[9] J. L. Bachman, J. Reedy, A. F. Subar, and S. M. Krebs-Smith,“Sources of food group intakes among the US population,2001-2002,” Journal of the American Dietetic Association, vol.108, no. 5, pp. 804–814, 2008.
[10] N. M. McKeown, M. Yoshida, M. K. Shea et al., “Whole-grainintake and cereal fiber are associated with lower abdominaladiposity in older adults,” Journal of Nutrition, vol. 139, no.10, pp. 1950–1955, 2009.
[11] D. K. Houston, B. J. Nicklas, and C. A. Zizza, “Weighty con-cerns: the growing prevalence of obesity among older adults,”Journal of the American Dietetic Association, vol. 109, no. 11,pp. 1886–1895, 2009.
[12] K. M. Flegal, D. Carroll, B. K. Kit, and C. L. Ogden, “Pre-valence of obesity and trends in the distribution of body massindex among US adults, 1999–2010,” Journal of the AmericanMedical Association, vol. 307, no. 5, pp. 491–497, 2012.
[13] J. C. Seidell and T. L. S. Visscher, “Body weight and weightchange and their health implications for the elderly,” EuropeanJournal of Clinical Nutrition, vol. 54, supplement 3, pp. S33–S39, 2000.
[14] A. M. Albertson, G. H. Anderson, S. J. Crockett, and M.T. Goebel, “Ready-to-eat cereal consumption: its relationshipwith BMI and nutrient intake of children aged 4 to 12 years,”Journal of the American Dietetic Association, vol. 103, no. 12,pp. 1613–1619, 2003.
[15] A. M. Albertson, S. G. Affenito, R. Bauserman, N. M. Hols-chuh, A. L. Eldridge, and B. A. Barton, “The relationship ofready-to-eat cereal consumption to nutrient intake, bloodlipids, and body mass index of children as they age throughadolescence,” Journal of the American Dietetic Association, vol.109, no. 9, pp. 1557–1565, 2009.
8 Journal of Aging Research
[16] S. Cho, M. Dietrich, C. J. P. Brown, C. A. Clark, and G. Block,“The effect of breakfast type on total daily energy intake andbody mass index: results from the Third National Health andNutrition Examination Survey (NHANES III),” Journal of theAmerican College of Nutrition, vol. 22, no. 4, pp. 296–302,2003.
[17] W. O. Song, O. K. Chun, S. Obayashi, S. Cho, and C. E. Chung,“Is consumption of breakfast associated with body mass indexin US adults?” Journal of the American Dietetic Association, vol.105, no. 9, pp. 1373–1382, 2005.
[18] L. R. Purslow, M. S. Sandhu, N. Forouhi et al., “Energy intakeat breakfast and weight change: prospective study of 6,764middle-aged men and women,” American Journal of Epidemi-ology, vol. 167, no. 2, pp. 188–192, 2008.
[19] W. O. Song, O. K. Chun, J. Kerver, S. Cho, C. E. Chung,and S. J. Chung, “Ready-to-eat breakfast cereal consumptionenhances milk and calcium intake in the US population,”Journal of the American Dietetic Association, vol. 106, no. 11,pp. 1783–1789, 2006.
[20] The NPD Group, National Eating Trends, 2007-2008.[21] B. A. Barton, A. L. Eldridge, D. Thompson et al., “The relation-
ship of breakfast and cereal consumption to nutrient intakeand body mass index: the National Heart, Lung, and BloodInstitute Growth and Health Study,” Journal of the AmericanDietetic Association, vol. 105, no. 9, pp. 1383–1389, 2005.
[22] T. L. S. Visscher, J. C. Seidell, A. Molarius, D. Van Der Kuip, A.Hofman, and J. C. M. Witteman, “A comparison of body massindex, waist-hip ratio and waist circumference as predictors ofall-cause mortality among the elderly: the Rotterdam study,”International Journal of Obesity, vol. 25, no. 11, pp. 1730–1735,2001.
[23] R. S. Sebastian, L. E. Cleveland, J. D. Goldman, and A. J.Moshfegh, “Older adults who use vitamin/mineral supple-ments differ from nonusers in nutrient intake adequacy anddietary attitudes,” Journal of the American Dietetic Association,vol. 107, no. 8, pp. 1322–1332, 2007.
[24] K. Radimer, B. Bindewald, J. Hughes, B. Ervin, C. Swanson,and M. F. Picciano, “Dietary supplement use by US adults:data from the National Health and Nutrition ExaminationSurvey, 1999-2000,” American Journal of Epidemiology, vol.160, no. 4, pp. 339–349, 2004.

Submit your manuscripts athttp://www.hindawi.com
Stem CellsInternational
Hindawi Publishing Corporationhttp://www.hindawi.com Volume 2014
Hindawi Publishing Corporationhttp://www.hindawi.com Volume 2014
MEDIATORSINFLAMMATION
of
Hindawi Publishing Corporationhttp://www.hindawi.com Volume 2014
Behavioural Neurology
EndocrinologyInternational Journal of
Hindawi Publishing Corporationhttp://www.hindawi.com Volume 2014
Hindawi Publishing Corporationhttp://www.hindawi.com Volume 2014
Disease Markers
Hindawi Publishing Corporationhttp://www.hindawi.com Volume 2014
BioMed Research International
OncologyJournal of
Hindawi Publishing Corporationhttp://www.hindawi.com Volume 2014
Hindawi Publishing Corporationhttp://www.hindawi.com Volume 2014
Oxidative Medicine and Cellular Longevity
Hindawi Publishing Corporationhttp://www.hindawi.com Volume 2014
PPAR Research
The Scientific World JournalHindawi Publishing Corporation http://www.hindawi.com Volume 2014
Immunology ResearchHindawi Publishing Corporationhttp://www.hindawi.com Volume 2014
Journal of
ObesityJournal of
Hindawi Publishing Corporationhttp://www.hindawi.com Volume 2014
Hindawi Publishing Corporationhttp://www.hindawi.com Volume 2014
Computational and Mathematical Methods in Medicine
OphthalmologyJournal of
Hindawi Publishing Corporationhttp://www.hindawi.com Volume 2014
Diabetes ResearchJournal of
Hindawi Publishing Corporationhttp://www.hindawi.com Volume 2014
Hindawi Publishing Corporationhttp://www.hindawi.com Volume 2014
Research and TreatmentAIDS
Hindawi Publishing Corporationhttp://www.hindawi.com Volume 2014
Gastroenterology Research and Practice
Hindawi Publishing Corporationhttp://www.hindawi.com Volume 2014
Parkinson’s Disease
Evidence-Based Complementary and Alternative Medicine
Volume 2014Hindawi Publishing Corporationhttp://www.hindawi.com