Embed Size (px)
Citation preview

Real and Financial Industry Booms and Busts
Gerard Hoberg University of MarylandGordon Phillips University of Maryland & NBER
Paper presentation to Insead, May 2007

Insead, May 2007
Motivation
• Industry booms and busts are recurring phenomenon according to WSJ, NY Times
• Railroads 1860s, 1870s• Petroleum exploration, paper mills (70s) • Agriculture commodities (80s, 90s): “Hog
Cycles”• Winchester Disk Drives, 1982-83• Non-store retailing (catalogs), 1991-1992• Internet, Telecommunication, 1998-00

Insead, May 2007
August 9, 2006 NEW YORK (CNNMoney.com) -- Homebuilder Toll
Brothers said the current slump in residential construction is unlike any it has seen in 40 years as it became the latest to warn of a glut in new homes for sale and a slowdown in the closely watched real estate market."… it seems to be the result of an oversupply of inventory and a decline in confidence," he added. "Speculative buyers who spurred demand in 2004 and 2005 are now sellers; builders that built speculative homes must now move their specs; and nervous buyers are canceling contracts for homes already under construction."

Insead, May 2007
Our Questions• How important are industry booms?• Outcomes: How do firms’ cash flows and
the stock market respond to industry booms?
• Test how competition impacts subsequent outcomes following booms and busts.
• “Excess/high” competition in concentrated industries?Schumpeter (1941), Perry (1984) Mankiw and Whinston (1986)
• Excess competition in competitive industries?Scharfstein (1988), Reinganum (1989), Hou and Robinson (JF, 2005)

Insead, May 2007
Related Literature
Large literature on reversals, momentum and misvaluation, rational herding and informational cascades.
• Both rational and behavioral explanations.Some examples: De Bondt and Thaler (1985),
Scharfstein and Stein (1990), Welch (1992), Jegadeesh and Titman (1993), Shleifer and Vishny (2003) Rhodes-Kropf and Viswanathan (2004) (rational misvaluation given asymmetric information and mergers)
No industrial organization, microeconomics unspecified.

Insead, May 2007
Related Literature 2Rational Booms and Busts:
Pastor and Veronesi (2005): Switch of uncertainty from idiosyncratic to systematic causes what appear to be bubbles.
DeMarzo, Kaniel, Kremer (2005), “Overinvestment in new technology”, “may invest to the point that its expected return is negative” given consumption insurance. Also Gala (2005).
Irrational Booms and Busts: Neg. Stock returns following high equity issuance:
Baker and Wurgler (2000). Neg. Stock returns following high investment:
Titman, Wei, and Xie (2004) and Polk and Sapienza (2004) for cross-sectional results and Lamont (2000).
Insead, May 2007
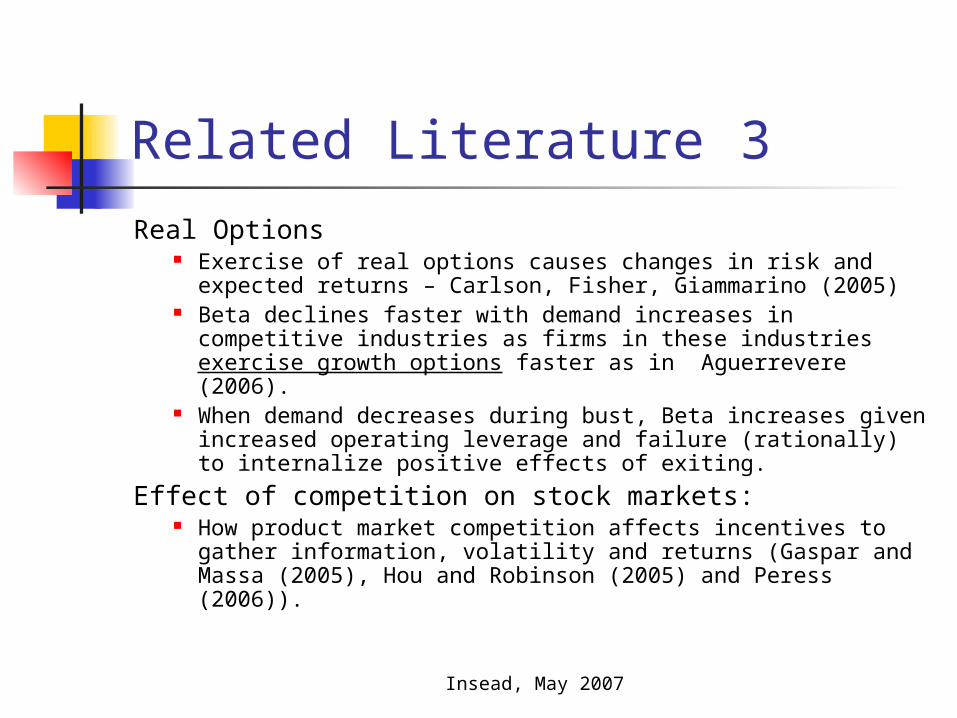
Related Literature 3Real Options
Exercise of real options causes changes in risk and expected returns – Carlson, Fisher, Giammarino (2005)
Beta declines faster with demand increases in competitive industries as firms in these industries exercise growth options faster as in Aguerrevere (2006).
When demand decreases during bust, Beta increases given increased operating leverage and failure (rationally) to internalize positive effects of exiting.
Effect of competition on stock markets: How product market competition affects incentives to
gather information, volatility and returns (Gaspar and Massa (2005), Hou and Robinson (2005) and Peress (2006)).

Insead, May 2007
Conclusions Booms and busts are not just in high tech
industries Market competition & financing are crucial in
understanding outcomes of booms. Transitions out of booms are more likely if
relative investment and new financing are high. In competitive industries:
• Subsequent operating performance and abnormal stock returns are negatively related to valuation metrics & industry new finance. Particularly true in high systematic risk industries.
• Risk changes only partially mitigate (but do not eliminate) these effects. Effects persist in high valuation industries.
• Results consistent with high competition in competitive industries not being internalized by the stock market.

Insead, May 2007
Contrast in Concentrated Industries
In concentrated industries:
Little evidence of ex post predictability in operating cash flows or stock returns.
Evidence consistent with firms in concentrated industries internalizing the effects of their production on industry
outcomes.

Insead, May 2007
Importance of competition Why does industry competition have
such a large effect? Cash flows: Economics 101 – produce more
until prices re-equilibrate. Mean reversion quick given elastic supply response.
Stock market: Why do prices especially in the stock market go so high initially? Overoptimism/Consumption hedge /Failure or lack of incentives to anticipate elastic supply response.
Insead, May 2007
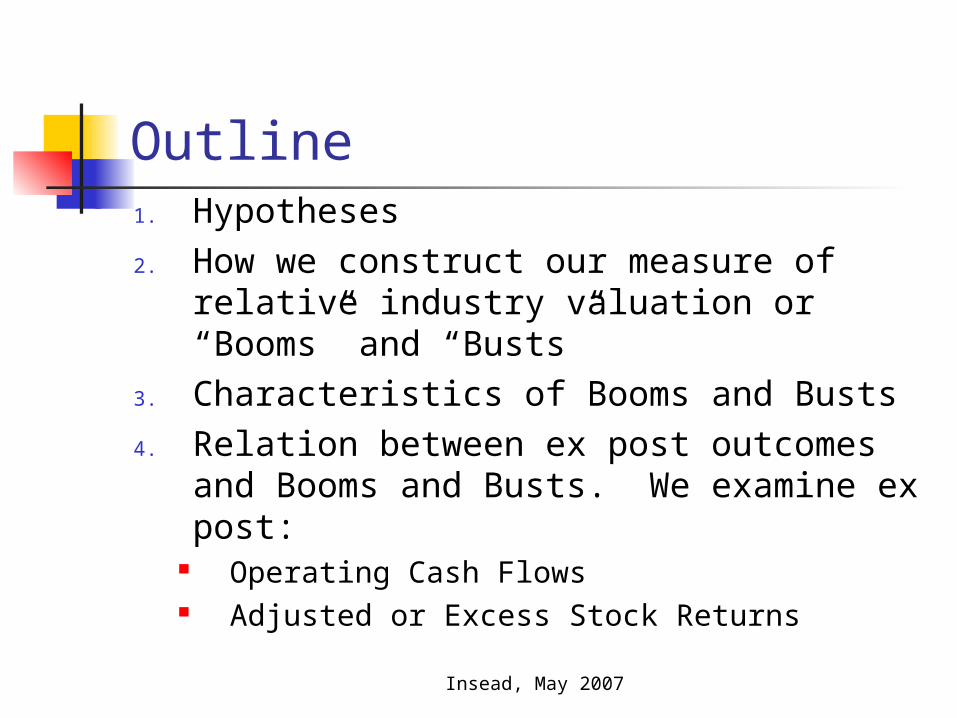
Outline1. Hypotheses2. How we construct our measure of
relative industry valuation or “Booms” and “Busts”
3. Characteristics of Booms and Busts4. Relation between ex post outcomes and
Booms and Busts. We examine ex post: Operating Cash Flows Adjusted or Excess Stock Returns
Insead, May 2007
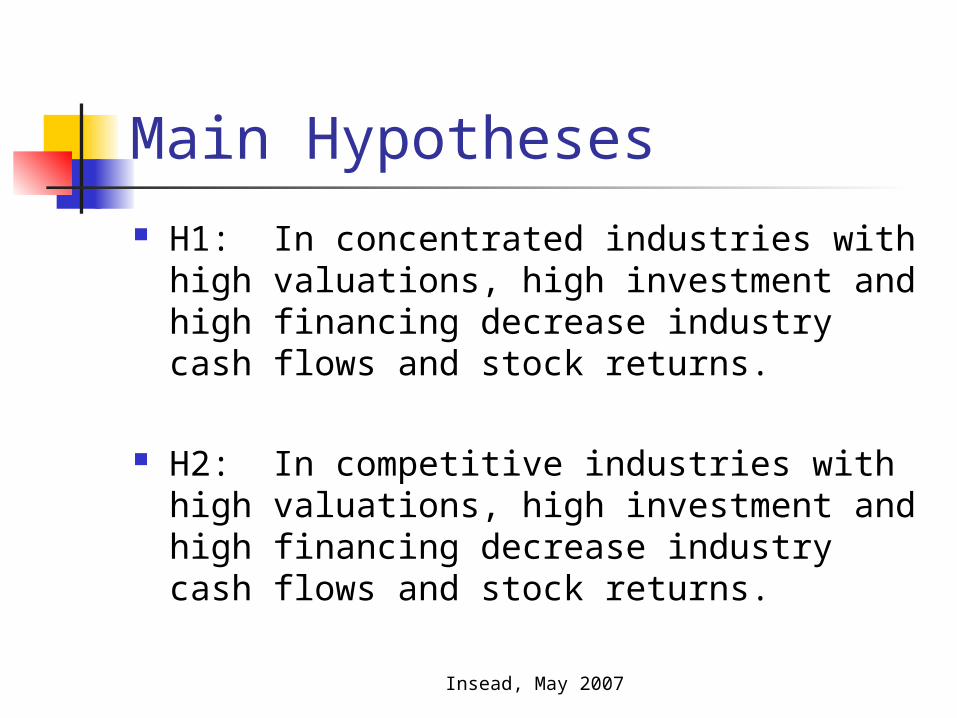
Main Hypotheses H1: In concentrated industries with high
valuations, high investment and high financing decrease industry cash flows and stock returns.
H2: In competitive industries with high valuations, high investment and high financing decrease industry cash flows and stock returns.

Insead, May 2007
Risk-Based Hypotheses“Can we make predictability go away?”
H2b: Changes in stock returns can be explained given changes in sensitivity to priced risk factors / we also add a competition risk factor – Hou and Robinson, Peress.
H2c: During (following) industry booms, systematic risk decreases (increases) more in competitive than in concentrated industries. (Real Options Models)

Insead, May 2007
Rational Theories of Booms and Busts“Can Rational Models explain our findings?
H3a: Booms have high idiosyncratic risk given technological uncertainty. Subsequent busts have increased systematic risk and decreased idiosyncratic risk (Pastor and Veronesi).
H3b: Consumption Hedging: In industries with high systematic risk, subsequent stock returns will be negatively related to industry investment, valuation and financing (DeMarzo, Kaniel, Kremer).

Insead, May 2007
Toll Brothers Stock

Insead, May 2007
Booms and Outcomes
Size of thePre-Boom Boomt Ex post
Estimation period time t char. using Outcomest+1
t-10 to t-1 t-10 to t-1 coefficients =f(Boomt, NFt)_
(1) Valuation Model ex post(Kothari, 2001, RRV, 2005) cash flow, returns
(2) M/B model (3) Simple P/E Model

Insead, May 2007
Valuation Model
Market ValuationEstimation period t-10 to t-1
Estimated (1) and (2) by industry in logs, save coefficients each industry.
Predict valuation in period t using period t RHS variables.Average and median R2 approx = .75
ijt j,0 j,1 ijt 2,j 3,j ijt 4,j ijt(1) MVequity *BVequity *(abs(NI)) *dummy NegNI *Lev
ijt ijt j,0 1,j 2,j 3,j ijt(2) MVequity /BVequity *(AT) *abs(NI) *dummy NegNI

Insead, May 2007
Investment Model
Predict InvestmentEstimation period
t-10 to t-1
Estimated by industry, save coefficients each industry.Predict investment in period t using period t RHS
variables.
tj,i,j4,
tj,i,j3,1-tj,i,j2,1-tj,i,j,1j,0tj,i,
NegOIBDPdummy *
))(abs(OIBDP* )(Assets* * )(
lnlnqCapxln

Insead, May 2007
Relative Valuation /Investment Relative MVi,j,t (RMV)=
ln(MVi,j,t)- Predicted Valuation
(time t char. using coefficients from t-10 to t-1 data)
Gives firm-level relative valuation
RMVi,j,t = ln(MVi,j,t) - PMVi,j,t
Average over firms to get relative industry-level Booms.
Similar procedure for relative industry investment.

Insead, May 2007
Booms and Outcomes by Industries
Tests:• Are booms and outcomes different in
concentrated and competitive industries?• Herfindahl measured (public firms), predicted
using public and private firms.• We examine changes in operating cash flows
and risk and style-adjusted ex post stock returns.

Insead, May 2007
Competitive Industries: Booms

Insead, May 2007
Competitive Industries: Booms - 2

Insead, May 2007
Outcomes
Ex post Outcomest+1
=f(Boomj,t, NFj,t, RIj,t, Boomi,j,t, NFi,j,t, RIi,j,t,)
ex post
cash flow, returns
Insead, May 2007
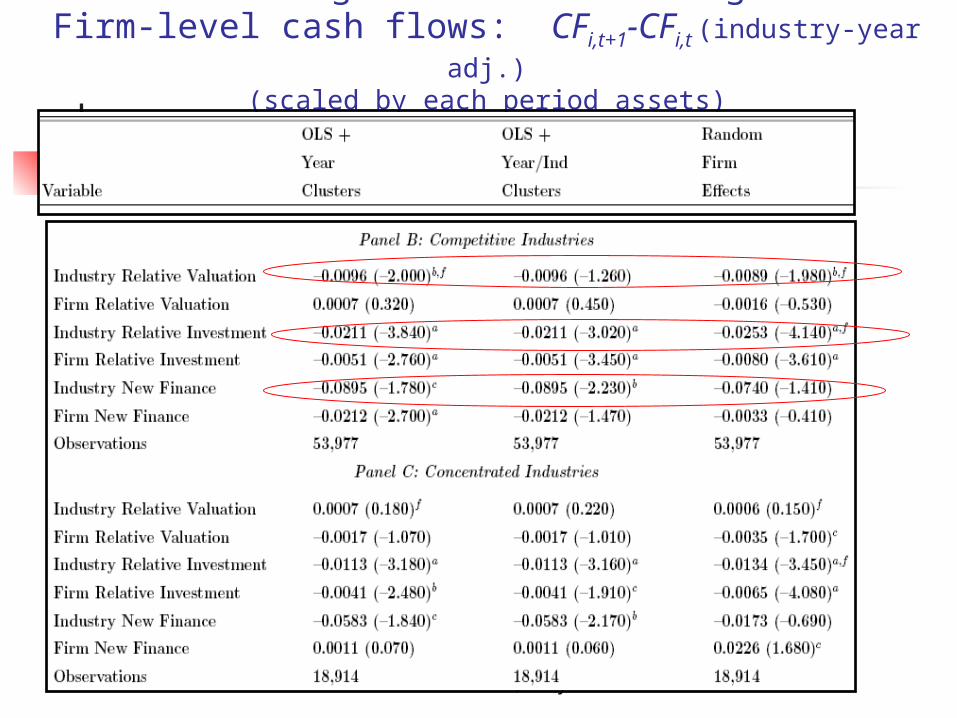
T4: Regressions Predicting Firm-level cash flows: CFi,t+1-CFi,t (industry-year adj.)
(scaled by each period assets)

Insead, May 2007
T4: Regressions Predicting Firm-level cash flows: CFi,t+1-CFi,t (industry-year adj.)

Insead, May 2007
T5: Firm-level cash flow regressions (high market risk tercile)

Insead, May 2007
Characteristic AdjustedMonthly Abnormal Returns
ARi,t = RAWi,t – STYLEi,t for firm i in month t
- Per Daniel/Grinblatt/Titman/Wermers (1997) and Wermers (2004)
- Construct 125 style portfolios, rebalanced July 1 (size NYSE).
- Conditional sorts on Size, Industry Adj. B/M, past 12 month return
Lags: Davis/Frama/French (2000):
- For monthly observations b/t July year t to June year t+1
- Size = CRSP market cap from June of year t
- Accounting data from fiscal years ending in year t-1
- Past 12 month return from June of year t-1 to May of year t

Insead, May 2007
Abnormal Returns FF 4 factor model+ Mitchell/Stafford Alphas
Step 1: Group firm/years as July year t to June year t+1
Step 2: Get intercepts FF ’93 + MOM (12 monthly obs./regression)
Step 3: Control for non-linearity
- Style matching based on same 125 style portfolios, same lag structure.
UMDSMBLMKTtRawAlpha iiiiiti ,
tititi STYAlphaRAWAlphaMSAlpha ,,,

Insead, May 2007
T6: Regressions Predicting Firm-level Abnormal Stock Returns: i,t+1

Insead, May 2007
T7: Return RegressionsHigh Relative Valuation Tercile

Insead, May 2007
T8: Return RegressionsHigh Market Risk Tercile

Insead, May 2007
Risk Tests Examine if changes in risk occur
following industry booms. Industry technological adoption: Pastor and
Veronesi (2005) We examine market beta and idiosyncratic risk.
Real Options: Grenadier (2002), Aguerrrevere (2006)
We examine change in total risk.
Do any changes explain abnormal returns?

Insead, May 2007
Univariate risk changes
Percent of Risk that is Systematic (Standard Deviation)
0.245
0.25
0.255
0.26
0.265
0.27
0.275
0.28
0.285
0.29
0.295
0.3
-5 -4 -3 -2 -1 0 1 2 3 4 5

Insead, May 2007
Tables 9+10: Regressions Predicting Chg. In Market Risk: Dependent Variable “”

Insead, May 2007
Tables 9+10: Regressions Predicting Chg. Idio. Risk: Dependent Variable “idio.”
Insead, May 2007
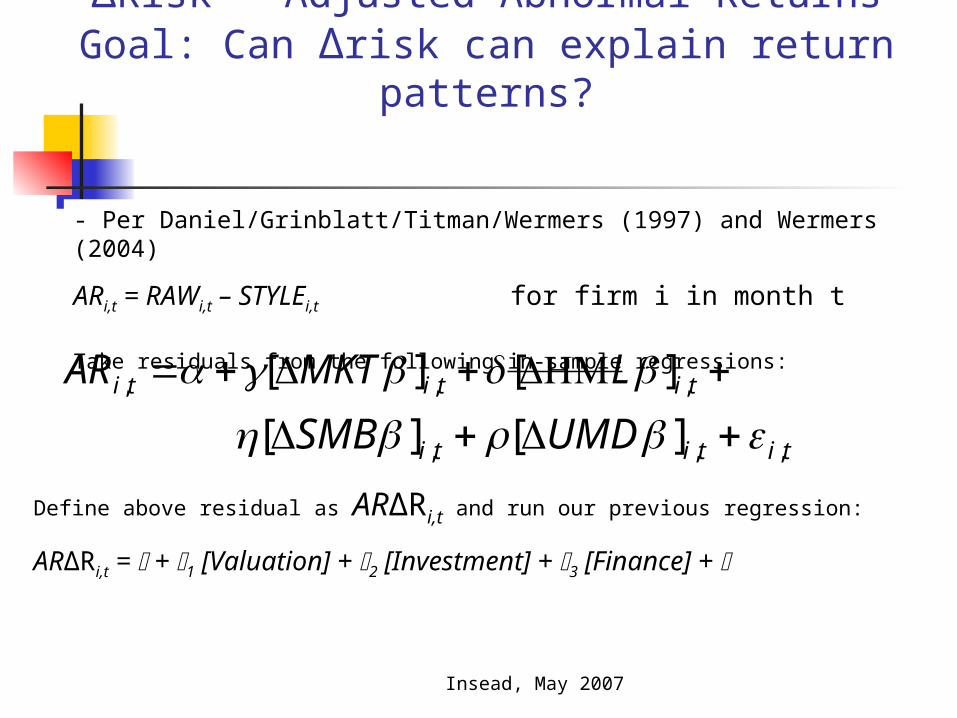
ΔRisk – Adjusted Abnormal ReturnsGoal: Can Δrisk can explain return patterns?
- Per Daniel/Grinblatt/Titman/Wermers (1997) and Wermers (2004)
ARi,t = RAWi,t – STYLEi,t for firm i in month t
Take residuals from the following in-sample regressions:
tititi LMKTAR ,,, ][][
tititi UMDSMB ,,, ][][
Define above residual as ARΔRi,t and run our previous regression:
ARΔRi,t = + 1 [Valuation] + 2 [Investment] + 3 [Finance] +

Insead, May 2007
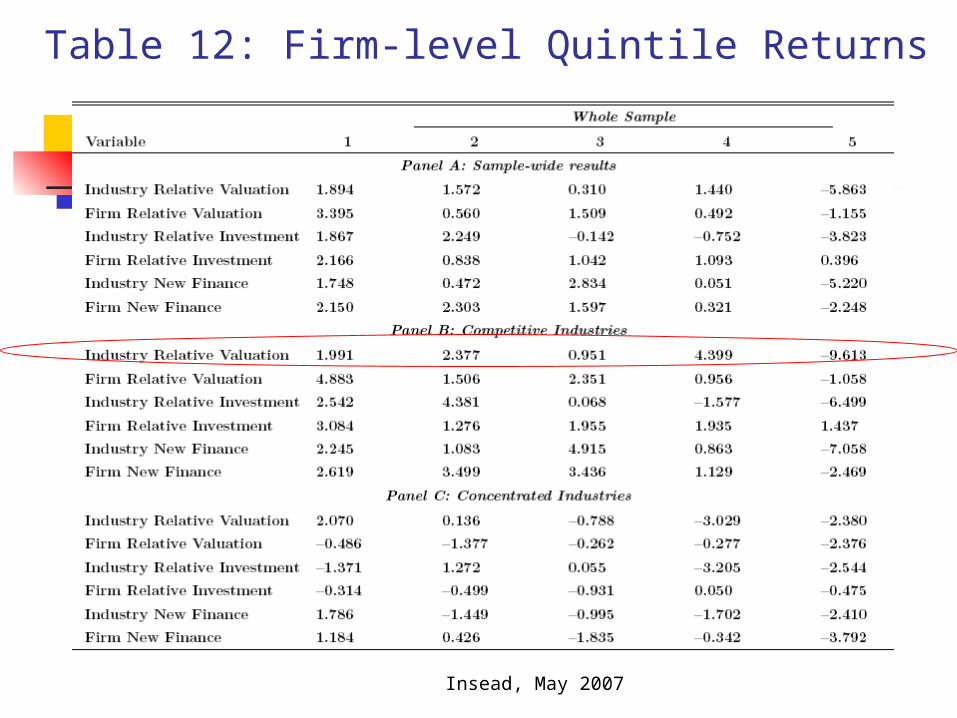
Table 11: Regressions Predicting ΔRisk Adjusted Abnormal Stock Returns? Do
results go away?
Insead, May 2007
Table 12: Firm-level Quintile Returns

Insead, May 2007
Annual Profitability: Excluding Internet Yrs Relative Industry-level Valuation Quintile
Returns

Insead, May 2007
Conclusions
Booms and busts are not just in high tech industries
Market competition & financing are crucial in understanding outcomes of booms.
In competitive industries:• Subsequent operating performance and abnormal stock
returns are negatively related to high relative industry valuation & industry new finance.
• Risk changes only partially mitigate these effects. Effects still present in highest valuation industries.
• Results consistent with stock and product market failure to internalize effects of high competition and investment / consumption hedge as in DeMarzo et. al.

Insead, May 2007
In concentrated industries: Little evidence of ex post predictability in operating
cash flows or stock returns. Evidence consistent with firms in concentrated
industries internalizing the effects of their production on industry outcomes.
Conclusions