Embed Size (px)
Citation preview
1
Agenda Item 7a, Attachment 1, Page 1 of 59
Real Assets
Strategic Plan Update
Investment Committee – April 18, 2016

2
Agenda Item 7a, Attachment 1, Page 2 of 59 Real Assets Strategic Plan Update
Section I: Real Assets Overview 3-11
Section II: Real Assets Hierarchy and Structure 12-15
Section III: Changes 16-26
Section IV: Implementation and Conclusion 27-31
Section V: Real Assets Information 32-37
Appendices
Real Estate 38-43
Infrastructure 44-49
Forestland 50-56
Glossary 57-59
Table of Contents

3
Agenda Item 7a, Attachment 1, Page 3 of 59 Real Assets Strategic Plan Update
Section I: Real Assets Overview • Real Assets INVO Alignment
• Real Assets Program History
• Real Assets Strategic Plan Process
• Real Assets Role in Total Fund
• Real Assets Key Messages – Strategy Summary
• Real Assets Key Messages – Integration / ALM 2017
• Real Assets Risks

4
Agenda Item 7a, Attachment 1, Page 4 of 59 Real Assets Strategic Plan Update
.
A set of 10 Investment Beliefs that provide a basis for strategic
management of the investment portfolio and inform organizational
priorities
Mission: Manage in a cost-effective, transparent and risk-aware manner
Vision: -Focus on repeatable, predictable and scalable portfolios and practices
-Seek alignment of interests with our stakeholders, partners and ourselves
-Use clearly articulated performance, risk and cost metrics
-Investment activities supported by effective risk management and controls
Defines Role, Assumptions, Allocation and Benchmark of each asset class, including Real
Assets
Strategic Initiatives
A 5-year business plan update for RAU and its three programs – Real Estate, Infrastructure and
Forestland – that guide investment strategy and initiatives, including the integration of processes of
the three programs
CalPERS RAU
Strategic
Plan
Asset Liability
Management
Vision 2020
Investment Beliefs
Real Assets – INVO Alignment

5
Agenda Item 7a, Attachment 1, Page 5 of 59 Real Assets Strategic Plan Update
1998
2007 2009 2011 2015
Manager
Count
Total
Portfolio
NAV
LTV**
25
2005
~$7B of RE
assets sold
68 69 64 33
2008
Infrastructure
Program
founded
2015
Disposition of
$3B of RE assets
2007
Forestland
re-investment
$7.1B
(1998)
$23.5B
(2007)
$14.7B
(2009)
$21.6B
(2011)
$30.3B
(2015)
Average
Portfolio
Risk Core
Value
Add
Value
Add
Value
Add
Core
~34% ~36% ~61% ~30%*** ~65%
Source: CalPERS
Real Assets – Program History
Commingled
Funds NAV %* 2.1% ($150M) 17.5% ($4.1B) 31.1% ($4.6B) 32.4% ($6.9B) 9.3% ($2.8B)
2011
Real Estate/
Infrastructure
Strategic Plans
*NAV = Net Asset Value; **LTV = Loan to Value; ***Estimate

6
Agenda Item 7a, Attachment 1, Page 6 of 59 Real Assets Strategic Plan Update
Senior INVO Leaders &
Board Consultants
review plan.
Presentations, meetings, &
roundtables culminated into a Staff
prepared draft presentation.
RA teams evaluated Domestic Core, International Core, Domestic Specialty,
Leverage and the Business Model topics, and presented the analysis to RA
MID, Senior RA Staff, and RA Board Consultants.
CalPERS hosted several round table meetings attended by key CalPERS
Staff, market participants, industry leaders, and consultants.
July 15 Sept 15 Oct 15 Dec 15 Jan 16 Aug 15 Nov 15 Feb 16 Mar 16 Apr 16 May 16
Round Tables & Meetings
Strategic Teams
Research & Report
Plan Integration
ISG/IC*
Presentation
The RAU Senior Team planned the process.
Review
Planning
Real Assets – Strategic Plan Process The Real Assets (RA) strategic planning process includes input from industry leaders, CalPERS Staff, strategic partners and consultants
*ISG = Investment Strategy Group; **IC = Investment Committee

7
Agenda Item 7a, Attachment 1, Page 7 of 59 Real Assets Strategic Plan Update
• Stable and predictable cash yield
• Diversification of equity risk
• Inflation protection
Real Assets – Role in Total Fund
Harmonizing across the programs (Real Estate, Infrastructure, Forestland)

8
Agenda Item 7a, Attachment 1, Page 8 of 59 Real Assets Strategic Plan Update
Real Assets Key Messages – Strategy Summary (1 of 2) Investment Strategy substantially unchanged
Refining and harmonizing portfolio structure, parameters and nomenclature
Risk
• Private Real Assets equity – providing diversification of equity risk
• Mitigate Asset class risk through:
• Majority of program (75-90%) – high quality Core assets held through business cycles
• Durable cash flow – producing stable and predictable cash yield
• Revenue models – supporting inflation protection
Geography
• Focus majority of portfolio in the U.S. (70-100%)
• International investments aligned with role in developed and emerging markets
• Acquire and maintain exposures to well located assets
Leverage
• Utilize moderate leverage across the portfolio and monitor leverage levels
• Pilot Real Estate Program: (see slide #24)
• Implement an unlevered RE partnership mandate(s)
• Leverage could potentially be added and managed internally by Staff at Total Fund or Real
Assets level
• Security for leverage could potentially be at the Real Estate (Individual asset, Sub-Portfolio,
Total Portfolio) or Total Fund level.
• Leverage Pilot Program plan to be approved by Investment Strategy Group (ISG) prior to
implementation.
• Evaluate reducing costs and complexity, and increasing alignment and transparency

9
Agenda Item 7a, Attachment 1, Page 9 of 59 Real Assets Strategic Plan Update
Real Assets Key Messages – Strategy Summary (2 of 2)
Business Model
• Primary focus on Separate Accounts with highly reputable, market-leading managers
• Secondary focus on Operating Companies and Direct Investments
• Manager Limit Target: Movement toward fewer and larger external manager relationships,
consistent with Vision 2020
Specialized Programs
• Continued implementation of Environmental, Social, Governance (ESG) goals set for the next 5
years
• Continued implementation of Real Estate Emerging Manager and Transition Manager Programs
Portfolio Hierarchy
• Focus on Core assets within target Segments and Sectors to align with role
• Integrate existing Strategic and Legacy sub portfolios to align with the new Real Assets Strategic
Plan structure
• Develop Sector implementation plans
• Integrate Portfolio Hierarchy into Organizational Structure
Strong governance focused on economic alignment, transparency and cost efficiency

10
Agenda Item 7a, Attachment 1, Page 10 of 59 Real Assets Strategic Plan Update
Real Assets Key Messages – Integration / ALM 2017 Integrating Real Estate, Infrastructure and Forestland parameters
Harmonizing nomenclature; Reducing risks, costs, and complexity; Increasing transparency
• Portfolio: Hierarchy
• Risk classification: Core, Value Add, Opportunistic
• Add Development limit of 0-10% (Build-to-Core)
• Geography: U.S., International Developed, Emerging, and Frontier
• Leverage: Loan-to-Value (LTV), Debt Service Coverage Ratio (DSCR)
• Segments – Essential, Commercial, Consumer, Residential, Specialized, and International
ALM 2017
Items to be evaluated in Asset Liability Management (ALM) 2017 process:
• Real Assets Benchmarks
• Current Real Assets Benchmark: 83% Real Estate (NCREIF- ODCE); 8.5% Infrastructure
(CPI +4%); 8.5% Forestland (NCREIF Timberland Index)
• Role of Forestland program
• Real Assets allocation

11
Agenda Item 7a, Attachment 1, Page 11 of 59 Real Assets Strategic Plan Update
Real Assets – Risks
Select Risks and Risk management
Select Risks Risk Management
Operational
• Vacancy
• Maintenance of assets
• Operational expenses and capital expenditures
• Resource management
• Due diligence (asset and manager)
• Monitoring
Revenue Model
• Contract / lease features
• Merchant / renewal risks
• Counterparty risks
• Contract / lease negotiation
• Due diligence
• Monitoring
Agency / Governance
• External manager practices
• Ownership under Joint Ventures (JVs)
• Partner selection / Due diligence
• Monitoring
• Negotiation of governance/rights
Environmental • Climate change impact
• Resource use and management
• Due diligence (asset and manager)
• Monitoring
Reputational • Management of sensitive matters
• Relationship with regulatory bodies
• Due diligence (asset and manager)
• Monitoring
• Stakeholder engagement
Valuation • Value of cash flows post-contract
• Cap rate reversion (impact on values)
• Due diligence
• Contract / lease negotiation

12
Agenda Item 7a, Attachment 1, Page 12 of 59 Real Assets Strategic Plan Update
Section II: Real Assets Hierarchy and Structure • Real Assets Current Portfolio Hierarchy
• Real Assets Proposed Portfolio Hierarchy
• Real Assets Current Organization Structure

13
Agenda Item 7a, Attachment 1, Page 13 of 59 Real Assets Strategic Plan Update
Real Assets – Current Portfolio Hierarchy Real Assets currently consists of three programs, seven sub-portfolios, nine strategies, and seven risk profiles
Asset Class Program Sub Portfolio Strategy Risk Profile
Real Assets
Real Estate
Infrastructure
Forestland
Strategic
Legacy
Base
Domestic Tactical
International Tactical
Legacy
Defensive
Defensive Plus
Extended
Forestland Domestic
International
Custom Accounts
Commingled Funds
Directs
Co-Investments
U.S.
Developed OECD*
Less Developed
Not Established
Core
Core
Opportunistic
Value Add
*OECD = Organization for Economic Co-operational and Development

14
Agenda Item 7a, Attachment 1, Page 14 of 59 Real Assets Strategic Plan Update
Real Assets – Proposed Portfolio Hierarchy
Real Assets would consist of three programs, three risk classes and six segments
Asset Class Program Risk Segments
Real Assets
Real Estate
Infrastructure
Forestland
Office,
Industrial
Water,
Energy,
Waste
Timber,
Agriculture
Essential Commercial Consumer Residential Specialized International
Retail,
Hotels
Multi-family,
Single-family
Transpor-
tation
Techno-
logy,
Communica
-tions
International
Real Estate
International
Infrastructure
International
Forestland
Sectors
Cor
e /
Val
ue A
dd /
Opp
ortu
nist
ic
Emerging
Managers,
Urban,
Oppor-
tunistic

15
Agenda Item 7a, Attachment 1, Page 15 of 59 Real Assets Strategic Plan Update
Real Assets – Current Organization Structure
MID
Investment Research Portfolio
Management Group New Investments Strategic Planning PARRGO
Current Status Proposed
• Organization Integration complete
• Process integration ongoing
• Portfolio hierarchy to be integrated into organizational
structure

16
Agenda Item 7a, Attachment 1, Page 16 of 59 Real Assets Strategic Plan Update
Section III: Changes • Real Assets Proposed Changes and Rationale
• Real Assets Changes
• Real Estate Changes
• Infrastructure Changes
• Forestland Changes
• Real Assets Current Portfolio Structure
• Real Assets Proposed Program Parameters
• Real Estate Proposed Leverage Pilot Program
• Real Estate Emerging Manager and Transition Manager Programs
• Real Assets ESG Integration

17
Agenda Item 7a, Attachment 1, Page 17 of 59 Real Assets Strategic Plan Update
Real Assets – Proposed Changes and Rationale Establishing Real Assets parameters
Harmonizing nomenclature
Type of Change Change Rationale
Additions
• Harmonize risk classification
• Cap on development
• Leverage measurement (LTV,
DSCR)
• Geography
• Manager Limit target
• Reduces complexity
• Reduces risk
• Reduces cost
• Increases transparency
Modifications • Six new segments
• Reduces complexity
• Increases transparency
• Align with Total Fund

18
Agenda Item 7a, Attachment 1, Page 18 of 59 Real Assets Strategic Plan Update
Real Assets – Changes Establishing Real Assets parameters
Harmonizing nomenclature
Reducing risk, costs and complexity; Increasing transparency
Parameter Current Proposed
Risk Not established Core: 75-100%
Value Add: 0-25%
Opportunistic: 0-25%
Development: 0-10% (Build-to-Core)
Geography Not established -US: 70-100%
-International Developed: 0-30%
-International Emerging Markets: 0-15%
-International Frontier Markets: 0-5%
Leverage LTV: Not established
DSCR: Not established
LTV: 55%
DSCR: 1.40
Manager Limit Target Not established 25
Segments Not established
Essential, Commercial, Consumer, Residential,
Specialized, and International

19
Agenda Item 7a, Attachment 1, Page 19 of 59 Real Assets Strategic Plan Update
Real Estate – Changes Structure substantially unchanged
Reducing risk, costs and complexity; Increasing transparency
Parameter Current Proposed
Risk Core: 75-100%
Value Add: 0-25%
Opportunistic: 0-25%
Development: Not established
Core: 75-100%
Value Add: 0-25%
Opportunistic: 0-25%
Development: 0-10% (Build-to-Core)
Geography US: 63.75-100%
Developed: Ex-US: 0-25%
Emerging Markets: 0-15%
Frontier Markets: 0-5%
US: 75-100%
International Developed: 0-25%
International Emerging Markets: 0-15%
International Frontier Markets: 0-5%
Leverage LTV: 50%
DSCR (Total): 1.5
DSCR (Core): 2.0
No changes proposed
Manager Limit Target Not established 15
Sub Portfolios Strategic and Legacy Eliminate Sub Portfolios
Classification Domestic Base, Domestic Tactical, International Tactical, Legacy Eliminate these classifications
Segments Not established Essential, Commercial, Consumer, Residential, Specialized, and
International

20
Agenda Item 7a, Attachment 1, Page 20 of 59 Real Assets Strategic Plan Update
Infrastructure – Changes Modifying parameters
Harmonizing nomenclature; Reducing risks, costs and complexity; Increasing transparency
Parameter Current Proposed
Risk Infrastructure Defensive: 25-75%
Infrastructure Defensive Plus: 25-65%
Infrastructure Extended: 0-10%
Development: Not established
Core: 60-100%
Value Add: 0-25%
Opportunistic: 0-25%
Development: 0-10% (Build-to-Core)
Geography US: 40-80%
Developed OECD ex-US: 20-50%
Less Developed: 0-15%
US: 50-100%
International Developed: 0-50%
International Emerging Markets: 0-15%
International Frontier Markets: 0-5%
Leverage LTV: 65%
DSCR: Not established
LTV: 65%
DSCR: 1.25
Manager Limit Target Not established 10 (Infrastructure & Forestland combined)
Segments Not established Essential, Commercial, Consumer, Residential, Specialized, and
International
Key Parameters
Applicability Minimum
(NAV)*
$3B $5B
*Key Parameters Applicability Minimum: policy parameters do not apply until minimum achieved

21
Agenda Item 7a, Attachment 1, Page 21 of 59 Real Assets Strategic Plan Update
Forestland – Changes Establishing parameters
Harmonizing nomenclature; Reducing risk, costs and complexity; Increasing transparency
Parameter Current Proposed
Risk Not established Core: 75-100%
Value Add: 0-25%
Opportunistic: 0-25%
Development: 0-10% (Build-to-Core)
Geography Not established US: 50-100%
International Developed: 0-50%
International Emerging Markets: 0-15%
International Frontier Markets: 0-5%
Leverage LTV: 40%
DSCR: Not established
LTV: 40%
DSCR: 1.25
Manager Limit Target Not established 10 (Infrastructure & Forestland combined)
Segments Not established Essential, Commercial, Consumer, Residential,
Specialized, and International

22
Agenda Item 7a, Attachment 1, Page 22 of 59 Real Assets Strategic Plan Update
8
Program
Manager Count
Business Model
2
NAV / Unfunded
Real
Assets
Infrastructure
Forestland
N/A
Commingled: 52%
Directs: 26%
Separate Accounts: 22%
Separate Accounts: 100%
N/A N/A
Real
Estate
Separate Accounts: 80%
Commingled: 6%
Operating Companies: 14%
24
NAV: $25.7B
Unfunded: $9.5B
33*
NAV: $30.3B
Unfunded: $11.8B
* Real Assets Total Manager Count is less than sum of Program Manager Count. One manager is counted in both Real Estate and Infrastructure Programs.
**Actual DSCR for Real Estate is for Core funds
Real Assets – Current Portfolio Structure
Emerging
Managers
NAV: $2.3B
Unfunded: $2.2B
NAV: $2.2B
Unfunded: $0.0
5 5
Leverage
Geography
LTV: 34%
DSCR: N/A
US: 90% (CA: 25%)
International: 10%
LTV: 21%
DSCR: N/A
US: 82% (CA: 0%)
Latin America: 12%
Asia Pacific: 6%
LTV: 47%
DSCR: N/A
US: 60% (CA: 5%)
Developed OECD ex-US:
38%
LDC: 2%
LTV: 33%
DSCR: 3.0**
US: 94% (CA: 29%)
Developed ex-US: 0%
Emerging: 6%
Risk
Classification N/A
Core: 71%
Value Add: 12%
Opportunistic: 17%
Defensive: 31%
Defensive Plus: 49%
Extended: 20%
N/A

23
Agenda Item 7a, Attachment 1, Page 23 of 59 Real Assets Strategic Plan Update
55% LTV Limit
1.40 Total DSCR (Min) 65% LTV Limit
1.25 Total DSCR (Min)
Manager Expectations: Sustainable Investment Practices for Selection, Contracting, Monitoring & Management for Assets & Managers
10 (Infrastructure and
Forestland combined) 25
Emerging &
Transition Managers
Program
Leverage
Manager Count
40% LTV Limit
1.25 Total DSCR (Min)
10 (Infrastructure and
Forestland combined)
Business Model
Real
Assets
Infrastructure
Forestland
Geography
US: 70-100%
International Developed: 0-30%
International Emerging Markets: 0-
15%
International Frontier Markets: 0-5%
US: 50-100%
International Developed: 0-50%
International Emerging Markets: 0-
15%
International Frontier Markets: 0-5%
US: 50-100%
International Developed: 0-50%
International Emerging Markets: 0-
15%
International Frontier Markets: 0-5%
Separate Accounts / JVs,
Directs, Commingled
Primarily Separate Accounts
/ JVs, Commingled, Directs
Primarily Separate Accounts,
Commingled
ESG Integration
Real Estate
US: 75-100%
International Developed: 0-25%
International Emerging Markets: 0-
15%
International Frontier Markets: 0-5%
50% LTV Limit
1.5 Total DSCR (Min)
2.0 Core DSCR (Min)
Primarily Separate Accounts,
Commingled
15
Risk
Classification
Core 75-100%
Value Add 0-25%
Opportunistic 0-25%
Development : 0-10% (Build-to-Core)
Core 75-100%
Value Add 0-25%
Opportunistic 0-25%
Development : 0-10% (Build-to-
Core)
up to 11 up to 11 N/A N/A
Core 75-100%
Value Add 0-25%
Opportunistic 0-25%
Development : 0-10% (Build-to-Core)
Core 60-100%
Value Add 0-25%
Opportunistic 0-25%
Development : 0-10% (Build-to-
Core)
Real Assets – Proposed Program Parameters
Integrating Real Estate, Infrastructure, and Forestland into Real Assets

24
Agenda Item 7a, Attachment 1, Page 24 of 59 Real Assets Strategic Plan Update
Real Estate – Proposed Leverage Pilot Program
Implement an unlevered Real Estate partnership mandate(s)
Leverage could potentially be added and managed internally by Staff at Total Fund or Real Assets level
Security for leverage could potentially be at the Real Estate (Individual asset, Sub-Portfolio, Total Portfolio) or
Total Fund level
Leverage Pilot Program plan to be approved by ISG prior to implementation
Evaluate reducing costs & complexity, and increasing alignment & transparency
Potential Advantages Challenges
• Increase scale of borrowings • Implementation timing
• Reduce cost • Staff resources
• Reduce complexity • Processes
• Increase alignment • Controls
• Increase transparency • Data Technology

25
Agenda Item 7a, Attachment 1, Page 25 of 59 Real Assets Strategic Plan Update
Parameter Emerging Manager Transition Manager
Estimated Future Commitments Over a Five
Year Period
Up to $500M Up to $2B
Number of Managers at Program Maturity Up to 6 Up to 5
Geographic Focus California TBD
Risk Opportunistic TBD
Manager Oversight External Advisor/Mentoring Manager Staff
Business Model Primarily Separate Accounts Separate Accounts & Commingled Funds
Firm Assets Under Management Less than $1B TBD
Length of Track Record First, Second or Third Separate Account or
Institutional Fund
Fourth, Fifth and Sixth Separate Account or
Institutional Fund
Estimated Time Frame for Manager to Complete
Program
5 – 10 Years 5 – 15 Years
Real Estate – Emerging Manager and Transition Manager Programs These Programs provide an opportunity to invest with successful early and mid-stage
managers

26
Agenda Item 7a, Attachment 1, Page 26 of 59 Real Assets Strategic Plan Update
Real Assets – ESG Integration
Goals for Next 5 Years
Selection &
Contracting
Manager Expectations:
• ESG factor consideration matrix utilized across Real Assets in asset selection. Informed by the Investment Beliefs, ESG factors include water and climate risk, responsible contracting, safety, community relations, among many others.
• Separate Account contracts to incorporate ESG requirements in addition to the Responsible Contractor Program (RCP)
Monitoring & Management
Research • Year 1: conduct clean power & energy efficiency sectors research,
identify opportunities
• Years 2-5: develop and implement priority initiatives
Manager Expectations:
• ESG Monitoring and benchmarking tools used across portfolio (includes factors on water, labor, climate)
• Cross-pollination of best Sustainable Investment practices
• Carbon Footprint, PRI Montreal Pledge (utilizing external tools such as GRESB Infrastructure & ULI Greenprint)
• Climate & Resource Scarcity (primarily water) Risk Assessment for Core Portfolio (development of methodology)

27
Agenda Item 7a, Attachment 1, Page 27 of 59 Real Assets Strategic Plan Update
Section IV: Implementation & Conclusion • Real Assets Proposed Strategic Plan Implementation
• Real Assets Conclusion Strategy Summary
• Real Assets Conclusion Integration / ALM 2017

28
Agenda Item 7a, Attachment 1, Page 28 of 59 Real Assets Strategic Plan Update
Q1 Q2 Q3 Q4 Q1 Q2 Q3 Q4
Delegated Authority
2016/17 2017/18
Systems/Database (may extend beyond FY 2018)
Reporting (may extend beyond FY 2018)
Segment and Sector Planning
Segment and Sector Implementation Planning
Procedures Modification
Real Assets Proposed Strategic Plan Implementation
Ongoing planning in FY 2016-17 with implementation in FY 2017-18
Policy Modification

29
Agenda Item 7a, Attachment 1, Page 29 of 59 Real Assets Strategic Plan Update
Real Assets Conclusion – Strategy Summary (1 of 2) Investment Strategy substantially unchanged
Refining and harmonizing portfolio structure, parameters and nomenclature
Risk
• Private Real Assets equity – providing diversification of equity risk
• Mitigate Asset class risk through:
• Majority of program (75-90%) – high quality Core assets held through business cycles
• Durable cash flow – producing stable and predictable cash yield
• Revenue models – supporting inflation protection
Geography
• Focus majority of portfolio in the U.S. (70-100%)
• International investments aligned with role in developed and emerging markets
• Acquire and maintain exposures to well located assets
Leverage
• Utilize moderate leverage across the portfolio and monitor leverage levels
• Pilot Real Estate Program: (see slide #24)
• Implement an unlevered RE partnership mandate(s)
• Leverage could potentially be added and managed internally by Staff at Total Fund or Real
Assets level
• Security for leverage could potentially be at the Real Estate (Individual asset, Sub-Portfolio,
Total Portfolio) or Total Fund level
• Leverage Pilot Program plan to be approved by ISG prior to implementation
• Evaluate reducing costs and complexity, and increasing alignment and transparency

30
Agenda Item 7a, Attachment 1, Page 30 of 59 Real Assets Strategic Plan Update
Real Assets Conclusion – Strategy Summary (2 of 2)
Business Model
• Primary focus on Separate Accounts with highly reputable, market-leading managers
• Secondary focus on Operating Companies and Direct Investments
• Manager Limit Target: Movement toward fewer and larger external manager relationships,
consistent with Vision 2020
Specialized Programs • Continued implementation of ESG goals set for the next 5 years
• Continued implementation of Real Estate Emerging Manager and Transition Manager Programs
Portfolio Hierarchy
• Focus on Core assets within target Segments and Sectors to align with role
• Integrate existing Strategic and Legacy sub portfolios to align with the new Real Assets Strategic
Plan structure
• Develop Sector implementation plans
• Integrate Portfolio Hierarchy into Organizational Structure
Strong governance focused on economic alignment, transparency and cost efficiency

31
Agenda Item 7a, Attachment 1, Page 31 of 59 Real Assets Strategic Plan Update
Real Assets Conclusion - Integration / ALM 2017 Integrating Real Estate, Infrastructure and Forestland parameters
Harmonizing nomenclature; Reducing risks, costs, and complexity; Increasing transparency
• Portfolio: Hierarchy
• Risk classification: Core, Value Add, Opportunistic
• Add Development limit of 0-10% (Build-to-Core)
• Geography: U.S., International Developed, Emerging, and Frontier
• Leverage: LTV and DSCR ratios
• Segments – Essential, Commercial, Consumer, Residential, Specialized, and International
ALM 2017
Items to be evaluated in Asset Liability Management (ALM) 2017 process:
• Real Assets Benchmarks
• Current Real Assets Benchmark: 83% Real Estate (NCREIF- ODCE); 8.5% Infrastructure
(CPI +4%); 8.5% Forestland (NCREIF Timberland Index)
• Role of Forestland program
• Real Assets allocation

32
Agenda Item 7a, Attachment 1, Page 32 of 59 Real Assets Strategic Plan Update
Section V: Real Assets Information
• Real Assets INVO ALM
• Real Assets Current Market Conditions
• Real Assets Performance
• Real Assets Current Portfolio Characteristics
• Real Assets Estimated Pro-Forma Portfolio Characteristics

33
Agenda Item 7a, Attachment 1, Page 33 of 59 Real Assets Strategic Plan Update
Real Assets - INVO ALM
Strategic Plan based on ALM 2013; Next ALM is in 2017
Source: CalPERS
Asset Class Role Benchmark Allocation
Target/Range Compound E(R)
Volatility
(St. Dev.)
Real Assets
Stable and predictable cash yield
Economic diversification of equity risk
Inflation protection
83% Real Estate benchmark +
8.5% Infrastructure benchmark
+
8.5% Forestland benchmark
N/A N/A N/A
Program Role Benchmark Allocation
Target/Range Compound E(R)
Volatility
(St. Dev.)
Real Estate
Stable cash yield with real property
ownership
Economic diversifier
Partial inflation hedge
NCREIF ODCE Interim Target/Range 10% │5% to 15%
Strategic Target/Range 11% │6% to 16% 7.00 14.00
Infrastructure
Predictable returns with essential
infrastructure assets ownership
Economic diversifier, moderate long-term
inflation protection
Consumer Price Index + 4%
lagged one quarter
Interim Target/Range 2% │0% to 4%
Strategic Target/Range 3% │1% to 5% 7.00 11.00
Forestland Forestland properties ownership
Long-term inflation protection NCREIF Timberland Index
34
Agenda Item 7a, Attachment 1, Page 34 of 59 Real Assets Strategic Plan Update
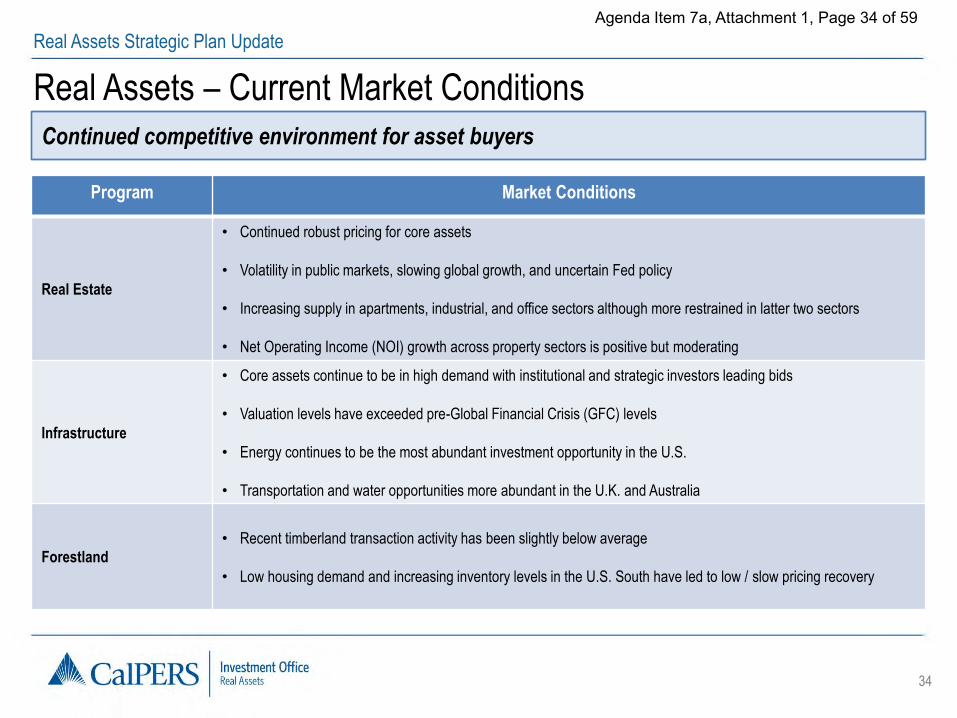
Real Assets – Current Market Conditions
Program Market Conditions
Real Estate
• Continued robust pricing for core assets
• Volatility in public markets, slowing global growth, and uncertain Fed policy
• Increasing supply in apartments, industrial, and office sectors although more restrained in latter two sectors
• Net Operating Income (NOI) growth across property sectors is positive but moderating
Infrastructure
• Core assets continue to be in high demand with institutional and strategic investors leading bids
• Valuation levels have exceeded pre-Global Financial Crisis (GFC) levels
• Energy continues to be the most abundant investment opportunity in the U.S.
• Transportation and water opportunities more abundant in the U.K. and Australia
Forestland • Recent timberland transaction activity has been slightly below average
• Low housing demand and increasing inventory levels in the U.S. South have led to low / slow pricing recovery
Continued competitive environment for asset buyers

35
Agenda Item 7a, Attachment 1, Page 35 of 59 Real Assets Strategic Plan Update
Real Assets - Performance
Total Program outperforms in the 1, 3, and 5 Year Periods
NAV as a % of Total Program
Quarter Ending09/30/2015
1-Year 3-Year 5-Year 10-YearSince
Inceptionof Investment
Real Estate 85.6% 2.6% 15.5% 13.4% 13.5% 0.8% 7.6%
Infrastructure 7.4% 3.2% 11.0% 15.0% 19.1% N/A 10.5%
Forestland 7.0% 0.0% 0.0% 2.8% -1.3% 2.7% N/A
Total Program 100.0% 2.5% 14.0% 12.7% 12.2% 1.6% 7.8%
Real Assets Benchmark(CPERRABX)
N/A 3.0% 12.6% 11.6% 11.8% 8.4% 8.4%
Difference betweenTotal Program and
BenchmarkN/A -0.5% 1.4% 1.1% 0.4% -6.8% -0.6%
-5.0%
0.0%
5.0%
10.0%
15.0%
20.0%
Net Returns by Risk Classification
Source: CalPERS
*Forestland: included in Real Estate program
*

36
Agenda Item 7a, Attachment 1, Page 36 of 59 Real Assets Strategic Plan Update
$18.6B, 60%
$0.7B, 2%
$1.2B, 4%
$3.1B, 10%
$4.6B, 15%
$0.5B, 2%
$2.2B, 7%
Core - RE
Defensive - Infra
Defensive Plus - Infra
Value-Added - RE
Opportunistic - RE
Extended - Infra
Forestland
Real Assets – Current Portfolio Characteristics
Numerous classifications across three programs
Risk Classification Sector
Source: CalPERS
Current portfolio nomenclature and classifications:
• Numerous risk classifications across programs
• Numerous sectors classifications across programs
Retail $6.7B 22%
Office $6.4B 21%
Industrial $4.4B 14%
Apartment $3.5B,11% Housing $1.7B,
6%
Urban $1.7B, 6%
,Emerging Market $1.5B 5%
Other $0.3B,1%
Diversified $0.04B , 0%
Forestland $2.2B, 7%
Power $1.1B, 4%
Transportation $0.7B, 2%
Energy $0.4B, 1%
Water $0.1B, 0%
Communications $0.1B, 0%

37
Agenda Item 7a, Attachment 1, Page 37 of 59 Real Assets Strategic Plan Update
Real Assets – Estimated Pro-Forma Portfolio Characteristics Proposed risk and segment classifications
Harmonizing nomenclatures
Source: CalPERS
Core, $22.3B, 72%
Value-Added, $3.5B, 11% Opportunistic,
$5.0B, 16%
Risk Classification Segments
Commercial, $7.3B, 23%
Consumer, $5.1B, 17%
Essential, $2.6B, 8%
International, $2.5B, 8%
Residential, $10.0B, 33%
Specialized, $3.4B, 11%
Proposed structure:
• Above graphs illustrate proposed risk classification and segments using estimated pro-forma figures
as of 9/30/2015
• Sectors (e.g. Office, Energy) would reside one level below Segments in the proposed hierarchy

38
Agenda Item 7a, Attachment 1, Page 38 of 59 Real Assets Strategic Plan Update
Real Estate Appendix
• Real Estate Messages
• Real Estate Proposed Changes and Impact
• Real Estate Current Portfolio Parameters
• Real Estate Performance
• Real Estate Characteristics

39
Agenda Item 7a, Attachment 1, Page 39 of 59 Real Assets Strategic Plan Update
Real Estate - Messages Topic Message
Risk Continuing focus on Core – reduces risk
Geography Continuing focus on U.S. – reduces risk
International investments aligning with role in developed and emerging markets
Leverage Continuing moderate leverage levels – reduces risk
Pilot Real Estate Leverage Program:
• Implement an unlevered RE partnership mandate(s)
• Leverage could potentially be added and managed internally by Staff at Total Fund or Real Assets level
• Security for leverage could potentially be at the RE (Individual asset, Sub-Portfolio, Total Portfolio) or Total Fund
level
• Leverage Pilot Program plan to be approved by ISG prior to implementation
• Evaluate reducing costs and complexity, and increasing alignment and transparency
Business Model Continue primary focus on Separate Accounts
Continue secondarily focus on Operating Companies
Specialized
Programs
Continuing implementation of ESG goals set for the next 5 years
Continuing implementation of Real Estate Emerging Manager and Transition Manager Programs
External
Managers
Manager Limit Target: Movement toward fewer and larger external manager relationships, consistent with Vision 2020
Portfolio Hierarchy Harmonizing Portfolio Hierarchy – reduces complexity

40
Agenda Item 7a, Attachment 1, Page 40 of 59 Real Assets Strategic Plan Update
Category Changes Impact
Additions • Risk: Development limit of 0-10% (Build-to-Core)
• Manager Limit Target: 15
• Reduces risk
• Reduces complexity
• Reduces cost
Deletions • Portfolio Hierarchy:
• Base Core / Domestic Tactical / International Tactical
strategies eliminated
• Strategic and Legacy sub-portfolios eliminated
• Reduces complexity
Modifications • Portfolio Hierarchy: Sectors to be classified within Segments
(Essential, Consumer, Residential, Commercial, Specialized and
International)
• Reduces complexity
Real Estate - Proposed Changes and Impact Structural changes simplify portfolio and promote integration of Real Estate Program with the Infrastructure and Forestland Programs
41
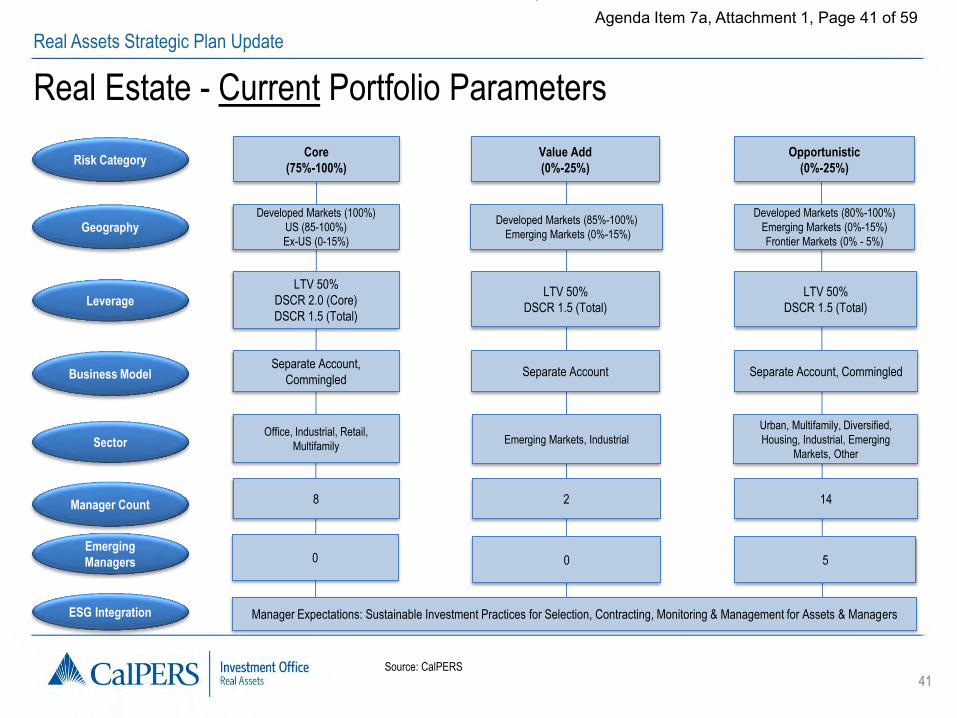
Agenda Item 7a, Attachment 1, Page 41 of 59 Real Assets Strategic Plan Update
LTV 50%
DSCR 2.0 (Core)
DSCR 1.5 (Total)
LTV 50%
DSCR 1.5 (Total)
Manager Expectations: Sustainable Investment Practices for Selection, Contracting, Monitoring & Management for Assets & Managers
2 8
Risk Category
Leverage
ESG Integration
Manager Count
LTV 50%
DSCR 1.5 (Total)
14
Business Model
Core
(75%-100%)
Value Add
(0%-25%)
Opportunistic
(0%-25%)
Geography Developed Markets (100%)
US (85-100%)
Ex-US (0-15%)
Developed Markets (85%-100%)
Emerging Markets (0%-15%)
Developed Markets (80%-100%)
Emerging Markets (0%-15%)
Frontier Markets (0% - 5%)
Separate Account,
Commingled Separate Account Separate Account, Commingled
Sector Office, Industrial, Retail,
Multifamily Emerging Markets, Industrial
Urban, Multifamily, Diversified,
Housing, Industrial, Emerging
Markets, Other
0 0 5
Source: CalPERS
Emerging
Managers
Real Estate - Current Portfolio Parameters

42
Agenda Item 7a, Attachment 1, Page 42 of 59 Real Assets Strategic Plan Update
Real Estate - Performance Total program outperforms in 1, 3, and 5 year periods
Core outperforms in all periods except 10 year period
NAV as a % of Total Program
Quarter Ending09/30/2015
1-Year 3-Year 5-Year 10-YearSince
Inceptionof Investment
Core 58.3% 4.7% 24.7% 18.7% 18.4% 6.2% 9.3%
Value-Add 18.3% -1.1% 8.6% 7.6% 7.8% N/A 7.8%
Opportunistic 23.4% 0.5% 4.0% 8.5% 9.2% -5.4% 4.6%
Total Program 100.0% 2.6% 15.5% 13.4% 13.5% 0.8% 7.6%
RE Program Benchmark(CPERSREX)
N/A 3.4% 13.9% 12.5% 13.0% 9.0% 8.6%
Difference betweenTotal Program and
BenchmarkN/A -0.8% 1.6% 0.9% 0.5% -8.2% -1.0%
-5.0%
0.0%5.0%
10.0%
15.0%
20.0%25.0%
Net Returns by Risk Classification
Source: CalPERS

43
Agenda Item 7a, Attachment 1, Page 43 of 59 Real Assets Strategic Plan Update
Core $18.6B, 71%
Opportunistic $4.6B, 17%
Value-Added $3.1B, 12%
Geography APAC
$0.7B, 3%
EU $0.4B, 1%
Latin $0.6B, 2% California
$7.6B, 29%
West (Ex-CA)
$3.6B, 14%
Midwest $3.7B, 14%
East U.S. $6.1B, 23%
South U.S. $3.1B, 12%
National $0.4B, 2%
Real Estate – Characteristics
Real Estate Portfolio is primarily U.S. Core with modest leverage
Apartment $3.5B, 13%
Industrial $4.4B, 17%
Office $6.4B, 25%
Retail $6.7B, 25%
Other $0.2B, 1%
Emerging Market
$1.5B, 6%
Housing $1.7B, 7%
Urban $1.7B, 6%
LTV Risk Leverage – LTV (%)
Sector
As of 9/30/15, Adjusted NAV of $25.7 Billion (8.9% of Total Fund) – $9.5 Billion Unfunded
33%
48%
25%
33%
0.00%
10.00%
20.00%
30.00%
40.00%
50.00%
Core Value Add Opportunistic Total
Source: CalPERS

44
Agenda Item 7a, Attachment 1, Page 44 of 59 Real Assets Strategic Plan Update
Infrastructure Appendix • Infrastructure Messages
• Infrastructure Proposed Changes and Impact • Infrastructure Current Portfolio Parameters • Infrastructure Performance • Infrastructure Characteristics

45
Agenda Item 7a, Attachment 1, Page 45 of 59 Real Assets Strategic Plan Update
Infrastructure - Messages Topic Message
Risk Continuing focus on Core assets – reduces risks
Adding 10% Development limit (Build-to-Core)
Geography Continuing focus on U.S. and International developed markets – reduces risks
Leverage Maintain current LTV limit of 65%
Adding DSCR 1.25 minimum – reduces risks
Business Model Primarily focusing on Separate Accounts
Secondarily focusing on Directs
External Managers Manager Limit Target: Movement toward fewer and larger external manager relationships, consistent with Vision
2020
Key Parameters
Applicability Minimum
(NAV)
Increasing from $3B to $5B
Portfolio Hierarchy Harmonizing Portfolio Hierarchy – reduces complexity
46
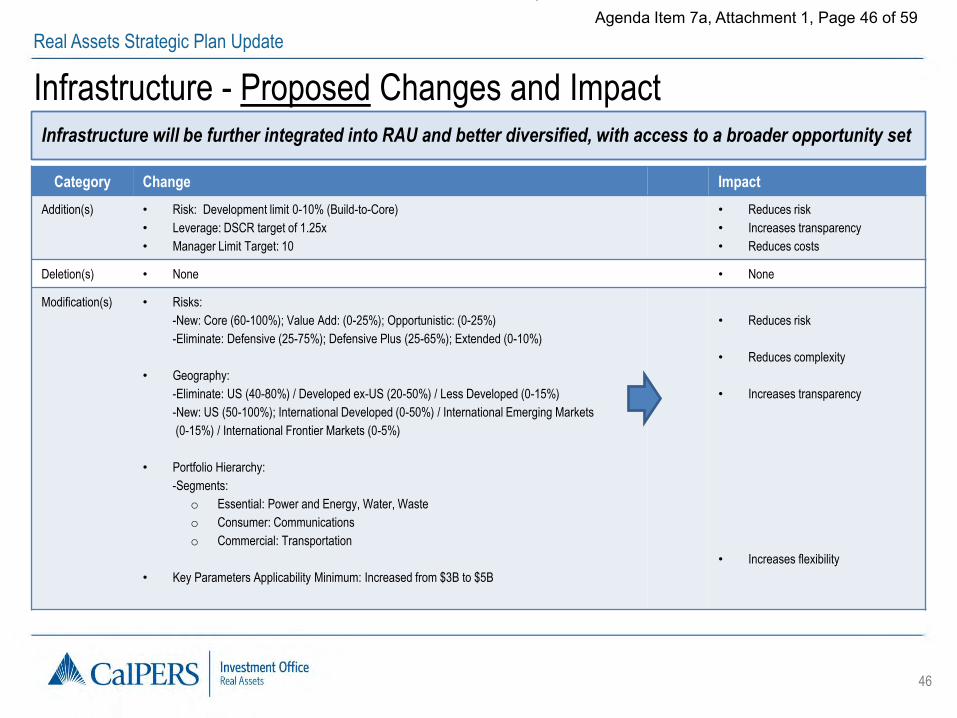
Agenda Item 7a, Attachment 1, Page 46 of 59 Real Assets Strategic Plan Update
Category Change Impact
Addition(s) • Risk: Development limit 0-10% (Build-to-Core)
• Leverage: DSCR target of 1.25x
• Manager Limit Target: 10
• Reduces risk
• Increases transparency
• Reduces costs
Deletion(s) • None • None
Modification(s) • Risks:
-New: Core (60-100%); Value Add: (0-25%); Opportunistic: (0-25%)
-Eliminate: Defensive (25-75%); Defensive Plus (25-65%); Extended (0-10%)
• Geography:
-Eliminate: US (40-80%) / Developed ex-US (20-50%) / Less Developed (0-15%)
-New: US (50-100%); International Developed (0-50%) / International Emerging Markets
(0-15%) / International Frontier Markets (0-5%)
• Portfolio Hierarchy:
-Segments:
o Essential: Power and Energy, Water, Waste
o Consumer: Communications
o Commercial: Transportation
• Key Parameters Applicability Minimum: Increased from $3B to $5B
• Reduces risk
• Reduces complexity
• Increases transparency
• Increases flexibility
Infrastructure - Proposed Changes and Impact Infrastructure will be further integrated into RAU and better diversified, with access to a broader opportunity set

47
Agenda Item 7a, Attachment 1, Page 47 of 59 Real Assets Strategic Plan Update
65% Limit
5 2
Risk Category
Leverage
Manager Count 1
Business Model
Defensive
(25 – 75%)
Defensive Plus
(25 – 65%)
Extended
(0 – 10%)
Geography U.S. (40 – 80%), Developed OECD ex US (20 – 50%), Less Developed (0 – 10%)
Separate Account , Commingled Fund, Directs
Sector Power, Energy, Transportation, Water, Communications, Other
Source: CalPERS
ESG Integration Manager Expectations: Sustainable Investment Practices for Selection, Contracting, Monitoring & Management for Assets & Managers
Infrastructure - Current Portfolio Parameters

48
Agenda Item 7a, Attachment 1, Page 48 of 59 Real Assets Strategic Plan Update
Infrastructure - Performance
The Infrastructure Program outperformed the benchmark in all periods
NAV as a % of Total Program
Quarter Ending09/30/2015
1-Year 3-Year 5-YearSince Inception
(04/01/2007)
Defensive 32.1% 2.3% 0.4% 6.1% N/A 5.6%
Defensive Plus 49.2% 4.5% 14.8% 20.3% 19.7% 8.3%
Extended 18.8% 1.3% 21.5% 16.9% 27.2% N/M
Total Program 100.0% 3.2% 11.0% 15.0% 19.1% 10.5%
CPI + 400 BPS N/A 0.7% 4.0% 5.0% 5.9% 6.3%
Difference betweenTotal Program and
CPI + 400 BPSN/A 2.5% 7.0% 10.0% 13.2% 4.2%
-5.0%0.0%5.0%
10.0%15.0%20.0%25.0%30.0%
Net Returns by Risk Classification
Source: CalPERS

49
Agenda Item 7a, Attachment 1, Page 49 of 59 Real Assets Strategic Plan Update
Infrastructure - Characteristics
The Program is in ramp up mode
Risk Leverage – LTV (%)
Geography Sector
US $1.4B, 58%
Developed OECD xUS
$939M, 40%
Less Developed $42M, 2%
Transportation $669M, 28%
Water $97M, 4%
Energy $366M, 16%
Communications $56M, 2%
Power $1.1B, 47%
Other $67M, 3%
Defensive $738M, 31%
Defensive Plus $1.2B, 49%
Extended $476M, 20%
47%
55% 48%
21%
0%
10%
20%
30%
40%
50%
60%
Total Program Defensive Defensive Plus Extended
As of 9/30/2015, Total Adjusted NAV of $2.37 Billion (0.9% of Total Fund) – $2.22 Billion Unfunded
Source: CalPERS

50
Agenda Item 7a, Attachment 1, Page 50 of 59 Real Assets Strategic Plan Update
Forestland Appendix • Forestland Messages
• Forestland Scalability Analysis
• Forestland Proposed Changes and Impact
• Forestland Current Portfolio Structure and Proposed Parameters
• Forestland Performance
• Forestland Characteristics

51
Agenda Item 7a, Attachment 1, Page 51 of 59 Real Assets Strategic Plan Update
Forestland - Messages
Topic Message
Current Status • International portfolio outperformed the benchmark since (10/1/07)
• Domestic portfolio is under restructuring
Implementation
Challenges
• Challenging to scale at a meaningful level for CalPERS
• It may take Program 5+ years to get to a 1% allocation and 11+ years to get to a
2% allocation
• At 2% of allocation ($6B), CalPERS would comprise 6.7% of the global timberland
market*
ALM 2017 • Forestland’s role to be evaluated as part of 2017 ALM Process
*Using an estimated $90B Core institutional investment universe

52
Agenda Item 7a, Attachment 1, Page 52 of 59 Real Assets Strategic Plan Update
Forestland – Scalability Analysis
Forestland is challenging to scale at a meaningful level for CalPERS
Timberland Investment Universe by Region (USD Billion)
• Transactions: Annual average transaction volume of approximately 32 transactions or $3B
• Managers: The top ten Timber managers’ assets under management total $44B
Sources: RISI; Equity Research Associates
(1)Excludes transactions of less than $1M

53
Agenda Item 7a, Attachment 1, Page 53 of 59 Real Assets Strategic Plan Update
Category Change Impact
Addition(s) • Risk:
• Core (75-100%)
• Value Add (0 – 25%)
• Opportunistic (0-25%)
• Development limit 0-10% (Build-to-Core)
• Geography:
• U.S. (50-100%)
• International Developed (0-50%)
• Emerging Markets (0-15%)
• Frontier Markets (0-5%)
• Leverage: DSCR target of 1.25x
• Manager Limit Target: 10 (Infrastructure and Forestland combined)
• Reduces risk
• Increases transparency
• Reduces costs
Deletion(s) • None • None
Modification(s) • Portfolio Hierarchy:
-Segments:
o Essential: Timber, Agriculture
• Reduces complexity
• Increases transparency
Forestland - Proposed Changes and Impact
Forestland will be further integrated into Real Assets

54
Agenda Item 7a, Attachment 1, Page 54 of 59 Real Assets Strategic Plan Update
40% LTV Program Limit
Actual 21.2%
Manager Expectations: Sustainable Investment Practices:
Selection, Contracting, Monitoring & Management
Not Established
Risk Category
Leverage
ESG Integration
Manager Count
Business Model
Asset Type
Not Established
Geography Not Established
Separate Account (2 accounts, 100%; $2.2 B)
Sector Forestland
Sawtimber, Pulpwood
Source: CalPERS
Current Proposed
Core: 75-100%
Value Add: 0-25%
Opportunistic: 0-25%
Development: 0-10%
US: 50-100%
International Developed: 0-50%
International Emerging Markets: 0-15%
International Frontier Markets: 0-5%
40% LTV Program Limit
DSCR: 1.25
Primarily Separate Account
10 (Infrastructure and Forestland combined)
Manager Expectations: Sustainable Investment Practices:
Selection, Contracting, Monitoring & Management
Forestland/Agriculture
Sawtimber, Pulpwood, Agricultural Products
Forestland – Current Portfolio Structure and Proposed Parameters

55
Agenda Item 7a, Attachment 1, Page 55 of 59 Real Assets Strategic Plan Update
Forestland - Performance
Forestland has underperformed across all periods
Source: CalPERS
Note: 10-year Forestland returns include returns when Forestland was grouped under Real Estate
Quarter Ending09/30/2015
1-Year 3-Year 5-Year 10-Year
Total Forestland - Gross 0.1% 0.3% 3.2% -0.8% 3.3%
Total Forestland - Net 0.0% 0.0% 2.8% -1.3% 2.7%
NCREIF Timberland Index 0.8% 9.3% 9.8% 6.3% 7.9%
Difference Between Forestland Returns andNCREIF Timberland Index
(Both Gross of Fees)-0.7% -8.9% -6.6% -7.1% -4.6%
-2%
0%
2%
4%
6%
8%
10%
12%
14%
Gross Returns versus Net Returns

56
Agenda Item 7a, Attachment 1, Page 56 of 59 Real Assets Strategic Plan Update
Forestland - Characteristics
Forestland investments are concentrated in Sawtimber in the Southern United States.
Product Type (%) Geography Exposure (%)
US South, $1.8B, 82%
Asia Pacific , $134.6M, 6%
Latin America , $266.2M, 12%
Pulpwood, $62.6M, 3%
Sawtimber, $2.0B, 91%
Non-timber, $41.2M, 2%
Specialty Hardwood, $92.2M, 4%
As of 9/30/15, Total NAV of $2.2 Billion (0.8% of Total Fund) – $0 Billion Unfunded
Source: CalPERS

57
Agenda Item 7a, Attachment 1, Page 57 of 59 Real Assets Strategic Plan Update
Glossary Appendix

58
Agenda Item 7a, Attachment 1, Page 58 of 59 Real Assets Strategic Plan Update
Glossary Below is a list of terms that appear in the 2016 RAU Strategic Plan. A definition and slide number where it first appears are provided below.
Cap Rate Reversion: Cap rates adjusting to historical mean levels. (Slide #11)
Capital Expenditures (capex): Investment expenditures that are capitalized onto the balance sheet (vs expensed in the current period). (Slide #11)
Cash Yield (%): Net cash flow divided by Net Asset Value (NAV) paid to owner. (Slide #7)
Climate & Resource Scarcity Risk Assessment: The assessment of value at risk due to short, medium and long term risks from resource scarcity
(primarily water) and climate change (physical risk to asset from sea level rise, storms). (Slide #26)
Debt Service Coverage Ratio (DSCR): Net operating income divided by total debt service. (Slide #10)
Development (Build-to-Core): Development intended for inclusion in the Core portfolio upon stabilization. (Slide #10)
Direct Investments (Directs): Investments that are purchased and owned directly by an investor without a dedicated manager. (Slide #9)
Frontier Markets (Frontier): Frontier Markets are those that are less economically established than Emerging markets but have investable stock
markets. Examples include Vietnam, Nigeria, and Argentina. (Slide #10)
Loan-to-Value ratio (LTV): (Debt divided by asset value). (Slide #5)
Merchant (renewal risk) / Value of cash flows post-contract : Contract renewal risks. / The value of the cash flows that occur after contract
expiration. (Slide #11)
Net Asset Value (NAV): The value of an investment’s assets less the value of its liabilities. (Slide #5)

59
Agenda Item 7a, Attachment 1, Page 59 of 59 Real Assets Strategic Plan Update
Glossary
Operating Companies: An investment vehicle structure responsible for day to day management of the investments of the vehicle. (Slide #9)
Operational expenses (opex): Expenses incurred during normal course of operations reflected in the income statement (vs. capitalized on the
balance sheet). (Slide #11)
Separate Account: An investment vehicle structure with a manager solely dedicated to the investor. (Slide #9)