Embed Size (px)
Citation preview
Nigerian Real Estate Sector
SUMMARY REPORT: 2010-2012
NATIONAL BUREAU OF STATISTICS February 2015

February 2015
Table of Contents Page
1 Real Estate in Nigeria 2
1.1 The Nigerian Real Estate Sector: A History .......................... 3 1.2 The Nigerian Real Estate Sector: At Present ........................ 5
2 Composition of The Real Estate Sector 8
2.1 Establishment Composition by State ................................... 8 2.1.1 Real Estate Activity in Nigeria ........................................................................... 9 2.1.2 Real Estate Product ........................................................................................ 10 2.1.3 Establishment Legal Structure ........................................................................ 10 2.1.4 Professional Body .......................................................................................... 12 2.1.5 Year of Business Commencing ....................................................................... 13
2.2 Distribution of Property Form ........................................... 14
3 Growth, Assests and Profitability 16
3.1 Contribution to GDP ......................................................... 16 3.2 Establishment Income ...................................................... 16
3.2.1 Income by Leasing Product ............................................................................ 17 3.2.2 Income by Service .......................................................................................... 18
3.3 Cost of Operation ............................................................. 19 3.4 Employees’ Compensation ................................................ 21 3.5 Gross Capital Formation ................................................... 21
4 Employment 23
4.1 Aggregate Employment .................................................... 23 4.2 Distribution of Employment by State ................................ 23 4.3 Composition of Employment ............................................ 24
4.3.1 Distribution of Employment by Gender and Nationality ................................... 24
ANNEX 1: Tables 26
February 2015
2
1 REAL ESTATE IN NIGERIA
The Real Estate sector offers a great potential source of growth for
Nigeria. Until now, the understanding of its composition and growth has
been somewhat limited to its required use in Nigerian national
accounts.
The Real Estate Survey (2013) was designed to capture the activities of
formal establishments that deal in real estate in Nigeria. It must be
noted that the survey does not cover owner occupied dwellings, and
therefore does not cover the real estate sector as a whole. This report
aims to give an overview of the findings of the Real Estate survey, and
to serve as a starting point in understanding the composition of the real
estate sector in Nigeria.
Following the housing bubble in 2008-2009 and the ensuing global
financial crisis, house prices are beginning to show a discernable
upward trend worldwide. Although financing remains a challenge,
especially in Europe where debt liquidity continues to hinder growth, in
developing markets, it generally appears that the market has stabilized
and activities in the sector are returning to normal. However, post crisis,
global markets are giving increased attention to local market
conditions and regulations when evaluating the real estate sector’s
growth prospects.
This report is structured as follows: section one will give a background of
the real estate sector including its history and current climate; the
second section will outline the sector’s growth and profitability
prospects; and the third will look at employment.
February 2015
3
1.1 The Nigerian Real Estate Sector: A History
The evolution of Nigerian real estate has been greatly influenced by
the laws and institutions in which it is nested, as well as the policy
environment through time. From the legal right to own land, to the limits
on leasing, to the mortgage interest rate charged; all have had a
bearing on the profitability of the form of real estate developed.
InstitutionsandLegalFramework
Prior to colonial times, indigenous institutions relating to land rights
varied across Nigeria. Southern states followed more dispersed
customary laws of inheritance rights to land, whereas the Northern
region operated largely under the more paternalistic Maliki Law, a
legacy of the Fulani control of Hausaland in the 19th century. Upon
colonisation in 1900, British Land Law was imposed in the South, which
operated alongside customary law in a dualistic system. This caused
conflict as land was sold multiple times under different laws. In the
Northern region, under the Land and Native Rights Law, the British were
able to adapt and consolidate this existing institution, to create a single
overarching land tenure system.
It was not until several years following independence, in1978, that the
military government sought to unify the two systems under the Land Use
Decree (now the Land Use Act). The need arose from heightened
tensions created by the Southern dualistic system; as many titles
overlapped, the cost and time taken to take disputes to court was
increasing. This was combined with rapid migration to the new cities
that had arisen after the oil boom of the 1970s, creating need for
schools, hospitals and housing. The decree therefore sought to extend
the more paternalistic Northern system to Southern regions, by
effectively putting all land rights in the hands of the Governor of the
February 2015
4
state, or the local government agency in the case of more rural areas,
with few restrictions1.
The Decree allowed easier acquisition of land by both the public and
private sectors, facilitating housing development and public policy
implementation. It dramatically reduced court litigations, not to
mention the amounts paid in compensation to land owners. To prevent
its amendment it was included in the 1979 Constitution, and again in
the later 1999 Constitution.
The 1978 Land Use Decree was also unable to wholly change the issues
of the past; there is still a clear divide as to the ease by which property
is registered in Nigeria. Northern states of Gombe Borno Zamfara, Kano
and Jigawa are the top 5 easiest to register property, whereas the
Southern States of Rivers, Osun, Ogun, Ondo and Oyo are most
difficult2. Yet the Degree remains in use today; its inclusion in the
constitution means that implementing reform will be a slow process.
HousingFinancePolicy
Alongside this, the 1980’s saw the emergence of housing finance as a
constraint to supply. New policies were formulated to stimulate this
area of the housing market, beginning with the National Housing Policy
with its renewal in 1990. This time its focus switched to financing the
housing sector, providing government facilitation through the 1992
Housing Fund Act and the Federal Mortgage Bank of Nigeria (FMBN)3.
Initially FMBN was mandated to solely provide loans for the purpose of
1 The only influence beyond this was given by Land Use and Allocation committee, which played a purely advisory role. Individuals could own a maximum of 0.5 hectares in urban areas, and 500 in rural. 2 World Bank (2012) 3 http://www.fmbn.gov.ng/vault/documents/nhfact.pdf The Housing Fund Act allowed low earners (including those on minimum wage) to contribute to the fund and gain access to long term loans. However, as of August 2012, only 12,031 of the 3.8million contributors had actually received mortgages. Those on minimum wage of N18,000 pm were asked to contribute 2.5% of income, which was then matched by their employer. http://www.fmbn.gov.ng/
February 2015
5
social housing, as the main government sponsored institution financing
real estate. However, over time the Federal Government’s National
Policy on Housing and Urban Development (2002/6) expanded its role
to include commercial lending for housing, and estate development
loans to real estate developers.
Access to finance remains a constraint to real estate development.
Less than 1% of private sector lending from Deposit Money Banks
(DMBs) is for mortgages, and other sources of longer term lending
represent less than 11% balance Sheet4.
1.2 The Nigerian Real Estate Sector: At Present
Currently, Nigeria is in the midst of a housing boom, primarily due to the
great demand created by a rising population. Nigeria’s housing deficit
is estimated to be 17 million as of August 20125. Yet demand is
characterised by high inequality, creating a dichotomy between the
demand for luxury secure accommodation for high-income earners,
and low-cost, affordable housing for the masses.
HighEnd Vs.LowEnd HousingDemand
In Nigeria’s urban centres, particularly Lagos, Abuja and Port Harcourt,
recent years have seen a hike in housing prices on a scale that is rarely
seen in developing cities. Globally, the highest real estate price rises
over the last decade have been recorded in nations such as India,
which saw prices rise 284% between 2001 and 2011, and Russia, which
saw an increase of 209% in the same period6. However, in cities such as
4 (WB 2013:2) 5 (WB 2013:3) 6 http://www.lloydsbankinggroup.com/globalassets/documents/media/press-releases/lloyds-bank/2012/1703_global.pdf
February 2015
6
Lagos, it is estimated that house prices rose by 400-500% between 1998
and 20087.
Land area is the main supply constraint; secure areas that are close to
central business districts (CBD) and offices are limited. Yet as the upper
class grows richer, and foreign investment and increased development
aid brings foreign construction and aid workers, demand is perceived
to be growing. Pressure for affordable housing in high demand areas
has been released, allowing prices to skyrocket. The private sector is
capitalising on this, with many choosing to invest in high-end property.
However, many new houses sit unoccupied in these areas, giving rise to
speculation as to whether this is simply a house price bubble8 that will
soon burst.
Demand for housing is simultaneously rising further down Nigeria’s
income spectrum; a growing number of middle class young
professional Nigerians have jobs in city centres. This represents the
majority of city workers in white-collar jobs. Their salaries are well above
the Nigerian average, yet there is no source of housing nearby that
they can afford to rent, let alone buy.
HousingSupplyConstraints
Adding to Nigeria’s 17million housing deficit, it is estimated that an
additional 700,000 houses must be built annually to keep up with
demand; currently this is below 100,0009.
There are three main constraints to growth from the bottom. First is
access to finance, primarily in mortgages for individuals who need to
7 http://www.lagos-nigeria-real-estate-investing-guide.com/real-estate-bubble.html 8 A housing market ‘bubble’ is caused when people’s expectations of future house price rises allow the overvaluation of property in the present. Instigated by an initial rise in housing demand, the expectation of further rises in value mean that this is still profitable to purchase housing assets at a high price. 9 World Bank 2013:3,
February 2015
7
borrow in order to purchase owned dwellings.10. Second is the ease of
legal procedures surrounding property and land procurement. As of
2013, the World Bank’s “Doing Business” project ranks Nigeria 185th (out
of 189 countries) for the ease by which property is registered. In a
survey of Nigerians in 201211, the second greatest challenge facing 22%
of those that want to invest in real estate, was reported to be difficulty
in obtaining titles. This is followed by 18% that cite cost and time
foreclosing on a mortgaged property. This lack of understanding of the
laws and procedures surrounding real estate, combined with the debts
that individuals must incur, means that investing in real estate can be
high risk for low earners.
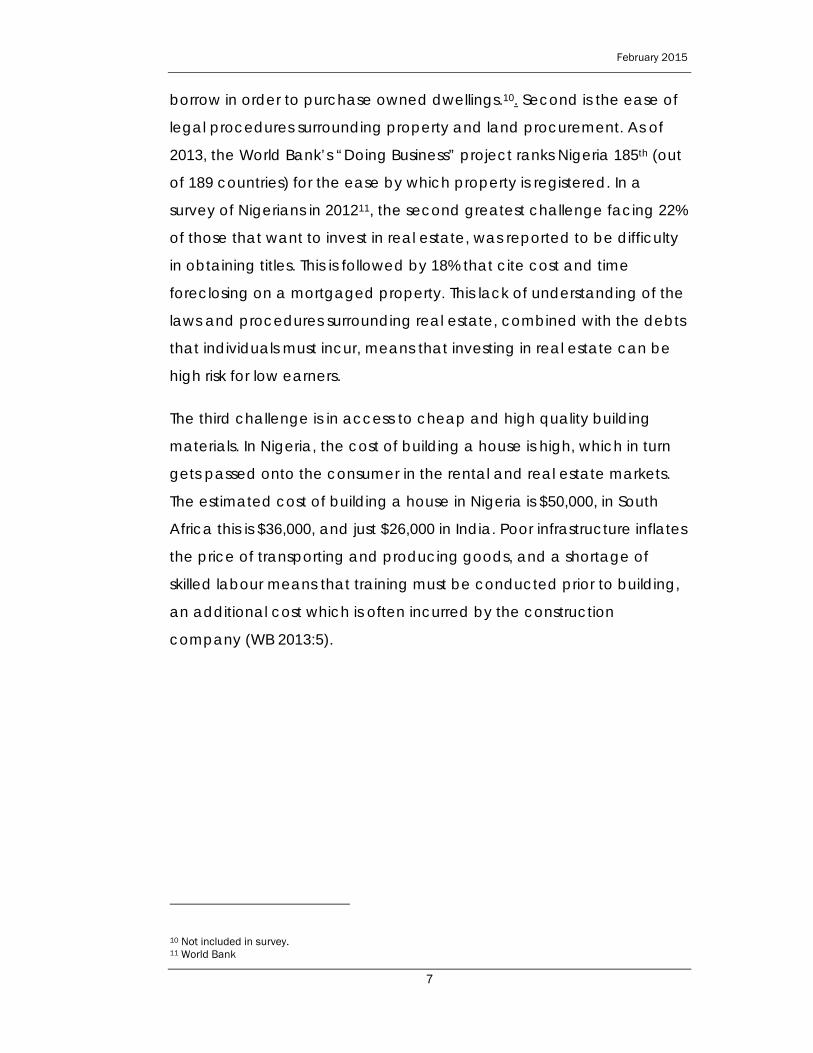
The third challenge is in access to cheap and high quality building
materials. In Nigeria, the cost of building a house is high, which in turn
gets passed onto the consumer in the rental and real estate markets.
The estimated cost of building a house in Nigeria is $50,000, in South
Africa this is $36,000, and just $26,000 in India. Poor infrastructure inflates
the price of transporting and producing goods, and a shortage of
skilled labour means that training must be conducted prior to building,
an additional cost which is often incurred by the construction
company (WB 2013:5).
10 Not included in survey. 11 World Bank
February 2015
8
Although there are clear supply side constraints, these can be
overcome as the sector grows. The high demand for real estate shows
no sign of abating, and represents a great opportunity for expansion of
the sector, particularly in low-end housing. Recent survey data has
provided evidence of this already happening. Benefits of an
expanding real estate sector include an increased demand for skilled
labour, permanent jobs, and downstream benefits in the construction
sector. This is not to mention the social benefits citizens have from
increased access to housing.
2 COMPOSITION OF THE REAL ESTATE SECTOR
2.1 Establishment Composition by State
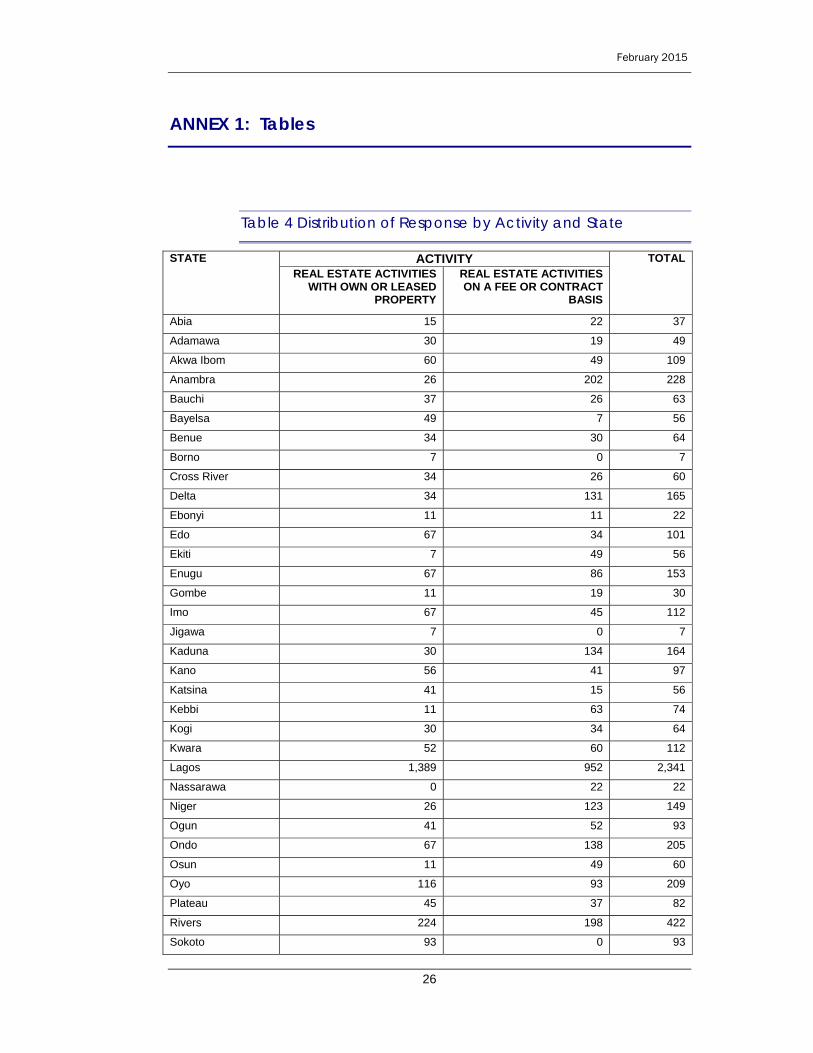
Approximately 7,343 establishments make up the real estate sector in
Nigeria. Lagos State and the Federal Capital Territory (FCT), Abuja
dominate, with 2,342 and 1,677 establishments respectively, making a
combined total of over 50% (31.89% and 22.84% respectively) of all real
0 10,000 20,000 30,000 40,000 50,000 60,000
South Africa
India
Nigeria
Cost, US$
Average Cost of Building a House
Figure 1 Average Cost of Building a House in Nigeria, India and South Africa
February 2015
9
estate establishments in Nigeria. Proportionally, Abuja has a far greater
number of establishments per capita, and a higher real estate value
than Lagos12. The third greatest number is Rivers State, with 422
establishments, at a much lesser 5.75% of the total. Both Borno and
Jigawa have the fewest Real Estate Establishments, with 7 each,
representing less than 0.10% of the total, yet these are two of the states
where property registration is easiest. See Table 4 in Annex
2.1.1 Real Estate Activity in Nigeria
Real Estate establishments can be classified as engaging in one of two
activities; those that deal in own or leased property13, and those that
provide real estate services on a fee or contract basis14. The survey
found a fairly equal split of the two types overall, whereby 53.71% of
establishments engage in real estate with own or leased property,
while 46.29% offer real estate services on a fee or contract basis.
At the state level, Lagos has a majority of establishments dealing in
own or leased properties of 59.31%, and thus 40.69% offering services
on a fee or contract basis. Federal Capital Territory (FCT) Abuja, had a
more equal split of 50.33% of Real Estate Activities using own or leased
property and 49.67% on a fee or contract basis. Five states had real
estate establishments with only own or leased property, namely Borno,
Jigawa, Sokoto, Yobe and Zamfara. Only Nasarawa State recorded
12 Populations are largest in cities of Lagos and Kano; Rivers state’s city of Port Harcourt is 5th, and Abuja ranks 49th. However, average property value in Abuja is the greatest in Nigeria; annual yields range from 6% for a 250sq metre property, at an average rental value of US$1,200 per month, to a yield of 8% for a 750sq metre property, with a monthly rental value of US$4,000. Whereas in Lagos, a 250sq metre property yields an average of 4.11% per annum, at an average rent of $890, and a 750sq metre property has a yield of 3.47%, renting for $2600 per month12. However, areas of Lagos such as Lekki and Victoria Island have far higher rents; these outcomes in both Lagos and Abuja are largely due to limited housing supply.
13 This activity includes the buying, selling, renting and operating of self owned or self-leased real estate, including the development of own building projects, subdivision of real estate into lots, and operation of residential mobile home sites. See ISIC class 6810 for detail.
14 This activity includes the provision of real estate services on a fee or contract basis, such as real estate agents and brokers, intermediation processes (buying/selling/renting), management, appraisal services. See ISIC class 6820 for detail.
February 2015
10
establishments that offered services on a fee or contract basis. See
Table 4 in Annex
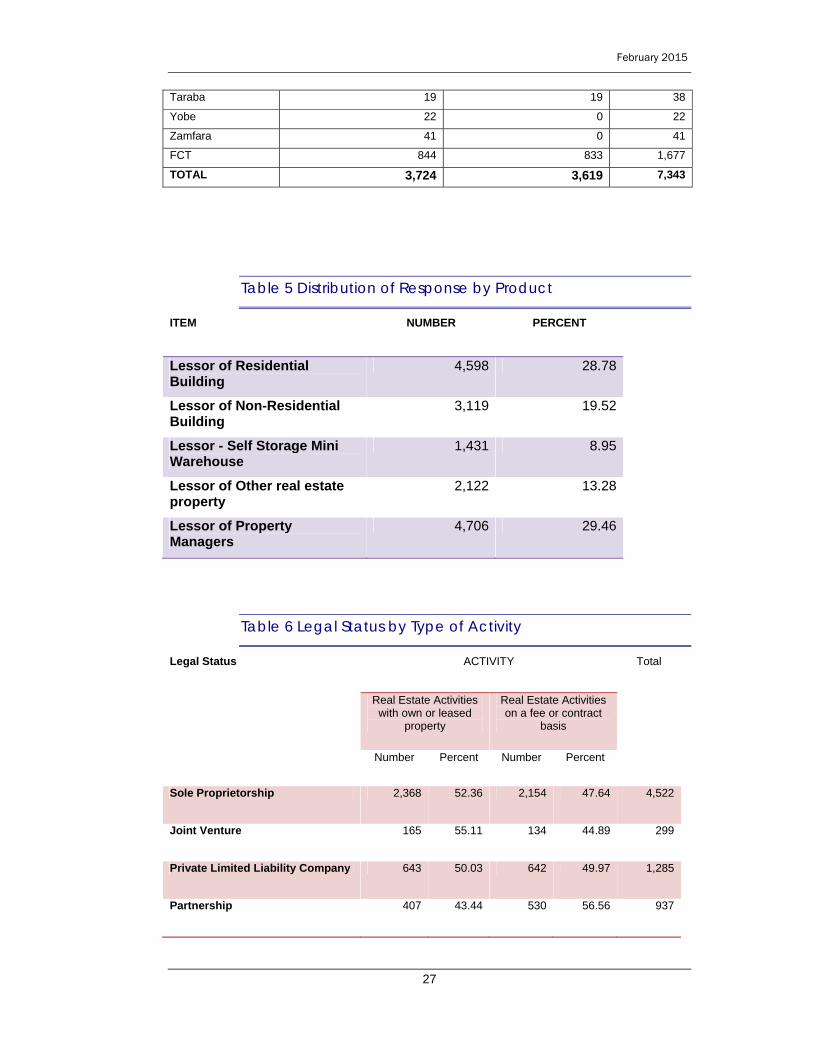
2.1.2 Real Estate Product
Real estate establishments generally offer services surrounding five
types of property (products); Residential Buildings, Non-Residential
Buildings, Self Storage and Mini Warehouses, Property Management
and Other Real Estate Property. The prevalence of each should match
the supply of the property type, and the profitability of the real estate
activity related to them.
The three most common products are property management, leasing
of residential buildings and leasing of non-residential buildings, with
29.46%, 28.78%, and 19.52% of products offered by real estate
establishments respectively. The least common product offered is the
leasing of self-storage or Mini-Warehouses with the lowest share of
8.95%. See Table 5 in the Annex.
2.1.3 Establishment Legal Structure
Real estate can be divided into 8 different classes of legal structure;
Sole Proprietorship, Joint Venture, Private Limited Liability, Partnership,
Public Limited, Faith Based Organisation (FBO), Co-Operative or Other.
This classification tells you about the amount of personal liability that
owners are willing or able to take, as well as their ability to raise capital.
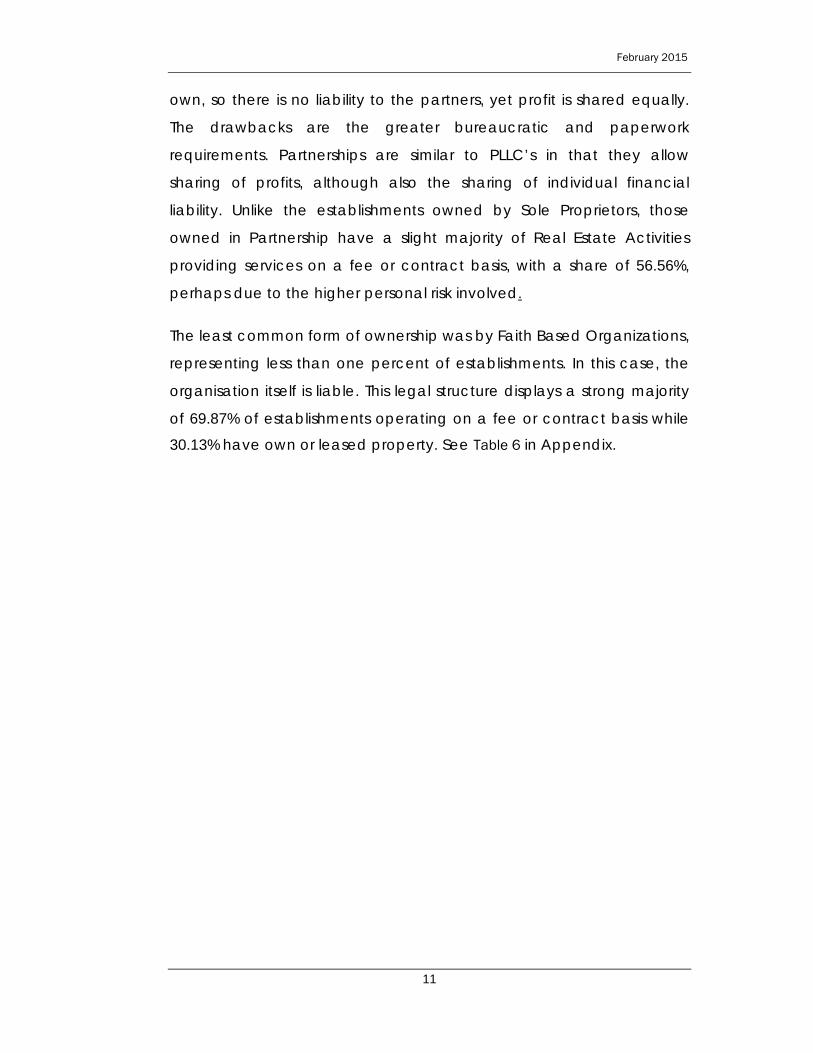
A majority of 61.58% of real estate establishments are owned by the
Sole Proprietors. This means that they are personally liable for all
financial debts of the business, although they also have complete
managerial control.
Private Limited Liability Companies (PLLC) ranked second with 17.49%
ownership and Partnerships ranked third with 12.76%. PLLC’s are
beneficial for partners as it treats the business as a legal entity of its
February 2015
11
own, so there is no liability to the partners, yet profit is shared equally.
The drawbacks are the greater bureaucratic and paperwork
requirements. Partnerships are similar to PLLC’s in that they allow
sharing of profits, although also the sharing of individual financial
liability. Unlike the establishments owned by Sole Proprietors, those
owned in Partnership have a slight majority of Real Estate Activities
providing services on a fee or contract basis, with a share of 56.56%,
perhaps due to the higher personal risk involved.
The least common form of ownership was by Faith Based Organizations,
representing less than one percent of establishments. In this case, the
organisation itself is liable. This legal structure displays a strong majority
of 69.87% of establishments operating on a fee or contract basis while
30.13% have own or leased property. See Table 6 in Appendix.
February 2015
12
Figure 2 Legal Structures
Nigeria’s domination by sole proprietors provides a potential hindrance
to real estate development. In bearing all of the risk themselves, only
the lowest risk and lowest return ventures will be carried out. These
ventures are often on a larger scale, which is what is required if low
cost housing is to be built. By strengthening the legal framework
surrounding partnerships and particularly Limited Licensed Professional
Counselor (LLPC), companies will encourage larger real estate
developments, and start to mop up some of the substantial excess
housing demand.
2.1.4 Professional Body
Having higher numbers of establishments belonging to professional
bodies encourages the development of the sector in several ways,
62%
4%
17%
13%
1%
0%1% 2%
Legal Structure
Sole Proprietorship
Joint Venture
Private Limited Liability Company
Partnership
Public Limited Company
Faith Based Organisation
Cooperative
Others

February 2015
13
primarily through offering a means by which legislation and standards
can be enforced, and through the sharing of knowledge.
Of all establishments surveyed, 61.95% belong to at least one
professional body. Of these, there is a roughly equal split by activity
type; 52.21% provide services on a fee or contract basis whilst the
remaining 47.79% engage in Real Estate Activities with own or leased
property.
Table 1 Distribution of Establishments Belonging to Professional
Body by Activity
Professional Body
Real Estate Activities with own or leased property
Real Estate Activities on a fee or contract basis
Total Percent Total
Number Percentage Number Percentage
Yes 2,174 47.79 2375 52.21 4,549 61.95
No 1,550 55.48 1244 44.52 2,794 38.05
Total 3,724 3619 7,343
2.1.5 Year of Business Commencing
The options for real estate business start up range from 1960 to present
day. Table 7 shows that the highest portion, representing 47.46% of
establishments representing 3,485 establishments, commenced
business in the first decade of the 21st century.
The second highest number was recorded from the year 2010 onwards,
with 1,636 establishments commencing business, representing 22.28%.
Proportionally, the increase after 2010 appears to be greatest,
although it must be taken into account that new businesses have a
high failure rate in their early years of operation. This year had a
February 2015
14
majority of real estate activities operating using own or leased
properties, representing 1,856 establishments, or 53.27% of the total in
this period. Real Estate activities offering services on fee or contract
basis made up the remainder, of 46.73%, representing 1,628
establishments.
The fewest real estate establishments commenced business between
1960-1969 with only 45 establishments, representing less than 1% of the
total. This category, as well as the 1970-1979 band, commenced prior
to the unifying Land Use Degree/Act of 1978. Of the establishments
that were created at this time, a combined total of just 2.09% were still
in operation when the survey was conducted. Businesses commencing
between 1960 and 1969 had the largest majority of 66.67% of real
estate activities using own or leased properties.
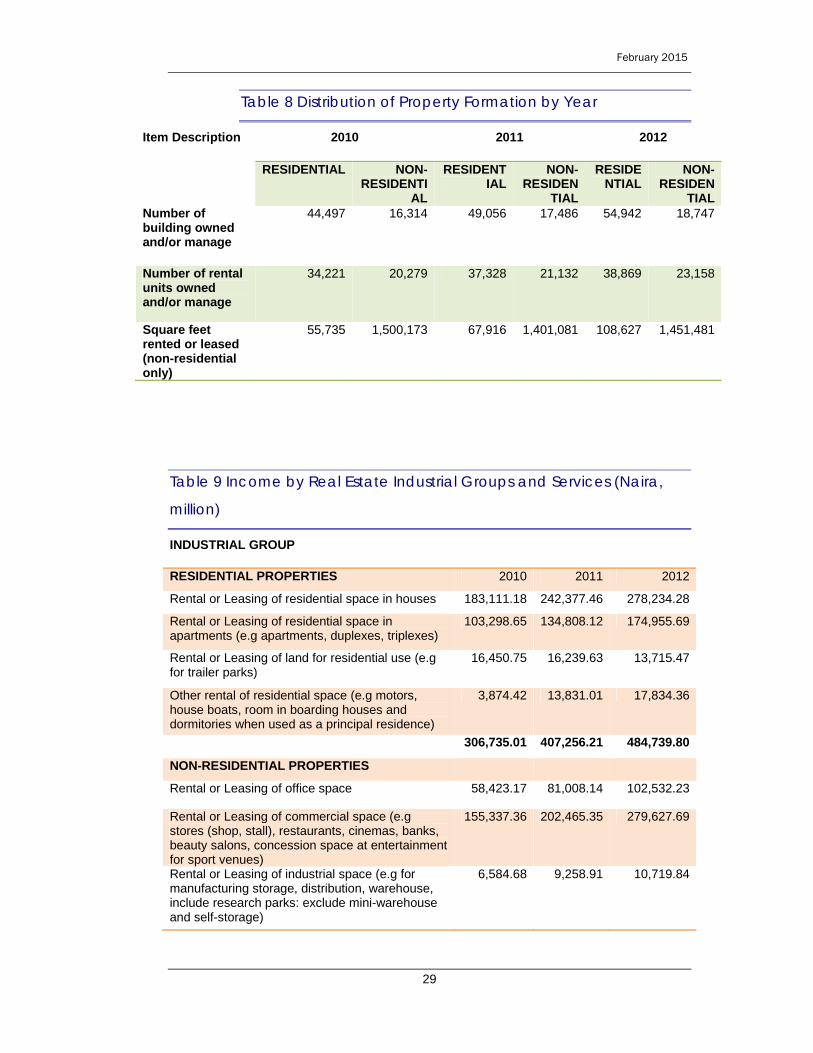
2.2 Distribution of Property Form
Real estate can take the form of either residential or non-residential
property. Each can then be evaluated for the three years under review
with regard to the number of properties owned, rented or leased and
the number of square feet rented or leased.
The number of Residential Buildings owned is greater than the number
rented in all three years, reaching 54,942 owned buildings in 2012,
compared with 38,869 rental units in the same year. Further, this share is
increasing; in 2010 56.53% of all residential buildings were owned and
managed, which increased to 56.79% in 2011 and 58.57% in 2012. This
translated into growth in the number of residential properties owned
and managed of 10.25% in 2011 and 12.00% in 2012. Growth in the
number of rental units managed was slower at 9.08% in 2011 and 4.13%
in 2012.
Non-residential buildings are fewer in number than residential buildings
in all three years in both sub categories of owned buildings and rental

February 2015
15
units. For instance in 2012, a quarter of non-residential buildings were
owned, and 62.66% were rental units. Unlike residential property, the
number of non-residential buildings rented or leased is greater than the
number owned in all three years; approximately 55% of all non-
residential property is for rental units in each of the years of review. In
2012, the maximum of 23,158 non-residential properties were rental
units, whilst 18,747 were owned.
The number of square feet of rented property, reported for non-
residential only, exhibited an overall decline over the period. In 2010, it
peaked at 1,500,173 square feet, declining by 6.61% in 2011. Despite
growth of 3.60% in 2012, the 1,451,481 square feet recorded was still
lower than the 2010 value. The average size of non-residential rented
units declined from 73.98 square feet in 2010, to 66.30 in 2011 to 62.68
square feet in 2012. This is indicative of the increased pressures and
excess demand for property and land in urban centres. (See Table 8 in
Annex).

February 2015
16
3 GROWTH, ASSESTS AND PROFITABILITY
3.1 Contribution to GDP
Figure 3 Real Estate Contribution to GDP (Naira, million)
The Real Estate Sector’s contribution to Gross Domestic Product (GDP)
has fluctuated in the 7% region over the years in review. It went from
7.56% in 2010, down by 0.28% points in 2011 and showing a slight
increase in 2012 up to 7.73% of total GDP.
3.2 Establishment Income
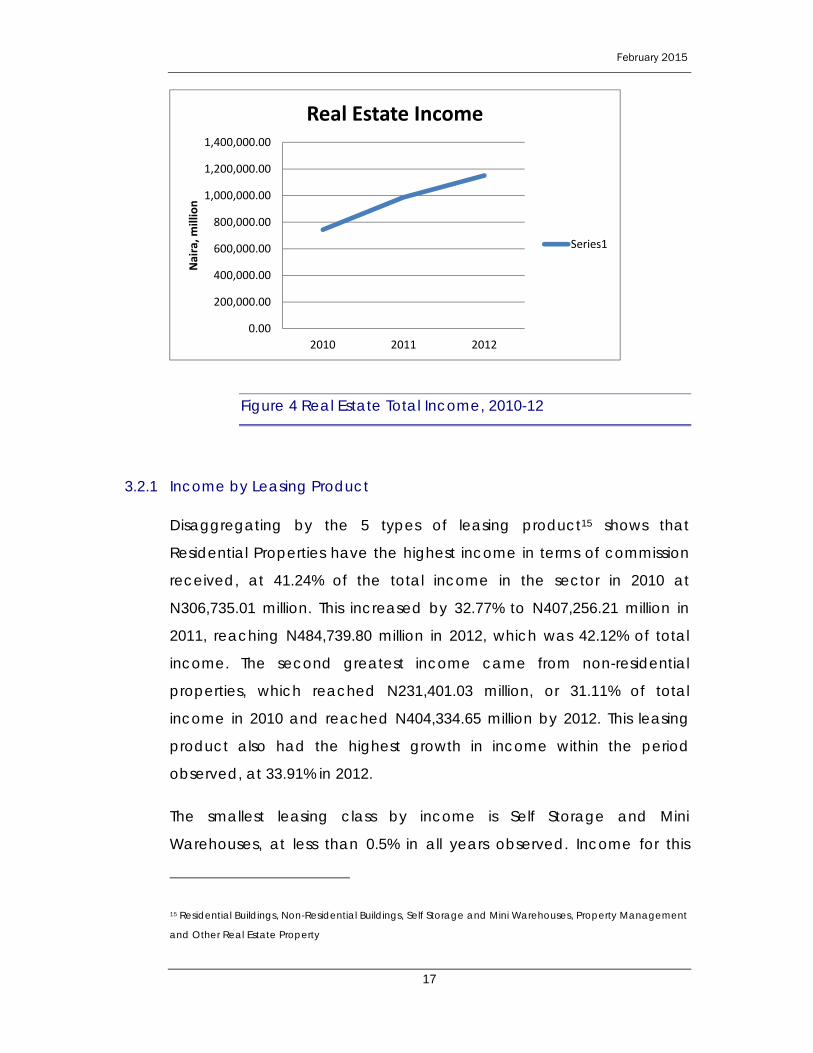
The total income received across all Nigerian real estate establishments
was recorded at N743,745.54 million in 2010. It increased by 32.73% in
2011 to N987,191.97 million. With a slower increase by 16.59% or
N163,754.79 million, 2012 saw total income come to N1,150,946.76
million.
0.00
1,000,000.00
2,000,000.00
3,000,000.00
4,000,000.00
5,000,000.00
6,000,000.00
2010 2011 2012
Naira, m
illion
Real Estate Sector Contribution to GDP
Series1
February 2015
17
Figure 4 Real Estate Total Income, 2010-12
3.2.1 Income by Leasing Product
Disaggregating by the 5 types of leasing product15 shows that
Residential Properties have the highest income in terms of commission
received, at 41.24% of the total income in the sector in 2010 at
N306,735.01 million. This increased by 32.77% to N407,256.21 million in
2011, reaching N484,739.80 million in 2012, which was 42.12% of total
income. The second greatest income came from non-residential
properties, which reached N231,401.03 million, or 31.11% of total
income in 2010 and reached N404,334.65 million by 2012. This leasing
product also had the highest growth in income within the period
observed, at 33.91% in 2012.
The smallest leasing class by income is Self Storage and Mini
Warehouses, at less than 0.5% in all years observed. Income for this
15 Residential Buildings, Non-Residential Buildings, Self Storage and Mini Warehouses, Property Management
and Other Real Estate Property
0.00
200,000.00
400,000.00
600,000.00
800,000.00
1,000,000.00
1,200,000.00
1,400,000.00
2010 2011 2012
Naira, m
illion
Real Estate Income
Series1
February 2015
18
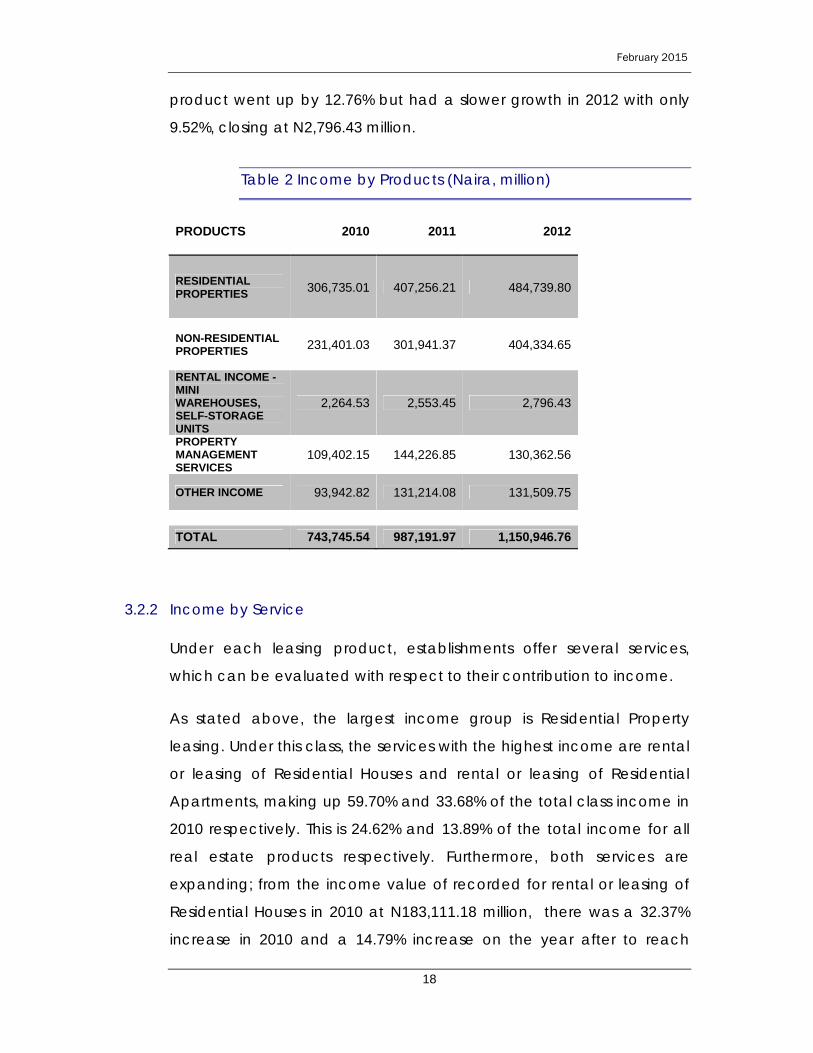
product went up by 12.76% but had a slower growth in 2012 with only
9.52%, closing at N2,796.43 million.
Table 2 Income by Products (Naira, million)
PRODUCTS 2010 2011 2012
RESIDENTIAL PROPERTIES 306,735.01 407,256.21 484,739.80
NON-RESIDENTIAL PROPERTIES 231,401.03 301,941.37 404,334.65
RENTAL INCOME - MINI WAREHOUSES, SELF-STORAGE UNITS
2,264.53 2,553.45 2,796.43
PROPERTY MANAGEMENT SERVICES
109,402.15 144,226.85 130,362.56
OTHER INCOME 93,942.82 131,214.08 131,509.75
TOTAL 743,745.54 987,191.97 1,150,946.76
3.2.2 Income by Service
Under each leasing product, establishments offer several services,
which can be evaluated with respect to their contribution to income.
As stated above, the largest income group is Residential Property
leasing. Under this class, the services with the highest income are rental
or leasing of Residential Houses and rental or leasing of Residential
Apartments, making up 59.70% and 33.68% of the total class income in
2010 respectively. This is 24.62% and 13.89% of the total income for all
real estate products respectively. Furthermore, both services are
expanding; from the income value of recorded for rental or leasing of
Residential Houses in 2010 at N183,111.18 million, there was a 32.37%
increase in 2010 and a 14.79% increase on the year after to reach
February 2015
19
N278,234.28 million at the end of 2012. Rental or leasing of Residential
Apartments increased by 30.50% in 2011 and 29.78% in 2012, to reach
N174,955.69 million.
For Non-Residential Properties, the service that generates the greatest
level of income is rental or leasing of Commercial Space, made up
67.13% of the total for the class in 2010, and 20.89% of the total income
for real estate. This is followed by rental or leasing of Office Space,
which makes up 25.25% of the non-residential class. The largest decline
in income within this category was for rental or leasing of Land for Non
Residential use, which declined by 31.54% in 2011, increasing by 20.31%
the following year, which resulted in a net income decline in the
period.
The third largest leasing class, Property Management, derives the
majority of its income from Residential property management services,
making up 66.81% of its class income in 2010. Despite the share dipping
to 60.81% in 2011, it increased dramatically to take up a share of
74.33% of the class income for 2012. Although, there was an increase of
N9,200.72 million in 2012, to justify the increased share for Residential
Building, another reason can mainly be attributed to a decline in Non
Residential Property Management by 46.49%, the largest decline in the
sector.
Both Other Income and Self Storage and Mini Warehouses have no
subcategories for their services. Other income experienced higher
growth of 39.67% in 2011, but saw a much reduced growth of 0.23% in
2012. Self-storage and Mini Warehouses saw a growth rate of 12.76 in
2011, which slowed down to 9.52% by 2012.
3.3 Cost of Operation
The cost of operation is the total amount incurred for all expenditures
relating to the running of the real estate establishment over the year in
February 2015
20
question. The total cost of operation showed a consistent annual
increase in the period of review. From N260,385.31 million in 2010, it
increased by 32.73% to N345,616.96 million in 2011 and by a further
16.59% on 2011 to reach N402,946.46 million in 2012.
Operational costs can be broken down into 14 categories. Of these,
the largest cost in all three years was the cost of PHCN energy, which
had very little fluctuations in its share of the total, from 60.87% in 2010, it
went down to 60.53% in 2011, and went up to 62.12% in 2012.
Another significant area of operational expense was in Property
Management Fees, which showed declines in its share of the total from
2010 to 2012, with only a marginal increase of 0.19% points to 9.80%,
between 2011 and 2012. Even as its share of the total declined over the
3-year period, Property Management Fees costs increased in the same
period, going from N26,549.22 million in 2010 to N33,233.65 million in
2011. By 2012 there was an 18.88% increase to reach a total of
N39,508.07 million for that year.
Energy or power generation was also another area of interests as it
relates to costs. Three activity areas bore energy costs - PHCN16, fuel
used by generator and other sources of energy. All three sources of
energy had substantial increases in costs, PHCN being the lowest at
31.99% and generator fuel being the highest with an increase of 79.30%
in 2011. By 2012, other sources of energy, which had a growth of 50.14%
in 2011, had slowed down to a mere 1.37%, while generator fuel had
even declined by 34.51%. PHCN too had a slower growth in 2012 rising
by 19.64% to reach N250,302.16 million.
16 Power Holding Company of Nigeria (PHCN) has since been disbanded to form 11 distribution
companies in Nigeria.
February 2015
21
3.4 Employees’ Compensation
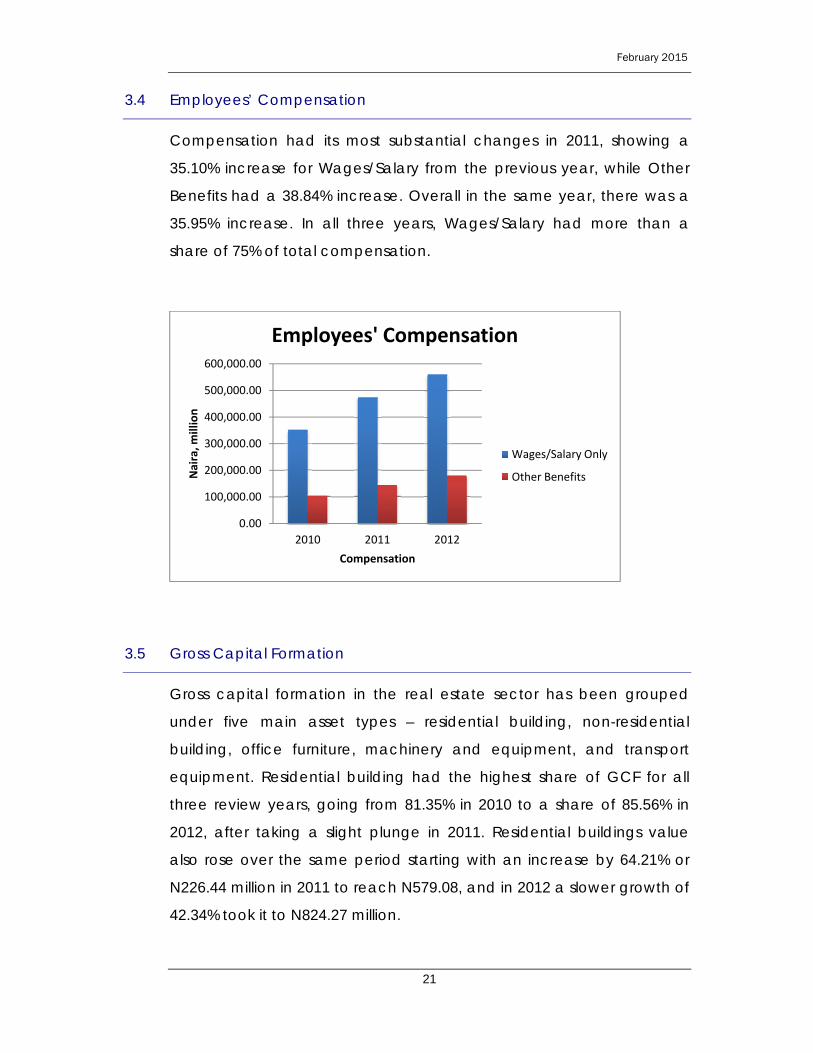
Compensation had its most substantial changes in 2011, showing a
35.10% increase for Wages/Salary from the previous year, while Other
Benefits had a 38.84% increase. Overall in the same year, there was a
35.95% increase. In all three years, Wages/Salary had more than a
share of 75% of total compensation.
3.5 Gross Capital Formation
Gross capital formation in the real estate sector has been grouped
under five main asset types – residential building, non-residential
building, office furniture, machinery and equipment, and transport
equipment. Residential building had the highest share of GCF for all
three review years, going from 81.35% in 2010 to a share of 85.56% in
2012, after taking a slight plunge in 2011. Residential buildings value
also rose over the same period starting with an increase by 64.21% or
N226.44 million in 2011 to reach N579.08, and in 2012 a slower growth of
42.34% took it to N824.27 million.
0.00
100,000.00
200,000.00
300,000.00
400,000.00
500,000.00
600,000.00
2010 2011 2012
Naira, m
illion
Compensation
Employees' Compensation
Wages/Salary Only
Other Benefits
February 2015
22
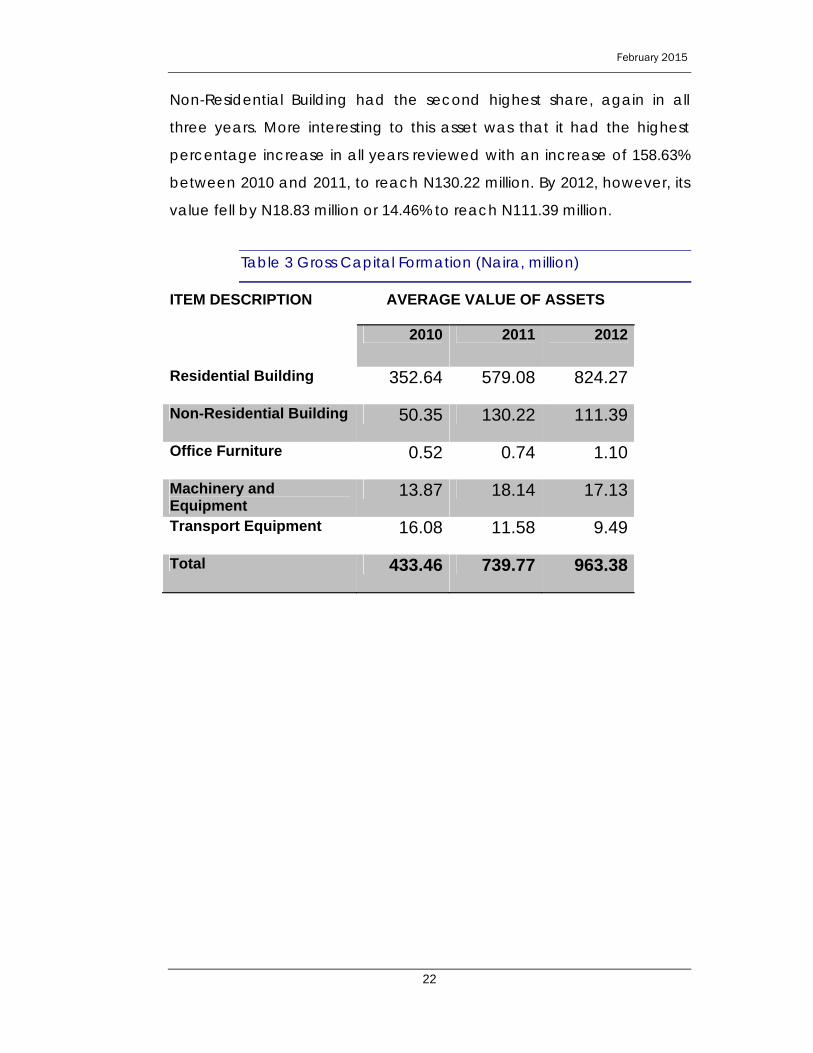
Non-Residential Building had the second highest share, again in all
three years. More interesting to this asset was that it had the highest
percentage increase in all years reviewed with an increase of 158.63%
between 2010 and 2011, to reach N130.22 million. By 2012, however, its
value fell by N18.83 million or 14.46% to reach N111.39 million.
Table 3 Gross Capital Formation (Naira, million)
ITEM DESCRIPTION AVERAGE VALUE OF ASSETS
2010 2011 2012
Residential Building 352.64 579.08 824.27
Non-Residential Building 50.35 130.22 111.39
Office Furniture 0.52 0.74 1.10
Machinery and Equipment
13.87 18.14 17.13
Transport Equipment 16.08 11.58 9.49
Total 433.46 739.77 963.38
February 2015
23
4 EMPLOYMENT
4.1 Aggregate Employment
In the period under review the number of persons employed within the
Real Estate sector increased from 19,305 in 2010 people to 22,504 in
2012. This represents a 7.47% increase in employment between 2010
and 2011, accelerating to 8.49% the following year.
4.2 Distribution of Employment by State
Despite having fewer establishments than in Lagos state, FCT Abuja
had the highest number of employees in each of the years observed.
In 2010, this was recorded at 5,288 employees, or 27.39% of the total
employed. It increased by 8.76% in 2011, to 5751 employees,
accelerating to 12.69% growth in 2012, so that FCT Abuja represented
28.79% of real estate employment.
This can be compared with Lagos, which had 40% more establishments
than FCT Abuja, yet maintained a lesser share of employment of
approximately 23% in all three years; almost 6 percentage points less
than the FCT Abuja share in 2012. This means that average firm size is
3.88 employees in Abuja and 2.22 in Lagos in 2012. Employment growth
in Lagos State was 6.92% in 2011, increasing to 9.35% the year
thereafter.
Rivers state had the third largest share of establishments, and equally
had the third largest share of employees at 1439 in 2010, which is 7.45%
of the total. However, this share shrank over time; in 2011 it contributed
7.18% of employment and in 2012 it was just 6.66%. This is due to the
lower employment growth rate of 3.54% in 2011, decelerating to 0.54%
in 2012.
February 2015
24
Ebonyi State had both the lowest share of employment, and the
highest rate of employment growth. From the 37 employees recorded
in 2010, there was a 48.65% increase to the 55 recorded the following
year, and a 7.27% increase the year after. Yet, in 2012, it only reached
a share of 0.26% of the total employed. Yobe State exhibited the
greatest decline in employment, from 0.27% of the total employed in
2010 to just 0.10% in 2012, a decrease of 59.49% in total.
4.3 Composition of Employment
Disaggregating employment by gender shows that over 70% of
Nigerians employed in the real estate sector are male, in all three
years. There is a slight decrease from 72.02% in 2010, to 71.15 in 2011,
despite increasing to 71.36% in 2012. Non-Nigerians have an even
higher portion of males, increasing from 82.05% in 2010, to 89.74% in
2011 to 94.09% in 2012.
Nigerian employees, represent 99.25% of the employed in in 2010,
99.65% in 2011 and 99.64% in 2012. The number of Non-Nigerians
recorded was 72 in 2010, 72 in 2011 and 81 in 2012.
4.3.1 Distribution of Employment by Gender and Nationality
While approximately 70% of those employed in the real estate sector
are male, there is however great variation across states. In 2012, it
ranged from the relatively equal split of 54.76% male in Enugu, to 100%
male in Yobe. Five states - Jigawa, Kano, Katsina, Kebbi and Borno -
had over 90% males in the sector in all three years. Only Enugu and Edo
had less than 60% males in all three years, although this portion
increased in both states between 2010 and 2012. Interestingly, Enugu
had majority female employed in real estate in 2010 with 42.38% male,
yet this increased to 54.61% the following year and 54.78% the year
after. Similarly, Edo state increased from 51.01% male in 2010 to 54.78%
in 2012.
February 2015
25
Only six states had non-Nigerian employees; Akwa-Ibom, Kaduna,
Lagos, Niger, Ondo and FCT Abuja. FCT Abuja has the highest number
of non-Nigerian employees, with 41 employees in 2010, representing
56.41% of all non-Nigerians employed in the real estate sector that
year. This declined to 48.72% in 2011 and 42.49% in 2012. The second
largest employer of non-Nigerians for the period was Lagos State,
which had 13 non-Nigerians in 2010. Unlike FCT Abuja, this number
increased over the period, reaching 22 in 2012. The only state with non-
Nigerian female employees was FCT Abuja.
Sources:
http://www.academia.edu/1318354/Housing_Needs_and_Land_Admin
istration_in_Nigeria_Problems_and_Prospects
http://www.globalpropertyguide.com/Africa/Nigeria/Rental-Yields
February 2015
26
ANNEX 1: Tables
Table 4 Distribution of Response by Activity and State
STATE ACTIVITY TOTALREAL ESTATE ACTIVITIES
WITH OWN OR LEASED PROPERTY
REAL ESTATE ACTIVITIES ON A FEE OR CONTRACT
BASIS
Abia 15 22 37
Adamawa 30 19 49
Akwa Ibom 60 49 109
Anambra 26 202 228
Bauchi 37 26 63
Bayelsa 49 7 56
Benue 34 30 64
Borno 7 0 7
Cross River 34 26 60
Delta 34 131 165
Ebonyi 11 11 22
Edo 67 34 101
Ekiti 7 49 56
Enugu 67 86 153
Gombe 11 19 30
Imo 67 45 112
Jigawa 7 0 7
Kaduna 30 134 164
Kano 56 41 97
Katsina 41 15 56
Kebbi 11 63 74
Kogi 30 34 64
Kwara 52 60 112
Lagos 1,389 952 2,341
Nassarawa 0 22 22
Niger 26 123 149
Ogun 41 52 93
Ondo 67 138 205
Osun 11 49 60
Oyo 116 93 209
Plateau 45 37 82
Rivers 224 198 422
Sokoto 93 0 93
February 2015
27
Taraba 19 19 38
Yobe 22 0 22
Zamfara 41 0 41
FCT 844 833 1,677
TOTAL 3,724 3,619 7,343
Table 5 Distribution of Response by Product
ITEM NUMBER PERCENT
Lessor of Residential Building
4,598 28.78
Lessor of Non-Residential Building
3,119 19.52
Lessor - Self Storage Mini Warehouse
1,431 8.95
Lessor of Other real estate property
2,122 13.28
Lessor of Property Managers
4,706 29.46
Table 6 Legal Status by Type of Activity
Legal Status ACTIVITY Total
Real Estate Activities with own or leased
property
Real Estate Activities on a fee or contract
basis
Number Percent Number Percent
Sole Proprietorship 2,368 52.36 2,154 47.64 4,522
Joint Venture 165 55.11 134 44.89 299
Private Limited Liability Company 643 50.03 642 49.97 1,285
Partnership 407 43.44 530 56.56 937
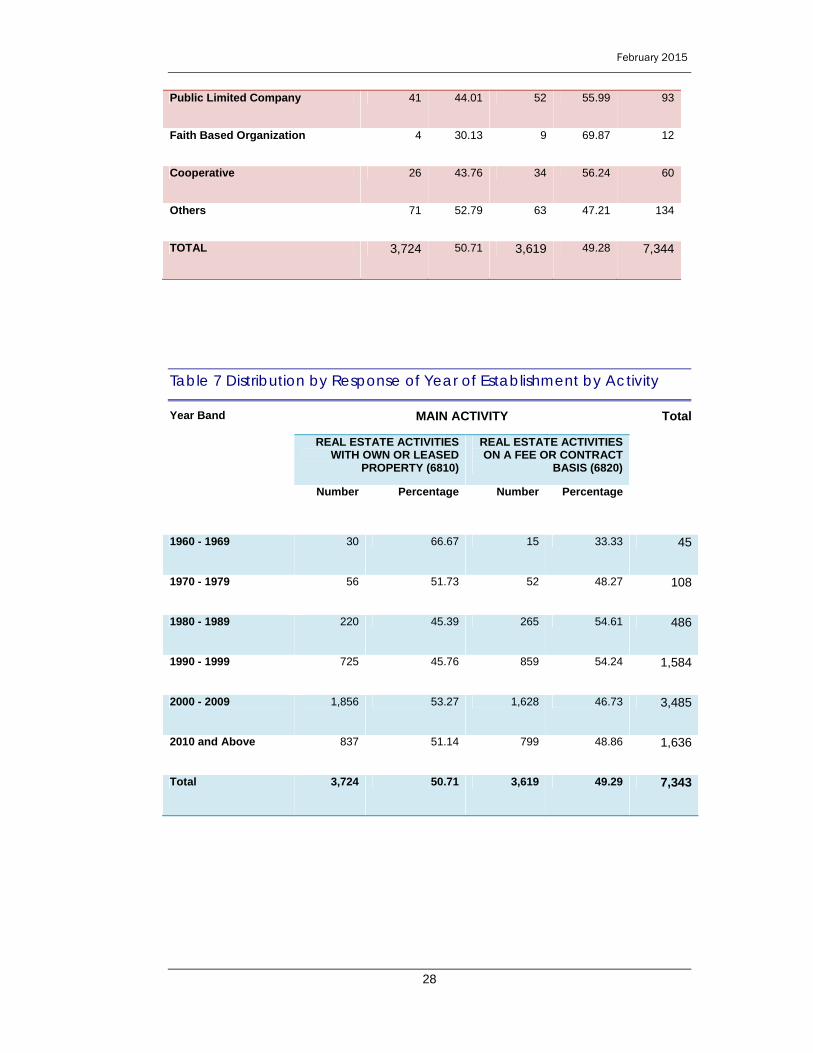
February 2015
28
Public Limited Company 41 44.01 52 55.99 93
Faith Based Organization 4 30.13 9 69.87 12
Cooperative 26 43.76 34 56.24 60
Others 71 52.79 63 47.21 134
TOTAL 3,724 50.71 3,619 49.28 7,344
Table 7 Distribution by Response of Year of Establishment by Activity
Year Band MAIN ACTIVITY Total
REAL ESTATE ACTIVITIES WITH OWN OR LEASED
PROPERTY (6810)
REAL ESTATE ACTIVITIES ON A FEE OR CONTRACT
BASIS (6820)
Number Percentage Number Percentage
1960 - 1969 30 66.67 15 33.33 45
1970 - 1979 56 51.73 52 48.27 108
1980 - 1989 220 45.39 265 54.61 486
1990 - 1999 725 45.76 859 54.24 1,584
2000 - 2009 1,856 53.27 1,628 46.73 3,485
2010 and Above 837 51.14 799 48.86 1,636
Total 3,724 50.71 3,619 49.29 7,343
February 2015
29
Table 8 Distribution of Property Formation by Year
Item Description 2010 2011 2012
RESIDENTIAL NON-RESIDENTI
AL
RESIDENTIAL
NON-RESIDEN
TIAL
RESIDENTIAL
NON-RESIDEN
TIALNumber of building owned and/or manage
44,497 16,314 49,056 17,486 54,942 18,747
Number of rental units owned and/or manage
34,221 20,279 37,328 21,132 38,869 23,158
Square feet rented or leased (non-residential only)
55,735 1,500,173 67,916 1,401,081 108,627 1,451,481
Table 9 Income by Real Estate Industrial Groups and Services (Naira,
million)
INDUSTRIAL GROUP
RESIDENTIAL PROPERTIES 2010 2011 2012
Rental or Leasing of residential space in houses 183,111.18 242,377.46 278,234.28
Rental or Leasing of residential space in apartments (e.g apartments, duplexes, triplexes)
103,298.65 134,808.12 174,955.69
Rental or Leasing of land for residential use (e.g for trailer parks)
16,450.75 16,239.63 13,715.47
Other rental of residential space (e.g motors, house boats, room in boarding houses and dormitories when used as a principal residence)
3,874.42 13,831.01 17,834.36
306,735.01 407,256.21 484,739.80
NON-RESIDENTIAL PROPERTIES
Rental or Leasing of office space 58,423.17 81,008.14 102,532.23
Rental or Leasing of commercial space (e.g stores (shop, stall), restaurants, cinemas, banks, beauty salons, concession space at entertainment for sport venues)
155,337.36 202,465.35 279,627.69
Rental or Leasing of industrial space (e.g for manufacturing storage, distribution, warehouse, include research parks: exclude mini-warehouse and self-storage)
6,584.68 9,258.91 10,719.84
February 2015
30
Rental or Leasing of land for non-residential use (e.g for commercial or industrial use; include agricultural land, inland surface waters for recreation use)
9,405.09 6,438.51 7,746.44
Income Non-Residential Services: Other rentals of non-reside
1,650.72 2,770.45 3,708.45
231,401.03 301,941.37 404,334.65
Rental Income - Mini-Warehouses and self storage units (e.g cold rooms etc)
2,264.53 2,553.45 2,796.43
PROPERTY MANAGEMENT SERVICES
Residential Building 73,092.99 87,698.63 96,899.35
Non-Residential Building 31,854.46 51,948.84 27,797.33
Land 4,454.69 4,579.38 5,665.87
109,402.15 144,226.85 130,362.56
OTHER INCOME
Other Income: 93,942.82 131,214.08 131,509.75
Income Total 743,745.54 987,191.97 1,150,946.76
Table 10 Cost of Operation (Naira million)
DESCRIPTION 2010 2011 2012 Cost of Energy - PHCN 158,505.50 209,209.85 250,302.16
Cost of Energy - Fuel used by Generator
7,623.86 13,669.41 8,952.16
Cost of Energy - Other Source
720.46 1,081.69 1,096.49
Rent of Office Accommodation
13,470.89 16,762.11 18,468.74
Rent of Machinery and Equipment
2,228.08 2,772.36 3,539.11
Water Bills 3,420.97 4,331.15 5,367.09
Property Management fees paid
26,549.22 33,233.65 39,508.07
Real Estate Commission paid
9,020.88 8,548.61 8,901.16
Property taxes paid 1,840.96 2,678.23 3,321.94 Mortgage Interest paid 1,895.51 3,308.31 3,472.67 Telephone Bills 3,559.57 3,816.00 4,272.47
February 2015
31
Cost of Stationaries (Consumables)
3,613.16 3,751.66 3,604.21
Consultancy Services 3,144.14 5,331.02 4,763.38
Other Miscellaneous Cost (includes licenses, fees)
24,792.09 37,122.90 47,376.81
TOTAL COST 260,385.31 345,616.96 402,946.46
Table 11 Employees' Compensation
2010 2011 2012
Wages/Salary Only
351,981.24 475,525.03 560,869.43
Other Benefits
104,432.92 144,991.63 179,135.43
TOTAL 456,414.16 620,516.66 740,004.86
Table 12 Number of Employees by Nationality and State
State
Employment Nigerians Employment Non-Nigerians 2010 2011 2012 2010 2011 2012
Male Female Male Female Male Female Male Female Male Female Male Female
Abia 72 43 74 41 69 39 . . . . . .
Adamawa 72 20 78 22 76 24 . . . . . . Akwa Ibom 161 54 168 54 204 63 4 . 6 . 6 .
Anambra 250 131 265 148 285 159 . . . . . .
Bauchi 102 22 124 26 144 24 . . . . . .
Bayelsa 137 39 117 37 124 57 . . . . . .
Benue 72 22 69 22 80 22 . . . . . .
Borno 57 2 69 2 69 2 . . . . . . Cross River 178 69 172 69 178 67 . . . . . .
Delta 302 172 320 183 333 191 . . . . . .
Ebonyi 28 9 35 20 37 22 . . . . . .
Edo 141 135 152 143 159 131 . . . . . .
February 2015
32
Ekiti 50 22 52 22 56 22 . . . . . .
Enugu 165 224 274 228 276 228 . . . . . .
Gombe 93 20 91 24 106 39 . . . . . .
Imo 139 72 148 83 152 87 . . . . . .
Jigawa 59 2 59 2 59 6 . . . . . .
Kaduna 343 96 346 115 357 130 . . . . 4 .
Kano 367 37 400 37 398 37 . . . . . .
Katsina 393 17 357 17 361 17 . . . . . .
Kebbi 357 2 417 4 548 6 . . . . . .
Kogi 168 37 168 46 163 59 . . . . . .
Kwara 209 72 220 146 237 141 . . . . . .
Lagos 3,155 1,281 3,338 1,402 3,625 1,555 13 17 22 . Nassarawa 52 13 56 15 52 15 .
Niger 415 133 474 143 541 168 6 6 6 .
Ogun 124 46 126 48 122 54 .
Ondo 618 230 615 276 672 304 9 9 9
Osun 78 33 78 37 78 37 . . . . . .
Oyo 409 280 443 278 461 259 . . . . . .
Plateau 46 7 50 7 56 13 . . . . . .
Rivers 1,022 417 1,009 481 1,026 472 . . . . . .
Sokoto 128 19 137 19 139 20 . . . . . .
Taraba 80 22 94 35 117 39 . . . . . .
Yobe 44 9 37 6 22 . . . . . .
Zamfara 61 28 61 26 65 24 . . . . . .
FCT 3,705 1,542 4,016 1,700 4,557 1,889 28 13 28 7 30 5
Total 13,852 5,381 14,709 5,962 16,001 6,421 59 13 65 7 76 5