Embed Size (px)
Citation preview

Real Estate Outlook

Real Estate Outlook Mexico
Index
1. Summary..................................................................................................................................................................................................................................................................... 1
2. Situation .
2.a. Construction: close to completing the cycle...................................................................................................................................................................2
2.b. Credit and mortgage financing for housing ....................................................................................................................................................................7
Inset 1: Overview of mortgage loans on a state level 1 ................................................................................................................................................. 14
2.c. What do analysts think of housing construction companies? 2 .............................................................................................................17
3. Special topics3.a. The “unaffiliated” and their relation with the mortgage market 3........................................................................................................ 22
Inset 2: The SHF program for those unaffiliated to government housing institutions 4.................................................... 30
3.b. The “land banks”: a little-used financial model 5........................................................................................................................................................ 32
3.c. Infonavit: the 2012-2016 Financial Plan and the new Law 6.......................................................................................................................40
4. Statistical Appendix .................................................................................................................................................................................................................44
5. Special topics Included in previous issues.................................................................................................................48
Closing date: December 15, 2011
1 We appreciate the participation of Luis Miguel Jaramillo, of AHM, in compiling the information.2 We appreciate the participation of Actinver, Banorte, Credit Suisse, Deutsche Bank, GBM, JP Morgan, Morgan Stanley and Scotiacapital, in compiling the information. We also thank Pedro Uriz of BBVA Research, for his comments regarding this document.3 We appreciate the participation of Isidoro Sánchez, of BBVA Bancomer, for his comments on the document. 4 We appreciate the participation of Ramsés Monzón and Óscar Grajales of SHF, in consolidating and interpreting the information.5 We appreciate the collaboration of Maite Igareda, Roberto Apaez and Rafael Díaz, of Prudential Real Estate Investors (PREI); Juan Carlos Braniff and Jorge Hierro of Capital “i”; and of Jorge García Sainz, of Corporación Geo, in compiling and interpreting the information.6 We appreciate the collaboration of José de Jesús Gómez and Gerardo Bazán, of Infonavit, in compiling and interpreting the information.
SEE IMPORTANT INFORMATION ON PAGE 49 OF THIS DOCUMENT

Real Estate Outlook Mexico
Page 1
1. Summary2012 should be a good year for the construction industry. The outlook is for a better performance of the economy as a whole, for the second consecutive year. With this, the high production levels achieved in 2008 should finally be recovered. The motivating forces will be present mainly in the first half of the year, with the conclusion of public works and a higher budget for housing support programs. With regard to the latter, the calendar foreseen shows that in the January-June period, the number of mortgage loans that will be granted under a federal subsidy program will equal those granted during all of 2011. This indicates that housing construction, which had slowed down, could improve.
2011 was a year of recovery in mortgage activity, which was confirmed in the various segments and in loan products. The Infonavit, for example, met its financing goal ahead of time, and the new product that it launched for remodeling surpassed by more than 70% the projection for the year. It is clear that with the appropriate products and segmentation, there is a margin in the housing market for growth in the medium term. However, in 2012 with an impending global slowdown, the impact for Mexico, which could result in a substantial moderation in the creation of jobs, suggests a more gradual growth than in 2011 in the demand for mortgages. The subsidy programs could partially offset this effect, and although they would not totally cancel it, we maintain the expectation that mortgage activity will continue to grow in 2012.
The housing construciton companies that are traded on the stock exchange faced a difficult 2011, with a drop of almost 50% in the price of their shares. In the opinion of analysts, in some cases this valuation does not correspond to the companies’ fundamentals. Nevertheless, and although 2012 offers a better outlook for housing construction, the rebound in the stock value of these companies will depend on their capacity to generate an appropriate mix of growth and return for investors, measured in terms of the companies’ cash flow.
Starting this year, the federal government will launch a credit product for the population without access to the public housing institutions, which in fact includes a greater percentage than that of the affiliated population. Our analysis on the potential size of this market suggests a cautiously optimistic position. Although the potential demand is significant, the important aspect is to accurately identify real demand and the most appropriate product to meet it. In this edition of Mexico Real Estate Outlook our analysis is focused on this. The information available is limited regarding the employed population that is not affiliated to public housing institutions, so the quantification of its potential must be conservative. This is the key element to avoid generating false expectations regarding the programs that have been set in motion to service it.
Land banks have been used by local governments in various countries as a mechanism to manage a better use of the land and promote economic efficiency. The strategy has required a linkage between the public and private sectors in order to implement a long-term vision. Mexico should make the most of this experience, especially in areas that have shown strong housing growth but urban development and the services that provide greater real estate appreciation for the housing developments have been scant. However, something quite redeemable has occurred, to which little attention has been paid; these are the financing projects for land. Growth in recent years has been significant, and has not been limited to housing. The conditions are there for this activity to continue growing substantially in the following years, something that undoubtedly will benefit home builders, but also commercial centers, offices and industrial plants, which in some cases could mitigate the impact of uninhabited housing.
The approval of the Infonavit Law offers better conditions for the financing granted by the Institution and benefits the beneficiaries of those rights by allowing access to the resources and even to a second loan. In addition, its 2012-2016 Financial Plan highlights the strategies to strentthen the granting and collection of the loans, as well as those aimed at a new model of servicing the housing needs of its affiliates. With this, it not only attends to the quality of the loan portfolio, but advances in attention to the workers with an impact on their quality of life and housing.

Real Estate Outlook Mexico
Page 2
2.a. Construction: close to completing the cycle
Graph 1 Graph 2
-12
-8
-4
0
4
8
480
520
560
600
640
1Q08 3Q08 1Q09 3Q09 1Q10 3Q10 1Q11 3Q11
% C
han
ge
Bill
ion
of c
on
stan
t p
eso
s
Real constructionGDP (left)
NationalGDP growth
ConstructionGDP growth Construction Edification Civil works Specialized
-20
-10
0
10
1Q08 3Q08 1Q09 3Q09 1Q10 3Q10 1Q11 3Q11
Source: BBVA Research with INEGI data. Source: BBVA Research with INEGI data.
2011 was a year of recovery for the construction industry, being that its growth surpassed that of the economy as a whole (through the third quarter, construction GDP was 5.3%, while the national was 4.5%, measured with the industrial activity in September it grew 7.0% vs. 4.8% of the national through the same period.). For this 2012, with an impending electoral process and with expanding domestic and foreign demand, although at more moderate rates, the outlook for this 2012 is favorable. The risks of a marked deterioration in the global economic environment will be present, although the truth is that at least for this sector, the components of domestic demand will be the main determinants for its growth.
During the whole of 2011, the growth rate in construction surpassed that of national GDP, although it was based on a lower comparative basis, both because the contraction was more severe and because the recovery took longer. While in 2008, GDP fell 6.3%, construction fell by 7.3%. Also, in 2010, the economy advanced 5.6% and construction remained at 0% with some quarters even decreasing.
Measured in absolute terms, construction GDP is still below the maximum levels of the cycle registered in 2008. Following the current trends, it should reach this level in the first or second quarter of this year. This already in line with what at its time had been anticipated (See Mexico Real Estate Outlook of January 2011), about a 4-year term for the recovery of the maximum levels of 2008.
At the component level, construction, which comprises activities such as offices, shopping centers, housing, among others, registered the sharpest drop during the recession. Even though it started to show a strong rally as of the second quarter of 2010, which remained during the entire 2011. In this last year, growth, the same as that of civil works, remained at around 5%.
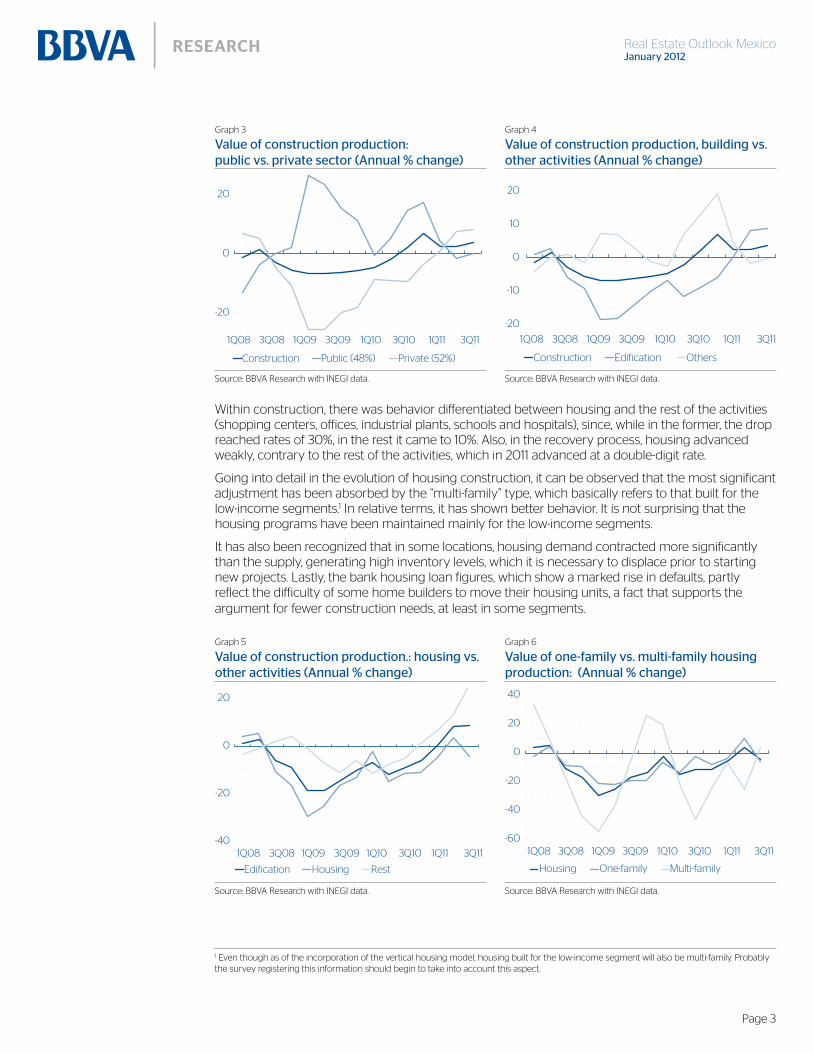
The National Survey of Construction Companies, which serves for estimating construction GDP, shows the evolution of the industry in the different types of activities. For example, the most aggregate level, construction that contributes close to 50% of the production value, was what for the greatest part explained the contraction of the industry, since other activities, such as transportation, oil, electricity, water and drainage maintained positive rates most of the time. History is consistent with what is observed when production is classified as the works by the public and private sectors; while in the former, growth has remained almost without interruption since 2008, in the latter, those realized by the private sector , the decline lasted almost three years.
Real Estate Outlook Mexico
Page 3
Graph 3 Graph 4
Construction Public (48%) Private (52%)
-20
0
20
1Q08 3Q08 1Q09 3Q09 1Q10 3Q10 1Q11 3Q11
Construction Edification Others
-20
-10
0
10
20
1Q08 3Q08 1Q09 3Q09 1Q10 3Q10 1Q11 3Q11
Source: BBVA Research with INEGI data. Source: BBVA Research with INEGI data.
Within construction, there was behavior differentiated between housing and the rest of the activities (shopping centers, offices, industrial plants, schools and hospitals), since, while in the former, the drop reached rates of 30%, in the rest it came to 10%. Also, in the recovery process, housing advanced weakly, contrary to the rest of the activities, which in 2011 advanced at a double-digit rate.
Going into detail in the evolution of housing construction, it can be observed that the most significant adjustment has been absorbed by the “multi-family” type, which basically refers to that built for the low-income segments.1 In relative terms, it has shown better behavior. It is not surprising that the housing programs have been maintained mainly for the low-income segments.
It has also been recognized that in some locations, housing demand contracted more significantly than the supply, generating high inventory levels, which it is necessary to displace prior to starting new projects. Lastly, the bank housing loan figures, which show a marked rise in defaults, partly reflect the difficulty of some home builders to move their housing units, a fact that supports the argument for fewer construction needs, at least in some segments.
Graph 5 Graph 6
Edification Housing Rest
-40
-20
0
20
1Q08 3Q08 1Q09 3Q09 1Q10 3Q10 1Q11 3Q11
Housing One-family Multi-family
-60
-40
-20
0
20
40
1Q08 3Q08 1Q09 3Q09 1Q10 3Q10 1Q11 3Q11
Source: BBVA Research with INEGI data. Source: BBVA Research with INEGI data.
1 Even though as of the incorporation of the vertical housing model, housing built for the low-income segment will also be multi-family. Probably the survey registering this information should begin to take into account this aspect.

Real Estate Outlook Mexico
Page 4
The complementary indicators of the industry, such as employment and materials, confirm the behavior of construction relative to the rest of the economy. In the case of employment, for example, the growth rate in construction has been comparatively higher than that of total workers in the formal private sector since the second quarter of 2010. Unlike GDP, employment in construction has already reached levels prior to the 2009 crisis.
A story similar to that of employment growth can be told of manufacturing inputs for construction (cement, concrete, brick, lime, plaster) of which the trend is similar ( although with a certain lag) to that of the rest of industrial activities.
Graph 7 Graph 8
National Construction
-15
-10
-5
0
5
10
1Q08 3Q08 1Q09 3Q09 1Q10 3Q10 1Q11 3Q11-15
-10
-5
0
5
10
1Q08 3Q08 1Q09 3Q09 1Q10 3Q10 1Q11 3Q11
Industrial production Building supplies
*With figures through OctoberSource: BBVA Research with INEGI data.
*It includes brick, cement, concrete, plaster and lime. Deflated with respective price indexes of construction.Source: BBVA Research with INEGI data.
In the balance of private sector credit, construction has been gaining share in recent years: from 4% in 2006 to 12% in 2011. However, there is a marked difference between the evolution of housing loans and that of other productive activities. In the 2008-2011 period, the former has shown a predominantly negative trend, while the latter has maintained a higher growth rate than a real 10% consistently throughout this period.
Graph9 Graph 10
Construction Housing Others
-40
0
40
80
Jan
-08
May
-08
Sep
-08
Jan
-09
May
-09
Sep
-09
Jan
-10
May
-10
Sep
-10
Jan
-11
May
-11
Sep
-11
0
4
8
12
Jan
-08
May
-08
Sep
-08
Jan
-09
May
-09
Sep
-09
Jan
-10
May
-10
Sep
-10
Jan
-11
May
-11
Sep
-11
Construction Housing Others
Source: BBVA Research with Banco de Mexico data Source: BBVA Research with Banco de Mexico data.

Real Estate Outlook Mexico
Page 5
To explain the evolution of the loan portfolio for housing construction, it is necessary to consider the next level in detail, which is to distinguish the intermediary that granted the financing. The weak behavior of loans in 2008 and 2009 is explained by the “sofoles”, being that the banks maintained an accelerated expansion rate during this period. The past-due loan portfolio started to grow also due to the “sofoles”.
The contraction of credit by the banks began in 2010 and accelerated in 2011. This responded to conditions pertaining to demand. Housing acquisition contracted more than 30% in 2009, and started to recover slowly toward the second half of 2010. To this should be added that construction continued to advance, despite the fact that since 2008 (when mortgage activity was still showing a strong expansion) signs began to appear of an excess supply in some areas (see Mexico Real Estate Outlook, September 2008).
The combination of lower demand and abundant supply translated into that a large number of builders who had on-going projects simply were not able to find a buyer for their housing and, therefore, they stopped paying on the loans that they obtained to construct them. This happened mainly with small and medium companies, but also with the large ones, even some that trade on the stock market. So the problem was not lesser and the effects are perceived in a persistent contraction of credit and high default indexes. Perhaps the lesson is that those participating in the housing market, both in the construction side and the financing, must follow the conditions of the economic environment closer and that of demand, so as to be able to respond opportunely to the changes in the trends.
Now, 2012 could be a year that marks a change in the trend of less credit for housing construction. This, after taking into account that the federal government subsidy program for housing acquisition among the low-income population will increase its budget from P$5.3 billion to P$8 billion, which implies an increase in real terms in the order of 45%. Also, of the amount to be distributed in the year, 70% will be used in the first half of the year. In practice, this simply means that, in this period, close to the same number will be individualized than throughout the entire 2011. And, for this, there should be finished houses ready to be sold.
Graph 11 Graph 12
-80
-40
0
40
Jan
-08
May
-08
Sep
-08
Jan
-09
May
-09
Sep
-09
Jan
-10
May
-10
Sep
-10
Jan
-11
May
-11
Sep
-11
Total Commercial Banking Sofoles
0
10
20
30
Jan
-08
May
-08
Sep
-08
Jan
-09
May
-09
Sep
-09
Jan
-10
May
-10
Sep
-10
Jan
-11
May
-11
Sep
-11
Total Commercial Banking Sofoles
Source: BBVA Research with Banco de Mexico data Source: BBVA Research with Banco de Mexico data

Real Estate Outlook Mexico
Page 6
Trends in the construction industry in 2011 should be maintained this year. The electoral process will boost the activity in an important way, not only in public works but also in housing, where the budget for the subsidy program will grow from P$5.3 billion to P$8 billion. Also, 70% of the annual total will be distributed in the first half of the year. In practice, this means that, in the January-June period, the same number of loans will be placed as throughout all of 2011. In turn, this means that there should be enough housing ready to be individualized. It should be emphasized that housing was the activity with the greatest lag in the industry production and its share in the total value of production in the industry is in the order of 25%.
For the rest of the activities, the key will be domestic demand or its capacity to remain in expansion in a complicated global environment, although, this time, it could not have such a marked impact on the U.S. economy, which is the most relevant for Mexico. We expect that in a growth environment of the national GDP in real terms of 3.3%, the construction industry will grow at 3.8%, although with a slight bias downward. At the component level, our estimates point to growth of 3.1% for civil works, 4.1% for construction, and 5.9% for specialized works, all in real terms. As in any cycle, once the maximum has been reached, it is reasonable to expect a decrease, probably in the second half of the year.
Our scenario is not exempt from risks, where the clearest would be due to a strong global slowdown and a new financial crisis, like the one seen in 2009. However, our expectation is that the factors of domestic order will offset, at least partially, turbulence from abroad.
Chart 1 Graph 13
-20
-10
0
10
1Q08 3Q08 1Q09 3Q09 1Q10 3Q10 1Q11 3Q11 1Q12 3Q12
Construction Edification Civil Works Specialized
Source: BBVA Research with INEGI data. Source: BBVA Research with INEGI data.
Period Total BuildingCivil
WorksSpecialized
works
Real Estate Outlook Mexico
Page 7
2.b. Credit and mortgage financing for housing
Hand in hand with the growth of economic activity and employment, in 2011 mortgage lending activity continued to expand. Nevertheless, the trend showed no surprises with respect to what had been anticipated, with gradual growth, which became generalized over the course of the year, both in terms of the housing agencies as well as the different housing segments. In this section of Mexico Real Estate Outlook we will provide a detailed look at the evolution of these results, which confirm that in an environment of economic growth, the housing market has room for further expansion. With a view toward 2012, the challenges in BBVA Research’s base scenario will be more associated with supply, which should speed up efforts to keep pace with demand and offer the market a product greatly valued by consumers.
After two years of relative stagnation, mortgage activity in 2011 showed clear signs of recovery, which goes hand in hand with the environment of gradual improvement in economic activity, employment, and consumer confidence.
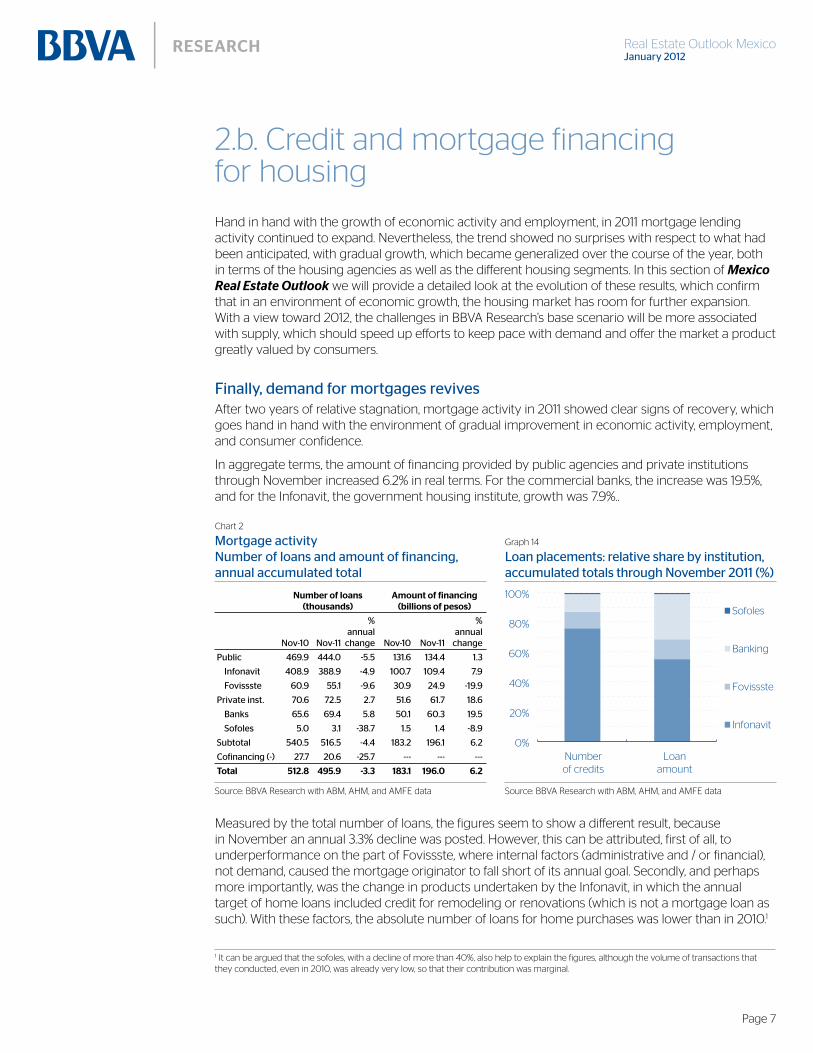
In aggregate terms, the amount of financing provided by public agencies and private institutions through November increased 6.2% in real terms. For the commercial banks, the increase was 19.5%, and for the Infonavit, the government housing institute, growth was 7.9%..
Measured by the total number of loans, the figures seem to show a different result, because in November an annual 3.3% decline was posted. However, this can be attributed, first of all, to underperformance on the part of Fovissste, where internal factors (administrative and / or financial), not demand, caused the mortgage originator to fall short of its annual goal. Secondly, and perhaps more importantly, was the change in products undertaken by the Infonavit, in which the annual target of home loans included credit for remodeling or renovations (which is not a mortgage loan as such). With these factors, the absolute number of loans for home purchases was lower than in 2010.1
1 It can be argued that the sofoles, with a decline of more than 40%, also help to explain the figures, although the volume of transactions that they conducted, even in 2010, was already very low, so that their contribution was marginal.
Chart 2
Graph 14
0%
20%
40%
60%
80%
100%
Numberof credits
Loanamount
Sofoles
Banking
Fovissste
Infonavit
Source: BBVA Research with ABM, AHM, and AMFE data Source: BBVA Research with ABM, AHM, and AMFE data
Number of loans (thousands)
Amount of financing (billions of pesos)
Total 512.8 495.9 -3.3 183.1 196.0 6.2

Real Estate Outlook Mexico
Page 8
In entering into details on mortgage activity in 2011 by type of institution or agency, public and private, an interesting panorama emerges on demand for housing among the different sectors of the population.
Thus, for example, in loans for lower-income workers (those earning up to two times the minimum wage), which depend more on the housing agency or institute than on the workers themselves (availability of subsidies, speed of administrative aspects of loan approval, procedures for authorization of housing construction, etc. ), the progress registered by the program in the January-November period was as scheduled.
For the next income levels (from four times and up to 11 times the minimum wage), in which some loans are granted under co-financing policies, progress was greater, toward levels of 86%. In turn, for credits for workers with incomes more than 11 times the minimum wage, and that are granted only under a co-financing program, progress to date was 117%. What is important in the case of the latter is that, like loans granted exclusively by banks, they accurately reflect the dynamics of demand, since they do not receive any type of support from the Infonavit.
Then there is credit for home remodeling. This product was launched in 2011, without major expectations, but it was a tremendous success. The 27,000 loans that had been programmed (for amounts of up to 40,000 pesos) were placed nearly three months before the end of the year and by the beginning of December, the goal was already exceeded by 70%. The product was so well received that for 2012 the goal was set at 60,000 credits.
In a regional breakdown of such figures, it can be seen that more than half the states had reached or even exceeded the loan placement target in advance.
The balance sheet that should be drawn is that there are no signs that demand is on its way to being exhausted, and instead, what is confirmed, is that housing needs are not strictly limited to traditional mortgage loans. As we have been insisting in previous editions of Mexico Real Estate Outlook, there are segments that are unattended, which could be developed in the coming years.
The number of mortgage loans granted by the commercial banks increased by 5.8%, but the amount involved in such financing grew by about 20% in real terms. However, the activity that banks can undertake in relation to co-financing is limited by the policies established by Infonavit in terms of the number of credits granted in the year and the conditions for accessing such loans. For Infonavit, co-financing has been declining in importance since 2008,2 so the increase in bank credit corresponds
2 Excluding the product known as Infonavit Total, which has characteristics that are different from the rest of the co-financing programs. It is a loan to workers with lower-middle income levels (in the order of four to six times the minimum wage), which is provided by Infonavit, which then transfers the portfolio to a private intermediary.
Chart 3 Graph 15
0
10
20
30
40
50
60
70
Mex Ja
lP
ue
Gto
Ch
ihQ
roT
amp
sV
erO
axM
ich
Mo
rG
roY
uc
SLP
Co
ahB
CS
Cam Dg
oT
lax
Zac
Tab
Nay Sin
Co
lC
his
Ag
sN
LH
go
DF
QR
BC
Son
Annual Goal Spent (December 4)
*Minimum wage**Credit for remodelingSource: BBVA Research with Infonavit data
Note: the figures are listed based on the fulfillment of the goal for loan placementsSource: BBVA Research with Infonavit data
Salary range (MW*)Annual
goalProgress
(at Dec. 4)
Progress vs. goal
(%)
Total 477 440 92

Real Estate Outlook Mexico
Page 9
Graph 16 Graph 17
Co-financing
0
40
80
120
2Q08 4Q08 2Q09 4Q09 2Q10 4Q10 2Q11 4Q11*
Open market
0
40
80
120
2Q08 4Q08 2Q09 4Q09 2Q10 4Q10 2Q11 4Q11*
Co-financing Open market
Note: excluding Infonavit Total*Figures through NovemberSource: BBVA Research with ABM data
Note: excluding Infonavit Total*Figures through NovemberSource: BBVA Research with ABM data
to loans that they grant exclusively. In the final analysis, this translates into greater attention to middle and high-income segments, with a large number of credits but especially with higher loan amounts. Between 2010 and 2011, for loans granted exclusively (also known as “open market” loans) the average amount per credit (mortgage) increased 13.2% in real terms.
The trends detailed in mortgage lending by commercial banks show that credit has room to grow significantly, based on the appropriate product design and customer segmentation.
It should be mentioned that, all in all, and with the recovery in Infonavit and bank mortgage loan activity in 2011, both the number of loans and the amount of financing provided by the system as a whole are still below the levels reached in 2008.
Graph 18 Graph 19
400
500
600
700
4Q082Q094Q09 2Q10 4Q10 2Q11 4Q11*
BanksandSofoles
Publicinstitutes
0
100
200
300
4Q082Q094Q09 2Q10 4Q10 2Q11 4Q11*
BanksandSofoles
Publicinstitutes
*Based on figures through NovemberSource: BBVA Research with ABM, AHM, and AMFE data
*Based on figures through NovemberSource: BBVA Research with ABM, AHM, and AMFE data
The figures for loan placements by segment are consistent with those registered for agencies and institutions. The growth occurred mainly in the middle and high income segments, with annual rates of close to 7% for mid-range housing (with prices up 1.3 million pesos), and up to 24% in the highest income bracket, known as “Residential Plus” (housing priced at more than 2.6 million pesos).

Real Estate Outlook Mexico
Page 10
Chart 4 Graph 20
200
400
300
600
500
700
4Q082Q094Q09 2Q10 4Q10 2Q11 4Q11*
Residentialplus
Middle
Socialinterest
Source: BBVA Research with AHM data Note: the “entry level” or social benefit” segment includes low-cost, mass, and traditional housing* Figures through NovemberSource: BBVA Research with AHM data
During 2011, mortgage loans granted for used homes as a percentage of the total number of such credits remained relatively stable compared to the levels posted in 2010, at around 27%. The highest percentage corresponds to the higher-income segments (40% on average in the high-end or residential segment), which reveals some interesting trends in both construction and the secondary housing market in the country.
On the one hand, with the 2009 crisis, smaller-scale home builders, better positioned to serve the middle and high-income segments were the most affected (due to less access to financing and a greater contraction of their market), while for the large home builders, their strategy was to become better positioned in the lower income segment (more stable and less risky due to its large size and government support). On the other hand, surveys on residential satisfaction conducted by the Conavi and the Infonavit show a greater preference for used homes over new housing, especially in relation to aspects such as location and space. It turns out that larger and better located homes correspond to the mid and high-range segments. Finally, a gradual increase in the acquisition of used homes should also come as no surprise after observing the sharp growth in housing construction in recent years.
Graph 21 Graph 22
15
20
25
30
2007 2008 2009 1Q10 2Q10 3Q10 4Q10 1Q11 2Q1110
20
30
40
50
2008 2009 2010 2011
Socialinterest
Middleincome
Residential
Total
Source: BBVA Research with Infonavit and Fovissste data Note: the “entry level” or “social benefit” segment includes low-cost, mass, and traditional housingSource: BBVA Research with Infonavit and Fovissste data
Thousands of credits %
changeNov-10 Nov-11
Total 512.9 496.3 -3.2

Real Estate Outlook Mexico
Page 11
Contrary to what occurred on the demand side, housing construction indicators showed clear signs of a contraction. According to the National Housing Registry (RUR for Registro Único de Vivienda), based on housing construction starts, through the fourth quarter of 2011, the rate of new housing construction was about 450,000 per year, 10% lower than in 2010, and about 30% below the peak levels registered in 2008. The most recent data for the registration of new housing to be constructed in the next 24 months, show an even lower figure of 430,000 homes.
Graph 23 Graph 24
400
500
550
450
600
650
1Q09 3Q09 1Q10 3Q10 1Q11 3Q11
253
24
142
9
0
200
100
300
500
400
Underconstruction Finished Habitable
Norecord
Total: 429
*Based on the records of the past 12 monthsSource: BBVA Research with AHM data
Note: the “entry level” or “social benefit” segment includes low-cost, mass, and traditional housingSource: BBVA Research with Infonavit
Based on a loan placement rate in the range of 600,000 to 620,000 per year and considering the percentage share represented by used homes, National Housing Registry figures show that in the best of cases, housing construction will barely cover new housing needs in 2012. And this is assuming that all the homes will be finished and habitable in the next 12 months.
But this is on an accumulated level, because, when analyzing the figures on a regional level, even more significant differences emerge. There is a total of eight states in the country where the current pace of housing construction is not sufficient to cover new housing needs for the next 12 months. In some cases, such as Baja California Sur, this could be due to excess inventory, while in others, it suggests that, if loan placements are maintained at the rate registered in 2011, construction should be stepped up or the number of credits for used housing increased. Only in two states, Colima and San Luis Potosi, is there an ample supply of housing currently under construction in relation to the needs of the market.
Graph 25 Graph 26
0
20
40
60
BC
SD
FZ
acSo
nC
am Mo
rC
oah
Méx Ver
Nay
Mic
hQ
roT
abT
am BC
Gto
Pu
eJa
lG
ro QR
Dg
oY
uc
Oax
Hg
oN
LC
hih
Tla
xC
his
Ag
sSi
nSL
PC
ol
Housing construction (for the next 24 months)
New housing required (for the next 12 months)
50
75
100
125
150
BC
SD
FZ
acSo
nC
am Mo
rC
oah
Méx Ver
Nay
Mic
hQ
roT
abT
am BC
Gto
Nac
tiona
lP
ue
Jal
Gro QR
Dg
oY
uc
Oax
Hg
oN
LC
hih
Tla
xC
his
Ag
sSi
nSL
PC
ol
161 180
100 % coverge
Insufficient to meet housing needsfor the next 12 months
Housing construction requirementscovering at least the next 12 months
*Public housing agencies. Based on loans granted for new housing in the next 12 monthsSource: BBVA Research with National Housing Registry, Infonavit, and Fovissste data
Note: Levels above (below) 100 indicate that housing construction for the next 24 months will cover (not cover) new housing needs for at least the next 12 monthsSource: BBVA Research with Infonavit data

Real Estate Outlook Mexico
Page 12
There are several reasons that help explain the lag in supply. Part of the problem can be attributed to a conservative attitude on the part of homebuilders given the existence of inventory that has yet to be moved in some places. The recovery of activity following the 2009 crisis has not been uniform throughout the country (see Box 1: Overview of Mortgage Loans on a State Level). Thus, for example, in cities with a strong presence of foreign tourists and those along the U.S. border region, the highest priced housing segment experienced a greater decline than in the rest of the country, and its recovery has been slower.
A second factor was the change in the construction model, in the case of housing subject to federal subsidies, from horizontal to vertical. Given that the change in policy occurred in 2011, some homes that were already under construction or had been completed, faced difficulties in being marketed.
Both factors, accumulated inventories in some places and changes in the construction model, could have created financial difficulties for more than one homebuilder, which, in turn, would have forced financial intermediaries to be more cautious in granting loans. This would certainly reinforce the downward trend in construction.
The indicators of the evolution of the commercial banks’ mortgage loan portfolio show that the growth in the granting of credit has not been indiscriminate, but rather, based on criteria that mitigate the risk of default. Thus, for example, the percentage of a borrower’s income earmarked for paying the mortgage remains at levels below 20%. This is especially the case in segments where the portfolio is concentrated, with borrowers with incomes of at least ten times the minimum wage.
Graph 27 Graph 28
16.8
17.2
17.6
18.0
11.2
11.4
11.6
11.8
12.0
Oct
-09
Dec
-09
Feb
-10
Ap
r-10
Jun
-10
Au
g-10
Oct
-10
Dec
-10
Feb
-11
Ap
r-11
Jun
-11
Au
g-11
Oct
-11
Rate (left) Term (right)
0
5
10
15
20
25
30
35
Oct
-09
Dec
-09
Feb
-10
Ap
r-10
Jun
-10
Au
g-10
Oct
-10
Dec
-10
Feb
-11
Ap
r-11
Jun
-11
Au
g-11
Oct
-11
Note: Includes Banamex, BBVA Bancomer, Banorte, HSBC, Santander, and ScotiabankSource: BBVA Research with CNBV data
Note: Includes Banamex, BBVA Bancomer, Banorte, HSBC, Santander, and ScotiabankSource: BBVA Research with CNBV data
Real Estate Outlook Mexico
Page 13
Graph 29 Graph 30
60
64
68
72
Oct
-09
Dec
-09
Feb
-10
Ap
r-10
Jun
-10
Au
g-10
Oct
-10
Dec
-10
Feb
-11
Ap
r-11
Jun
-11
Au
g-11
Oct
-11
0
4
8
12
16
200
3
200
4
200
5
200
6
200
7
200
8
200
9
2010
2011
*
Infonavit Banks Sofoles
Note: Includes Banamex, BBVA Bancomer, Banorte, HSBC, Santander, and ScotiabankSource: BBVA Research with CNBV data
*Through NovemberSource: BBVA Research with Infonavit and Banco de México data
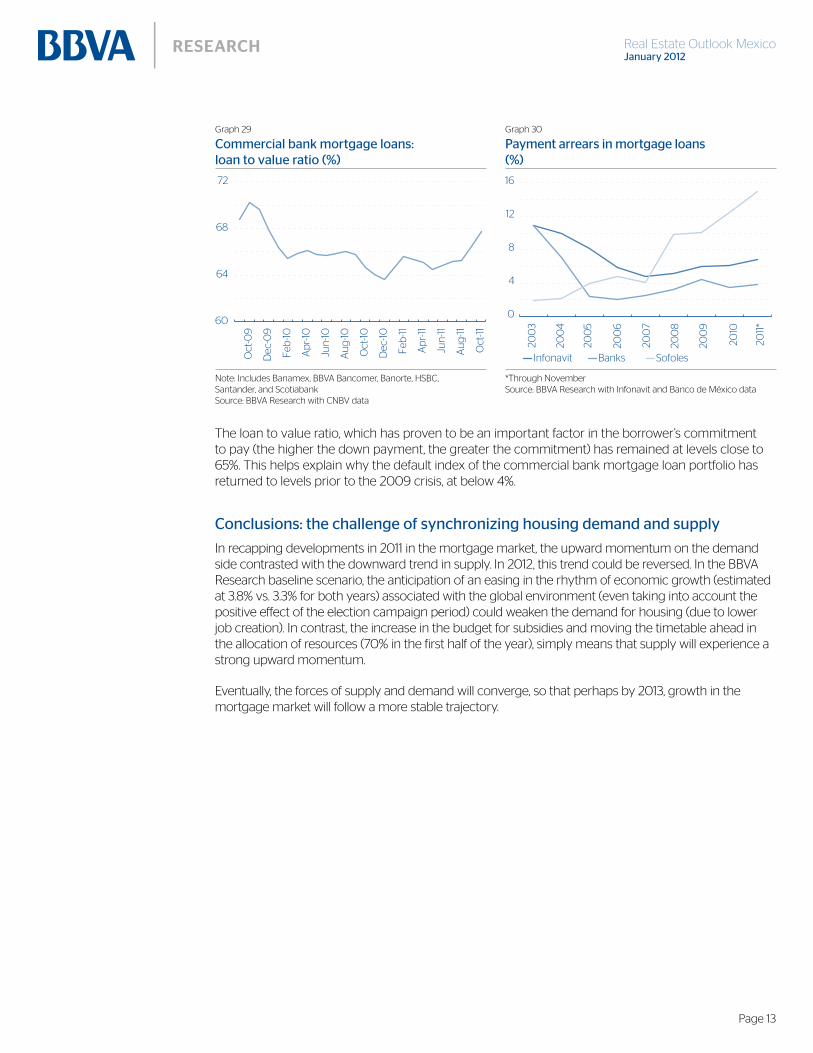
The loan to value ratio, which has proven to be an important factor in the borrower’s commitment to pay (the higher the down payment, the greater the commitment) has remained at levels close to 65%. This helps explain why the default index of the commercial bank mortgage loan portfolio has returned to levels prior to the 2009 crisis, at below 4%.
In recapping developments in 2011 in the mortgage market, the upward momentum on the demand side contrasted with the downward trend in supply. In 2012, this trend could be reversed. In the BBVA Research baseline scenario, the anticipation of an easing in the rhythm of economic growth (estimated at 3.8% vs. 3.3% for both years) associated with the global environment (even taking into account the positive effect of the election campaign period) could weaken the demand for housing (due to lower job creation). In contrast, the increase in the budget for subsidies and moving the timetable ahead in the allocation of resources (70% in the first half of the year), simply means that supply will experience a strong upward momentum.
Eventually, the forces of supply and demand will converge, so that perhaps by 2013, growth in the mortgage market will follow a more stable trajectory.
Real Estate Outlook Mexico
Page 14
Inset 1: Overview of mortgage loans on a state level
In the context of the recovery in mortgage loans, it is worthwhile to ask if they have already reached the levels that were posted in 2008, when record highs were registered. The answer depends on the housing segment in question, the region of the country, and even the financing product under consideration.
To begin, it should be noted that most credit activity is undertaken by public housing institutions (over 90% of the loans involved), and they have not substantially increased their placement goals in recent years. As we have seen, what is lacking is not loan applications, but rather making the response and policies of public housing institutions more flexible, to meet demand.
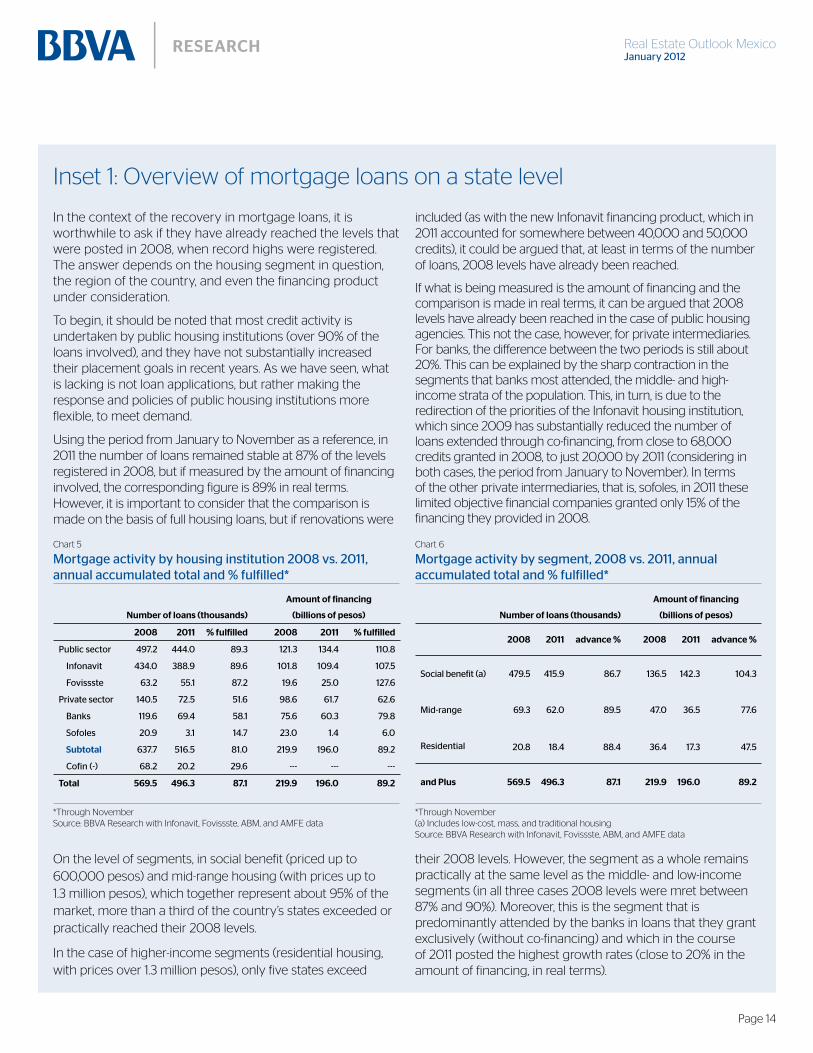
Using the period from January to November as a reference, in 2011 the number of loans remained stable at 87% of the levels registered in 2008, but if measured by the amount of financing involved, the corresponding figure is 89% in real terms. However, it is important to consider that the comparison is made on the basis of full housing loans, but if renovations were
included (as with the new Infonavit financing product, which in 2011 accounted for somewhere between 40,000 and 50,000 credits), it could be argued that, at least in terms of the number of loans, 2008 levels have already been reached.
If what is being measured is the amount of financing and the comparison is made in real terms, it can be argued that 2008 levels have already been reached in the case of public housing agencies. This not the case, however, for private intermediaries. For banks, the difference between the two periods is still about 20%. This can be explained by the sharp contraction in the segments that banks most attended, the middle- and high-income strata of the population. This, in turn, is due to the redirection of the priorities of the Infonavit housing institution, which since 2009 has substantially reduced the number of loans extended through co-financing, from close to 68,000 credits granted in 2008, to just 20,000 by 2011 (considering in both cases, the period from January to November). In terms of the other private intermediaries, that is, sofoles, in 2011 these limited objective financial companies granted only 15% of the financing they provided in 2008.
On the level of segments, in social benefit (priced up to 600,000 pesos) and mid-range housing (with prices up to 1.3 million pesos), which together represent about 95% of the market, more than a third of the country’s states exceeded or practically reached their 2008 levels.
In the case of higher-income segments (residential housing, with prices over 1.3 million pesos), only five states exceed
their 2008 levels. However, the segment as a whole remains practically at the same level as the middle- and low-income segments (in all three cases 2008 levels were mret between 87% and 90%). Moreover, this is the segment that is predominantly attended by the banks in loans that they grant exclusively (without co-financing) and which in the course of 2011 posted the highest growth rates (close to 20% in the amount of financing, in real terms).
Chart 5
*Through NovemberSource: BBVA Research with Infonavit, Fovissste, ABM, and AMFE data
Chart 6
*Through November(a) Includes low-cost, mass, and traditional housingSource: BBVA Research with Infonavit, Fovissste, ABM, and AMFE data
Number of loans (thousands)
Amount of financing
(billions of pesos)
2008 2011 % fulfilled 2008 2011 % fulfilled
Subtotal
Total 569.5 496.3 87.1 219.9 196.0 89.2
Number of loans (thousands)
Amount of financing
(billions of pesos)
2008 2011 advance % 2008 2011 advance %
and Plus 569.5 496.3 87.1 219.9 196.0 89.2

Real Estate Outlook Mexico
Page 15
Graph 31
0 100
OaxTamps
ChihDgo
CoahCol
NayGroYucVerSinNL
MexSon
NationalBC
TlaxMichPueSLPHgoZacGto
ChisAgs
JalMorTabDF
BCSQro
CamQR
BBVA Research with AHM data
Graph 32
0 100
OaxTamps
ChihZacGroNLBC
MexSin
ChisQR
NayDF
NationalCol
SonCoah
JalSLP
MichPueVerYucTlaxAgsGtoTabDgoQroMorHgoCamBCS
195
BBVA Research with AHM data
On a state level, the evolution of credit does not follow the same pattern in all housing segments. That is, a state that already exceeded 2008 levels in the social benefit housing segment, will not necessarily have done so in mid-range or residential housing. And it is logical that this is the case, since the factors that drive credit in each segment are different. In low-income segments, supply factors dominate the picture, such as the housing agencies’ placement goals (which may vary significantly from year to year for the same state), or the availability of already constructed housing units. In contrast, for the mid-range and residential segments, the key elements have more to do with demand, such as employment and consumer confidence. Yet there are some states in which the recovery has been consistent, namely, Campeche, Mexico City, Hidalgo, Michoacán, Morelos, Querétaro, Tabasco, and Zacatecas, which in the three housing segments, post higher numbers than in 2008 or at least performed better than the national average.
Mortgage loans have still not recovered their 2008 levels, either in terms of the number of credits or the amount of financing. However, this can, to a large extent, be explained because volume is generated based on the activity undertaken by public housing agencies and their placement goals have remained largely unchanged since then (and even, in the case of Infonavit, to fewer resources being allocated to loans for complete housing). This dynamic has been generated mainly among private intermediaries, with a drastic contraction in the case of sofoles (to the point of almost disappearing) and an equally important growth in bank loan activity. The latter is driven largely by exclusively granted credits and the fact that such loans are targeted to middle- and high-income segments. By 2012, the impact of the global economic environment became the key factor in the recovery of mortgage activity.

Real Estate Outlook Mexico
Page 16
Graph 33
0 100
OaxTamps
ChihDgo
CoahGroCol
NayYucVer
MexTlaxSin
SonNational
BCMich
NLHgoSLPPueZacGto
ChisAgsMor
JalTab
CamQroDF
BCSQR
Social interest Middle Residential and residential plus
0 100
NayOax
TampsNL
BCSChih
CoahSin
PueJalBCColQR
NationalChisSonMexVerSLPGtoYucGroAgs
MichZacMor
DFDgoQroTabTlax
CamHgo
0 100
TlaxSon
ChihOaxDgoQR
TampsGtoNayChis
JalNL
AgsGroSLP
NationalQroMorColYucPueSin
MexCoah
TabDF
BCSMich
BCHgoZacVer
Cam
BBVA Research with AHM data

Real Estate Outlook Mexico
Page 17
1 The analysts of Actinver, Banorte, BBVA Bancomer, Credit Suisse, Deutsche Bank, GBM, JP Morgan, Morgan Stanley and Scotia Capital participated in this study. 2 Figures to December 6.
For the housing construction companies in the stock market, 2011 was a difficult year, being that while sales volumes and revenues grew, in some cases at double-digit rates, the price of their shares contracted by more than 50%. In addition, this behavior strongly contrasts with the price index and the stock market quotations which, even though with ample volatility, remained at the closing at levels similar to those seen the previous year. In this article of Mexico Real Estate Outlook, we seek answers to this divergent behavior, consulting the stock market analysts who follow the sector.
The results of the study1 clearly reflect the priorities of investors, who simply and plainly seek profitability in a changing environment which demands continuous valuation of their expectations. There are periods, as the current one could be, where companies’ decisions privilege medium-term investment decisions to the generation of yields or cash flows in the short term. This, which has been the position in some cases, has been taken into account by analysts; the same as the strategies that housing developers have adopted in what is perceived as a new housing model in the coming years.
Although it is recognized that the punishment of share prices is generalized and does not necessarily incorporate (although it could and should) the differentiation in the business models, it is also true that the weakness in the yields is not a new story, but has instead been a constant in recent years. Nevertheless, it is recognized that the housing market will continue to show important dynamism going forward and publicly traded companies are well-positioned for capitalizing on the opportunities that will be generated.
The value of the shares of housing construction companies contracted by close to 50% during 2011. The Hábita Index, which concentrates the sector companies, went from a value of 595 points at the end of 2010 to 256 points in December 2011,2 that is, a contraction of 57%. In the same period, the Mexican Stock Exchange Index fell from 38,550 to 37,071 points, also a drop, although much more modest (3.8%).
However, by expanding the comparison horizon a little, it can be seen that the Habitá Index has maintained a negative trend as of the second half of 2008; its value at the end of 2011 came to barely 30%. compared to the highest level it reached in that year.
2.c. What do analysts think of housing construction companies?
Graph 34 Graph 35
0
200
400
600
800
1000
0
10000
20000
30000
40000
50000
Mar
-08
Jul-0
8
No
v-0
8
Mar
-09
Jul-0
9
No
v-0
9
Mar
-10
Jul-1
0
No
v-10
Mar
-11
Jul-1
1
No
v-11
IPC Hábita (right) Geo Urbi Homex Ara (left) Sare (right)
0
4
8
12
16
20
0
30
60
90
120
150
Mar
-08
Jul-0
8
No
v-0
8
Mar
-09
Jul-0
9
No
v-0
9
Mar
-10
Jul-1
0
No
v-10
Mar
-11
Jul-1
1
No
v-11
Source: BBVA Research with Bloomberg data Source: BBVA Research with Bloomberg data.
Real Estate Outlook Mexico
Page 18
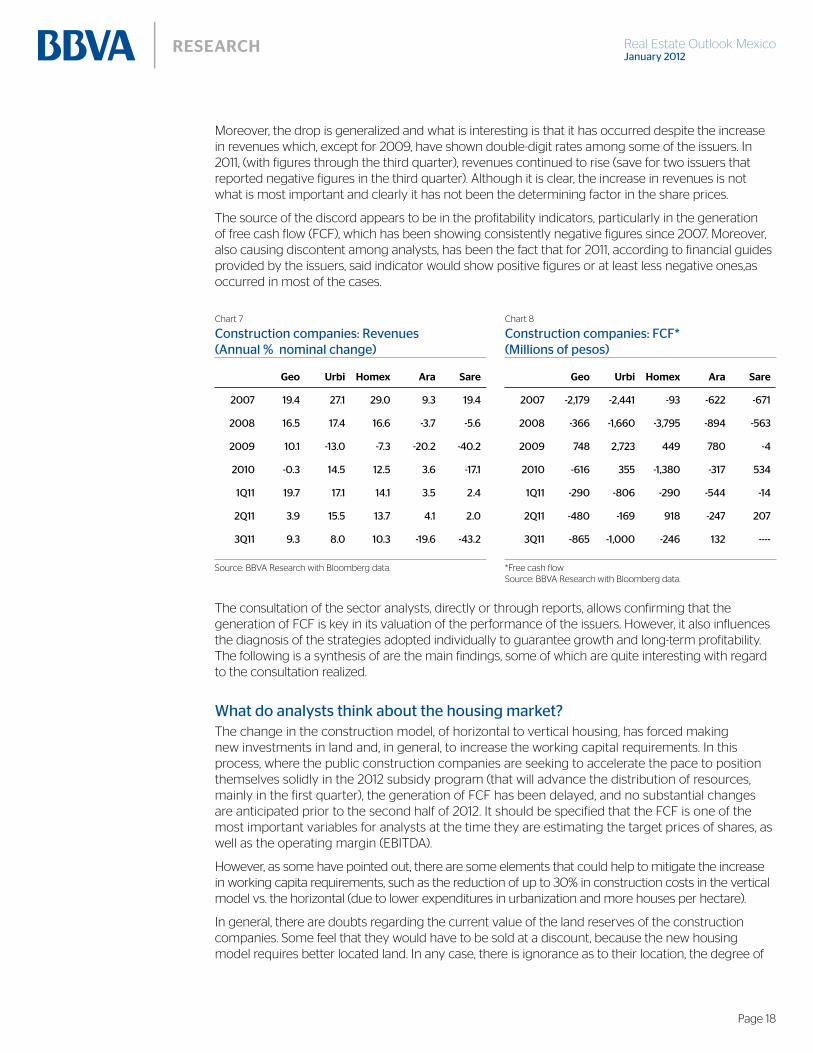
Moreover, the drop is generalized and what is interesting is that it has occurred despite the increase in revenues which, except for 2009, have shown double-digit rates among some of the issuers. In 2011, (with figures through the third quarter), revenues continued to rise (save for two issuers that reported negative figures in the third quarter). Although it is clear, the increase in revenues is not what is most important and clearly it has not been the determining factor in the share prices.
The source of the discord appears to be in the profitability indicators, particularly in the generation of free cash flow (FCF), which has been showing consistently negative figures since 2007. Moreover, also causing discontent among analysts, has been the fact that for 2011, according to financial guides provided by the issuers, said indicator would show positive figures or at least less negative ones,as occurred in most of the cases.
The consultation of the sector analysts, directly or through reports, allows confirming that the generation of FCF is key in its valuation of the performance of the issuers. However, it also influences the diagnosis of the strategies adopted individually to guarantee growth and long-term profitability. The following is a synthesis of are the main findings, some of which are quite interesting with regard to the consultation realized.
The change in the construction model, of horizontal to vertical housing, has forced making new investments in land and, in general, to increase the working capital requirements. In this process, where the public construction companies are seeking to accelerate the pace to position themselves solidly in the 2012 subsidy program (that will advance the distribution of resources, mainly in the first quarter), the generation of FCF has been delayed, and no substantial changes are anticipated prior to the second half of 2012. It should be specified that the FCF is one of the most important variables for analysts at the time they are estimating the target prices of shares, as well as the operating margin (EBITDA).
However, as some have pointed out, there are some elements that could help to mitigate the increase in working capita requirements, such as the reduction of up to 30% in construction costs in the vertical model vs. the horizontal (due to lower expenditures in urbanization and more houses per hectare).
In general, there are doubts regarding the current value of the land reserves of the construction companies. Some feel that they would have to be sold at a discount, because the new housing model requires better located land. In any case, there is ignorance as to their location, the degree of
Chart 7 Chart 8
Source: BBVA Research with Bloomberg data. *Free cash flowSource: BBVA Research with Bloomberg data.
Geo Urbi Homex Ara Sare Geo Urbi Homex Ara Sare

Real Estate Outlook Mexico
Page 19
urbanization as well as its valuation. Also, the adoption, as of 2012, of more unified standards at an international level in real estate accounting (IFRS) generates uncertainty regarding the manner in which reserves should be valued and accounted.
On the other hand, the analysts consider that the change in model toward vertical housing tends to benefit the publicly traded companies, at least in the short term, being that the smaller ones lack experience and technical capacity in these projects. According to some analysts, by reading this, the companies could moderate the investment rate so as to achieve a greater generation of FCF.
The reforms to the Infonavit Law, the same as with the programs that will be launched for the unaffiliated population in public housing institutions, are perceived as potentially important for boosting the market, to the point of even doubling it, according to some, although there are those who also think that with the reform of the Infonavit Law, the incentive for acquiring a second home will be lost to monetize the balance of the housing sub-account.3 For others, these programs will serve at least to maintain the dynamism of activity. And, the thing is that there are those who maintain the idea that the base of Infonavit-affiliated workerswill be reduced importantly as of 2016.4
Analysts believe that the recent situation, where the financing of housing construction has shown a certain restriction, the publicly traded construction companies are better positioned than their competitors, both due to the capacity to access various financing sources, such as the high share that they have in the loans granted by the public housing institutions. This last fact would also be an important advantage in a scenario of a slowdown in economic activity.
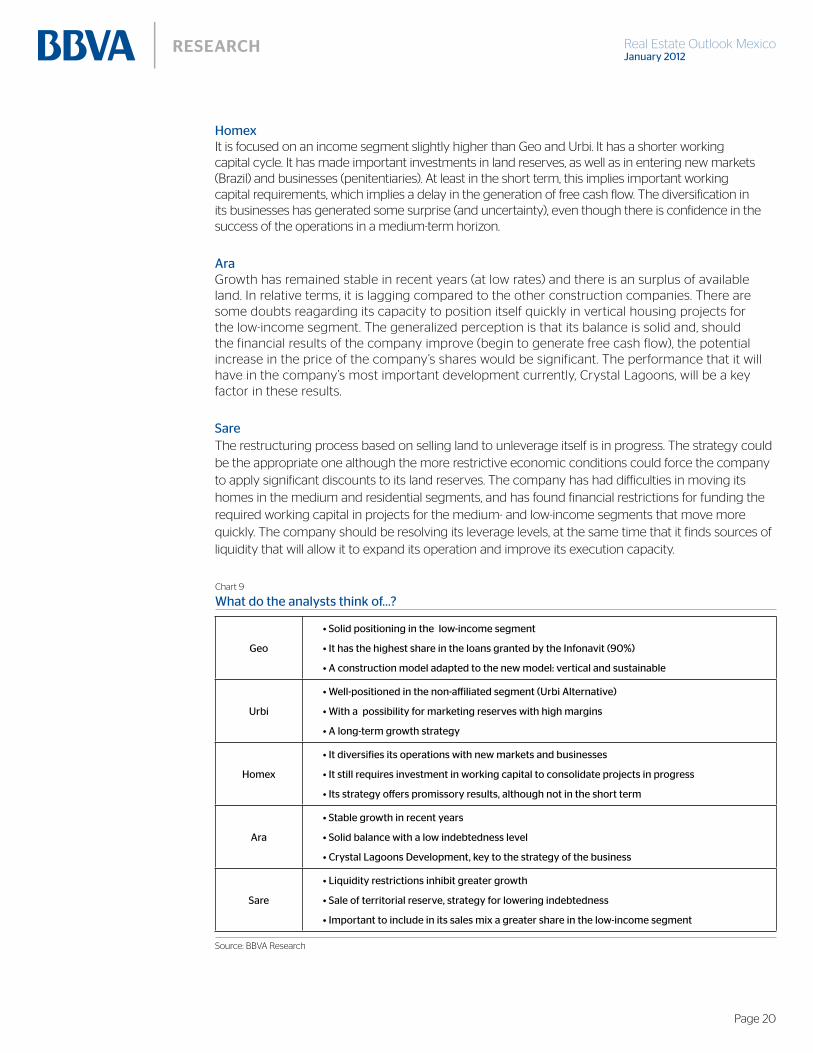
GeoIt is well-positioned in the new housing model with technology that allows for accelerated construction and well-defined commercial strategies. It has the highest share in the Infonavit among the construction companies, and it is positioned in the lowest income segment, which is the highest beneficiary of the subsidy programs. More than half of its sales are concentrated in homes of less than P$300,000, which, due to the advantage of having the subsidies, are those that move more quickly. It has an association with specialized investment funds for the administration of its land reserves, which generates a certain pressure on net income. Some perceive their indebtedness levels (relatively high) as an element to watch, particularly in a scenario of an eventual economic and/or financial restriction.
It is well-positioned to attend the unaffiliated population, given that, for some time, it has developed a commercial strategy for attending this segment (savings and rental programs with an option for purchase). It has ample reserves (the most important in terms of value) that it expects to place with higher margins than those of housing. The company has opted for long-term growth prior to generating free cash flow. It has a solid balance with high EBITDA margins, low leverage and accelerated inventory turnover. It also has generalized optimism as to the success of its strategy in the medium term.
3 In principle, this would seem to have a negative impact on the market, but, in reality, this is not the case. A good part of the uninhabited homes has to do with this “incentive”. With the passing of time, what was confirmed is that in a good number of cases, the second home did not cover a household need and there were not many possibilities for renting or selling it.4 Although this, in reality, was not what the Institute wanted to transmit, but rather that it had to be developing differentiated products to integrally attend its affiliates’ needs. It should also be noted, and it is not a lesser topic, that the estimates were done by using the figures of the 2006 count, being that the 2010 census showed a very different dynamic of population and household formation.
Real Estate Outlook Mexico
Page 20
It is focused on an income segment slightly higher than Geo and Urbi. It has a shorter working capital cycle. It has made important investments in land reserves, as well as in entering new markets (Brazil) and businesses (penitentiaries). At least in the short term, this implies important working capital requirements, which implies a delay in the generation of free cash flow. The diversification in its businesses has generated some surprise (and uncertainty), even though there is confidence in the success of the operations in a medium-term horizon.
Growth has remained stable in recent years (at low rates) and there is an surplus of available land. In relative terms, it is lagging compared to the other construction companies. There are some doubts reagarding its capacity to position itself quickly in vertical housing projects for the low-income segment. The generalized perception is that its balance is solid and, should the financial results of the company improve (begin to generate free cash flow), the potential increase in the price of the company’s shares would be significant. The performance that it will have in the company’s most important development currently, Crystal Lagoons, will be a key factor in these results.
SareThe restructuring process based on selling land to unleverage itself is in progress. The strategy could be the appropriate one although the more restrictive economic conditions could force the company to apply significant discounts to its land reserves. The company has had difficulties in moving its homes in the medium and residential segments, and has found financial restrictions for funding the required working capital in projects for the medium- and low-income segments that move more quickly. The company should be resolving its leverage levels, at the same time that it finds sources of liquidity that will allow it to expand its operation and improve its execution capacity.
Chart 9
Geo
Sare
Source: BBVA Research
Real Estate Outlook Mexico
Page 21
In a year of growth in revenues and sales, the housing construction companies have been strongly hit in the stock market. Investors are clear in that the most tangible result of the solid performance of a company is the generation of cash flow. The decisions that the companies make must have, in time, a mix of sustainability and growth with profitability.
Thus, there is consensus among the analysts in the sense that the punishment to the share prices has to do fundamentally with the absence of FCF, but that in most of the cases, this is a situational condition associated with the increase in investment. In the long term, the sector continues to be structurally strong. As for the current evaluations, analysts coincide in that for the companies with the best balances and/or the most solid positioning going forward, the rallying margin that the prices of their shares would appear quite attractive. It would seem, then, that the question is not whether the shares should rally, but when.
Having said this, and if conditions seem to be favorable for a better financial performance of the construction companies in 2012 (with the program for the unaffiliated, together the advance in the calendar of delivery of resources) everything at the end will depend on the speed in which the companies themselves will advance in the vertical projects and to the degree in which the housing support programs of the federal government materialize successfully.
Real Estate Outlook Mexico
Page 22
3.a. The “unaffiliated” and their relation with the mortgage marketHousing support programs have received a strong boost from the federal government and throughout the last decade, and this is expected to continue throughout the following years. Having designed and consolidated a broad array of solutions for the population affiliated to the public housing institutions, the following step is to attend the unaffiliated. Certaintly they require appropriate programs and instruments, but there is no doubt that although the affiliated population will maintain the greater volume of the operations, an important part of growth will come from new segments, such as remodelings, rental housing, and most outstanding, housing for unafffiliated workers.
In this article of Mexico Real Estate Outlook we analyze the potential size of this market, both in terms of the total volume of workers as well as their income level, and we will also deal with the type of housing that they could be acquiring. The analysis reveals some interesting and promising findings. For example, the fact that unaffiliated is not synonymous with low income, and also, that the cost of housing measured as a proportion of total income is very similar among households, independently of their condition of affiliation or if they have a mortgage loan or not. However, considering the figures in perspective, we contribute by eliminating some myths, such as the idea that all unaffiliates can be attended to by the commercial banks.
The public housing institutions are engaged mainly in attending the population affiliated in the social security institutions and that have the benefit of access to housing credit. Similarly, the financial intermediaries attend, in a greater measure, those workers with a social benefit affiliation, among other factors, due to the greater certainty regarding their labor stability. As a result, the unaffiliated population has faced greater restrictions to enjoy access to the mortgage market, despite also having housing needs. Consequently, the quantification and characterization of this segment of the population is of interest, with the objective of being able to design adequate strategies for its attention.
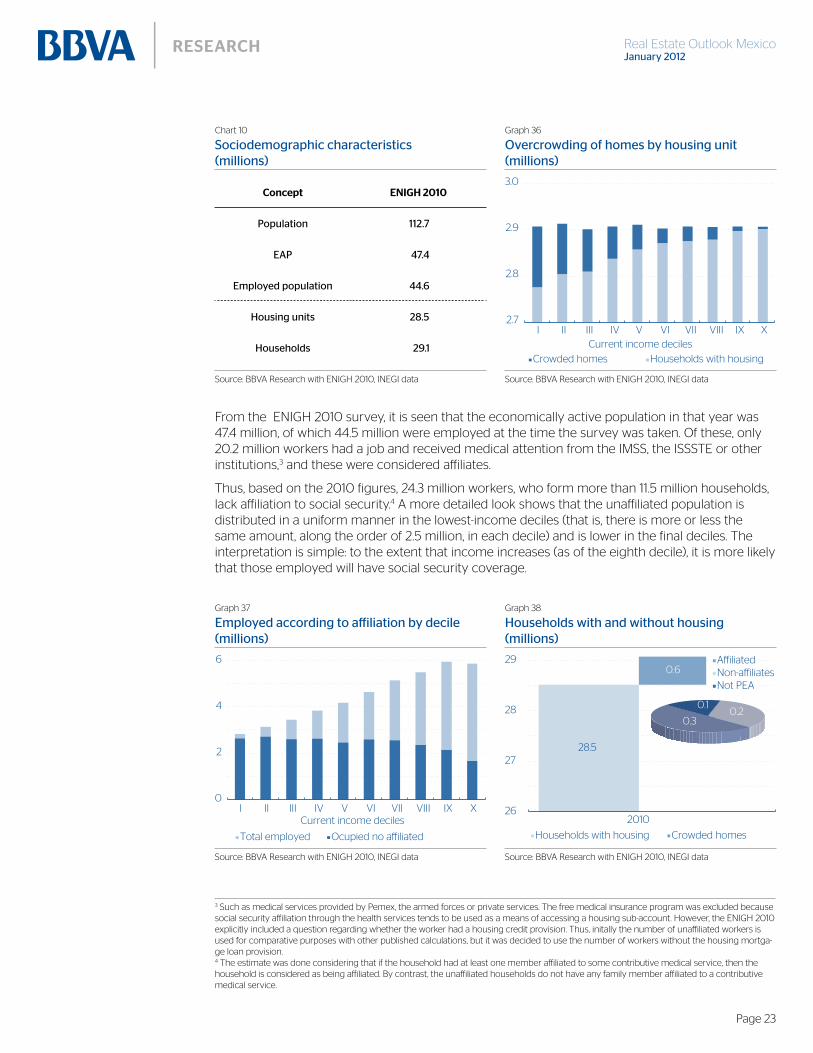
To quantify the housing needs of unaffiliated workers, we used the figures of the 2010 National Survey of Household Income and Expense (hereinafter ENIGH 2010), and which notes that in that year there were 112.6 million inhabitants in the country, with a total of 29 million households, which, in turn, resided in 28.5 million homes. Thus, the first thing that can be said is that in 2010 there were 560 thousand households that had no housing, concentrated in the lowest-income segments1 (nearly 75% of the cases were located in the first four deciles), where the majority corresponds to unaffiliated households (300 thousand, vs. 203 thousand among the affiliated households).2
1 Almost 75% or the cases were located in the first four deciles, with an average income below seven thousand pesos.2 The difference compared to the 560 thousand households is due to the fact that not all are part of the economically-active population.
Real Estate Outlook Mexico
Page 23
Chart 10 Graph 36
Households with housingCrowded homes
2.7
2.8
2.9
3.0
I II III IV V VI VII VIII IX XCurrent income deciles
Source: BBVA Research with ENIGH 2010, INEGI data Source: BBVA Research with ENIGH 2010, INEGI data
From the ENIGH 2010 survey, it is seen that the economically active population in that year was 47.4 million, of which 44.5 million were employed at the time the survey was taken. Of these, only 20.2 million workers had a job and received medical attention from the IMSS, the ISSSTE or other institutions,3 and these were considered affiliates.
Thus, based on the 2010 figures, 24.3 million workers, who form more than 11.5 million households, lack affiliation to social security.4 A more detailed look shows that the unaffiliated population is distributed in a uniform manner in the lowest-income deciles (that is, there is more or less the same amount, along the order of 2.5 million, in each decile) and is lower in the final deciles. The interpretation is simple: to the extent that income increases (as of the eighth decile), it is more likely that those employed will have social security coverage.
Graph 37 Graph 38
0
2
4
6
I II III IV V VI VII VIII IX X
Total employed Ocupied no affiliated
Current income deciles
28.5
0.6
26
27
28
29
2010
Households with housing Crowded homes
AffiliatedNon-affiliatesNot PEA
0.20.3
0.1
Source: BBVA Research with ENIGH 2010, INEGI data Source: BBVA Research with ENIGH 2010, INEGI data
3 Such as medical services provided by Pemex, the armed forces or private services. The free medical insurance program was excluded because social security affiliation through the health services tends to be used as a means of accessing a housing sub-account. However, the ENIGH 2010 explicitly included a question regarding whether the worker had a housing credit provision. Thus, initally the number of unaffiliated workers is used for comparative purposes with other published calculations, but it was decided to use the number of workers without the housing mortga-ge loan provision.4 The estimate was done considering that if the household had at least one member affiliated to some contributive medical service, then the household is considered as being affiliated. By contrast, the unaffiliated households do not have any family member affiliated to a contributive medical service.
Concept ENIGH 2010

Real Estate Outlook Mexico
Page 24
Graph 39 Graph 40
1420
64%
55%
0%
25%
50%
75%
100%
0
10
20
30
40
50
2000 2010
Affiliates Not affiliates Proportion not affiliates
811
81%74%
0%
25%
50%
75%
100%
0
10
20
30
40
50
2000 2010
Withbenefit
Nobenefit
Proportionwithout benefit
Source: BBVA Research with ENIGH 2010, INEGI data Source: BBVA Research with ENIGH 2010, INEGI data
In the last decade, there has been notable progress in the employment conditions of the population, while in 2000, 65% of the working population was not affiliated to social security, in 2010, the proportion had descended to 55%. That is, the efforts to increase formal employment have had favorable, though gradual results.
However, social security is not the same as a housing credit benefit. For purposes of measuring potential housing needs or demand among those that do not have access to this benefit, workers should be considered that do not have access to housing credit. In 2010, there were 9.1 million affiliated workers and 24.1 million unaffiliated to this benefit. This becomes very important, because it dispels the generalized belief that only non-salaried workers lack access to Infonavit or Fovissste.
Due to the above, we believe that quantifying the housing needs of all workers that do not have access to the benefit of a housing loan, would lead to a measure closer to the total number of workers that face greater barriers to having access to a mortgage loan in its traditional formats. This group, which totals 33.2 million workers, is greater than that of affiliates with the benefit of a housing mortgage, 11.1 million. In terms of the number of households, they total 17.3 million.5 This universe, which can be denominated as “Households without a housing benefit” is the target group of the programs for the unaffiliated, and on which we will focus our analysis throughout the rest of the article.
Graph 41 Graph 42
24.1
9.133.2
0Workers
Not affiliated with no benefit
Affiliate withoutbenefit
Withoutbenefit
4
8
12
16
20
11.4
5.917.3
0
4
8
12
16
20
Homes
Not affiliated with no benefit
Affiliate withoutbenefit
Withoutbenefit
Source: BBVA Research with ENIGH 2010, INEGI data Source: BBVA Research with ENIGH 2010, INEGI data
5 As in the case of unaffiliated households, in this case we considered that if at least one household member has the benefit of a housing loan, then the household has the benefit. On the other hand, those households without the benefit of a housing loan by any member are considered as not having the benefit.

Real Estate Outlook Mexico
Page 25
Graph 43 Graph 44
Rented housing
0.0
0.4
0.8
1.2
1.6
2.0
I II III IV V VI VII VIII IX X
Homeownership
Current income deciles
Not overcrowded homes
0
1
2
3
I II III IV V VI VII VIII IX X
Crowded homes
Current income deciles
Source: BBVA Research with ENIGH 2010, INEGI data Source: BBVA Research with ENIGH 2010, INEGI data
Of the total number of housing units where workers live without the benefit of housing credit, 11.9 million are owned and 2.4 million are rented.6 On the other hand, 7 million of these households present conditions of overcrowding, measured in terms of the criteria of the United Nations of more than two occupants per bedroom. In both cases, the lower income deciles concentrate the majority of these households and homes.
When comparing the affiliated and the unaffiliated, it is interesting to note that the monthly payment of households with financing for housing (the group with housing loan benefits) is very similar to that of those that pay rent (the group without the benefit of a housing loan). In some cases, in some deciles, the rental payment surpasses that of the average mortgage payment.
Graph 45 Graph 46
0
10
20
30
40
I II III IV V VI VII VIII IX X
Current income deciles
With benefits Without benefits
0
10
20
30
40
I II III IV V VI VII VIII IX X
With benefits Without benefits
Current income deciles
Source: BBVA Research with ENIGH 2010, INEGI data Source: BBVA Research with ENIGH 2010, INEGI data
Another interesting datum is that the rental payment that is currently being made for rented housing by workers without the benefit of a housing loan, is lower than the 20% of total current income as of the third decile. The figure is more relevant when it is considered that the percentage of current income that a mortgage payment represents (among those that currently hold a mortgage) is along the order of 21%. In other words, the proportion of income that is destined for housing is the same in both groups.
6 The remaining 2.9 million belong to another classification of property (on loan, in litigation, intestate, etc).

Real Estate Outlook Mexico
Page 26
Graph 47 Graph 48
Without sufficient income
1.6 1.71.5 1.4
1.0 0.9
0.0
0.5
1.0
1.5
2.0
2.5
I II III IV V VI VII VIII IX X
With sufficient income
Total = 8.1
Current income deciles
1.01.0
0.8
0.7
0.4
0.3
V VI VII VIII IX X
Current income deciles
Total = 4.1
0.2
0.4
0.6
0.8
1.0
1.2
Source: BBVA Research with ENIGH 2010, INEGI data *Due to lack of housing or overcrowded living conditionsSource: BBVA Research with ENIGH 2010, INEGI data
Once the population is identified according to income level, the following step is to identify those with sufficient income to cover a mortgage payment; that is, a measure of potential demand. Making the monthly mortgage payment for the cheapest housing in the market (with a price of around 200 thousand pesos) requires a monthly income of around seven thousand pesos, which is equivalent to slighly more than four minimum wages. There are 8.1 million households without the benefit of a housing loan that meet this first condition.
Passing from potential demand to real demand requires additional segmentation, which consists in identifying those that, in addition to having the minimum income required, want and/or need housing. The first is not so easy, but there is a way of measuring at least the second. That is, although we do not have an accurate knowledge of those who want housing, we can assume that those interested in a first instance would be those that currently have housing needs, something that is possible to determine.
To quantify the housing needs among the population without the benefit of access to a housing loan and with sufficient income for a mortgage payment, we used two basic criteria: households that lack housing and those with conditions of overcrowding.7 In this group there are 4.1 million households, of which almost 70% (2.8 million) live in rural areas (small towns with fewer than 15 thousand inhabitants), where coverage of financial services is scant8 and where problems regarding geographic mobility are important.9
Now then, the commercial banks could not attend all this population. Based on the current structure of mortgage financing by the banks, it is seen that loans granted under co-financing with the public housing institutions have an average value of 617 thousand pesos,10 which is within the price range of housing considered to be of entry level or social benefit.11 This means that the rest of the loans, that is, those granted in an exclusive manner or with the banks’ own resources are aimed at higher level segments. In fact, the average value of housing of this type (with the banks’ own resources) is close to 1.2 million pesos.
7 Although a broader measure should also consider those living under precarious conditions due to the quality of the housing materials.8 According to the Third Report of Financial Inclusion (RIF3) issued by the CNBV (National Banking and Securities Commission), only 17% of the mu-nicipalities with fewer than 15 thousand inhabitants have a bank branch. The growth in the coverage of financial services toward these locations has taken place through bank correspondents. 9 Migration toward the state capitals or to other states in the country, as well as abroad is a common phenomenon in this type of localities.10 Figures for 2011, January - October period.11 The top price of which is 637 thousand pesos, using the classification of the Mexican Mortgage Association (Asociación Hipotecaria Mexicana (AHM).
An additional datum, equally revealing and in a way linked to the above point, is that the current income is very similar among the population with the benefit of a housing loan and that of the population without this benefit, even in the last decile.

Real Estate Outlook Mexico
Page 27
Graph 49 Graph 50
617
1,189
637
400
600
800
1,000
1,200
Co-financing Own resources
Socialhousing*
Served by commercialbanks exclusively*: 683,000 of 4.1 million (17%)
84.4
12.1 3.6
83.4
9.76.9
Social interest Medium Residential
No benefitsbut in need ofhousing
Affiliates
*Maximum value, according to AHM classification Source: BBVA Research with ABM and AHM data
*That is, with their own resources or only that of the commercial banks Source: BBVA Research with ABM, AHM and ENIGH 2010 data
Based on the fact that workers without the benefit of access to a housing mortgage would have to be attended with bank resources, under a similar plan to that of affiliated workers, the natural segment for the commercial banks would be formed by those who perceive sufficient income for housing in the medium range and residential segments. These represent close to 17% of those that could have access to a mortgage loan and have need of housing.12 The proportion is similar to that of affiliated workers that have access to credit (15%). This fact is not surprising, considering that the income for both groups is very similar.
In absolute numbers, the potential for loans granted by the commercial banks is close to 700 thousand, which corresponds to the last two income deciles.13 This might appear to be a modest sum, but in context, it is worth mentioning that the number of loans granted by the commercial banks with their own resource in 2010 was almost 50 thousand. Set forth in other terms, the potential volume of loans for workers without the benefit of access to a mortgage loan is equivalent to around 14 years of current activity.
12 The figure should be read simply as the potential for attention, among those that have sufficient resources and the need of housing, the seg-ment comparable to the client base (affiliated workers mainly). It does not mean that all would want to acquire housing.13 If only the unaffiliated workers are considered, the number of potential loans would be slightly more than 300 thousand.
Graph 51
4.0
2.84.1
1.9
1.3
1.3
0.9Urban
Rural
No housing
No housing& overcrowded
overcrowded
Housingneeds
Noneed
housing
4.1 4.18.1
Geographicalscope
Housingcondition
Source: BBVA Research with ENIGH 2010, INEGI data
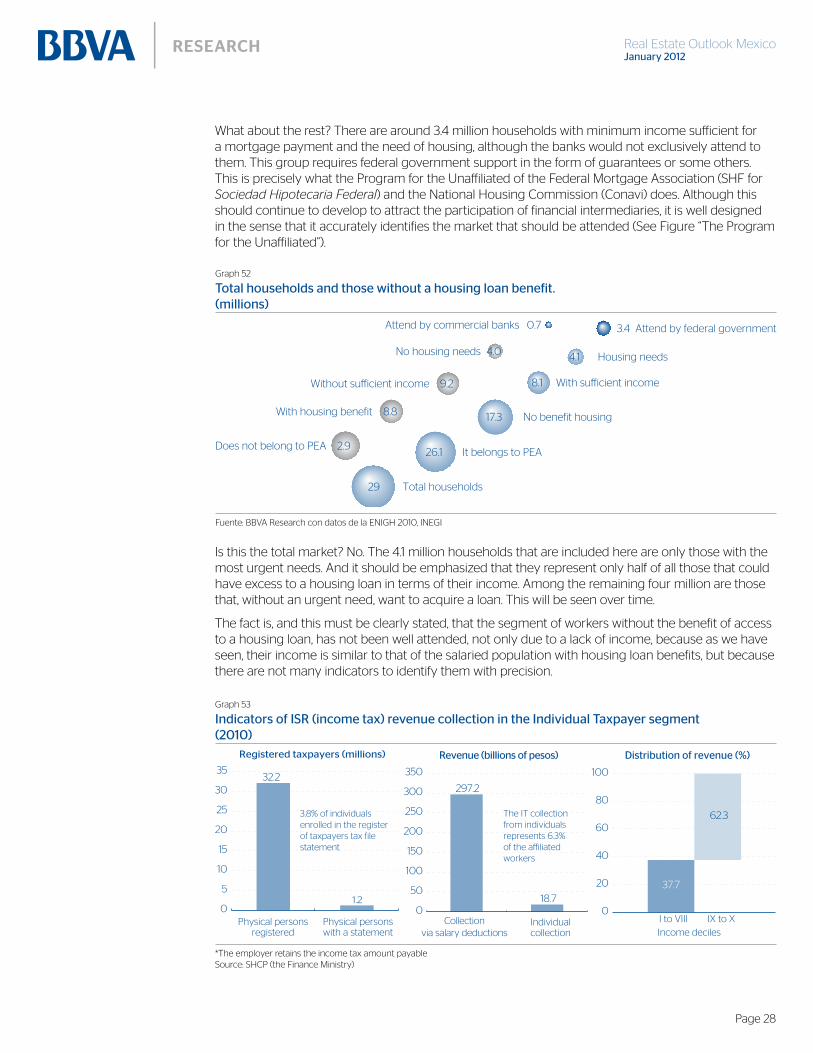
Real Estate Outlook Mexico
Page 28
What about the rest? There are around 3.4 million households with minimum income sufficient for a mortgage payment and the need of housing, although the banks would not exclusively attend to them. This group requires federal government support in the form of guarantees or some others. This is precisely what the Program for the Unaffiliated of the Federal Mortgage Association (SHF for Sociedad Hipotecaria Federal) and the National Housing Commission (Conavi) does. Although this should continue to develop to attract the participation of financial intermediaries, it is well designed in the sense that it accurately identifies the market that should be attended (See Figure “The Program for the Unaffiliated”).
Graph 52
0.7
29
2.926.1
8.8 17.3
9.2 8.1
4.0 4.1
3.4
Total households
With housing benefit No benefit housing
Without sufficient income With sufficient income
No housing needs
Attend by federal government
Does not belong to PEA
Attend by commercial banks
It belongs to PEA
Housing needs
Fuente: BBVA Research con datos de la ENIGH 2010, INEGI
Is this the total market? No. The 4.1 million households that are included here are only those with the most urgent needs. And it should be emphasized that they represent only half of all those that could have excess to a housing loan in terms of their income. Among the remaining four million are those that, without an urgent need, want to acquire a loan. This will be seen over time.
The fact is, and this must be clearly stated, that the segment of workers without the benefit of access to a housing loan, has not been well attended, not only due to a lack of income, because as we have seen, their income is similar to that of the salaried population with housing loan benefits, but because there are not many indicators to identify them with precision.
Graph 53
Registered taxpayers (millions)
32.2
1.20
5
10
15
20
25
30
35
3.8% of individualsenrolled in the registerof taxpayers tax filestatement
Physical personsregistered
Physical personswith a statement
*The employer retains the income tax amount payableSource: SHCP (the Finance Ministry)
Revenue (billions of pesos)
297.2
18.70
50
100
150
200
250
300
350
The IT collectionfrom individualsrepresents 6.3%of the affiliatedworkers
Collectionvia salary deductions
Individualcollection
37.7
62.3
0
20
40
60
80
100
I to VIII IX to X
Income deciles
Distribution of revenue (%)

Real Estate Outlook Mexico
Page 29
Let us take as an example, tax collection indicators, which are very revealing in this sense. During 2010, among salaried workers (for whom the withholding of taxes is done by the employer), income tax (ISR) collection was 297 billion pesos; in contrast, for taxpayers registered as Individuals, collection was 19 billion pesos. Moreover, among the 32.2 million taxpayers registered as Individuals, only 1.2 million (3%) filed a tax return in 2010. Also, among those that filed a return, nearly 63% of the amount collected correspond to the last two deciles of households, that is, those with the higher income. This is consistent with the argument that this group is naturally, the one that the banks could attend.
And it should also be stressed that the low tax collection levels among Individuals or non-salaried workers, does not necessarily imply lower incomes. Some studies show that tax evasion in the country in the segment of Individuals, only with regard to rental income, is 64% (Cantalá, Castañeda & Sempere, 2006).
The analysis of the population that lack access to a mortgage loan granted by the public housing institutions offer an interesting outlook on the potential this offers. Although there are some precisions that help to identify the products with which they should be attended, and with this avoid generating false expectations.
The population without access to a housing mortgage loan by the Infonavit or Fovissste is greater than those who have access, and the income of both groups is similar, as well as the distribution of their expenses, including that of housing. Moreover, the unaffiliated are only a part of the group. Among the population with social security, there are 9.1 million that do not have the benefit of access to a housing mortgage loan.
It might therefore be considered that this segment of the population offers a vast potential for the significant growth of mortgage loans over the next few years. In theory, although this is possible, it would have to be qualified. Initially, those who have the income necessary to pay a mortgage would have to be identified, and from that point on, those who need housing and/or are willing to acquire it. Then there is the matter of who would grant them the loan. Among those that could acquire housing and in addition need it, only 17% could be attended exclusively by the commercial banks. The remaining 83% of the cases would require the support of the federal government. An additional fact, which should be considered, is that these are aggregate numbers, and further considerations include who would want housing, and the filters that will allow estimating various risks, such as labor mobility, age, etc.
Government support programs should segment the target population accurately, and design mechanisms that help measure their development. The SHF and Conavi support program (See Figure “The SHF Support Program for the unaffiliated”) is promissory in this sense: The fact is that, identifying the needs and designing the appropriate programs, the population without the benefit of access to a mortgage loan could be an important catalyst force for the construction of housing over the next few years.
Finally, it should be emphasized that although some advances have been made, it is necessary to strengthen efforts, first to raise the potential growth of the economy as a route toward a greater generation of employment, and second, to motivate formal employment, which is perhaps the surest route to increasing the number of mortgage loans granted by the banks under a co-financing plan.
Encuesta Nacional de Ingreso y Gasto de los Hogares 2010. INEGI. (ENIGH 2010, National Survey of Household Income and Expenses, 2010)
Informes sobre la situación económica, las finanzas públicas y la deuda pública. (Reports on the Economic Situation, Public Finances and the Public Debt) Cuarto Trimestre 2010 (Fourth Quarter, 2010). SHCP
Cantalá D., A. Castañeda and J. Sempere (2006). “Evasión fiscal en el impuesto sobre la renta de personas físicas con ingreso por arrendamiento” (“Income Tax evasion by individuals with rental income”). El Colegio de México
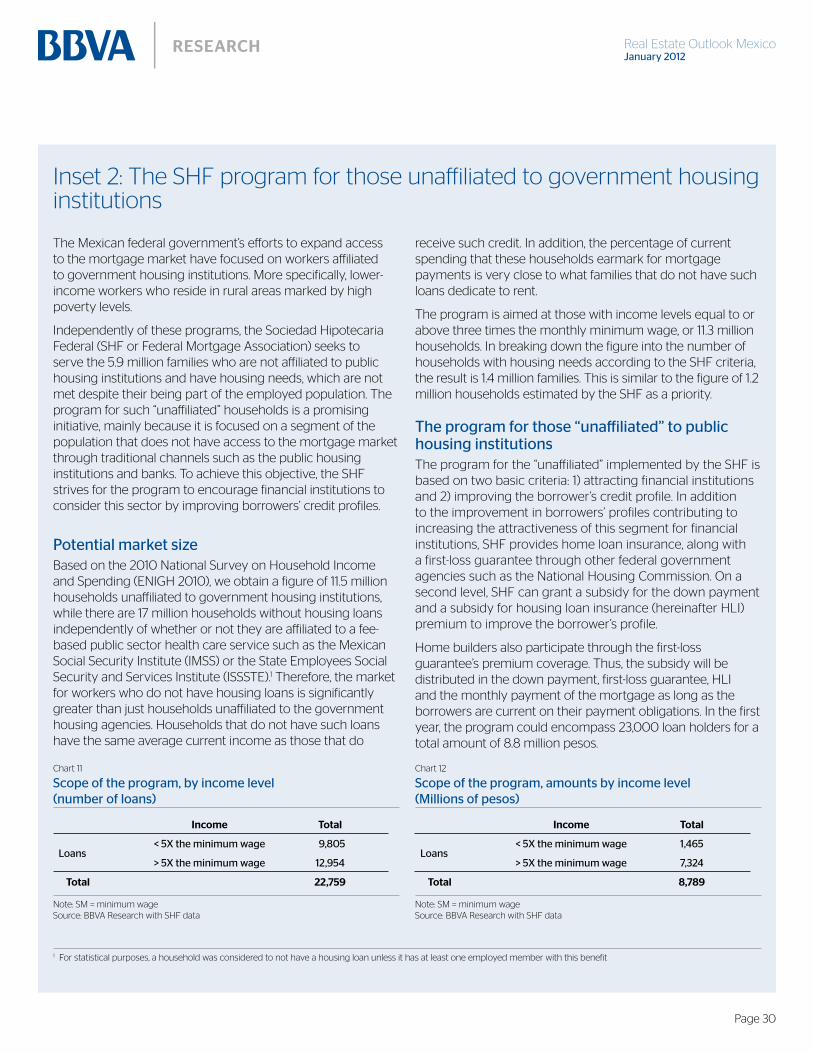
Real Estate Outlook Mexico
Page 30
Inset 2: The SHF program for those unaffiliated to government housing institutions
The Mexican federal government’s efforts to expand access to the mortgage market have focused on workers affiliated to government housing institutions. More specifically, lower-income workers who reside in rural areas marked by high poverty levels.
Independently of these programs, the Sociedad Hipotecaria Federal (SHF or Federal Mortgage Association) seeks to serve the 5.9 million families who are not affiliated to public housing institutions and have housing needs, which are not met despite their being part of the employed population. The program for such “unaffiliated” households is a promising initiative, mainly because it is focused on a segment of the population that does not have access to the mortgage market through traditional channels such as the public housing institutions and banks. To achieve this objective, the SHF strives for the program to encourage financial institutions to consider this sector by improving borrowers’ credit profiles.
Based on the 2010 National Survey on Household Income and Spending (ENIGH 2010), we obtain a figure of 11.5 million households unaffiliated to government housing institutions, while there are 17 million households without housing loans independently of whether or not they are affiliated to a fee-based public sector health care service such as the Mexican Social Security Institute (IMSS) or the State Employees Social Security and Services Institute (ISSSTE).1 Therefore, the market for workers who do not have housing loans is significantly greater than just households unaffiliated to the government housing agencies. Households that do not have such loans have the same average current income as those that do
receive such credit. In addition, the percentage of current spending that these households earmark for mortgage payments is very close to what families that do not have such loans dedicate to rent.
The program is aimed at those with income levels equal to or above three times the monthly minimum wage, or 11.3 million households. In breaking down the figure into the number of households with housing needs according to the SHF criteria, the result is 1.4 million families. This is similar to the figure of 1.2 million households estimated by the SHF as a priority.
The program for the “unaffiliated” implemented by the SHF is based on two basic criteria: 1) attracting financial institutions and 2) improving the borrower’s credit profile. In addition to the improvement in borrowers’ profiles contributing to increasing the attractiveness of this segment for financial institutions, SHF provides home loan insurance, along with a first-loss guarantee through other federal government agencies such as the National Housing Commission. On a second level, SHF can grant a subsidy for the down payment and a subsidy for housing loan insurance (hereinafter HLI) premium to improve the borrower’s profile.
Home builders also participate through the first-loss guarantee’s premium coverage. Thus, the subsidy will be distributed in the down payment, first-loss guarantee, HLI and the monthly payment of the mortgage as long as the borrowers are current on their payment obligations. In the first year, the program could encompass 23,000 loan holders for a total amount of 8.8 million pesos.
1 For statistical purposes, a household was considered to not have a housing loan unless it has at least one employed member with this benefit
Chart 11
Note: SM = minimum wageSource: BBVA Research with SHF data
Chart 12
Note: SM = minimum wageSource: BBVA Research with SHF data
Income Total
Total 22,759
Income Total
Total 8,789
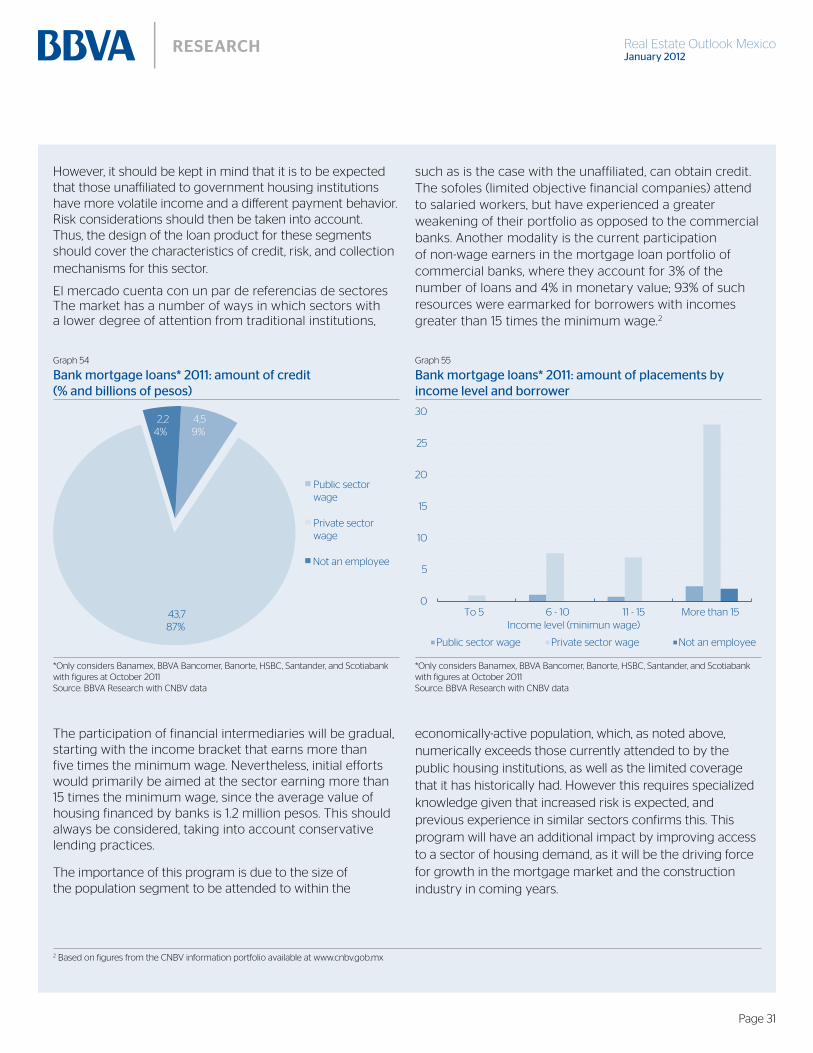
Real Estate Outlook Mexico
Page 31
However, it should be kept in mind that it is to be expected that those unaffiliated to government housing institutions have more volatile income and a different payment behavior. Risk considerations should then be taken into account. Thus, the design of the loan product for these segments should cover the characteristics of credit, risk, and collection mechanisms for this sector.
El mercado cuenta con un par de referencias de sectores The market has a number of ways in which sectors with a lower degree of attention from traditional institutions,
such as is the case with the unaffiliated, can obtain credit. The sofoles (limited objective financial companies) attend to salaried workers, but have experienced a greater weakening of their portfolio as opposed to the commercial banks. Another modality is the current participation of non-wage earners in the mortgage loan portfolio of commercial banks, where they account for 3% of the number of loans and 4% in monetary value; 93% of such resources were earmarked for borrowers with incomes greater than 15 times the minimum wage.2
Graph 54
4,59%
43,787%
2,24%
Public sectorwage
Private sectorwage
Not an employee
*Only considers Banamex, BBVA Bancomer, Banorte, HSBC, Santander, and Scotiabank with figures at October 2011Source: BBVA Research with CNBV data
Graph 55
0
5
10
15
20
25
30
To 5 6 - 10 11 - 15 More than 15Income level (minimun wage)
Public sector wage Private sector wage Not an employee
*Only considers Banamex, BBVA Bancomer, Banorte, HSBC, Santander, and Scotiabank with figures at October 2011Source: BBVA Research with CNBV data
The participation of financial intermediaries will be gradual, starting with the income bracket that earns more than five times the minimum wage. Nevertheless, initial efforts would primarily be aimed at the sector earning more than 15 times the minimum wage, since the average value of housing financed by banks is 1.2 million pesos. This should always be considered, taking into account conservative lending practices.
The importance of this program is due to the size of the population segment to be attended to within the
economically-active population, which, as noted above, numerically exceeds those currently attended to by the public housing institutions, as well as the limited coverage that it has historically had. However this requires specialized knowledge given that increased risk is expected, and previous experience in similar sectors confirms this. This program will have an additional impact by improving access to a sector of housing demand, as it will be the driving force for growth in the mortgage market and the construction industry in coming years.
2 Based on figures from the CNBV information portfolio available at www.cnbv.gob.mx

Real Estate Outlook Mexico
Page 32
3.b. “Land banks”:a little used financial model In this article of Mexico Real Estate Outlook, we present an analysis regarding the functions and the role that the land banks play in the housing markets. These institutions, which are mostly administered by governments, have been constituted in developed countries as essential tools with which to promote competitiveness in the markets they attend and, in some cases, solve specific problems in the communities. By means of various incentives, they help to strengthen the land financing channels and, in passing, to correct some of the phenomena inhibiting housing appreciation such as: abandonment, lack of territorial planning investment (public and private), and re-positioning of repossessed homes. In the first part of this article we quote the definition and the main functions of the land banks. Then, the main approaches that have been adopted at an international level on this topic and the manner that these financial channels have evolved in the case of Mexico. Finally, a perspective is offered regarding the potential value that this market could offer in the country.
At an international level, land banks have been constituted as governmental institutions that establish mechanisms to channel financial resources toward specific urban areas which have problems in administration or in a sub-optimum use, or that are planning to improve its use in the future. Even though they normally operate with a government budget, on some occasions they can obtain private funds.
In general, they are directed toward preserving both the value of the land and the constructions, especially when they are affected by disorder in the urban environment. Normally, said disorder is associated with the abandonment of the land or the homes, the lack of investment in areas with an urban development potential and the recapitalization of properties that, due to the high costs of repossession or seizure, cannot be placed once again in the market.
Figure 1
The local government issues a decree to create a land bank
The acquisition of properties takes place with transfers between governments, private agents or by embargo
The land bank can update the property debts, mainly through taxesand/or invest in property improvements
Developmentof new units
Rehabilitation ofexisting units
Disposition of the property
Maintenance forfuture use
Source: Alexander (2005)
In the United Kingdom, land banks promote private investment in under-utilized areas. Government participation in the rehabilitation of the areas is marginal and close to three fourths of the investment destined for under-utilized areas comes from the private sector. It should be stressed that it is necessary that such areas are in total abandonment or have been repossessed. The intention

Real Estate Outlook Mexico
Page 33
to maximize or make better use of the properties is enough to justify the investment in favor of materializing the economic , physical and social benefits in the government’s development plans..
One of the main incentives of the private sector lies in the fiscal aspect, given that the government allows the deductibility of all expenditures associated with the improvement of land that had been garbage dumps or that is in industrial obsolescence.1
The local governments contribute by identifying the properties in disuse, determining the responsibilities in the land rehabilitation process and set the criteria for maintaining a public registry of the properties according to zones and uses. Also, the municipal governments and the governmental landholding organizations are encouraged to sell so as to allow the central government to include them in their plans of urban growth. As a main rule, the local governments cannot constitute and operate land banks as a form of “corporate government” that avoids being judge and jury in the decisions regarding some public assets of the community. This generates incentives for a better execution and administration of the projects.
Finally, in those projects where the private sector does not invest directly, participation mechanisms can be established for the construction and operation of the projects through private associations and local governments.
The first land bank formally created in Europe began operating in Amsterdam (Holland) in the last decade of the XIX Century. Later, Sweden (1904) and France (1958) adopted the system. The main reference of the land banks in the European countries resides on the Model of Private Land Associations. Although they can have variables, the activities they realize include the development of housing and commercial projects, being advisors in urban development matters, oversee that land use is respected and collaborate in the projects for maintaining urban image and conservation. .
The Agencies for Regional Development are another mechanism, mainly for promoting economic development and the regeneration of properties, in addition to providing the counterbalance for private associations (among other ways, by regulating their activities).
Land banks began to operate formally in the decade of the nineties through a series of reforms for use of land. The main objective of the local governments was to promote the development of their economies with orderly urban growth, housing prices and healthy public finances. However, given the socio-economic differences of the regions, a single model was not followed.
In general terms, a dual model was followed where investors could obtain the right to use of the land through auctions or bidding processes at more competitive prices. This mechanism has contributed to generating Industrial and commercial areas in abandoned areas. Contrary to other countries, in China the land banks do not accumulate a large quantity of land, which has allowed for sustained price growth2 in developed areas. Meanwhile, the rise in tax revenues has also been accompanied by an increase in investment on infrastructure.3
Relative to the United States, land banks began to operate formally between the decade of 1960 and 1970. The states best known for the success of their policies are: St. Louis (Missouri), Cleveland (Ohio), Louisville (Kentucky), Atlanta (Georgia) and Flint (Michigan) which overcame problems such as the abandonment of properties and the consequent problem of default in their local economies.
1 Some programs can deduct up to 150% of the total cost of land improvement.2 Between 2002 and 2006, the rise in the average land price for commercial and residential use in the city of Guangzhou has been of 4.5%.3 The city’s tax revenues rose almost 60% between 2002 and 2006 and investment on infrastructure 68% for the same period.

Real Estate Outlook Mexico
Page 34
In the case of Canada, the practices began in the decade of the fifties, of note being the program implemented in cities in Ontario since the decade of the sixties.
In these cities, a mechanism was established for transforming all abandoned and repossessed properties into productive long-term assets4. Thus, the functions of the land banks included the reduction of the terms for the collection and execution of the mortgages in default5. Also, they maintained land use linked to the development priorities of the local governments. In some cases, the land banks had even acted as housing developers.6 Here, the land banks also had the faculty of setting the prices of the land, even with the possibility of placing it below its market value as an incentive to attract private investment7. Finally, the land banks involve the community by generating incentives for a better use of land in disuse.8
4 For example, in Hamilton, Canada, an improvement program was established for industrial properties in disuse where the government covered up to 80% of the improvement cost of the locality, with quick reactivation purposes.5 In 1999, Michigan implemented a reform so properties could be repossessed in the first two years after incurring in fiscal non-compliance. (Genesee County Land Bank. Side Lot Transfer Program Evaluation, 2006)6 Such is the case of the Genesee County, in the State of Michigan, in the U.S., which since 2004, expanded the faculties of the local Land Bank to act as developer, because of the large number of properties that the state had accumulated since 2003.7 One of the main policies of the land bank of Atlanta is to acquire properties for less than 75% of the net value of the property. (Land Bank Authorities, 2005, Chapter 6)8 For example, in the city of Cleveland, a government program marketed land in disuse with a front of up to 40 feet for just one dollar in order to integrate them with the neighboring homes.9 In the particular case of Aguascalientes, it should also be mentioned that the reserves acquired are framed in the urban development plan of the state that seeks to put in order urban growth with a 30-year vision.
Chart 13
Municipal or local
governments Communities
Land banks
and housing developers
assets
Source: BBVA Research
In the case of Mexico, although scarce, some experiences worth mentioning have begun to emerge. In Puebla and Aguascalientes, the state governments, through their housing institutions or agencies, have acquired land reserves for urbanization and placing among housing constructors, so as to attend to the housing needs of the low-income population.9 Another example, in the Federal District, would be on the land where the Pemex refinery once stood in Azcapotzalco. The land of 55 hectares was unused close to three decades after the refinery had already closed, until 2011 when an ecological park was built there with a lake, gardens, sports courts, etc. Finally, at a federal level, in 2009 the government began the promotion of Comprehensive and Sustainable Urban Developments (DUIS for its Spanish initials) in order to further that land destined for housing would have guaranteed at least a provision for standardized services with criteria for sustainability.
But, beyond these cases that are a long way from offering comprehensive solutions, in Mexico land banks do not rely on the participation of the government--be it due to the ownership of the land or due to the authority for negotiating its use--; rather, they focus on the financial management of land reserves. And it is within the housing financing chain, in Mexico’s case, that land has received relatively little attention by financial intermediaries and by the markets themselves. The commercial banks do not have a specifically designed product to finance, despite the fact that there are some cases of banks financing the equipping and infrastructure of lots. Instead, it has been the investment funds that have covered these needs. The same occurs in the financing of urban equipping and infrastructure.

Real Estate Outlook Mexico
Page 35
The land banks are an effective way of administrating the land reserves of housing constructors. Typically, the institutions engaged in this activity acquire the reserves that builders will use to develop housing in the short term., which allows the construction companies to obtain liquidity and, at the same time, to discount these assets from their balance.
The financing is done on the basis of individual projects, although based on as certain scale.10 That is, it is neither for all of the land reserve nor for the one that is expected to be developed in the long term. It is not even due to the costs that it implies; it is only for those projects to be developed in the next two to four years.
For those covering the conditions, the access to the land banks raises the profitability of their projects significantly. In exchange for a share in the sales (somewhere between 15% and 20%), the land bank covers the value of the land, which reduces the cost for the builder and, thereby, raises the profitability of the project.11
However, it must be clarified that the plan does not adapt to everyone’s needs. An initial limiting factor is that some investment funds can only work with publicly traded companies.12 A second one is that the financing cost itself cannot be absorbed by all the construction companies Third, in order for it to be functional, the operating cycle of the housing product to be developed should be well defined, which is most probable to occur in the housing segments for the lowest income population, which have the support of the federal government for their marketing (which eliminates some of the uncertainty as to the times for displacement). Finally, not all the housing construction companies have land reserves for several years of sales and on which they require for specific financial management.
Thus, the companies which typically go to a land bank are those that have large extensions of land for their operation, both present and future, which they have accumulated so as to have the necessary input to guarantee their operation for several years. under the premise of being able to move the finished product with relative speed. In the end, this implies that it is the large companies, preferably publicly traded, that are the natural candidates to receive financing from a land bank.
Having already established that most (if not all) of the financing needs through land banks would correspond to large companies, the estimate of the potential financial volume is based on two criteria: one is the proportion of land in the total value of a home, and, two, the total surface of the land required in construction.
In a first approximation, the value of the land in the total value of the home, the important thing to know is how many homes of greater size are placed by the construction companies and what is their average price, In 2010, 610,00 mortgage loans were granted at a national level, of which the larger companies contributed 268,000.13 The average value of homes in the segments attended by these construction companies (directed to the low-income population) is between P$325,000 and P$356,000.14 Therefore, the housing market value in the segment attended by these construction companies would be of up to P$95 billion. Consequently, the activity of the land banks would be a portion of that total.
10 Although they are valued individually, land bank administrators require a portfolio of projects in which to invest. 11 It can be shown that for a project of between 5,000 and 5,500 homes, of a price around P$325,000 to be built and sold in five years (from the start of construction), under typical financing conditions costs for building and urbanization and operating and administrative expenditures, the constructor is offered a return on his Investment on the order of 35%, when he should cover the cost of the land. In turn, when the land bank covers this amount (in exchange fora share in the sales of between 15% and 20%), the profitability for the constructor rises to more than 60% and for the land bank, it reaches 25%. 12 One way to limit the risks associated with the projects is through the evaluation of the builder, which requires knowing his operating and finan-cial performance throughout time. The publicly traded companies offer better conditions for making this evaluation. 13 The publicly traded companies (quoting on the stock market) placed 155,000 and other large ones, around 113,000. As a whole, their participa-tion in total new housing (456,000) was close to 60%.14 Based on reports of the companies themselves and the figures of the average housing value according to Infonavit and Fovisste segments.

Real Estate Outlook Mexico
Page 36
Chart 16 Chart 17
*Based on 2010 figuresSource: BBVA Research with Infonavit data
*Based on 2010 figures**Assumes value equivalent to 10% of the homeSource: BBVA Research with the companies’ data
Land** 9.5Total value 6.5
On the other hand, a known datum is that the value of the land, as a proportion of the value of the home, fluctuates between 10% and 20%; the highest percentages correspond to a residential home. For the large companies which acquire large territorial extensions (and thereby have a greater capacity for negotiation) and build for the lower-income population segments, mainly for social benefit (or entry level), the figure for the value of the land is probably closer to the lower limit of the range, that is, toward 10%. Using this proportion in the value of the housing market, one can observe that the potential market value for the large construction companies is in the order of P$9.5 billion annually.
Chart 14 Chart 15
Source: BBVA Research with Infonavit data. Source: BBVA Research with the companies’ data
Average price
Share(% of loans)
Total 395.9 100.0
Social benefit 323.5 91.6
HousingAverage
price
Geo
Sare
Total 154.6 355.9
The second approximation associated with the land area used in housing construction takes as reference the average surface area of a social benefit home and the price per square meter of the land for this type of home. On average, each home directed to the low-income segment requires a surface area of 150 sq. mts. under the horizontal construction model.15 Multiplied by the 168,000 homes the large construction companies (publicly traded and others) placed in 2010, and adjusting 80% for considering that up to 20% could have been placed under a vertical housing model, the surface to develop annually is in the order of 3.2 thousand hectares.
15 This surface area is the result of adding to the housing surface area that corresponding to roads, common areas and others, which, as a whole, represent up to 30% of the total area of the project.

Real Estate Outlook Mexico
Page 37
Now, taking into account that the volume that the banks can administer is equivalent to the development foreseen for the following two to four years, it is obtained that the total potential value of this market would be the result of multiplying by four the figures estimated above. The result is within a range of P$26 billion to P$38 billion (or something between P$2 billion and P$3 billion dollars).The figure should be seen as a potential, if it is that all the reserves (to be developed in the medium term) of the larger construction companies were funded in the market.
An important question that has to do with the assumptions used in the estimate is regarding the evolution of future land needs for construction. It could be assumed that to the extent that the way is opened for the vertical housing model, the need for accumulating territorial reserves would decrease. Even though there could be some reason for this argument, it seems more feasible to suppose that, at least in the medium-term horizon, vertical housing will begin to develop in the existing territorial reserves, and simply, there will be more space for building amenities and services which, up to now, have been scarce in the housing developments.
In addition, there is the interest of the federal government to develop financing products for the population that does not have access to financing from the public housing institutes, and this, in the end, means expanding housing construction in the low-income segments. So, it is not totally conclusive that the need for housing construction land will be reduced significantly in the coming years. It is probable that there will be a mixed development, making use of existing land reserves and, at the same time, seeking a more efficient use for other reserves or areas, up to now not much exploited. In this second case, land that is property of the state or the municipality, could enter into intra-urban areas that would contribute to a better use of the infrastructure and equipping of the city.
Housing development is not the only objective (nor the most important) among those who have developed or contributed to funding the land banks. The commercial and industrial sectors have land financing needs and attract more resources than housing. In 2010, a survey among the members of the Mexican Association of Real Estate and Infrastructure Funds (AMFII for its Spanish initials) revealed that housing obtained only 10% of the resources invested;16 however, almost half, 48%, was destined for the industrial sector and 30% for the commercial. Moreover, they only occupy
Graph 56 Chart 18
26
38
0
10
20
30
40
According toits value per m2 of land
According part. % of the land for housing
*Based on 2010 figures. It is assumed that the land to be developed can be placed in the following four yearsSource: BBVA Research with the companies’ data
Source: BBVA Research with the companies’ data
Developer
Land Reserve,
thousands of
hectares
Housing,
Thousands
Geo
Sare
Total 26.2 1302.3
For the land where this type of housing is typically built, the price of the land, according to the sector participants, is close to P$200 per sq. mt. Multiplied by the surface required, we obtain that the value of the land the large construction companies occupy would be close to P$6.5 billion.
16 Although sufficient for funding the development of almost 100,000 homes. Although it is not precisely known in how much time they have been developed, it is enough to see that they are equivalent to two thirds of all the sales of the publicly traded construction companies in 2010.

Real Estate Outlook Mexico
Page 38
Graph 57 Graph 58
0
500
1000
1500
2000
2500
2000 2008 2013e
Industrial 48
Commercial30
Residential18
Others*
*Approximate figuresSource: BBVA Research with AMFII data
*Hotels and officesSource: BBVA Research with the companies’ data
The potential for increasing investment in land banks (or, in a more general way, on land financing projects) in the coming years could be significant. In particular, because being projects with high levels of return, but above all, stable over time, they have in the institutional investors, such as pension funds, a broad funding basis. In this sense, the inclusion of Capital Development Certificates, known as CKDs, in the investment portfolio of the Afores (retirement fund management companies) they can be constituted as an important source of resources for the real estate sector in general. In a period of only three years, from the end of 2008 to the end of 2011, Afore financing to the CKDs has gone from P$2 billion to P$40 billion.
At an international level, land banks have surged from the collaboration between the public and private sectors to solving some problems associated with a sub-optimal use of land, derived from factors like disorderly growth, the abandonment of homes, and even tax evasion, or simply for better future planning. Does this sound familiar? Experience should be retaken in Mexico, where accelerated urban growth in recent years makes it urgent to have formal mechanisms of coordination between the public sector and the private as to long-term urban planning and land management, which forms part of the public policy agenda for the coming years. The DCUIS (Comprehensive Sustainable Urban Developments), promoted by the federal government with enthusiasm, could be the response to this need, although there much more is lacking.
a fraction of the surface than the housing projects: the profitable surface developed through 2010 with the commercial and industrial projects came close to 10,000 hectares, one third of the land reserves available of the publicly traded construction companies for that same year.
The same survey is revealing as to the marked growth of real estate funds as a source of financing for land development. In a period of just one decade, investment went from around US$100 million to a figure that, in 2008, already surpassed US$2.3 billion. It is true that the 2009 crisis reduced investment significantly, but as of then, the figures registered (and the medium-term projections) are showing a clear rising trend once again. In the year of the survey, growth in the construction of shopping centers advanced at rates of 20%.17
17 Measured by the number of projects, the referred survey mentions that the companies surveyed operated 139 shopping centers in that year and 28 additional ones were under construction.
Real Estate Outlook Mexico
Page 39
For now, the land banks in Mexico have been developed with the objective of covering financing needs to achieve the urbanization of land. However, this link, the first in the housing production chain, has been little attended in a comprehensive manner, not only by the commercial banks, but by other financial intermediaries. This speaks of the lack of specialized financial instruments and that these be adjusted to the needs of constructors throughout the entire production chain and in different stages of the cycle.
The rates at which the construction companies fund their land reserve management needs and the marked growth of investment destined to these projects in recent years suggests an ample development potential for the land market in the medium term. The land apt for housing is only one part, but the potential of other segments must also be considered, such as the development of infrastructure, offices, industrial parks and shopping centers in areas close to living complexes. Even the improvement of the areas where high indexes of uninhabited homes are registered, and where eventually it will be necessary to invest in improving services and urban infrastructure.
In any case, the key to the development of these activities will be to have specific products for the needs of housing constructors, according to their size, and that will help to cover land management needs, both in the short and the long term.
Alexander, Frank S. (2005). Land Bank Authorities. A guide for the creation and operation of local land banks. Local Iniciatives Support Corporation. April.
City of Hamilton (2008). Brownfield land banking as a land management tool in Hamilton, Ontario. Planning and Economic Development Department. February
Huang, Dingxi (2004). Land banking mechanism and its effects on city development in China. Centre of Urban Planning and Environmental Management.
U.S. Department of Housing and Urban Development (2009). Revitalizing Foreclosed Properties with Land Banks. Office of Policy Development and Research. August.
Sectorial Urban Development Program of the Aguascalientes government. 2001-2006.
Institutional Program 2005-2011of the Puebla Housing Institute

Real Estate Outlook Mexico
Page 40
3.c. Infonavit: the 2012-2016 Financial Plan and the new LawOn this occasion, in its 2012-2016 Financial Plan, A Strategic Institutional Agenda, the National Workers’ Housing Fund Institute ,(hereinafter the Infonavit) presents a new institutional challenge. The change focuses on expanding the scope of the purpose of the Infonavit on the impact and well.-being of its affiliates and their communities, in addition to granting loans and the payment of earnings. With this, the success regarding the reduction of the housing lag for workers and a greater generation of well.-being is achieved. It is no minor challenge, since it implies an increase in the Infonavit’s current tasks and a better knowledge of the housing market, both in terms of those that demand housing as well as of housing developers and even the authorities in order to guarantee sustainability..
In this section of Mexico Real Estate Outlook, we focus our attention on the strategic agenda of the Infonavit 2012-2016 Financial Plan, which seeks to define the direction for the compliance of its objectives. This strategic agenda is the result of an analytical framework that compiles the housing needs, risk and profitability issues, social balance and scope of public policies regarding housinge. In addition, it considers the tripartite vision that characterizes the action of this institution and which is assessed as part of its progress.
The 2010 Population and Housing Census shows that the population and the number of households surpassed previous official estimates, which led the Infonavit to update its housing demand projections. These changes imply, on average, an increase in attention required to 70 thousand new households a year compared to previous estimates. Nevertheless, housing needs are not limited to a quantitative aspect, but it is also necessary to evaluate the qualitative aspect of housing demand. In particular, based on the information of the 2010 Census (the ENIGH 2010 for its Spanish initials), the Infonavit identifies the need for the development of new housing solutions, such as attention to the rural population and types of specific loans for remodeling or expansion.
The goal in 2012 is 490 thousand loans and an amount of 118 billion pesos. The number of credits will reach 590 thousand in 2017 to meet the housing lag. As of 2018, there would be a reduction of 380 thousand loans due to lower demand, so the housing lag would be delayed one year compared to expectations of the previous financial plan.
Graph 59 Graph 60
Census2010
ProjectionsConapo
Average annualgrowth rate (TMAC)
90
95
100
105
110
115
2000 2005 2010
1.7
0.8
1.2
0
200
400
600
2012 2013 2014 2015 2016 2017 2018
2011-2015 FP 2012-2016 FP
Uponcompletion
of thehousing
lag
Source: BBVA Research with INEGI and Conapo data Source: Infonavit 2011-2015 and 2012-2016 Financial Plans.

Real Estate Outlook Mexico
Page 41
On another front, the Infonavit seeks to attend to the housing needs of two sectors that require specific attention: temporary workers and workers without a savings system for housing. Although it is also quite clear in establishing that it will provide its operating capacity, although not its funding for this second group; it is consistent in the use of the resources that belong to affiliated workers.
With the aim of having a balance between risk and profitability, subject to its social role, the Infonavit seeks to strengthen the granting of loans, the collection of these and to accelerate the recovery and sale of abandoned housing units. In credit origination, the Infonavit will focus on households in arrears, thereby reducing undesirable uses, and on the problem of uninhabited housing. With regard to Personalized Counseling (API for its Spanish initials), this will play a fundamental role in assigning specific products that improve credit quality.
On the other hand, through the rehabilitation of the environment, the idea is to solve the problem of uninhabited or abandoned housing. In its 2012 Financing and Work Plan, the Infonavit mentions an initiative to reassign housing to comply with this objective. However, the development of land banks could be an instrument that supports this task in an efficient manner in the overall housing market (see section 3.b “The land banks: a little used financing model”).
This matter is of particular importance, since the Infonavit is implementing corrective measures with regard to the deterioration of its loan portfolio as a result of the 2008 crisis and to prevent a greater deterioration of its mortgage loan portfolio in the face of new economic conditions. For example, the Infonavit estimates that in some years, 33% of workers could be in a special regime of amortization, a situation where the workers have already concluded the 12-month extension phase to make amortizations.1 The impact of these measures also directly affects workers’ well-being, since a healthier portfolio allows the resources destined for preventive reserves to be redirected toward the earnings of the housing sub-account. The Infonavit estimates that by the year 2013, it will achieve its capital objective.
Graph 61 Graph 62
0
4
8
12
16
2003 2004 2005 2006 2007 2008 2009 2010 2011
IMOR (including extension) IMOR
0
4
8
12
16
2003 2004 2005 2006 2007 2008 2009 2010 2011
Banks Sofoles
Note: “IMOR with extension” includes qualified as well as extended portfolioSource: BBVA Research with Infonavit data
Source: BBVA Research with Banco de México data
1 It should be considered that if 33% of workers are in the special amortization regime, this does not imply that 33% of the loan portfolio is past due. This is due to the fact that workers in this situation tend to have incomes lower than four minimum wages and their loans are lower on average.

Real Estate Outlook Mexico
Page 42
2 Although the problem of uninhabited housing in Mexico is still not considered serious (14% of the total number of units, according to the Population and Housing Census of 2010); according to Infonavit figures, abandoned housing units could be up to 40% in cases of portfolios with greater collection problems.
According to the measure of success of the work of the Infonavit, ensuring the quality both of housing as well as the life of workers will have an impact on their well-being. To this end, the Infonavit bases the measurement of social balance on three factors: quality of life, net worth and environmental impact.
The first item is measured through the Index of the Quality of Life Linked to Housing (ICVV for Índice de Calidad de Vida Vinculado a la Vivienda), which was designed with the help of experts on the matter and with the results of the surveys applied to its affiliates. One of the first conclusions of the application of the ICVV is that its greatest effect is seen in households with a housing lag. Together with this, making workers the owners of their homes, as well as being able to expand them according to their family needs, are factors that contribute in a positive manner to their quality of life. On the contrary, the inadequate location of their home and the absence of some important public services for Infonavit affiliates reduce the quality. With the aim of improving this situation, the Infonavit proposes in its strategic agenda to redesign the scheme of quality assurance of the housing units, as well as limiting the financing of housing that obtains less than 75 points in the Qualitative Evaluation of Housing and its Environment (the ECUVE). Although it is also true that the provision of public services is associated with urban development by the authorities, and this is not the responsibility of the Infonavit, this could be influenced through financing favoring developments that have such services. The search for the improvement of social well-being would also have implications on the health of the Infonavit portfolio, since increasing the quality of housing,as projected in this strategic agenda, would inhibit the abandonment of housing units.2
As regards equity value or net worth, the measurement is done through the replacement rate. Its application shows that the improved scenario for Infonavit affiliates is to acquire housing and inhabit it, whereas the worst option is to acquire housing and not inhabit it. Therefore, actions aimed at discouraging the abandonment of housing units will be those that generate greater results in terms of equity value, actions that are again focused on having public services. On the other hand, the strategy to reduce the environmental impact is limited to the green mortgage program. These types of mortgages seek to motivate the use of ecotechnology, which could reduce water consumption by up to 52%, as well as carbon dioxide (CO2) emissions. Nevertheless, the absence of specific actions that generate incentives for developers could reduce the possibility of success regarding this point on the agenda.
In recognition of the importance of its role in the market, the Infonavit has as one of its objectives to increase its participation in the coordination of public policies on housing, mainly in those concerning urban development. This is a task that will have repercussions on the rest of the strategic agenda.
Regarding this matter, the actions are focused on ensuring that the subsidies are directed to those workers with the greatest need for housing and which will have a greater impact on their quality of life. As well as establishing a market credit model for workers with an income greater than four minimum wages, while those workers that have lower incomes will be granted a social benefit loan. On the other hand, the development of its own policies that allow for the proper management of the resources of the National Housing Fund, and, if such is the case, of the liquidity surplus, in order to obtain better returns for the savings of the workers.

Real Estate Outlook Mexico
Page 43
Finally, although it is not part of the 2012-2016 Financial Plan, we approach the subject of the reform to the Infonavit Law, which was approved the previous month. Probably, the change with the greatest impact would be the eighth transitory article which will now permit workers to obtain the balance of the housing sub-account 97 without having to go through a legal process. In this manner, this is limited to an administrative process with the Infonavit, eliminating the expense associated with the previous method, which was in detriment of the workers’ net worth.
The modification of article 43 grants the Infonavit more options for the investment of surplus resources, which could be generated with the reduction of the demand for housing once the housing lag is reduced, as established by the strategic agenda. With this, the opportunity to meet the objective of granting better returns is a possibility, and now has an additional instrument.
On the other hand, two changes could spur the growth of the number of mortgages granted by the Infonavit. The change to article 44 that would allow offering workers loans in pesos, which could diminish the perception of a mortgage with a growing balance and its effect on uninhabited housing, and even a reduction in credit risk. Also, the modification of article 47 will make it possible for workers that have liquidated their loans to have access to a second mortgage. Although it is still early to know the exact impact on the number of loans, undoubtedly the contribution will be positive.
In this financial plan, the Infonavit reveals the strategy to address the immediate concern regarding the increase in the quantity and quality of housing demand, as well as attending to a probable deterioration in the quality of the loan portfolio. Nevertheless, the strategies set forth are not limited to attending housing needs and the balance between risk and return of its portfolio. This financial plan sets forth a greater participation in the market and in public policies by the Infonavit. In this new scope, which even requires a new implementation in its definition of success, social well-being plays an important role. However, this reaction is not free, but also depends on the problems that are observed regarding uninhabited housing units and the deterioration of the loan portfolio. For this reason, the Infonavit seeks to have an impact on the policies of urban design, which will offer workers the public services necessary to maintain their units inhabited and provide greater incentives to continue paying for them.
Compliance with this strategic agenda requires organizational advancement both internally as well as in the role it plays with the rest of the public and private actors. Although this is not an element that is mentioned in the financial plan, formalizing the technical professionalization of the Infonavit will be a priority task. This proposal is justified based on the achievements of this past decade and the implementation of the agenda itself, which has been planned for the medium term. This will allow making use of past experience and reducing the learning costs and its impact on the industry, but above all on the well-being of the households formed by the workers affiliated in the Infonavit.
Finally, the Infonavit now has some additional tools that will help to meet the strategic agenda: the reform of the Infonavit Law. The changes made by Congress, have a direct impact on the topics that the diagnosis of the financial plan signals as relevant and provides room for attention.

Real Estate Outlook Mexico
Page 44
4. Statistical AppendixChart 19
2002 2003 2004 2005 2006 2007 2008 2009 2010 2011p 2012*
3.8 3.3
Private consumption, real (annual % change) 4.0 3.5
Government consumption, real (annual % change) 3.4 3.6
Investment in construction, real (annual % change) 3.8 4.0
Residential 4.5 4.3
Non-residential 3.4 3.9
Formal private empl. (IMSS)2, total 14,985 15,416
Annual % changel 4.0 2.9
Avge. salary of cont. (IMSS, nominal pesos per day, avge.)
Annual % changel
Real total wages (IMSS, annual % change)
Minimum general salary (daily, nominal pesos) 58.06 59.82
% real annual change 1.0 0.9
Consumer prices (end of period, annual % change) 3.4 3.5
TIIE 28 average (%) 4.5 4.0
10-year interest rate, 10 year Govt bond (M10) 6.5 6.4
p. Forecast from the date indicated.* Review stage.1 Seasonally-adjusted series.2 Thousands average persons. Seasonally-adjusted series.Source: BBVA Research with Banco de México, Conasami, INEGI and IMSS data.
Chart 20
2002 2003 2004 2005 2006 2007 2008 2009 2010 2011p 2012*
5.1 3.8
Building 4.7 3.5
Civil engineering and major works 5.2 3.9
Specialist construction work 6.5 5.5
Annual % change
Building
Public works
Water, irrigation and sanitation
Electricity and communications
Transportation
Oil and petrochemicals
Other
Construction materials (annual % change)
Labor (annual % change)
Rental equipment (annual % change)3 613 640
p. Forecast from the date indicated.* Scenario in review.1 Seasonally-adjusted series.2 Considered affiliates and nonaffiliates to the Mexican Chamber of Construction Industry.3 Includes new and used home: INFONAVIT, FOVISSSTE, Banking and Sofoles (considers reduction for co-financig).Source: BBVA Research with Banco de México, Conasami, Inegi, IMSS and AHM data.

Real Estate Outlook Mexico
Page 45
Chart 21
2001 2002 2003 2004 2005 2006 2007 2008 2009 2010 2011*
Total
Infonavit
Fovissste
Commercial banks and Sofoles
Reduction1
Equivalent purchases
Total
Infonavit
Fovissste
Banca comercial y Sofoles
End of period balance (billion pesos)
Past-due loans index (%)1 Refers to finance (loans and subsidies) counted in two or more institutions.*November figures.Source: BBVA Research with Banco de México, CNBV, Conavi, Asociación Hipotecaria Mexicana (AHM) and ABM data.
Chart 22
08’III IV 09'I II III IV 10'I II III IV 11'I II IIINacional 5.3 5.7 4.9 2.4 2.0 3.6 3.1 6.1 7.4 4.6 6.0 4.7 4.5Aguascalientes
Baja California
Baja California Sur
Campeche
Chiapas
Chihuahua
Coahuila
Colima
Distrito Federal
Durango
Guanajuato
Guerrero
Hidalgo
Jalisco
Mexico
Michoacen
Morelos
Nayarit
Nuevo Leon
Oaxaca
Puebla
Queretaro
Quintana Roo
Sinaloa
San Luis Potosi
Sonora
Tabasco
Tamaulipas
Tlaxcala
Veracruz
Yucatan
Zacatecas
Source: BBVA Research with Sociedad Hipotecaria Federal (SHF) (Federal Mortgage Society) data.

Real Estate Outlook Mexico
Page 46
Chart 23
08’III IV 09'I II III IV 10'I II III IV 11'I II III
Real private consumption, (annual % change)
Real government consumption, (ann. % change)
Real const. investment, (annual % change)
Residential
Non-residential
Source: BBVA Research with INEGI, and Banco de México data
Chart 24
08’III IV 09'I II III IV 10'I II III IV 11'I II III
Building
Construction engineering and major works
Specialist const. work
Construction companies2 (annual % change)
Building
Public works
Water, irrigation and sanitation
Electricity & communications
Transportation
Oil and petrochemicals
Other
Source: BBVA Research with INEGI, and Banco de México data
Chart 25
08’III IV 09'I II III IV 10'I II III IV 11'I II III3
Segment A
Segment B
Segment C
Segment D
Segment E
Total
Infonavit
Fovissste
Banca
Sofoles
Total
Annual % change
Source: BBVA Research with Banco de México, Conavi, Asociación Hipotecaria Mexicana (AHM) and Asociación Mexicana de Bancos (ABM) data.
Chart 26
Past-due loans index (%)1 Seasonally-adjusted series.2 Consider the value of production of companies which are affiliated and not affiliated to the Mexican Chamber of Construction Industry.Note: Price ranges expressed in multiples of minimum monthly wage (mmwt); “A” (118-200); “B” (201-350); “C” (351-750), “D” (751-1500) and “E” (1500 and over) SMM=1,819 pesos in 2011 in zona “A”.3 Includes new and used home: INFONAVIT, FOVISSSTE, Banking and Sofoles (considers reduction for co-financig).Source: BBVA Research with INEGI, and Banco de México data.
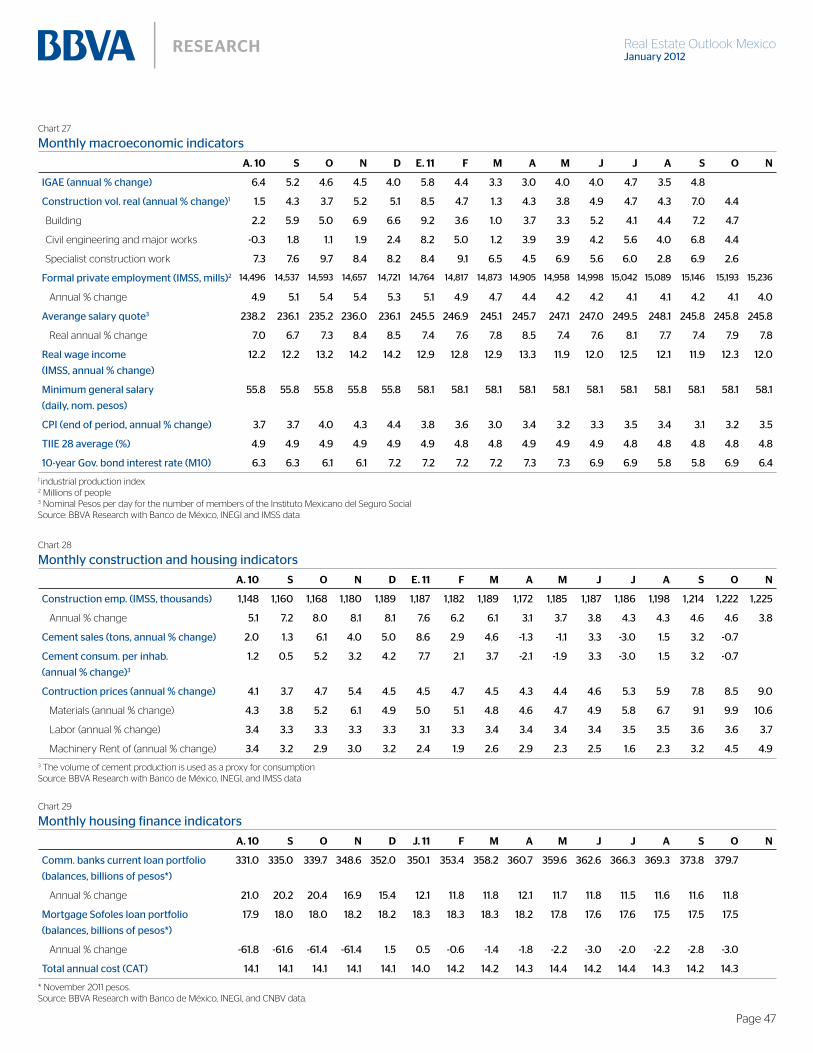
Real Estate Outlook Mexico
Page 47
Chart 27
A. 10 S O N D E. 11 F M A M J J A S O N
Building
Civil engineering and major works
Specialist construction work
Annual % change
3
Real annual % change
1 industrial production index2 Millions of people3 Nominal Pesos per day for the number of members of the Instituto Mexicano del Seguro Social Source: BBVA Research with Banco de México, INEGI and IMSS data
Chart 28
A. 10 S O N D E. 11 F M A M J J A S O N
Annual % change
3
Materials (annual % change)
Labor (annual % change)
Machinery Rent of (annual % change)
3 The volume of cement production is used as a proxy for consumptionSource: BBVA Research with Banco de México, INEGI, and IMSS data
Chart 29
A. 10 S O N D J. 11 F M A M J J A S O N
Annual % change
Annual % change
* November 2011 pesos.Source: BBVA Research with Banco de México, INEGI, and CNBV data.

Real Estate Outlook Mexico
Page 48
5. Special topics included in previous issues
Violence and the housing market in MexicoResults of the 2010 Population and Housing CensusUninhabited housing in Mexico according to the 2010 CensusThe BBVA housing price index
The impact of subsidies on the housing marketThe implications for the housing industry from the Infonavit Financial Plan 2011-2015Land property policies: the property tax as an instrument for urban development
Ten years of housing policy: the large numbersHas the lag in housing been overcome?The impact of housing policy on the cities
Construction loans in 2010: A bottleneck for the housing industry once more?What has determined the behavior of housing prices in Mexico?
Constitution of urban land in MexicoLong-term finance: covered bonds
Major urban and sustainable social housing developersThe carbon bond market
Government subsidies for housingIndirect costs of purchases
Insurance for housing creditExcess housing supply? Is that all it is?
The real-estate market for baby boomersThe national housing law
Housing demandInfrastructure and real-estate investment trusts (REITs)
An overview of the 2nd population and housing survey 2005The Habitat index
Mortgage sofoles: development and importanceHousing and finance in Mexico
Real Estate Outlook Mexico
DISCLAIMER
This document and the information, opinions, estimates and recommendations expressed herein, have been prepared by Banco Bilbao Vizcaya Argentaria, S.A. (hereinafter called “BBVA”) to provide its customers with general information regarding the date of issue of the report and are subject to changes without prior notice. BBVA is not liable for giving notice of such changes or for updating the contents hereof.
This document and its contents do not constitute an offer, invitation or solicitation to purchase or subscribe to any securities or other instruments, or to undertake or divest investments. Neither shall this document nor its contents form the basis of any contract, commitment or decision of any kind.
Investors who have access to this document should be aware that the securities, instruments or investments to which it refers may not be appropriate for them due to their specific investment goals, financial positions or risk profiles, as these have not been taken into account to prepare this report. Therefore, investors should make their own investment decisions considering the said circumstances and obtaining such specialized advice as may be necessary. The contents of this document is based upon information available to the public that has been obtained from sources considered to be reliable. However, such information has not been independently verified by BBVA and therefore no warranty, either express or implicit, is given regarding its accuracy, integrity or correctness. BBVA accepts no liability of any type for any direct or indirect losses arising from the use of the document or its contents. Investors should note that the past performance of securities or instruments or the historical results of investments do not guarantee future performance.
The market prices of securities or instruments or the results of investments could fluctuate against the interests of investors. Investors should be aware that they could even face a loss of their investment. Transactions in futures, options and securities or high-yield securities can involve high risks and are not appropriate for every investor. Indeed, in the case of some investments, the potential losses may exceed the amount of initial investment and, in such circumstances, investors may be required to pay more money to support those losses. Thus, before undertaking any transaction with these instruments, investors should be aware of their operation, as well as the rights, liabilities and risks implied by the same and the underlying stocks. Investors should also be aware that secondary markets for the said instruments may be limited or even not exist.
BBVA or any of its affiliates, as well as their respective executives and employees, may have a position in any of the securities or instruments referred to, directly or indirectly, in this document, or in any other related thereto; they may trade for their own account or for third-party account in those securities, provide consulting or other services to the issuer of the aforementioned securities or instruments or to companies related thereto or to their shareholders, executives or employees, or may have interests or perform transactions in those securities or instruments or related investments before or after the publication of this report, to the extent permitted by the applicable law.
BBVA or any of its affiliates´ salespeople, traders, and other professionals may provide oral or written market commentary or trading strategies to its clients that reflect opinions that are contrary to the opinions expressed herein. Furthermore, BBVA or any of its affiliates’ proprietary trading and investing businesses may make investment decisions that are inconsistent with the recommendations expressed herein. No part of this document may be (i) copied, photocopied or duplicated by any other form or means (ii) redistributed or (iii) quoted, without the prior written consent of BBVA. No part of this report may be copied, conveyed, distributed or furnished to any person or entity in any country (or persons or entities in the same) in which its distribution is prohibited by law. Failure to comply with these restrictions may breach the laws of the relevant jurisdiction.
This document is provided in the United Kingdom solely to those persons to whom it may be addressed according to the Financial Services and Markets Act 2000 (Financial Promotion) Order 2001 and it is not to be directly or indirectly delivered to or distributed among any other type of persons or entities. In particular, this document is only aimed at and can be delivered to the following persons or entities (i) those outside the United Kingdom (ii) those with expertise regarding investments as mentioned under Section 19(5) of Order 2001, (iii) high net worth entities and any other person or entity under Section 49(1) of Order 2001 to whom the contents hereof can be legally revealed.
The remuneration system concerning the analyst/s author/s of this report is based on multiple criteria, including the revenues obtained by BBVA and, indirectly, the results of BBVA Group in the fiscal year, which, in turn, include the results generated by the investment banking business; nevertheless, they do not receive any remuneration based on revenues from any specific transaction in investment banking.
BBVA and the rest of entities in the BBVA Group which are not members of the New York Stock Exchange or the National Association of Securities Dealers, Inc., are not subject to the rules of disclosure affecting such members.
“BBVA is subject to the BBVA Group Code of Conduct for Security Market Operations which, among other regulations, includes rules to prevent and avoid conflicts of interests with the ratings given, including information barriers. The BBVA Group Code of Conduct for Security Market Operations is available for reference at the following web site: www.bbva.com / Corporate Governance”.

Real Estate Outlook Mexico
Adolfo AlboFernando GonzalezOciel HernandezCarlos A. HerreraAngel Muñoz
Toward the Strengthening of thePension Systems in Mexico:Vision and Reform Proposals
Pension Studies
Group Chief Economist
Chief Economists & Chief Strategists:
Financial System and Regulation
Pensions
Financial Systems
Regulatory Affairs
Developed Economies:
Spain
Europe
United States
Market & Client Strategy:
Equity and Credit
Interest Rates, Currencies and Commodities
Asset Management
Financial Scenarios
Economic Scenarios
Emerging Economies:
Cross-Country Emerging Markets Analysis
Mexico
Macro Analysis Mexico
Asia
South America
Argentina
Chile
Colombia
Peru
Venezuela
Editor
[email protected] [email protected] [email protected] [email protected]