Embed Size (px)
Citation preview

Real Estate Portfolio Overview
THIRD QUARTER 2014
Disclosure
• Trade Secret and Confidential
• Past performance is not indicative of future results
• Investing involves risk, including the possible loss of principal
• Returns are presented on a time weighted basis and shown both gross and net of underlying third party fees and expenses and may include income, appreciation and/or other earnings. In addition, investment level Net IRR’s and equity multiples are reported
• The Townsend Group, on behalf of its client base, collects quarterly limited partner/client level performance data based upon inputs from the underlying investment managers. Data collection is for purposes of calculating investment level performance as well as aggregating and reporting client level total portfolio performance. Quarterly limited partner/client level performance data is collected directly1 from the investment managers via a secure data collection site
1In select instances where underlying investment managers have ceased reporting limited partner/client level performance data directly to The Townsend Group via a secure data collection site, The Townsend Group may choose to input performance data on behalf of its client based upon the investment managers quarterly capital account statements which are supplied to The Townsend Group and the client alike
2
Disclosures

I. Real Estate and Real Assets Market Overview II. Chicago Teachers’ Results Exhibit A: Performance Measurement Flash Report (as of Third Quarter 2014)
Exhibit B: Watch List Update
Exhibit C: Glossary of Terms
3
Agenda
I. Real Estate and Real Assets Market Overview
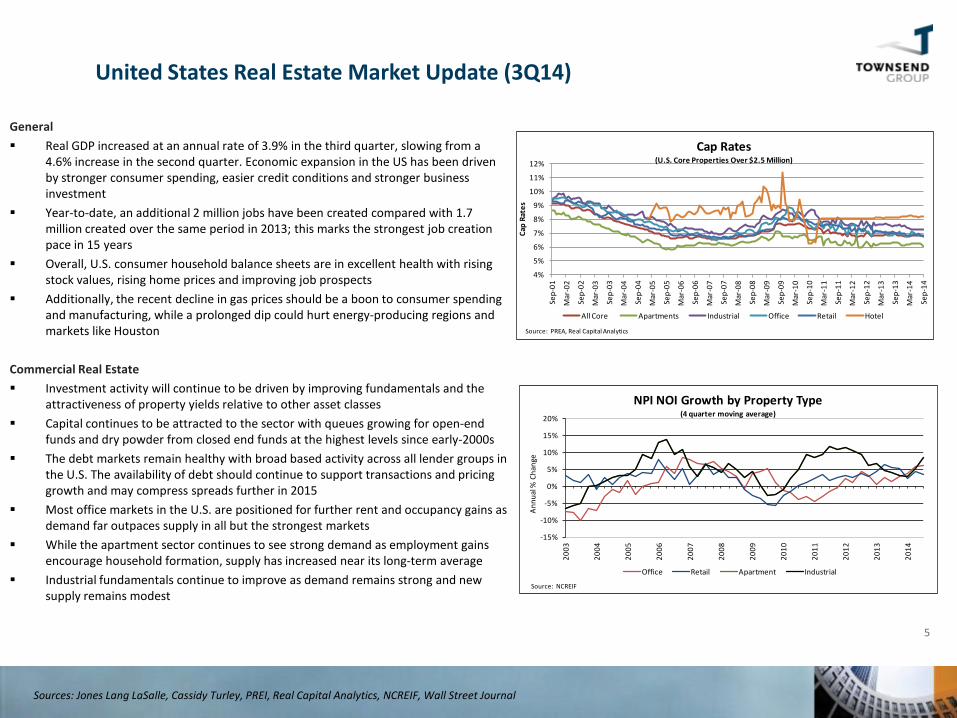
General Real GDP increased at an annual rate of 3.9% in the third quarter, slowing from a
4.6% increase in the second quarter. Economic expansion in the US has been driven by stronger consumer spending, easier credit conditions and stronger business investment
Year-to-date, an additional 2 million jobs have been created compared with 1.7 million created over the same period in 2013; this marks the strongest job creation pace in 15 years
Overall, U.S. consumer household balance sheets are in excellent health with rising stock values, rising home prices and improving job prospects
Additionally, the recent decline in gas prices should be a boon to consumer spending and manufacturing, while a prolonged dip could hurt energy-producing regions and markets like Houston
Commercial Real Estate Investment activity will continue to be driven by improving fundamentals and the
attractiveness of property yields relative to other asset classes Capital continues to be attracted to the sector with queues growing for open-end
funds and dry powder from closed end funds at the highest levels since early-2000s The debt markets remain healthy with broad based activity across all lender groups in
the U.S. The availability of debt should continue to support transactions and pricing growth and may compress spreads further in 2015
Most office markets in the U.S. are positioned for further rent and occupancy gains as demand far outpaces supply in all but the strongest markets
While the apartment sector continues to see strong demand as employment gains encourage household formation, supply has increased near its long-term average
Industrial fundamentals continue to improve as demand remains strong and new supply remains modest
United States Real Estate Market Update (3Q14)
Sources: Jones Lang LaSalle, Cassidy Turley, PREI, Real Capital Analytics, NCREIF, Wall Street Journal
5
4%
5%
6%
7%
8%
9%
10%
11%
12%
Sep-
01
Mar
-02
Sep-
02
Mar
-03
Sep-
03
Mar
-04
Sep-
04
Mar
-05
Sep-
05
Mar
-06
Sep-
06
Mar
-07
Sep-
07
Mar
-08
Sep-
08
Mar
-09
Sep-
09
Mar
-10
Sep-
10
Mar
-11
Sep-
11
Mar
-12
Sep-
12
Mar
-13
Sep-
13
Mar
-14
Sep-
14
Cap
Rate
s
Cap Rates (U.S. Core Properties Over $2.5 Million)
All Core Apartments Industrial Office Retail Hotel
Source: PREA, Real Capital Analytics
-15%
-10%
-5%
0%
5%
10%
15%
20%
2003
2004
2005
2006
2007
2008
2009
2010
2011
2012
2013
2014
Annu
al %
Cha
nge
NPI NOI Growth by Property Type(4 quarter moving average)
Office Retail Apartment Industrial
Source: NCREIF

• General market recovery has been steady, but overall real estate values remain below peak reached in mid 2000s
• Values have recovered approximately 72% of losses incurred since the peak
6
United States Real Estate Performance Summary – 3Q14
-35%
-30%
-25%
-20%
-15%
-10%
-5%
0%
Peak to TroughCore Property Values
Appreciation (NCREIF Property Index)
-31% from peak 32%
Recovery to date
0.0%
2.0%
4.0%
6.0%
8.0%
10.0%
12.0%
14.0%
One Year Return Three Year Return Five Year Return Ten Year Return
12.4
%
12.3
%
12.4
%
7.1%
5.0%
8.9%
7.0%
5.9%
5.8%
11.0
%
11.5
%
13.9
%
Private Market Real Estate Performance(Gross Returns as of September 30, 2014)
NFI-ODCE Value Weighted Index Townsend Value-Added Funds Townsend Opportunistic Funds
1 Year Gross Return
3 Year Gross Return
5 Year Gross Return
10 Year Gross Return
NFI-ODCE Value Weighted Index 12.40% 12.34% 12.40% 7.14%Townsend Value-Added Funds 5.02% 8.88% 6.97% 5.93%Townsend Opportunistic Funds 5.82% 10.97% 11.52% 13.87%
Sources: NCREIF, Townsend
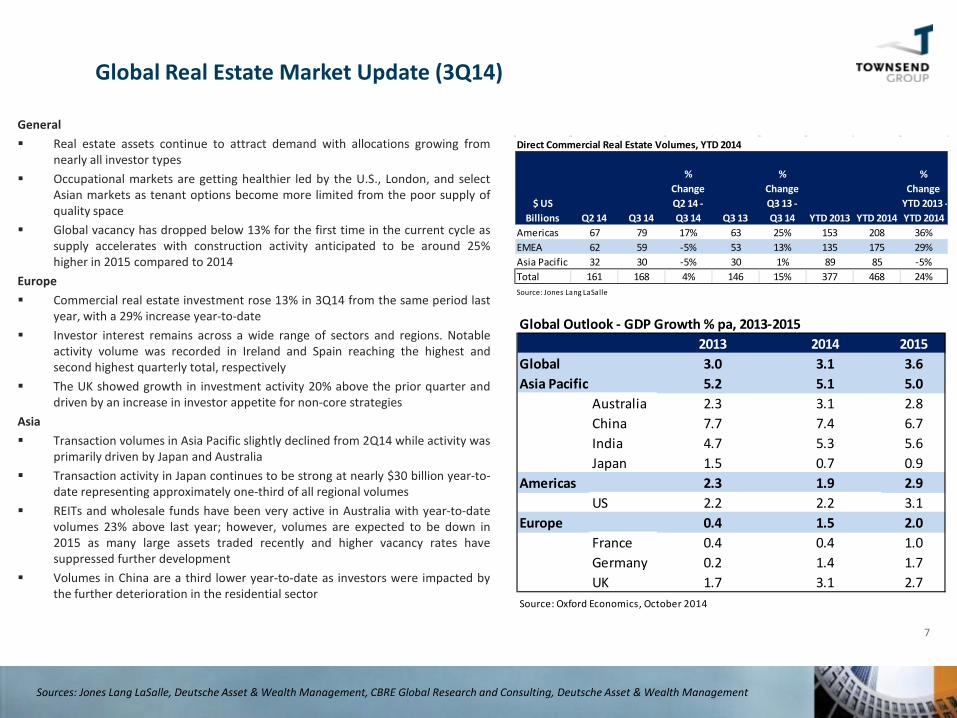
General Real estate assets continue to attract demand with allocations growing from
nearly all investor types Occupational markets are getting healthier led by the U.S., London, and select
Asian markets as tenant options become more limited from the poor supply of quality space
Global vacancy has dropped below 13% for the first time in the current cycle as supply accelerates with construction activity anticipated to be around 25% higher in 2015 compared to 2014
Europe Commercial real estate investment rose 13% in 3Q14 from the same period last
year, with a 29% increase year-to-date Investor interest remains across a wide range of sectors and regions. Notable
activity volume was recorded in Ireland and Spain reaching the highest and second highest quarterly total, respectively
The UK showed growth in investment activity 20% above the prior quarter and driven by an increase in investor appetite for non-core strategies
Asia Transaction volumes in Asia Pacific slightly declined from 2Q14 while activity was
primarily driven by Japan and Australia Transaction activity in Japan continues to be strong at nearly $30 billion year-to-
date representing approximately one-third of all regional volumes REITs and wholesale funds have been very active in Australia with year-to-date
volumes 23% above last year; however, volumes are expected to be down in 2015 as many large assets traded recently and higher vacancy rates have suppressed further development
Volumes in China are a third lower year-to-date as investors were impacted by the further deterioration in the residential sector
Global Real Estate Market Update (3Q14)
Sources: Jones Lang LaSalle, Deutsche Asset & Wealth Management, CBRE Global Research and Consulting, Deutsche Asset & Wealth Management
7
Global Outlook - GDP Growth % pa, 2013-20152013 2014 2015
Global 3.0 3.1 3.6Asia Pacific 5.2 5.1 5.0
Australia 2.3 3.1 2.8China 7.7 7.4 6.7India 4.7 5.3 5.6Japan 1.5 0.7 0.9
Americas 2.3 1.9 2.9US 2.2 2.2 3.1
Europe 0.4 1.5 2.0France 0.4 0.4 1.0Germany 0.2 1.4 1.7UK 1.7 3.1 2.7
Source: Oxford Economics, October 2014
Direct Commercial Real Estate Volumes, YTD 2014
$ US Billions Q2 14 Q3 14
% Change Q2 14 - Q3 14 Q3 13
% Change Q3 13 - Q3 14 YTD 2013 YTD 2014
% Change
YTD 2013 - YTD 2014
Americas 67 79 17% 63 25% 153 208 36%EMEA 62 59 -5% 53 13% 135 175 29%Asia Pacific 32 30 -5% 30 1% 89 85 -5%Total 161 168 4% 146 15% 377 468 24%Source: Jones Lang LaSalle
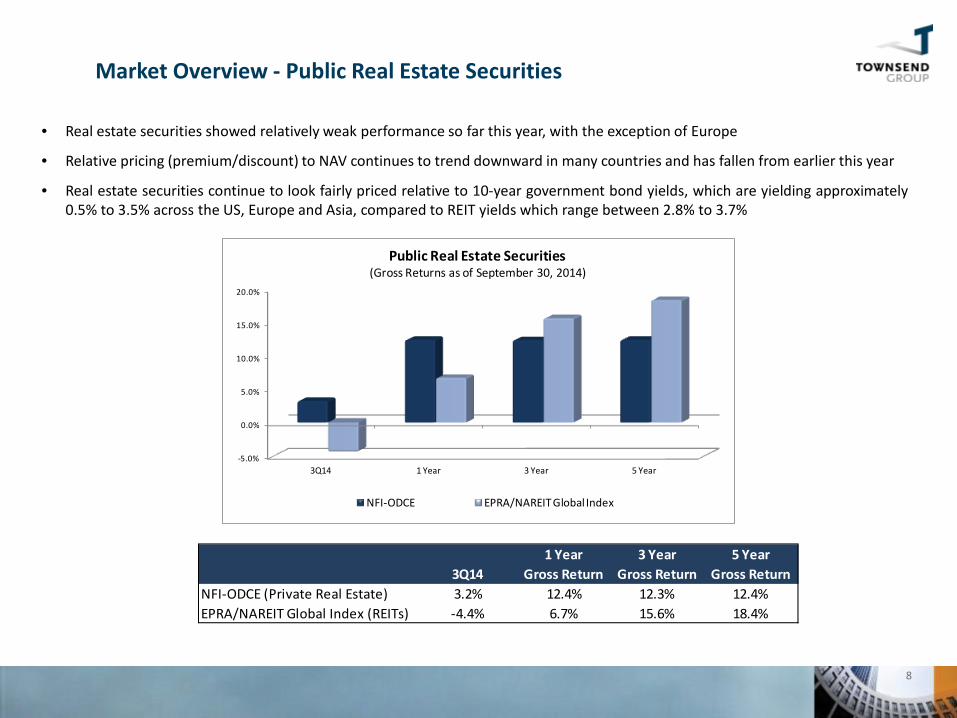
• Real estate securities showed relatively weak performance so far this year, with the exception of Europe
• Relative pricing (premium/discount) to NAV continues to trend downward in many countries and has fallen from earlier this year
• Real estate securities continue to look fairly priced relative to 10-year government bond yields, which are yielding approximately 0.5% to 3.5% across the US, Europe and Asia, compared to REIT yields which range between 2.8% to 3.7%
Market Overview - Public Real Estate Securities
8
-5.0%
0.0%
5.0%
10.0%
15.0%
20.0%
3Q14 1 Year 3 Year 5 Year
Public Real Estate Securities(Gross Returns as of September 30, 2014)
NFI-ODCE EPRA/NAREIT Global Index
3Q141 Year
Gross Return3 Year
Gross Return5 Year
Gross ReturnNFI-ODCE (Private Real Estate) 3.2% 12.4% 12.3% 12.4%EPRA/NAREIT Global Index (REITs) -4.4% 6.7% 15.6% 18.4%

• Infrastructure and other real assets have generally performed well over the periods shown below, fueled by growth in both consumer and investor demand within the space
• Infrastructure returns have been bolstered by strong growth in the energy space, some of which may be reduced by falling oil prices
Market Overview – Infrastructure and Other Real Assets
9
0.0%
5.0%
10.0%
15.0%
20.0%
1 Year 3 Year 5 Year
Other Real Assets Performance(Gross Returns as of September 30, 2014)
Townsend Client Infrastructure Fund Index Equal Weight NCREIF Timberland Index NCREIF Farmland Index
Index1 Year
Gross Return3 Year
Gross Return5 Year
Gross ReturnTownsend Client Infrastructure Fund Index Equal Weight 20.5% 16.1% 14.9%
NCREIF Timberland Index 10.4% 7.4% 3.6%NCREIF Farmland Index 15.5% 18.1% 14.3%

II. Chicago Teachers’ Results
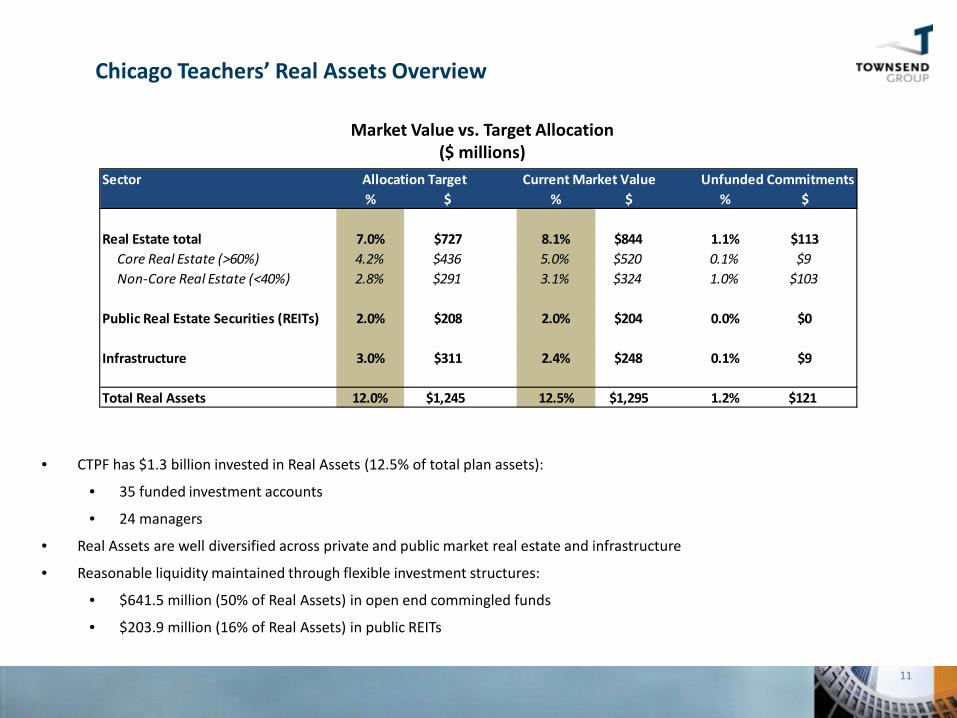
• CTPF has $1.3 billion invested in Real Assets (12.5% of total plan assets):
• 35 funded investment accounts
• 24 managers
• Real Assets are well diversified across private and public market real estate and infrastructure
• Reasonable liquidity maintained through flexible investment structures:
• $641.5 million (50% of Real Assets) in open end commingled funds
• $203.9 million (16% of Real Assets) in public REITs
Market Value vs. Target Allocation ($ millions)
Chicago Teachers’ Real Assets Overview
11
Sector% $ % $ % $
Real Estate total 7.0% $727 8.1% $844 1.1% $113 Core Real Estate (>60%) 4.2% $436 5.0% $520 0.1% $9 Non-Core Real Estate (<40%) 2.8% $291 3.1% $324 1.0% $103
Public Real Estate Securities (REITs) 2.0% $208 2.0% $204 0.0% $0
Infrastructure 3.0% $311 2.4% $248 0.1% $9
Total Real Assets 12.0% $1,245 12.5% $1,295 1.2% $121
Allocation Target Current Market Value Unfunded Commitments
Chicago Teachers’ Total Real Assets Performance
12
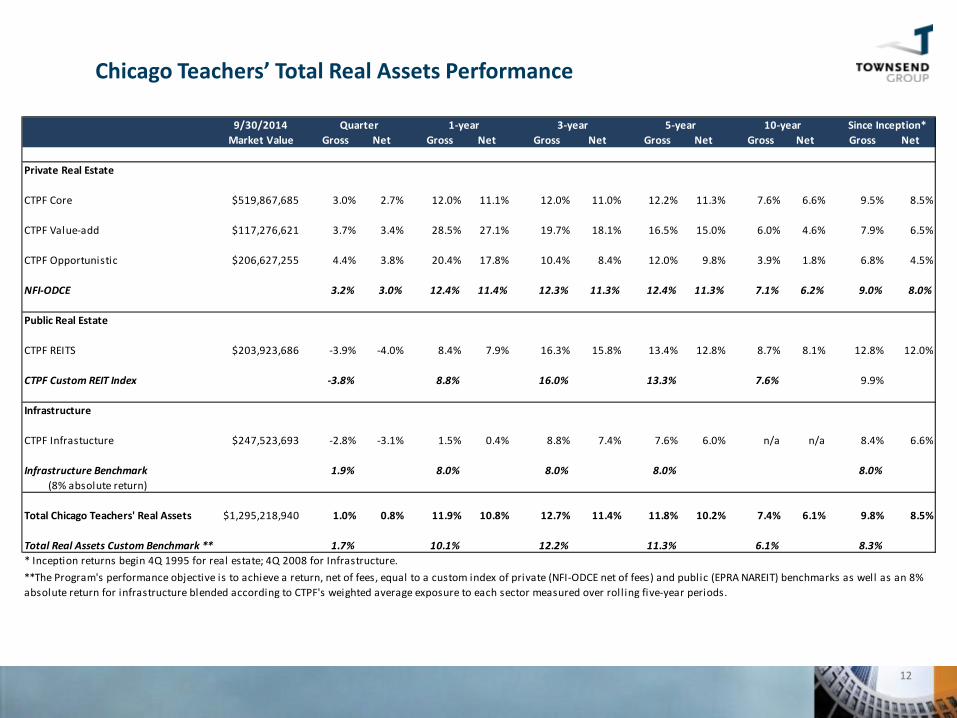
9/30/2014 Quarter 1-year 3-year 5-year 10-year Since Inception*Market Value Gross Net Gross Net Gross Net Gross Net Gross Net Gross Net
Private Real Estate
CTPF Core $519,867,685 3.0% 2.7% 12.0% 11.1% 12.0% 11.0% 12.2% 11.3% 7.6% 6.6% 9.5% 8.5%
CTPF Value-add $117,276,621 3.7% 3.4% 28.5% 27.1% 19.7% 18.1% 16.5% 15.0% 6.0% 4.6% 7.9% 6.5%
CTPF Opportunistic $206,627,255 4.4% 3.8% 20.4% 17.8% 10.4% 8.4% 12.0% 9.8% 3.9% 1.8% 6.8% 4.5%
NFI-ODCE 3.2% 3.0% 12.4% 11.4% 12.3% 11.3% 12.4% 11.3% 7.1% 6.2% 9.0% 8.0%
Public Real Estate
CTPF REITS $203,923,686 -3.9% -4.0% 8.4% 7.9% 16.3% 15.8% 13.4% 12.8% 8.7% 8.1% 12.8% 12.0%
CTPF Custom REIT Index -3.8% 8.8% 16.0% 13.3% 7.6% 9.9%
Infrastructure
CTPF Infrastucture $247,523,693 -2.8% -3.1% 1.5% 0.4% 8.8% 7.4% 7.6% 6.0% n/a n/a 8.4% 6.6%
Infrastructure Benchmark 1.9% 8.0% 8.0% 8.0% 8.0% (8% absolute return)
Total Chicago Teachers' Real Assets $1,295,218,940 1.0% 0.8% 11.9% 10.8% 12.7% 11.4% 11.8% 10.2% 7.4% 6.1% 9.8% 8.5%
Total Real Assets Custom Benchmark ** 1.7% 10.1% 12.2% 11.3% 6.1% 8.3%* Inception returns begin 4Q 1995 for real estate; 4Q 2008 for Infrastructure.**The Program's performance objective is to achieve a return, net of fees, equal to a custom index of private (NFI-ODCE net of fees) and public (EPRA NAREIT) benchmarks as well as an 8% absolute return for infrastructure blended according to CTPF's weighted average exposure to each sector measured over roll ing five-year periods.
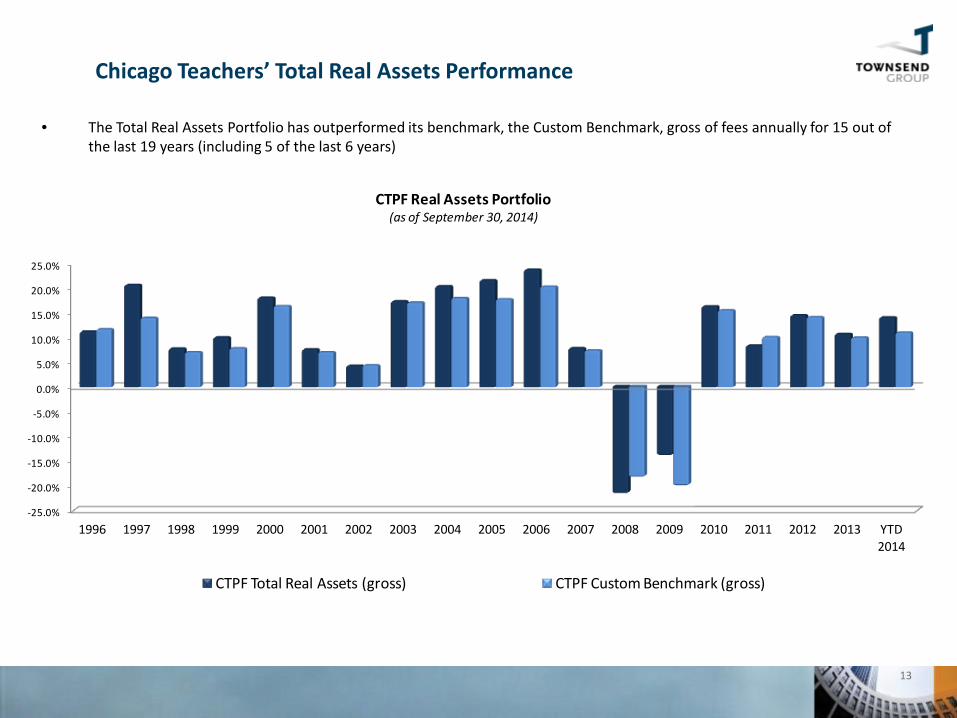
• The Total Real Assets Portfolio has outperformed its benchmark, the Custom Benchmark, gross of fees annually for 15 out of the last 19 years (including 5 of the last 6 years)
Chicago Teachers’ Total Real Assets Performance
13
-25.0%
-20.0%
-15.0%
-10.0%
-5.0%
0.0%
5.0%
10.0%
15.0%
20.0%
25.0%
1996 1997 1998 1999 2000 2001 2002 2003 2004 2005 2006 2007 2008 2009 2010 2011 2012 2013 YTD 2014
CTPF Real Assets Portfolio (as of September 30, 2014)
CTPF Total Real Assets (gross) CTPF Custom Benchmark (gross)
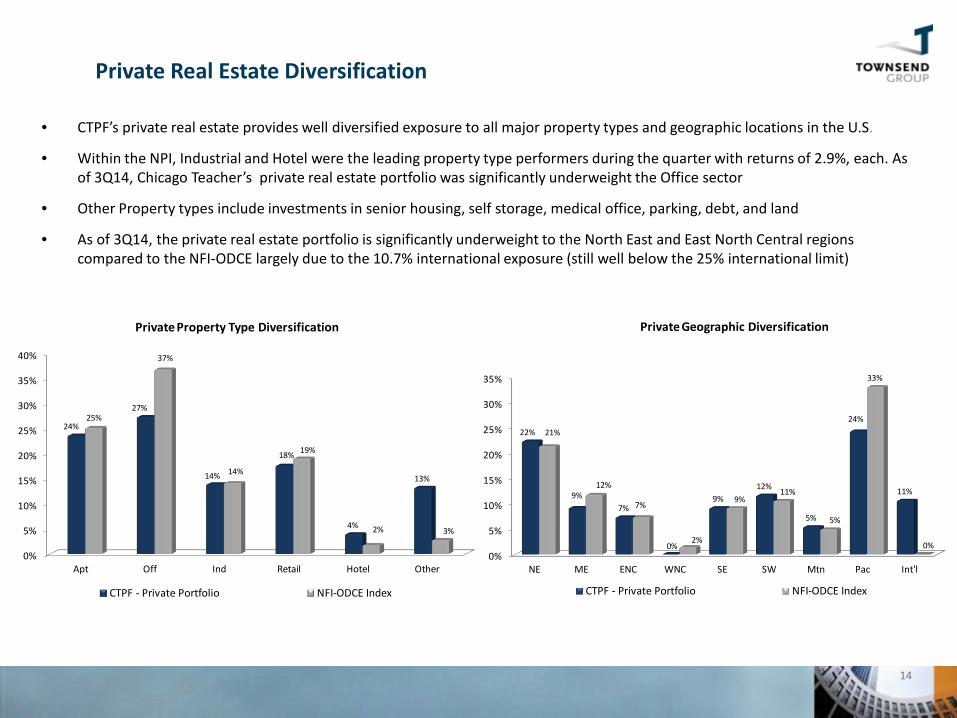
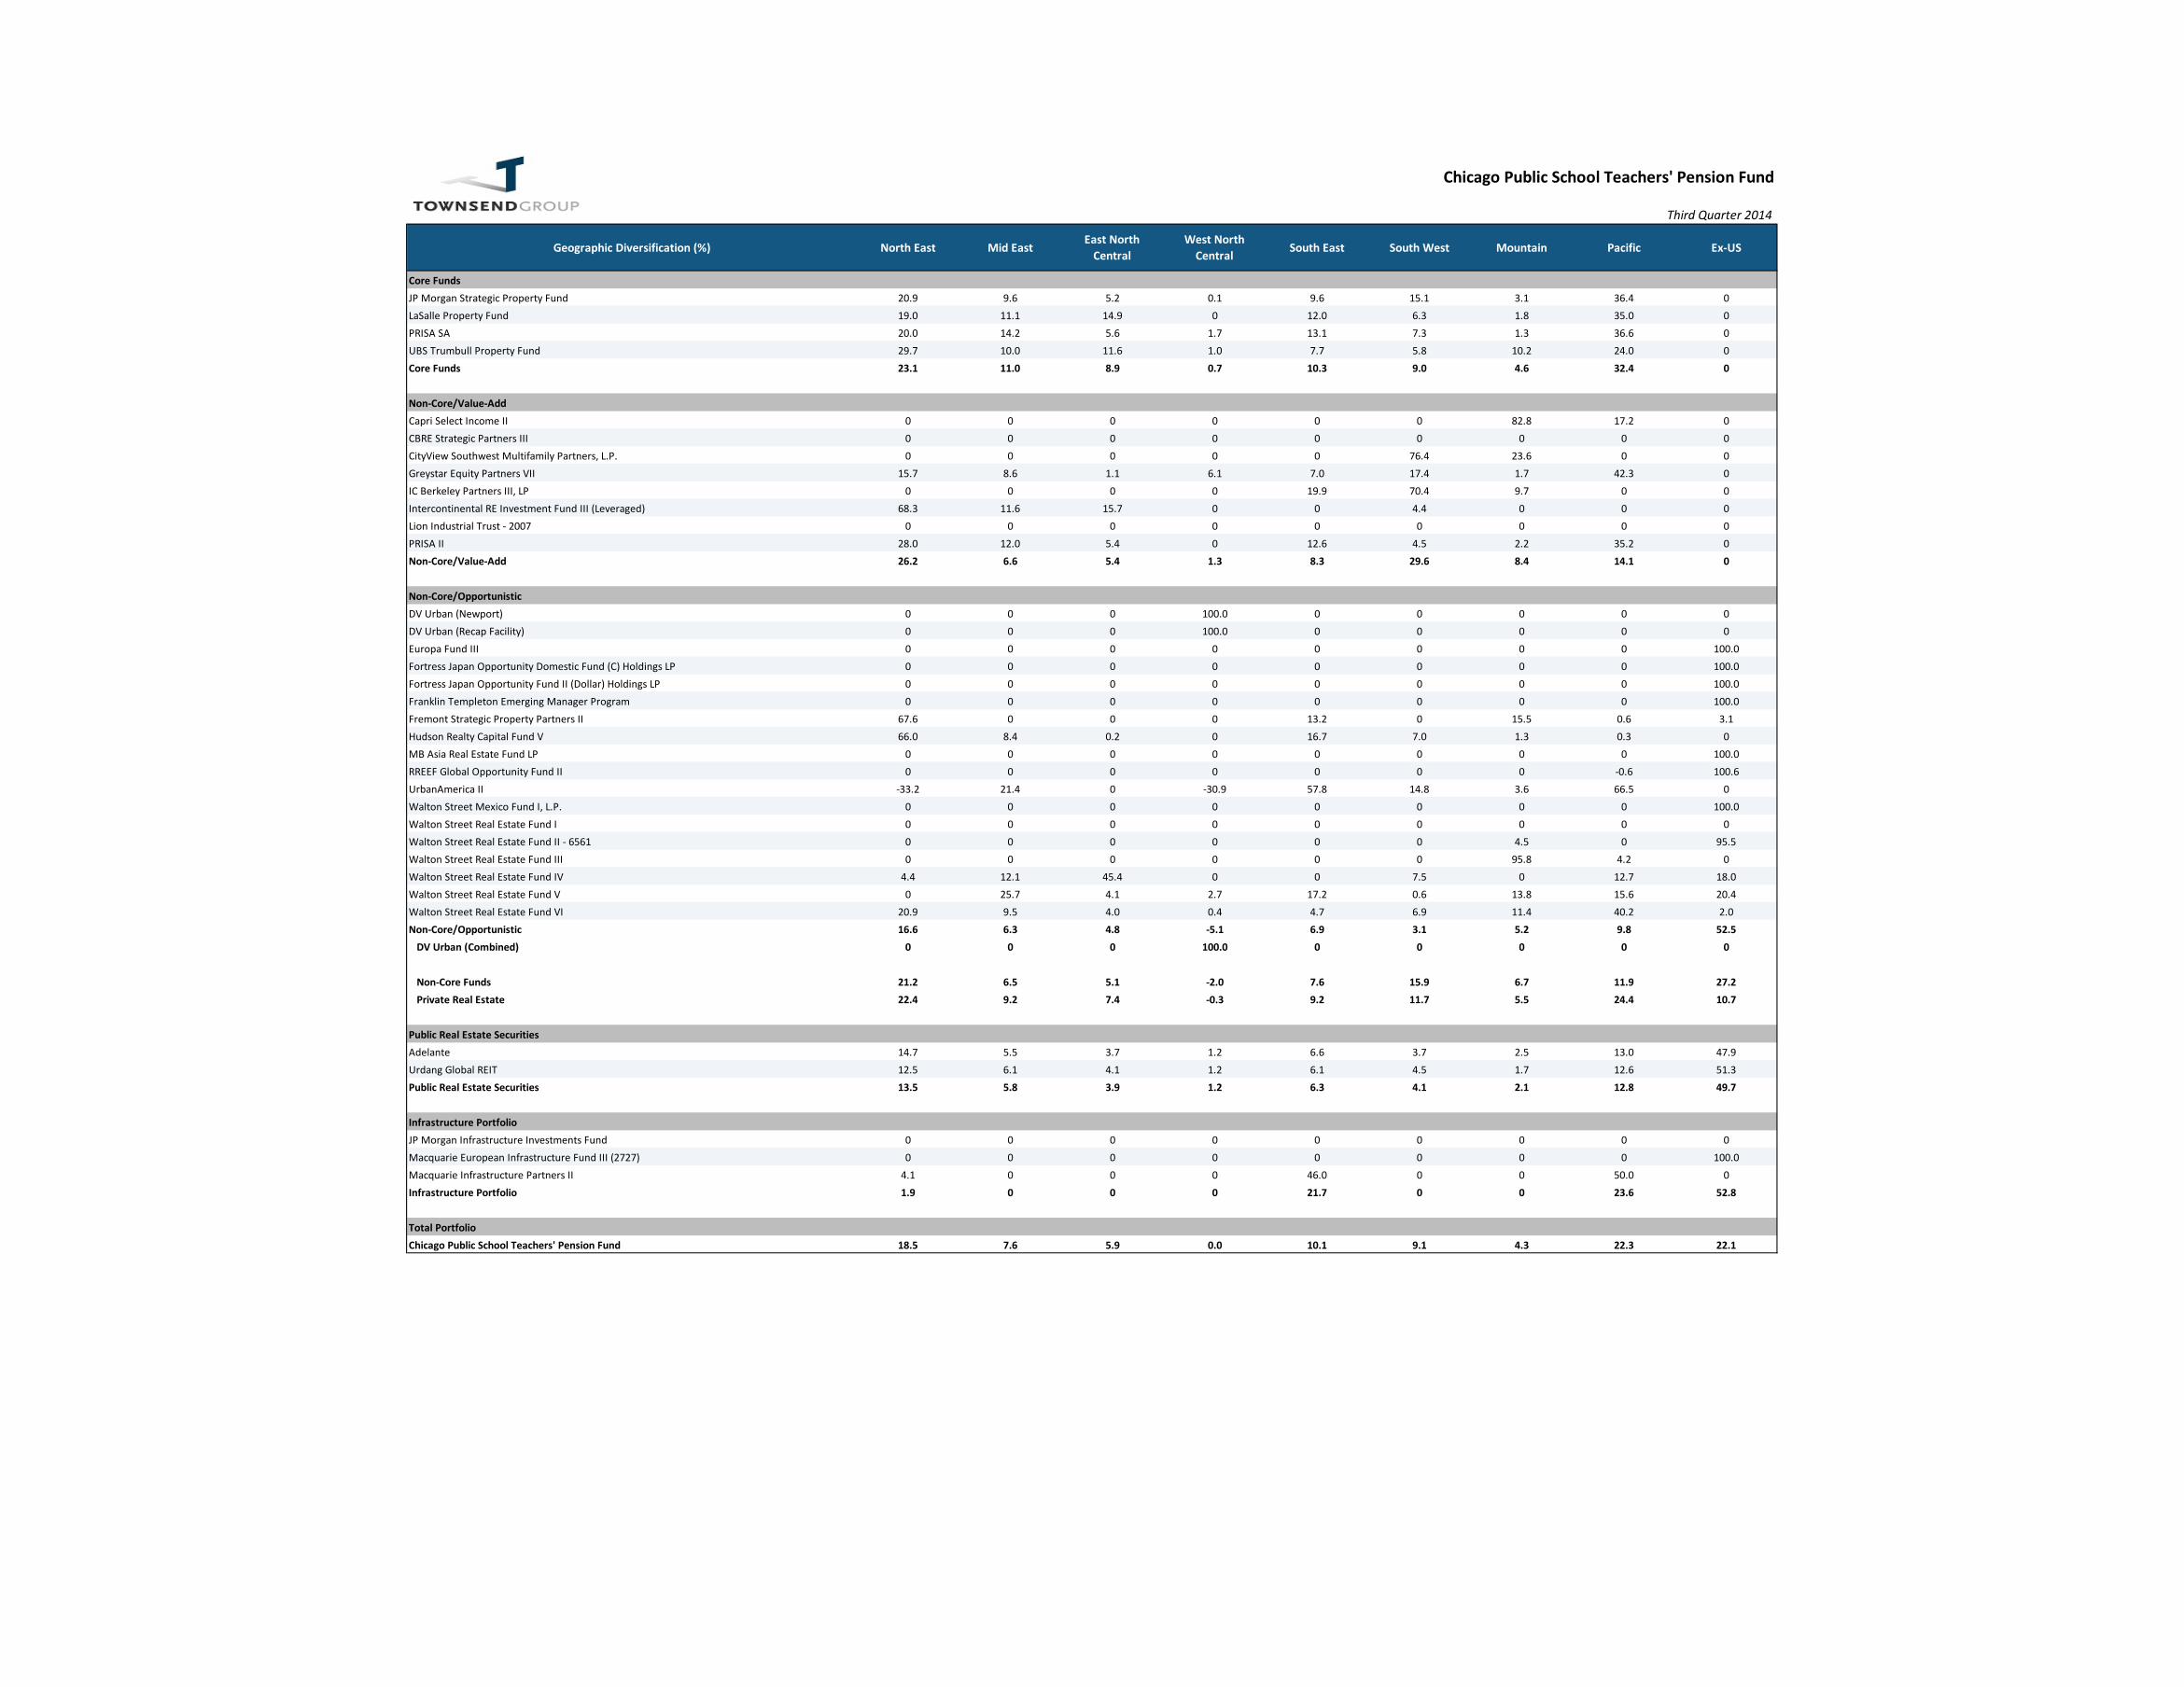
• CTPF’s private real estate provides well diversified exposure to all major property types and geographic locations in the U.S.
• Within the NPI, Industrial and Hotel were the leading property type performers during the quarter with returns of 2.9%, each. As of 3Q14, Chicago Teacher’s private real estate portfolio was significantly underweight the Office sector
• Other Property types include investments in senior housing, self storage, medical office, parking, debt, and land
• As of 3Q14, the private real estate portfolio is significantly underweight to the North East and East North Central regions compared to the NFI-ODCE largely due to the 10.7% international exposure (still well below the 25% international limit)
Private Real Estate Diversification
14
0%
5%
10%
15%
20%
25%
30%
35%
40%
Apt Off Ind Retail Hotel Other
24%
27%
14%
18%
4%
13%
25%
37%
14%
19%
2% 3%
Private Property Type Diversification
CTPF - Private Portfolio NFI-ODCE Index
0%
5%
10%
15%
20%
25%
30%
35%
NE ME ENC WNC SE SW Mtn Pac Int'l
22%
9%7%
0%
9%12%
5%
24%
11%
21%
12%
7%
2%
9%11%
5%
33%
0%
Private Geographic Diversification
CTPF - Private Portfolio NFI-ODCE Index
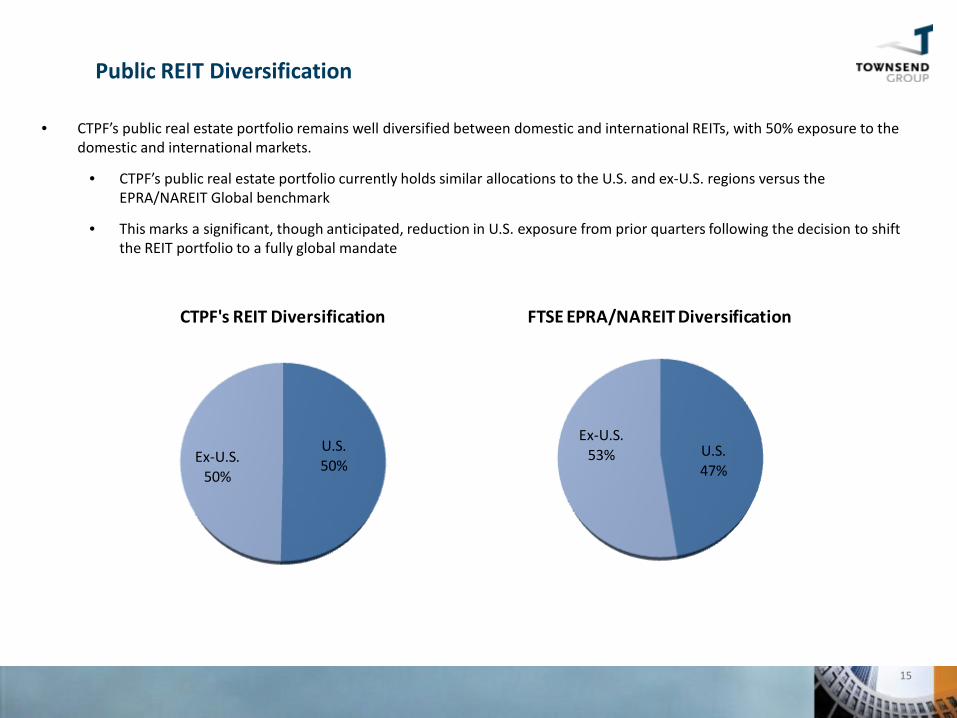
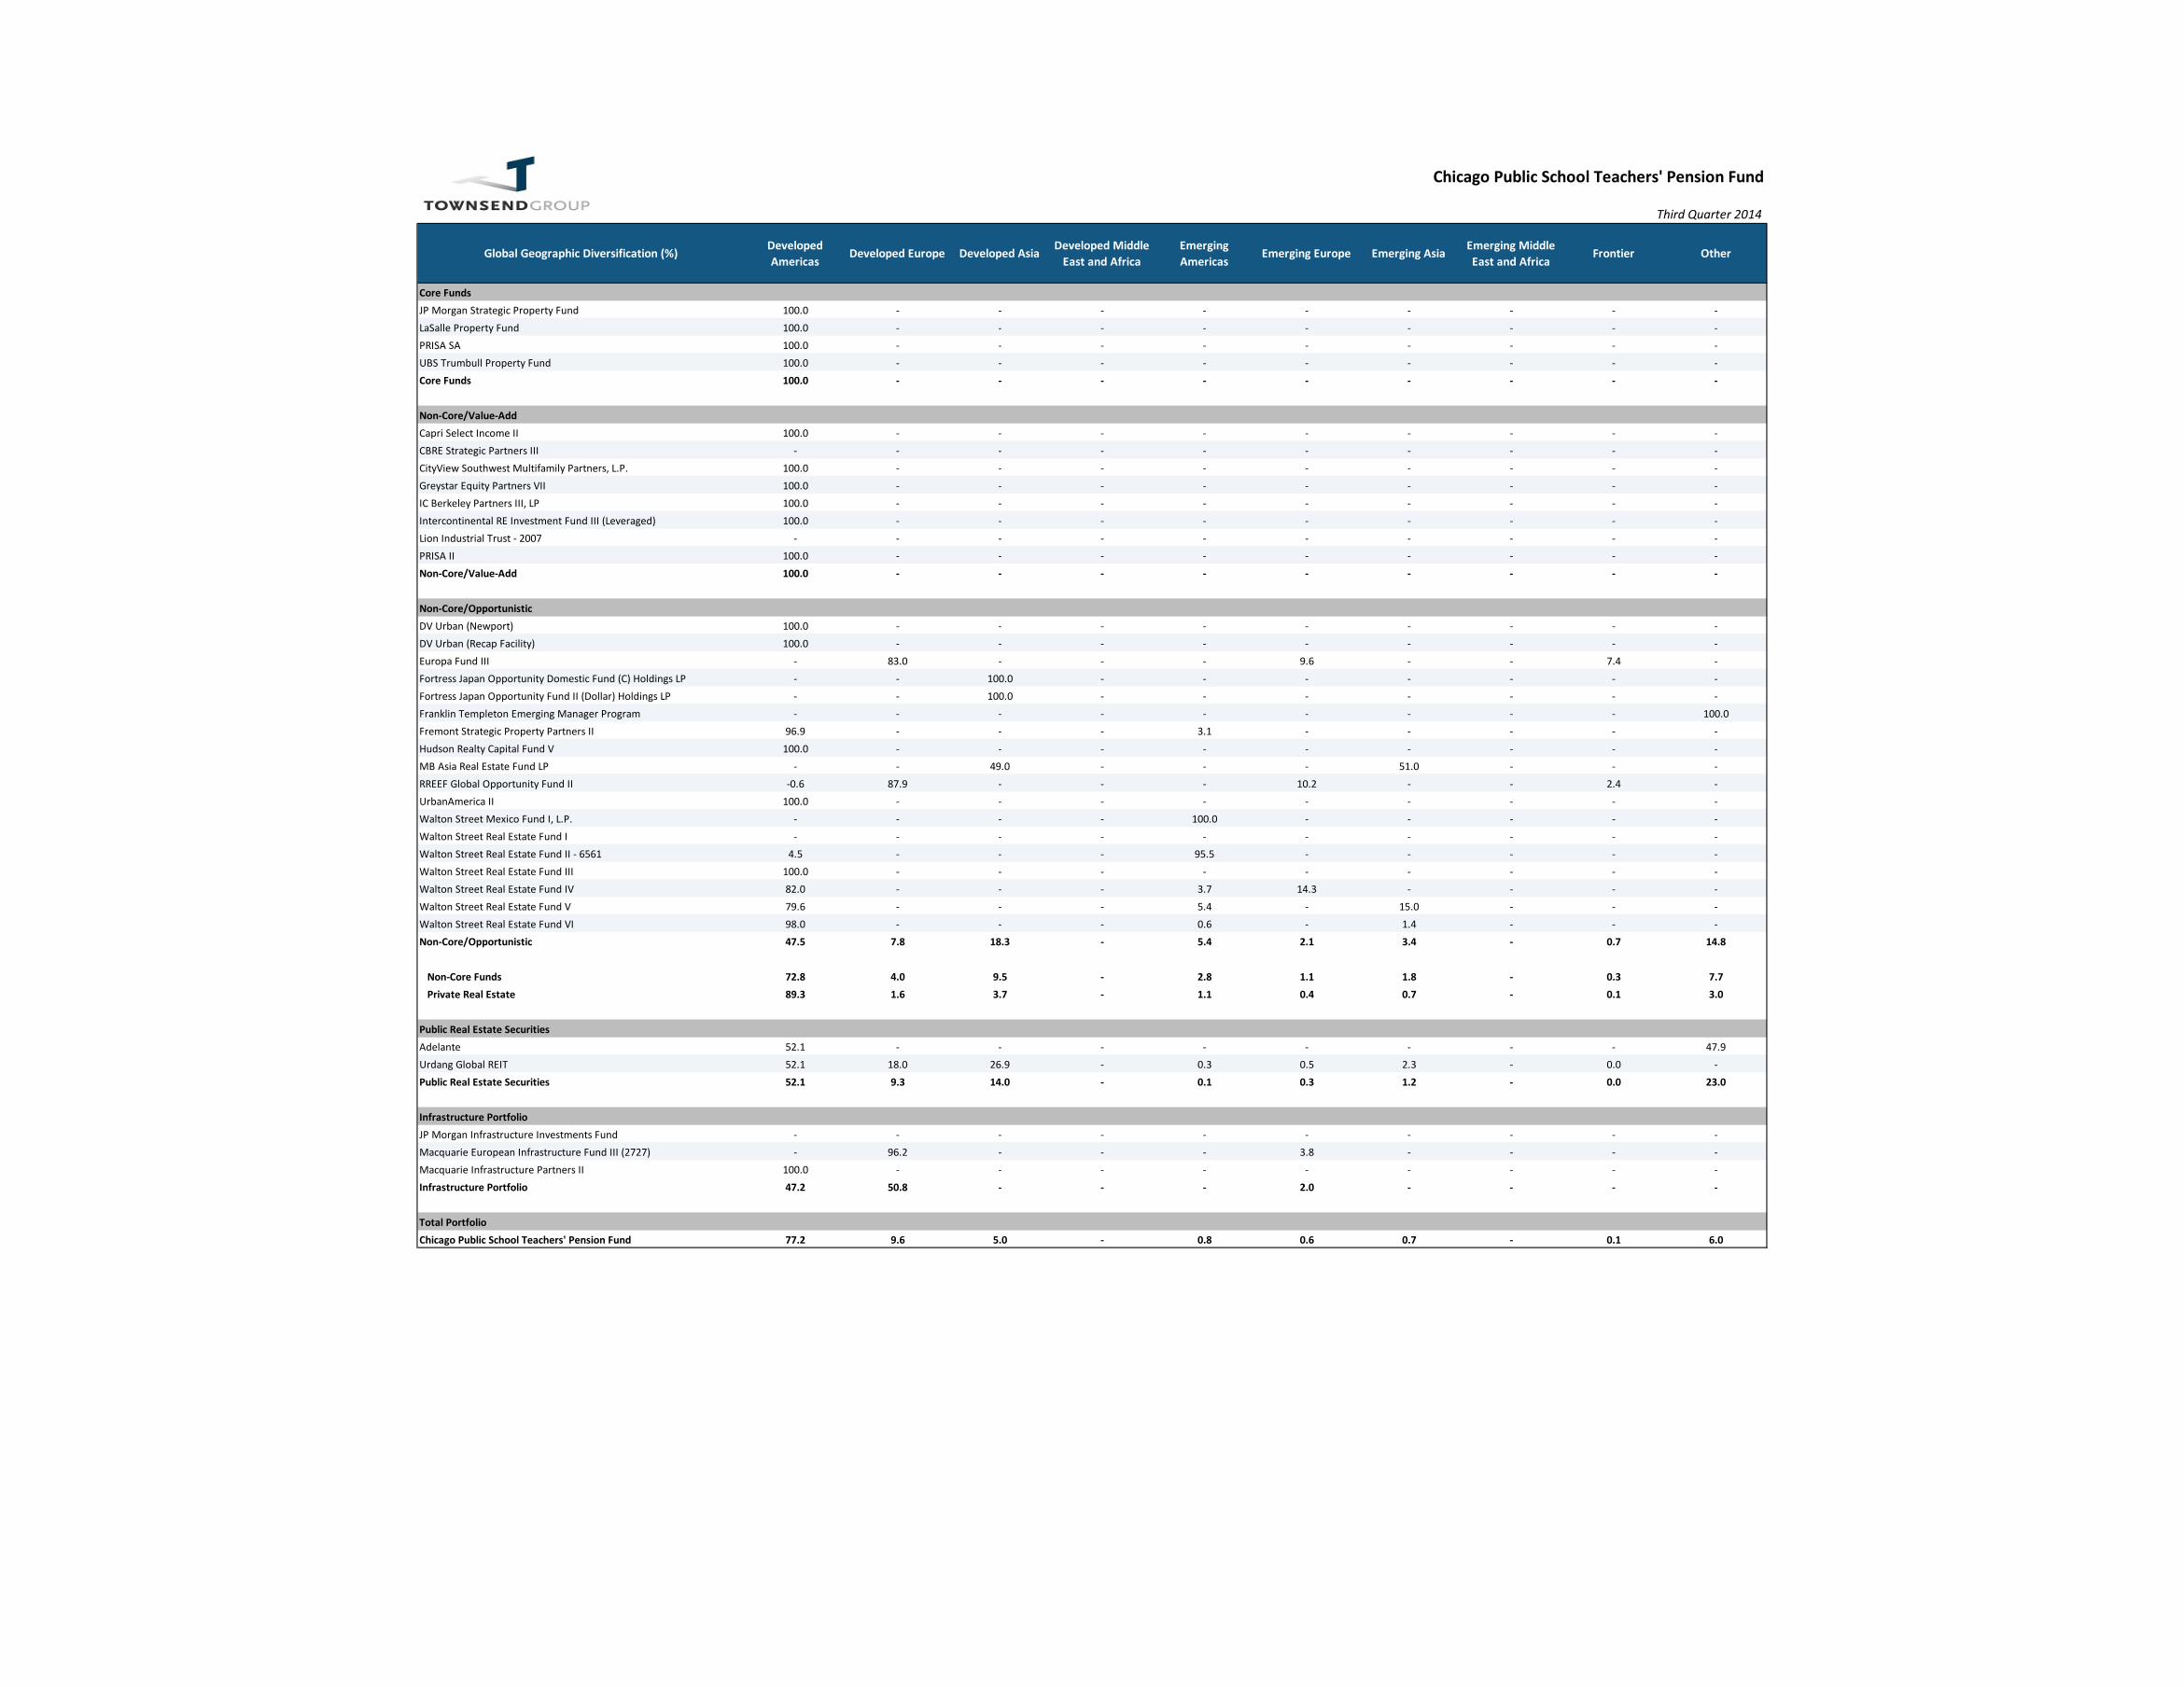
• CTPF’s public real estate portfolio remains well diversified between domestic and international REITs, with 50% exposure to the domestic and international markets.
• CTPF’s public real estate portfolio currently holds similar allocations to the U.S. and ex-U.S. regions versus the EPRA/NAREIT Global benchmark
• This marks a significant, though anticipated, reduction in U.S. exposure from prior quarters following the decision to shift the REIT portfolio to a fully global mandate
15
Public REIT Diversification
U.S.50%Ex-U.S.
50%
CTPF's REIT Diversification
U.S.47%
Ex-U.S.53%
FTSE EPRA/NAREIT Diversification
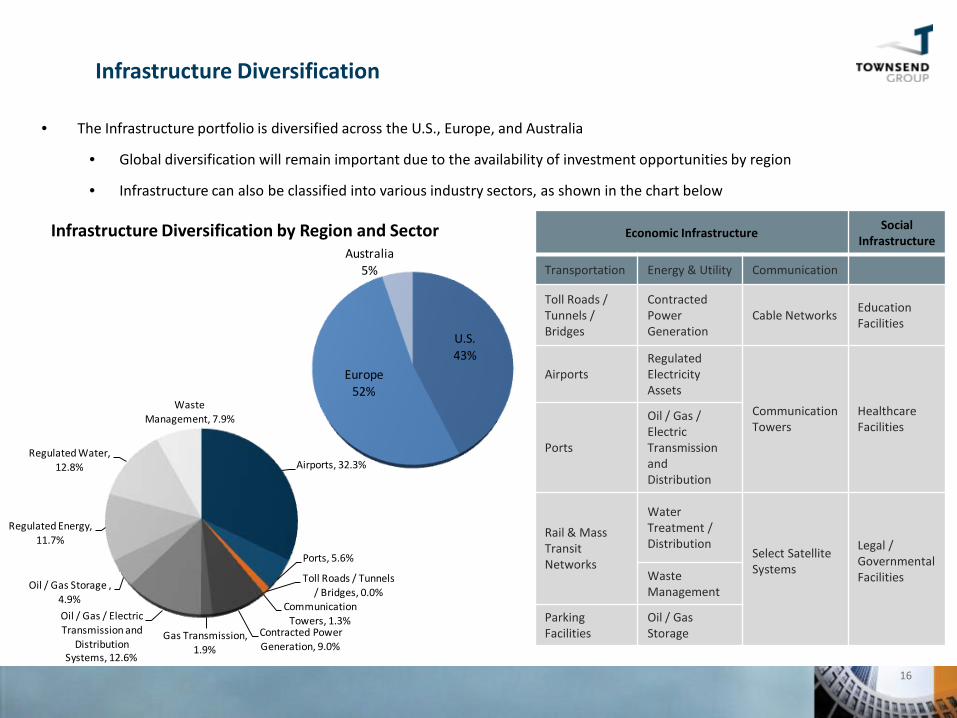
• The Infrastructure portfolio is diversified across the U.S., Europe, and Australia
• Global diversification will remain important due to the availability of investment opportunities by region
• Infrastructure can also be classified into various industry sectors, as shown in the chart below
Economic Infrastructure Social Infrastructure
Transportation Energy & Utility Communication
Toll Roads / Tunnels / Bridges
Contracted Power Generation
Cable Networks Education Facilities
Airports Regulated Electricity Assets
Communication Towers
Healthcare Facilities
Ports
Oil / Gas / Electric Transmission and Distribution
Rail & Mass Transit Networks
Water Treatment / Distribution
Select Satellite Systems
Legal / Governmental Facilities
Waste Management
Parking Facilities
Oil / Gas Storage
Infrastructure Diversification by Region and Sector
Infrastructure Diversification
16
U.S.43%
Europe52%
Australia5%
Airports, 32.3%
Ports, 5.6%
Toll Roads / Tunnels / Bridges, 0.0%
Communication Towers, 1.3%
Contracted Power Generation, 9.0%
Gas Transmission, 1.9%
Oil / Gas / Electric Transmission and
Distribution Systems, 12.6%
Oil / Gas Storage , 4.9%
Regulated Energy, 11.7%
Regulated Water, 12.8%
Waste Management, 7.9%
• In November, Townsend and Staff were asked to distribute separate RFIs for investment in Chicago Infrastructure and Real Estate to determine market appetite and opportunities in each sector
• Going forward, we recommend the following investment initiatives for CTPF:
– Address potential weaknesses in Core portfolio; determine whether to rebalance existing funds or consider a new fund
– Consider up to $30 million in new non-Core commitments in 2015
– Infrastructure allocation is $70 million below current target; however, Total Real Assets allocation is close to target
• Currency exchange rate fluctuations have caused additional volatility in CTPF’s non-U.S. infrastructure
• Modest cash distributions from total infrastructure portfolio have benefitted the plan
• We recommend considering an additional $50 million investment in the space
– Consider $100-200 million allocation to ‘Tactical Investments’ within the Diversifying Real Assets portfolio
– Consider increasing allocation to real estate, infrastructure, and other real assets in order to maintain full 14% target exposure to Real Assets within the CTPF Total Plan
Recommended Investment Initiatives
17

A. Performance Measurement Flash Report (as of Third Quarter 2014)
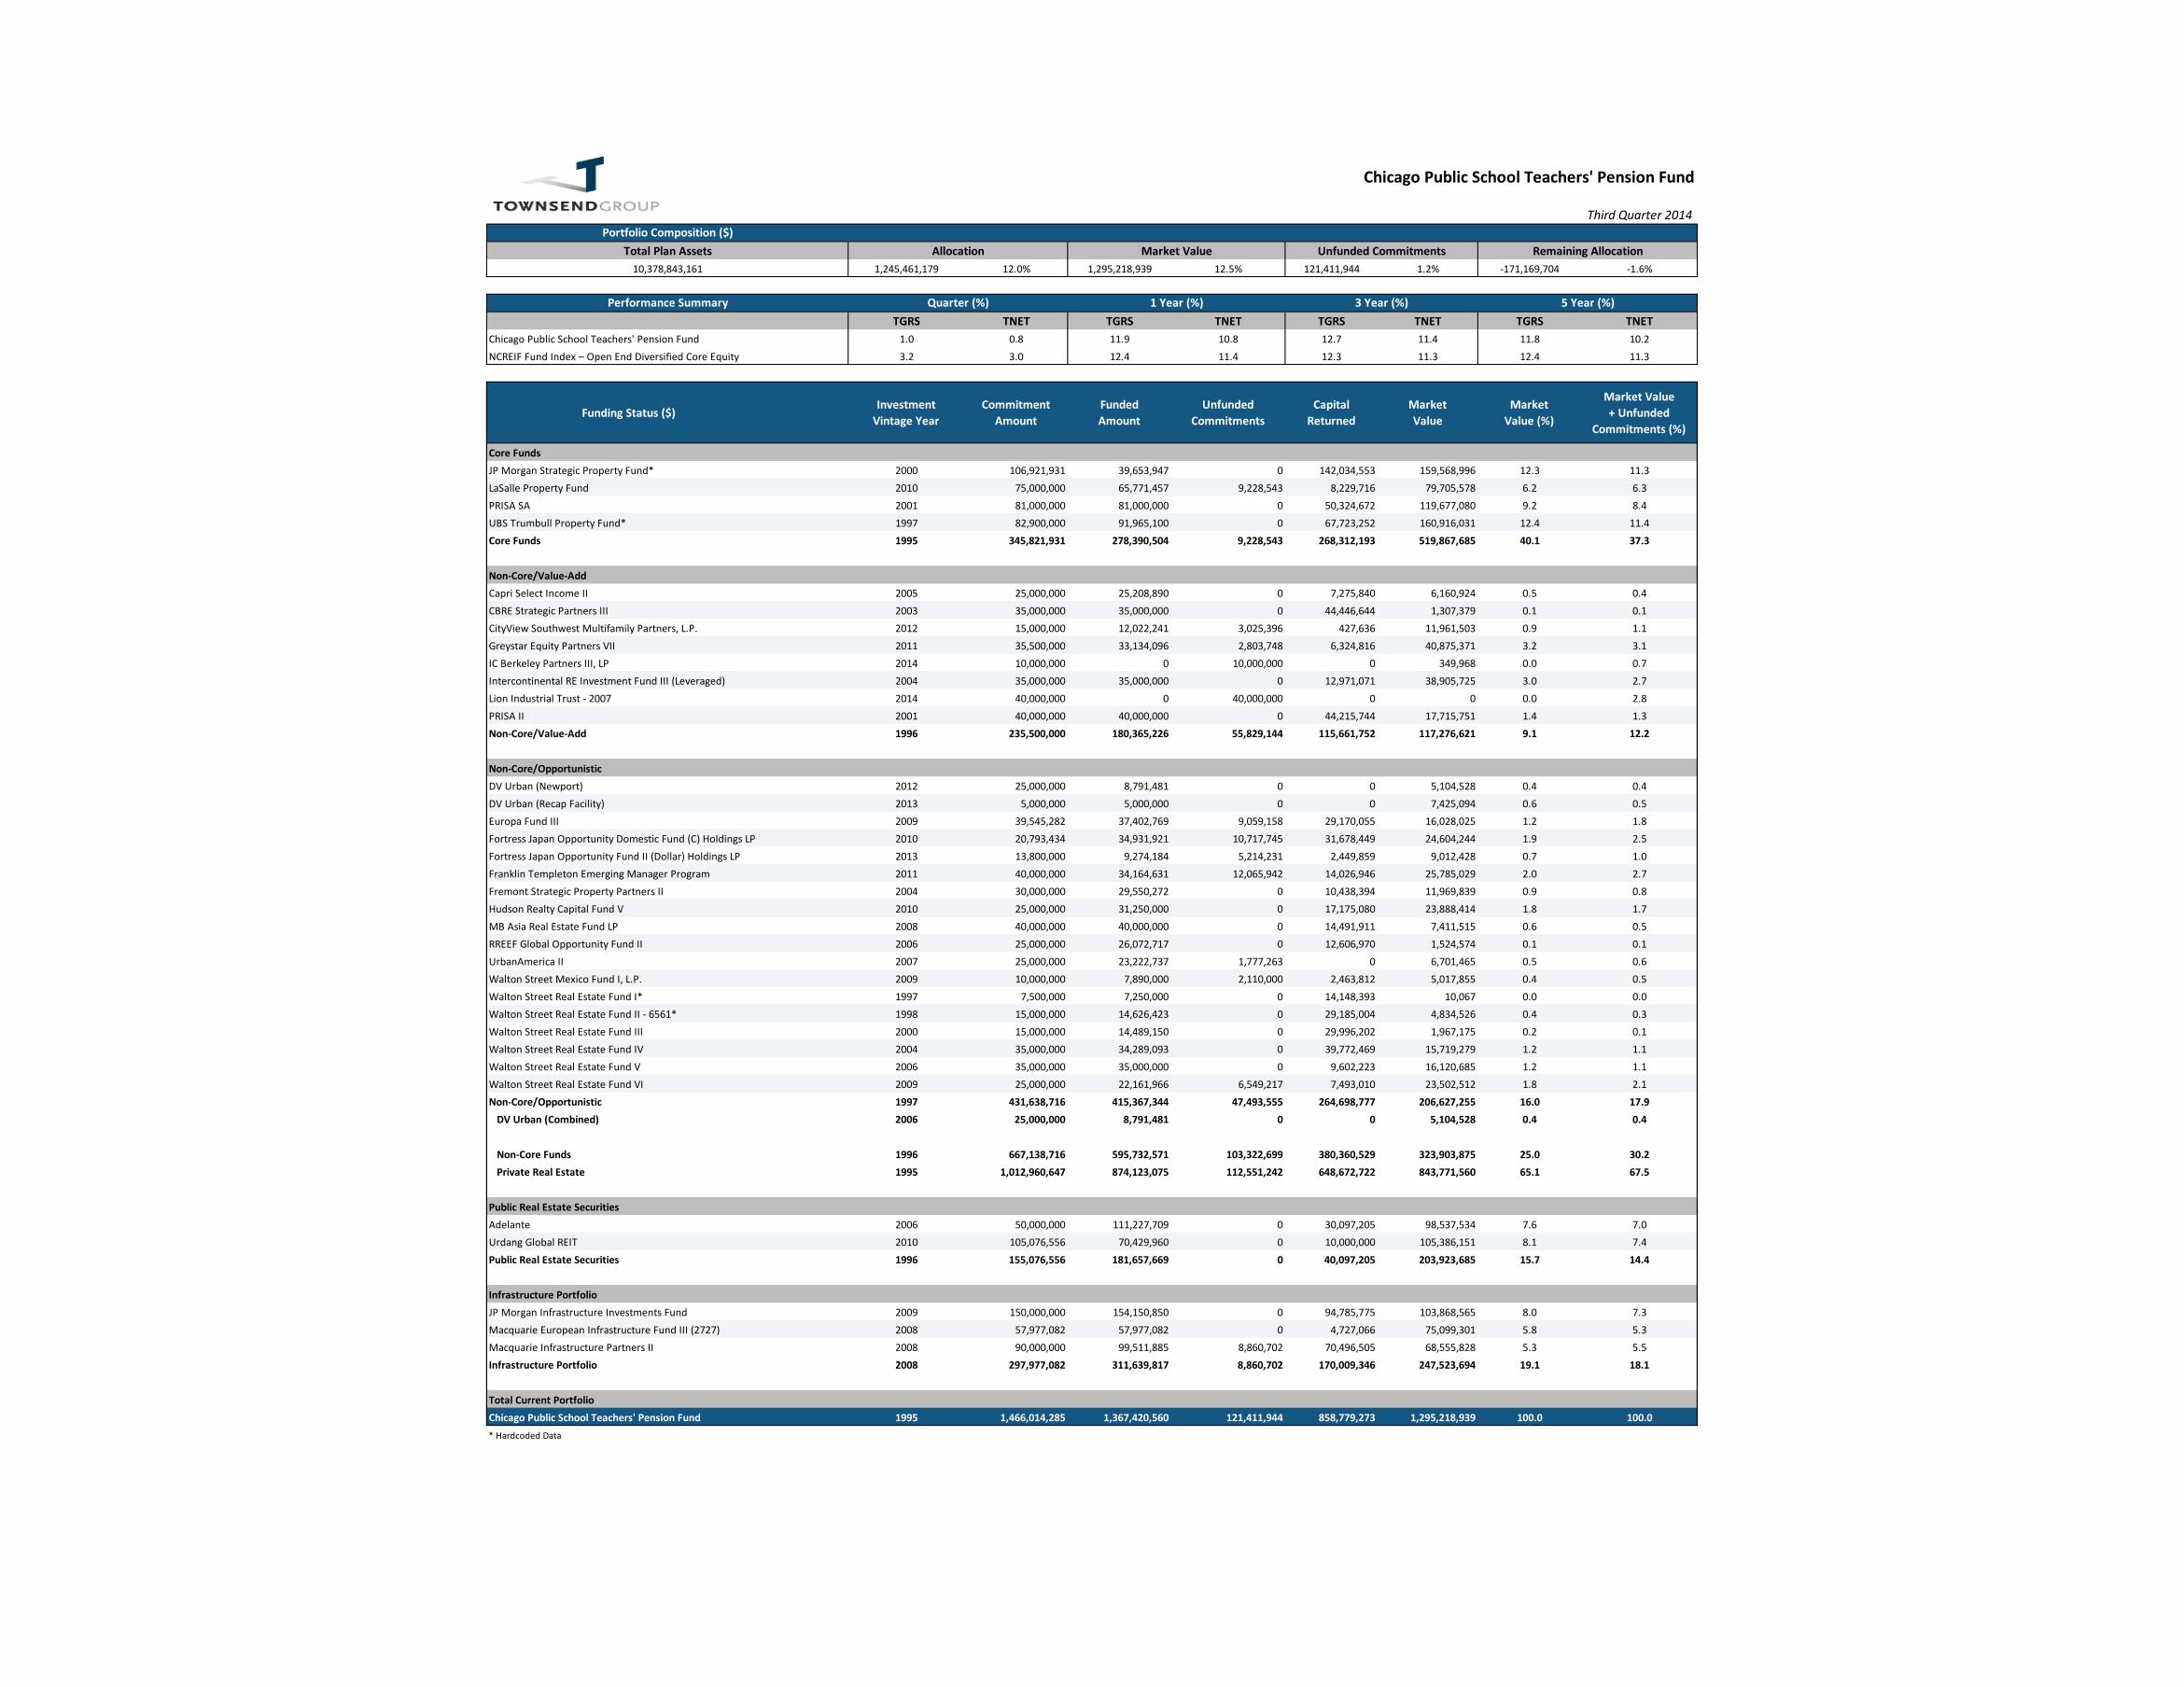
1,245,461,179 12.0% 1,295,218,939 12.5% 121,411,944 1.2% -171,169,704 -1.6%
TGRS TNET TGRS TNET TGRS TNET TGRS TNET1.0 0.8 11.9 10.8 12.7 11.4 11.8 10.23.2 3.0 12.4 11.4 12.3 11.3 12.4 11.3
Funding Status ($)Investment
Vintage YearCommitment
AmountFundedAmount
UnfundedCommitments
CapitalReturned
MarketValue
MarketValue (%)
Market Value+ Unfunded
Commitments (%)
JP Morgan Strategic Property Fund* 2000 106,921,931 39,653,947 0 142,034,553 159,568,996 12.3 11.3LaSalle Property Fund 2010 75,000,000 65,771,457 9,228,543 8,229,716 79,705,578 6.2 6.3PRISA SA 2001 81,000,000 81,000,000 0 50,324,672 119,677,080 9.2 8.4UBS Trumbull Property Fund* 1997 82,900,000 91,965,100 0 67,723,252 160,916,031 12.4 11.4Core Funds 1995 345,821,931 278,390,504 9,228,543 268,312,193 519,867,685 40.1 37.3
Capri Select Income II 2005 25,000,000 25,208,890 0 7,275,840 6,160,924 0.5 0.4CBRE Strategic Partners III 2003 35,000,000 35,000,000 0 44,446,644 1,307,379 0.1 0.1CityView Southwest Multifamily Partners, L.P. 2012 15,000,000 12,022,241 3,025,396 427,636 11,961,503 0.9 1.1Greystar Equity Partners VII 2011 35,500,000 33,134,096 2,803,748 6,324,816 40,875,371 3.2 3.1IC Berkeley Partners III, LP 2014 10,000,000 0 10,000,000 0 349,968 0.0 0.7Intercontinental RE Investment Fund III (Leveraged) 2004 35,000,000 35,000,000 0 12,971,071 38,905,725 3.0 2.7Lion Industrial Trust - 2007 2014 40,000,000 0 40,000,000 0 0 0.0 2.8PRISA II 2001 40,000,000 40,000,000 0 44,215,744 17,715,751 1.4 1.3Non-Core/Value-Add 1996 235,500,000 180,365,226 55,829,144 115,661,752 117,276,621 9.1 12.2
DV Urban (Newport) 2012 25,000,000 8,791,481 0 0 5,104,528 0.4 0.4DV Urban (Recap Facility) 2013 5,000,000 5,000,000 0 0 7,425,094 0.6 0.5Europa Fund III 2009 39,545,282 37,402,769 9,059,158 29,170,055 16,028,025 1.2 1.8Fortress Japan Opportunity Domestic Fund (C) Holdings LP 2010 20,793,434 34,931,921 10,717,745 31,678,449 24,604,244 1.9 2.5Fortress Japan Opportunity Fund II (Dollar) Holdings LP 2013 13,800,000 9,274,184 5,214,231 2,449,859 9,012,428 0.7 1.0Franklin Templeton Emerging Manager Program 2011 40,000,000 34,164,631 12,065,942 14,026,946 25,785,029 2.0 2.7Fremont Strategic Property Partners II 2004 30,000,000 29,550,272 0 10,438,394 11,969,839 0.9 0.8Hudson Realty Capital Fund V 2010 25,000,000 31,250,000 0 17,175,080 23,888,414 1.8 1.7MB Asia Real Estate Fund LP 2008 40,000,000 40,000,000 0 14,491,911 7,411,515 0.6 0.5RREEF Global Opportunity Fund II 2006 25,000,000 26,072,717 0 12,606,970 1,524,574 0.1 0.1UrbanAmerica II 2007 25,000,000 23,222,737 1,777,263 0 6,701,465 0.5 0.6Walton Street Mexico Fund I, L.P. 2009 10,000,000 7,890,000 2,110,000 2,463,812 5,017,855 0.4 0.5Walton Street Real Estate Fund I* 1997 7,500,000 7,250,000 0 14,148,393 10,067 0.0 0.0Walton Street Real Estate Fund II - 6561* 1998 15,000,000 14,626,423 0 29,185,004 4,834,526 0.4 0.3Walton Street Real Estate Fund III 2000 15,000,000 14,489,150 0 29,996,202 1,967,175 0.2 0.1Walton Street Real Estate Fund IV 2004 35,000,000 34,289,093 0 39,772,469 15,719,279 1.2 1.1Walton Street Real Estate Fund V 2006 35,000,000 35,000,000 0 9,602,223 16,120,685 1.2 1.1Walton Street Real Estate Fund VI 2009 25,000,000 22,161,966 6,549,217 7,493,010 23,502,512 1.8 2.1Non-Core/Opportunistic 1997 431,638,716 415,367,344 47,493,555 264,698,777 206,627,255 16.0 17.9 DV Urban (Combined) 2006 25,000,000 8,791,481 0 0 5,104,528 0.4 0.4
Non-Core Funds 1996 667,138,716 595,732,571 103,322,699 380,360,529 323,903,875 25.0 30.2 Private Real Estate 1995 1,012,960,647 874,123,075 112,551,242 648,672,722 843,771,560 65.1 67.5
Adelante 2006 50,000,000 111,227,709 0 30,097,205 98,537,534 7.6 7.0Urdang Global REIT 2010 105,076,556 70,429,960 0 10,000,000 105,386,151 8.1 7.4Public Real Estate Securities 1996 155,076,556 181,657,669 0 40,097,205 203,923,685 15.7 14.4
JP Morgan Infrastructure Investments Fund 2009 150,000,000 154,150,850 0 94,785,775 103,868,565 8.0 7.3Macquarie European Infrastructure Fund III (2727) 2008 57,977,082 57,977,082 0 4,727,066 75,099,301 5.8 5.3Macquarie Infrastructure Partners II 2008 90,000,000 99,511,885 8,860,702 70,496,505 68,555,828 5.3 5.5Infrastructure Portfolio 2008 297,977,082 311,639,817 8,860,702 170,009,346 247,523,694 19.1 18.1
Total Current PortfolioChicago Public School Teachers' Pension Fund 1995 1,466,014,285 1,367,420,560 121,411,944 858,779,273 1,295,218,939 100.0 100.0
Infrastructure Portfolio
* Hardcoded Data
NCREIF Fund Index – Open End Diversified Core Equity
Core Funds
Non-Core/Value-Add
Non-Core/Opportunistic
Public Real Estate Securities
Chicago Public School Teachers' Pension Fund
Chicago Public School Teachers' Pension Fund
Third Quarter 2014Portfolio Composition ($)
Total Plan Assets Allocation Market Value Unfunded Commitments Remaining Allocation
5 Year (%)
10,378,843,161
Performance Summary Quarter (%) 1 Year (%) 3 Year (%)
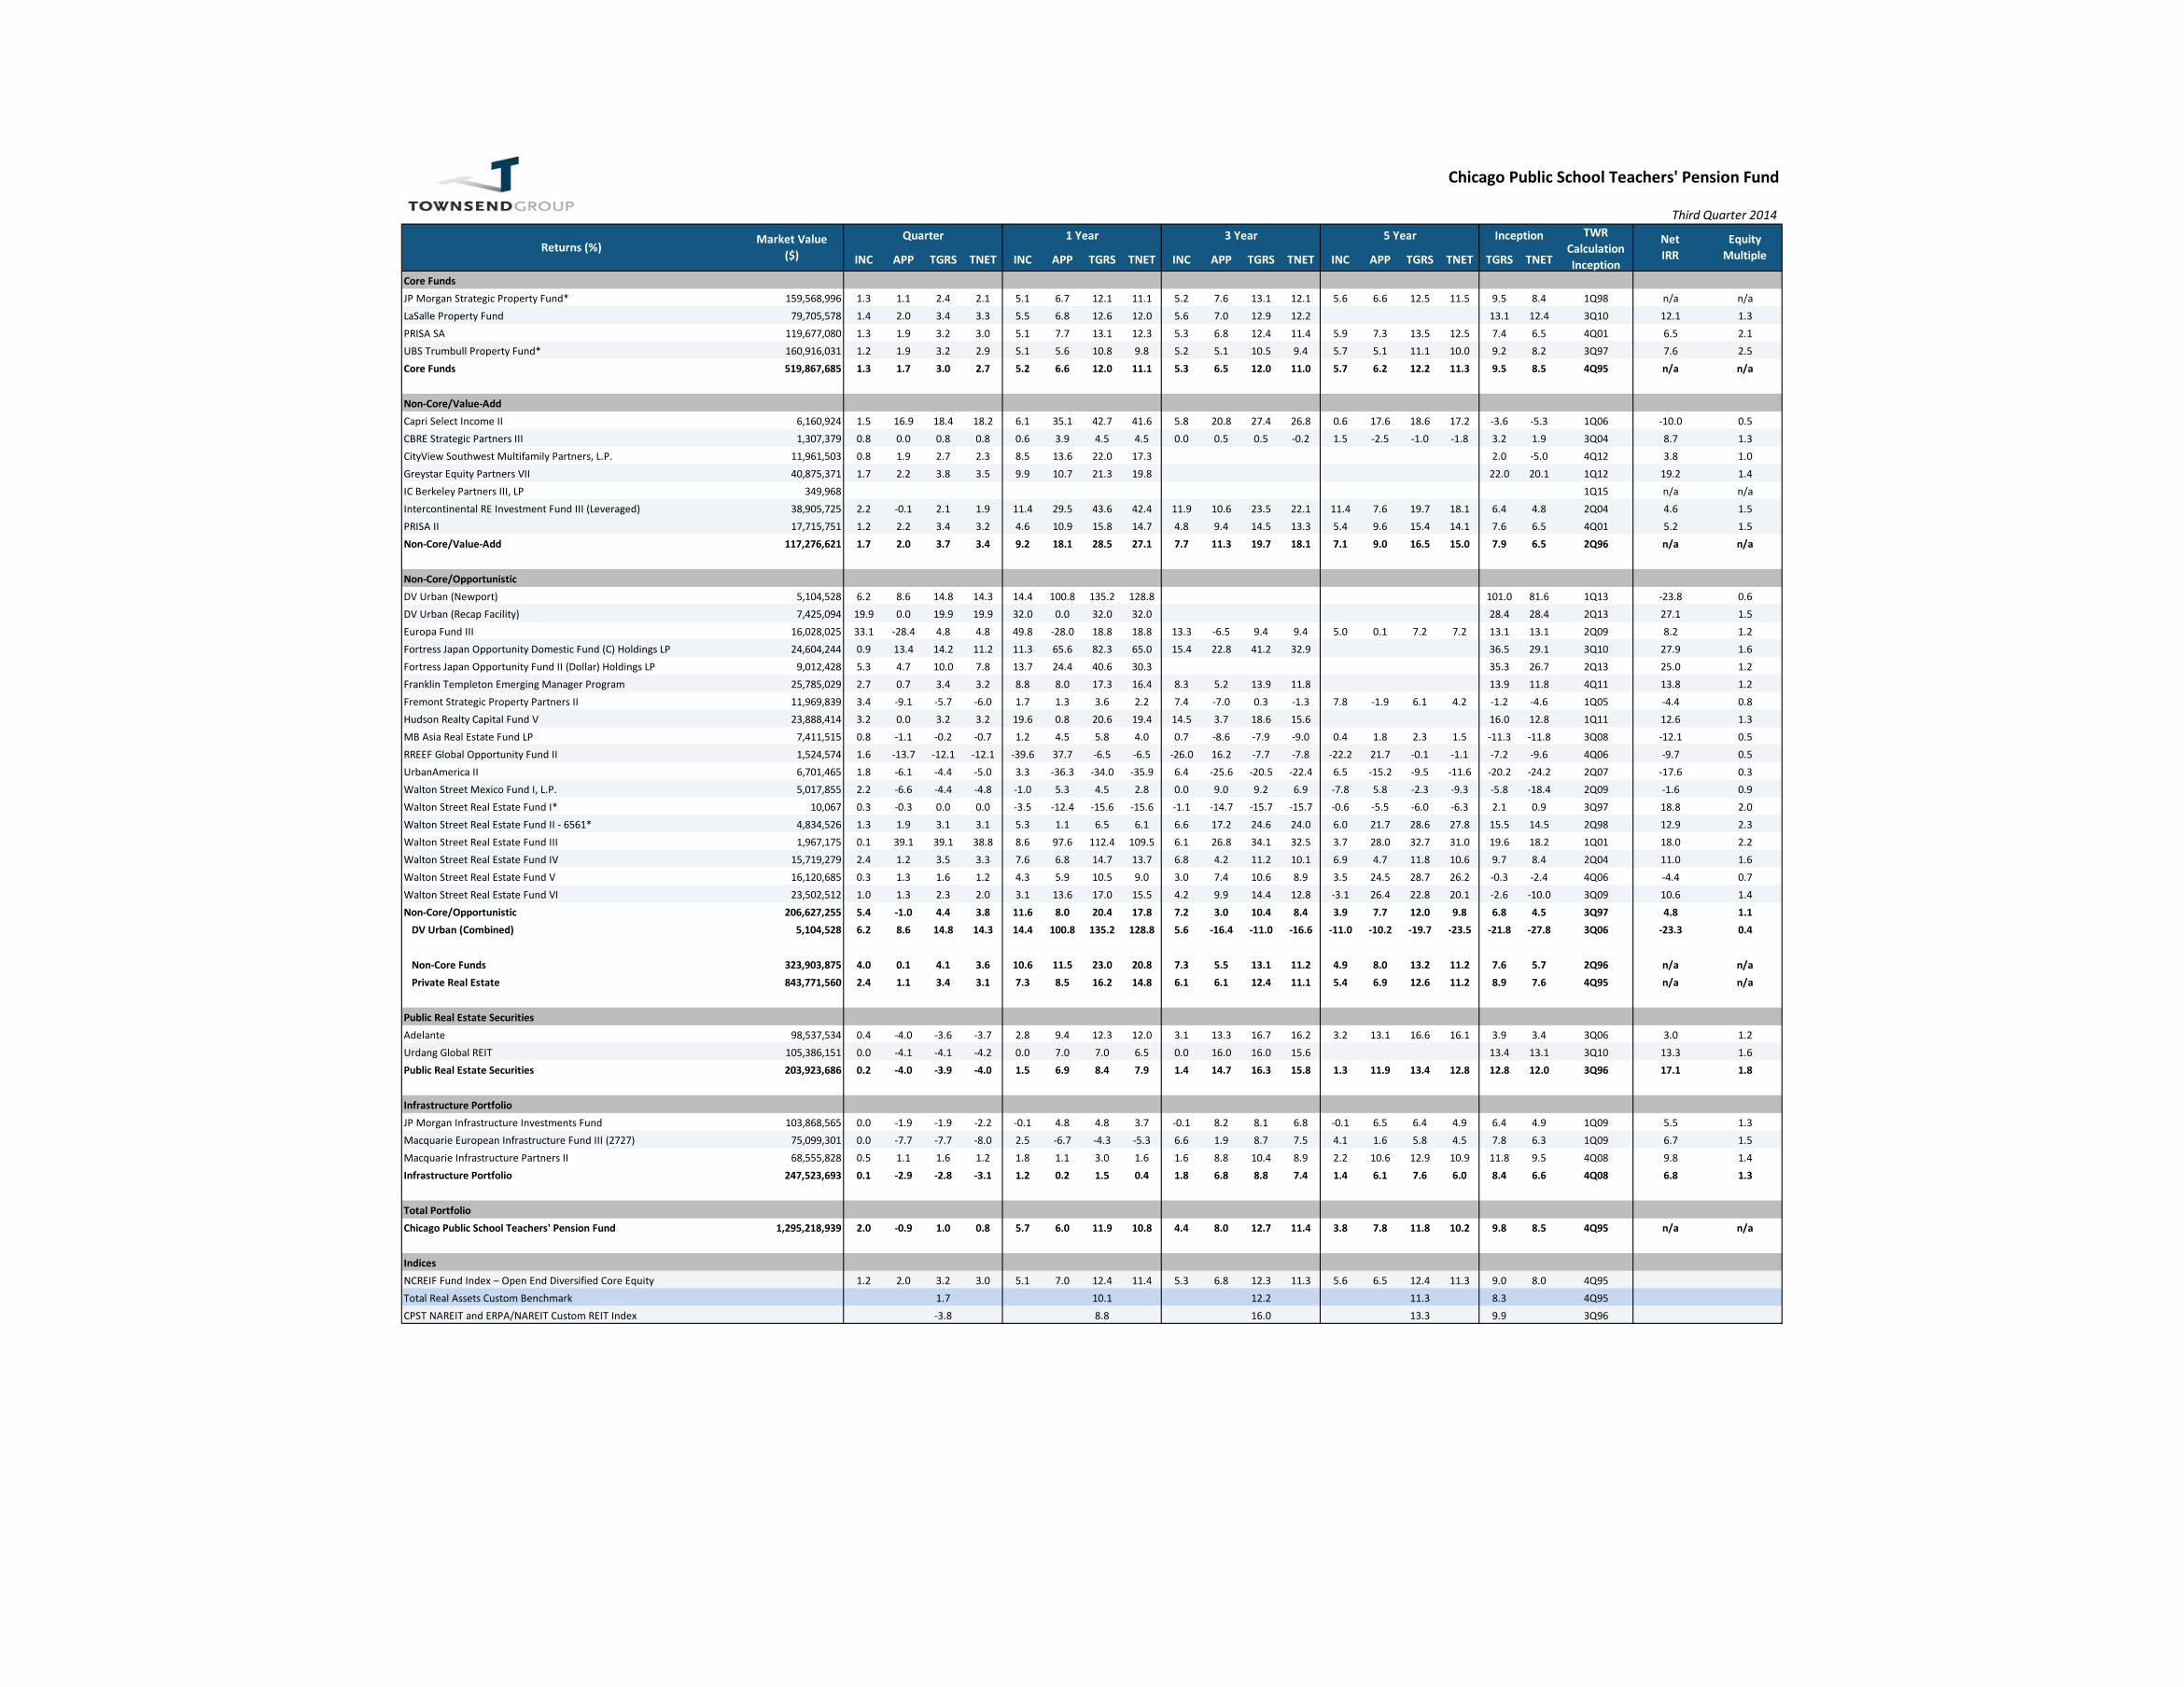
INC APP TGRS TNET INC APP TGRS TNET INC APP TGRS TNET INC APP TGRS TNET TGRS TNET
Core FundsJP Morgan Strategic Property Fund* 159,568,996 1.3 1.1 2.4 2.1 5.1 6.7 12.1 11.1 5.2 7.6 13.1 12.1 5.6 6.6 12.5 11.5 9.5 8.4 1Q98 n/a n/aLaSalle Property Fund 79,705,578 1.4 2.0 3.4 3.3 5.5 6.8 12.6 12.0 5.6 7.0 12.9 12.2 13.1 12.4 3Q10 12.1 1.3PRISA SA 119,677,080 1.3 1.9 3.2 3.0 5.1 7.7 13.1 12.3 5.3 6.8 12.4 11.4 5.9 7.3 13.5 12.5 7.4 6.5 4Q01 6.5 2.1UBS Trumbull Property Fund* 160,916,031 1.2 1.9 3.2 2.9 5.1 5.6 10.8 9.8 5.2 5.1 10.5 9.4 5.7 5.1 11.1 10.0 9.2 8.2 3Q97 7.6 2.5Core Funds 519,867,685 1.3 1.7 3.0 2.7 5.2 6.6 12.0 11.1 5.3 6.5 12.0 11.0 5.7 6.2 12.2 11.3 9.5 8.5 4Q95 n/a n/a
Non-Core/Value-AddCapri Select Income II 6,160,924 1.5 16.9 18.4 18.2 6.1 35.1 42.7 41.6 5.8 20.8 27.4 26.8 0.6 17.6 18.6 17.2 -3.6 -5.3 1Q06 -10.0 0.5CBRE Strategic Partners III 1,307,379 0.8 0.0 0.8 0.8 0.6 3.9 4.5 4.5 0.0 0.5 0.5 -0.2 1.5 -2.5 -1.0 -1.8 3.2 1.9 3Q04 8.7 1.3CityView Southwest Multifamily Partners, L.P. 11,961,503 0.8 1.9 2.7 2.3 8.5 13.6 22.0 17.3 2.0 -5.0 4Q12 3.8 1.0Greystar Equity Partners VII 40,875,371 1.7 2.2 3.8 3.5 9.9 10.7 21.3 19.8 22.0 20.1 1Q12 19.2 1.4IC Berkeley Partners III, LP 349,968 1Q15 n/a n/aIntercontinental RE Investment Fund III (Leveraged) 38,905,725 2.2 -0.1 2.1 1.9 11.4 29.5 43.6 42.4 11.9 10.6 23.5 22.1 11.4 7.6 19.7 18.1 6.4 4.8 2Q04 4.6 1.5PRISA II 17,715,751 1.2 2.2 3.4 3.2 4.6 10.9 15.8 14.7 4.8 9.4 14.5 13.3 5.4 9.6 15.4 14.1 7.6 6.5 4Q01 5.2 1.5Non-Core/Value-Add 117,276,621 1.7 2.0 3.7 3.4 9.2 18.1 28.5 27.1 7.7 11.3 19.7 18.1 7.1 9.0 16.5 15.0 7.9 6.5 2Q96 n/a n/a
Non-Core/OpportunisticDV Urban (Newport) 5,104,528 6.2 8.6 14.8 14.3 14.4 100.8 135.2 128.8 101.0 81.6 1Q13 -23.8 0.6DV Urban (Recap Facility) 7,425,094 19.9 0.0 19.9 19.9 32.0 0.0 32.0 32.0 28.4 28.4 2Q13 27.1 1.5Europa Fund III 16,028,025 33.1 -28.4 4.8 4.8 49.8 -28.0 18.8 18.8 13.3 -6.5 9.4 9.4 5.0 0.1 7.2 7.2 13.1 13.1 2Q09 8.2 1.2Fortress Japan Opportunity Domestic Fund (C) Holdings LP 24,604,244 0.9 13.4 14.2 11.2 11.3 65.6 82.3 65.0 15.4 22.8 41.2 32.9 36.5 29.1 3Q10 27.9 1.6Fortress Japan Opportunity Fund II (Dollar) Holdings LP 9,012,428 5.3 4.7 10.0 7.8 13.7 24.4 40.6 30.3 35.3 26.7 2Q13 25.0 1.2Franklin Templeton Emerging Manager Program 25,785,029 2.7 0.7 3.4 3.2 8.8 8.0 17.3 16.4 8.3 5.2 13.9 11.8 13.9 11.8 4Q11 13.8 1.2Fremont Strategic Property Partners II 11,969,839 3.4 -9.1 -5.7 -6.0 1.7 1.3 3.6 2.2 7.4 -7.0 0.3 -1.3 7.8 -1.9 6.1 4.2 -1.2 -4.6 1Q05 -4.4 0.8Hudson Realty Capital Fund V 23,888,414 3.2 0.0 3.2 3.2 19.6 0.8 20.6 19.4 14.5 3.7 18.6 15.6 16.0 12.8 1Q11 12.6 1.3MB Asia Real Estate Fund LP 7,411,515 0.8 -1.1 -0.2 -0.7 1.2 4.5 5.8 4.0 0.7 -8.6 -7.9 -9.0 0.4 1.8 2.3 1.5 -11.3 -11.8 3Q08 -12.1 0.5RREEF Global Opportunity Fund II 1,524,574 1.6 -13.7 -12.1 -12.1 -39.6 37.7 -6.5 -6.5 -26.0 16.2 -7.7 -7.8 -22.2 21.7 -0.1 -1.1 -7.2 -9.6 4Q06 -9.7 0.5UrbanAmerica II 6,701,465 1.8 -6.1 -4.4 -5.0 3.3 -36.3 -34.0 -35.9 6.4 -25.6 -20.5 -22.4 6.5 -15.2 -9.5 -11.6 -20.2 -24.2 2Q07 -17.6 0.3Walton Street Mexico Fund I, L.P. 5,017,855 2.2 -6.6 -4.4 -4.8 -1.0 5.3 4.5 2.8 0.0 9.0 9.2 6.9 -7.8 5.8 -2.3 -9.3 -5.8 -18.4 2Q09 -1.6 0.9Walton Street Real Estate Fund I* 10,067 0.3 -0.3 0.0 0.0 -3.5 -12.4 -15.6 -15.6 -1.1 -14.7 -15.7 -15.7 -0.6 -5.5 -6.0 -6.3 2.1 0.9 3Q97 18.8 2.0Walton Street Real Estate Fund II - 6561* 4,834,526 1.3 1.9 3.1 3.1 5.3 1.1 6.5 6.1 6.6 17.2 24.6 24.0 6.0 21.7 28.6 27.8 15.5 14.5 2Q98 12.9 2.3Walton Street Real Estate Fund III 1,967,175 0.1 39.1 39.1 38.8 8.6 97.6 112.4 109.5 6.1 26.8 34.1 32.5 3.7 28.0 32.7 31.0 19.6 18.2 1Q01 18.0 2.2Walton Street Real Estate Fund IV 15,719,279 2.4 1.2 3.5 3.3 7.6 6.8 14.7 13.7 6.8 4.2 11.2 10.1 6.9 4.7 11.8 10.6 9.7 8.4 2Q04 11.0 1.6Walton Street Real Estate Fund V 16,120,685 0.3 1.3 1.6 1.2 4.3 5.9 10.5 9.0 3.0 7.4 10.6 8.9 3.5 24.5 28.7 26.2 -0.3 -2.4 4Q06 -4.4 0.7Walton Street Real Estate Fund VI 23,502,512 1.0 1.3 2.3 2.0 3.1 13.6 17.0 15.5 4.2 9.9 14.4 12.8 -3.1 26.4 22.8 20.1 -2.6 -10.0 3Q09 10.6 1.4Non-Core/Opportunistic 206,627,255 5.4 -1.0 4.4 3.8 11.6 8.0 20.4 17.8 7.2 3.0 10.4 8.4 3.9 7.7 12.0 9.8 6.8 4.5 3Q97 4.8 1.1 DV Urban (Combined) 5,104,528 6.2 8.6 14.8 14.3 14.4 100.8 135.2 128.8 5.6 -16.4 -11.0 -16.6 -11.0 -10.2 -19.7 -23.5 -21.8 -27.8 3Q06 -23.3 0.4
Non-Core Funds 323,903,875 4.0 0.1 4.1 3.6 10.6 11.5 23.0 20.8 7.3 5.5 13.1 11.2 4.9 8.0 13.2 11.2 7.6 5.7 2Q96 n/a n/a Private Real Estate 843,771,560 2.4 1.1 3.4 3.1 7.3 8.5 16.2 14.8 6.1 6.1 12.4 11.1 5.4 6.9 12.6 11.2 8.9 7.6 4Q95 n/a n/a
Public Real Estate SecuritiesAdelante 98,537,534 0.4 -4.0 -3.6 -3.7 2.8 9.4 12.3 12.0 3.1 13.3 16.7 16.2 3.2 13.1 16.6 16.1 3.9 3.4 3Q06 3.0 1.2Urdang Global REIT 105,386,151 0.0 -4.1 -4.1 -4.2 0.0 7.0 7.0 6.5 0.0 16.0 16.0 15.6 13.4 13.1 3Q10 13.3 1.6Public Real Estate Securities 203,923,686 0.2 -4.0 -3.9 -4.0 1.5 6.9 8.4 7.9 1.4 14.7 16.3 15.8 1.3 11.9 13.4 12.8 12.8 12.0 3Q96 17.1 1.8
Infrastructure Portfolio JP Morgan Infrastructure Investments Fund 103,868,565 0.0 -1.9 -1.9 -2.2 -0.1 4.8 4.8 3.7 -0.1 8.2 8.1 6.8 -0.1 6.5 6.4 4.9 6.4 4.9 1Q09 5.5 1.3Macquarie European Infrastructure Fund III (2727) 75,099,301 0.0 -7.7 -7.7 -8.0 2.5 -6.7 -4.3 -5.3 6.6 1.9 8.7 7.5 4.1 1.6 5.8 4.5 7.8 6.3 1Q09 6.7 1.5Macquarie Infrastructure Partners II 68,555,828 0.5 1.1 1.6 1.2 1.8 1.1 3.0 1.6 1.6 8.8 10.4 8.9 2.2 10.6 12.9 10.9 11.8 9.5 4Q08 9.8 1.4Infrastructure Portfolio 247,523,693 0.1 -2.9 -2.8 -3.1 1.2 0.2 1.5 0.4 1.8 6.8 8.8 7.4 1.4 6.1 7.6 6.0 8.4 6.6 4Q08 6.8 1.3
Total PortfolioChicago Public School Teachers' Pension Fund 1,295,218,939 2.0 -0.9 1.0 0.8 5.7 6.0 11.9 10.8 4.4 8.0 12.7 11.4 3.8 7.8 11.8 10.2 9.8 8.5 4Q95 n/a n/a
IndicesNCREIF Fund Index – Open End Diversified Core Equity 1.2 2.0 3.2 3.0 5.1 7.0 12.4 11.4 5.3 6.8 12.3 11.3 5.6 6.5 12.4 11.3 9.0 8.0 4Q95Total Real Assets Custom Benchmark 1.7 10.1 12.2 11.3 8.3 4Q95CPST NAREIT and ERPA/NAREIT Custom REIT Index -3.8 8.8 16.0 13.3 9.9 3Q96
NetIRR
EquityMultiple
Chicago Public School Teachers' Pension Fund
Third Quarter 2014
Returns (%)Market Value
($)Quarter 1 Year 3 Year 5 Year Inception TWR
CalculationInception
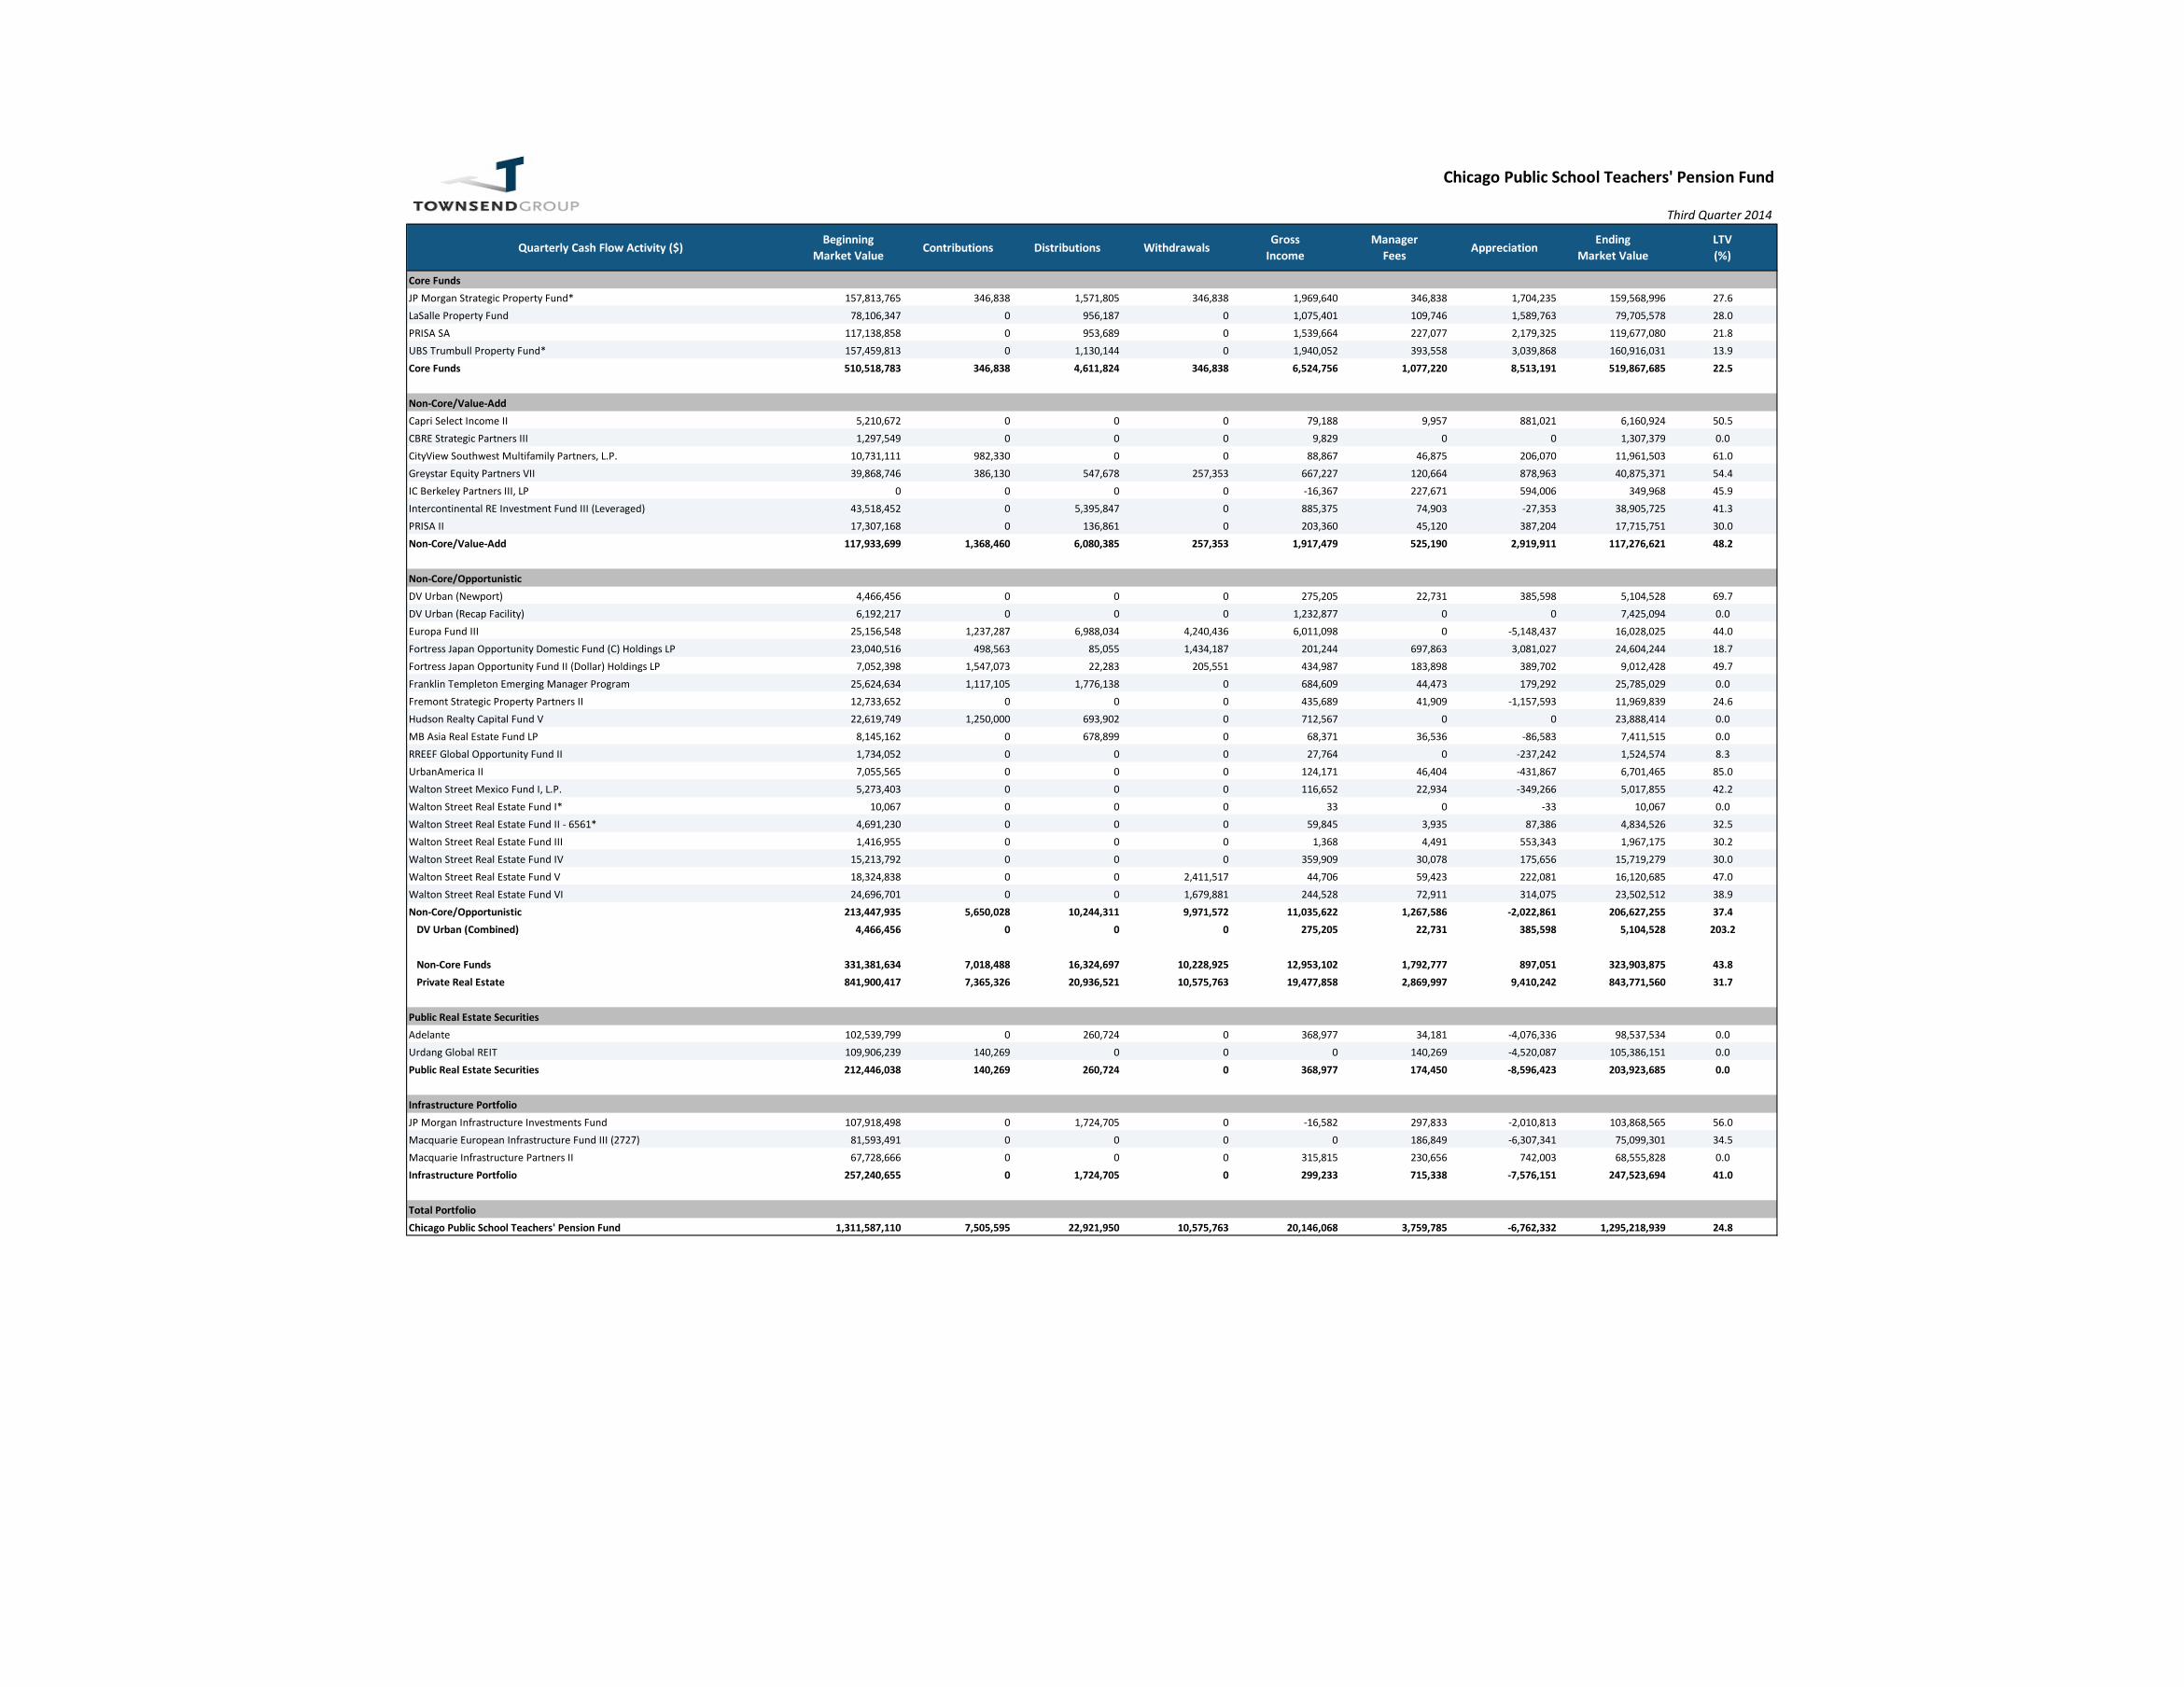
Quarterly Cash Flow Activity ($)Beginning
Market Value Contributions Distributions WithdrawalsGross
IncomeManager
Fees AppreciationEnding
Market ValueLTV(%)
JP Morgan Strategic Property Fund* 157,813,765 346,838 1,571,805 346,838 1,969,640 346,838 1,704,235 159,568,996 27.6LaSalle Property Fund 78,106,347 0 956,187 0 1,075,401 109,746 1,589,763 79,705,578 28.0PRISA SA 117,138,858 0 953,689 0 1,539,664 227,077 2,179,325 119,677,080 21.8UBS Trumbull Property Fund* 157,459,813 0 1,130,144 0 1,940,052 393,558 3,039,868 160,916,031 13.9Core Funds 510,518,783 346,838 4,611,824 346,838 6,524,756 1,077,220 8,513,191 519,867,685 22.5
Capri Select Income II 5,210,672 0 0 0 79,188 9,957 881,021 6,160,924 50.5CBRE Strategic Partners III 1,297,549 0 0 0 9,829 0 0 1,307,379 0.0CityView Southwest Multifamily Partners, L.P. 10,731,111 982,330 0 0 88,867 46,875 206,070 11,961,503 61.0Greystar Equity Partners VII 39,868,746 386,130 547,678 257,353 667,227 120,664 878,963 40,875,371 54.4IC Berkeley Partners III, LP 0 0 0 0 -16,367 227,671 594,006 349,968 45.9Intercontinental RE Investment Fund III (Leveraged) 43,518,452 0 5,395,847 0 885,375 74,903 -27,353 38,905,725 41.3PRISA II 17,307,168 0 136,861 0 203,360 45,120 387,204 17,715,751 30.0Non-Core/Value-Add 117,933,699 1,368,460 6,080,385 257,353 1,917,479 525,190 2,919,911 117,276,621 48.2
DV Urban (Newport) 4,466,456 0 0 0 275,205 22,731 385,598 5,104,528 69.7DV Urban (Recap Facility) 6,192,217 0 0 0 1,232,877 0 0 7,425,094 0.0Europa Fund III 25,156,548 1,237,287 6,988,034 4,240,436 6,011,098 0 -5,148,437 16,028,025 44.0Fortress Japan Opportunity Domestic Fund (C) Holdings LP 23,040,516 498,563 85,055 1,434,187 201,244 697,863 3,081,027 24,604,244 18.7Fortress Japan Opportunity Fund II (Dollar) Holdings LP 7,052,398 1,547,073 22,283 205,551 434,987 183,898 389,702 9,012,428 49.7Franklin Templeton Emerging Manager Program 25,624,634 1,117,105 1,776,138 0 684,609 44,473 179,292 25,785,029 0.0Fremont Strategic Property Partners II 12,733,652 0 0 0 435,689 41,909 -1,157,593 11,969,839 24.6Hudson Realty Capital Fund V 22,619,749 1,250,000 693,902 0 712,567 0 0 23,888,414 0.0MB Asia Real Estate Fund LP 8,145,162 0 678,899 0 68,371 36,536 -86,583 7,411,515 0.0RREEF Global Opportunity Fund II 1,734,052 0 0 0 27,764 0 -237,242 1,524,574 8.3UrbanAmerica II 7,055,565 0 0 0 124,171 46,404 -431,867 6,701,465 85.0Walton Street Mexico Fund I, L.P. 5,273,403 0 0 0 116,652 22,934 -349,266 5,017,855 42.2Walton Street Real Estate Fund I* 10,067 0 0 0 33 0 -33 10,067 0.0Walton Street Real Estate Fund II - 6561* 4,691,230 0 0 0 59,845 3,935 87,386 4,834,526 32.5Walton Street Real Estate Fund III 1,416,955 0 0 0 1,368 4,491 553,343 1,967,175 30.2Walton Street Real Estate Fund IV 15,213,792 0 0 0 359,909 30,078 175,656 15,719,279 30.0Walton Street Real Estate Fund V 18,324,838 0 0 2,411,517 44,706 59,423 222,081 16,120,685 47.0Walton Street Real Estate Fund VI 24,696,701 0 0 1,679,881 244,528 72,911 314,075 23,502,512 38.9Non-Core/Opportunistic 213,447,935 5,650,028 10,244,311 9,971,572 11,035,622 1,267,586 -2,022,861 206,627,255 37.4 DV Urban (Combined) 4,466,456 0 0 0 275,205 22,731 385,598 5,104,528 203.2
Non-Core Funds 331,381,634 7,018,488 16,324,697 10,228,925 12,953,102 1,792,777 897,051 323,903,875 43.8 Private Real Estate 841,900,417 7,365,326 20,936,521 10,575,763 19,477,858 2,869,997 9,410,242 843,771,560 31.7
Adelante 102,539,799 0 260,724 0 368,977 34,181 -4,076,336 98,537,534 0.0Urdang Global REIT 109,906,239 140,269 0 0 0 140,269 -4,520,087 105,386,151 0.0Public Real Estate Securities 212,446,038 140,269 260,724 0 368,977 174,450 -8,596,423 203,923,685 0.0
JP Morgan Infrastructure Investments Fund 107,918,498 0 1,724,705 0 -16,582 297,833 -2,010,813 103,868,565 56.0Macquarie European Infrastructure Fund III (2727) 81,593,491 0 0 0 0 186,849 -6,307,341 75,099,301 34.5Macquarie Infrastructure Partners II 67,728,666 0 0 0 315,815 230,656 742,003 68,555,828 0.0Infrastructure Portfolio 257,240,655 0 1,724,705 0 299,233 715,338 -7,576,151 247,523,694 41.0
Total PortfolioChicago Public School Teachers' Pension Fund 1,311,587,110 7,505,595 22,921,950 10,575,763 20,146,068 3,759,785 -6,762,332 1,295,218,939 24.8
Public Real Estate Securities
Infrastructure Portfolio
Chicago Public School Teachers' Pension Fund
Third Quarter 2014
Core Funds
Non-Core/Value-Add
Non-Core/Opportunistic
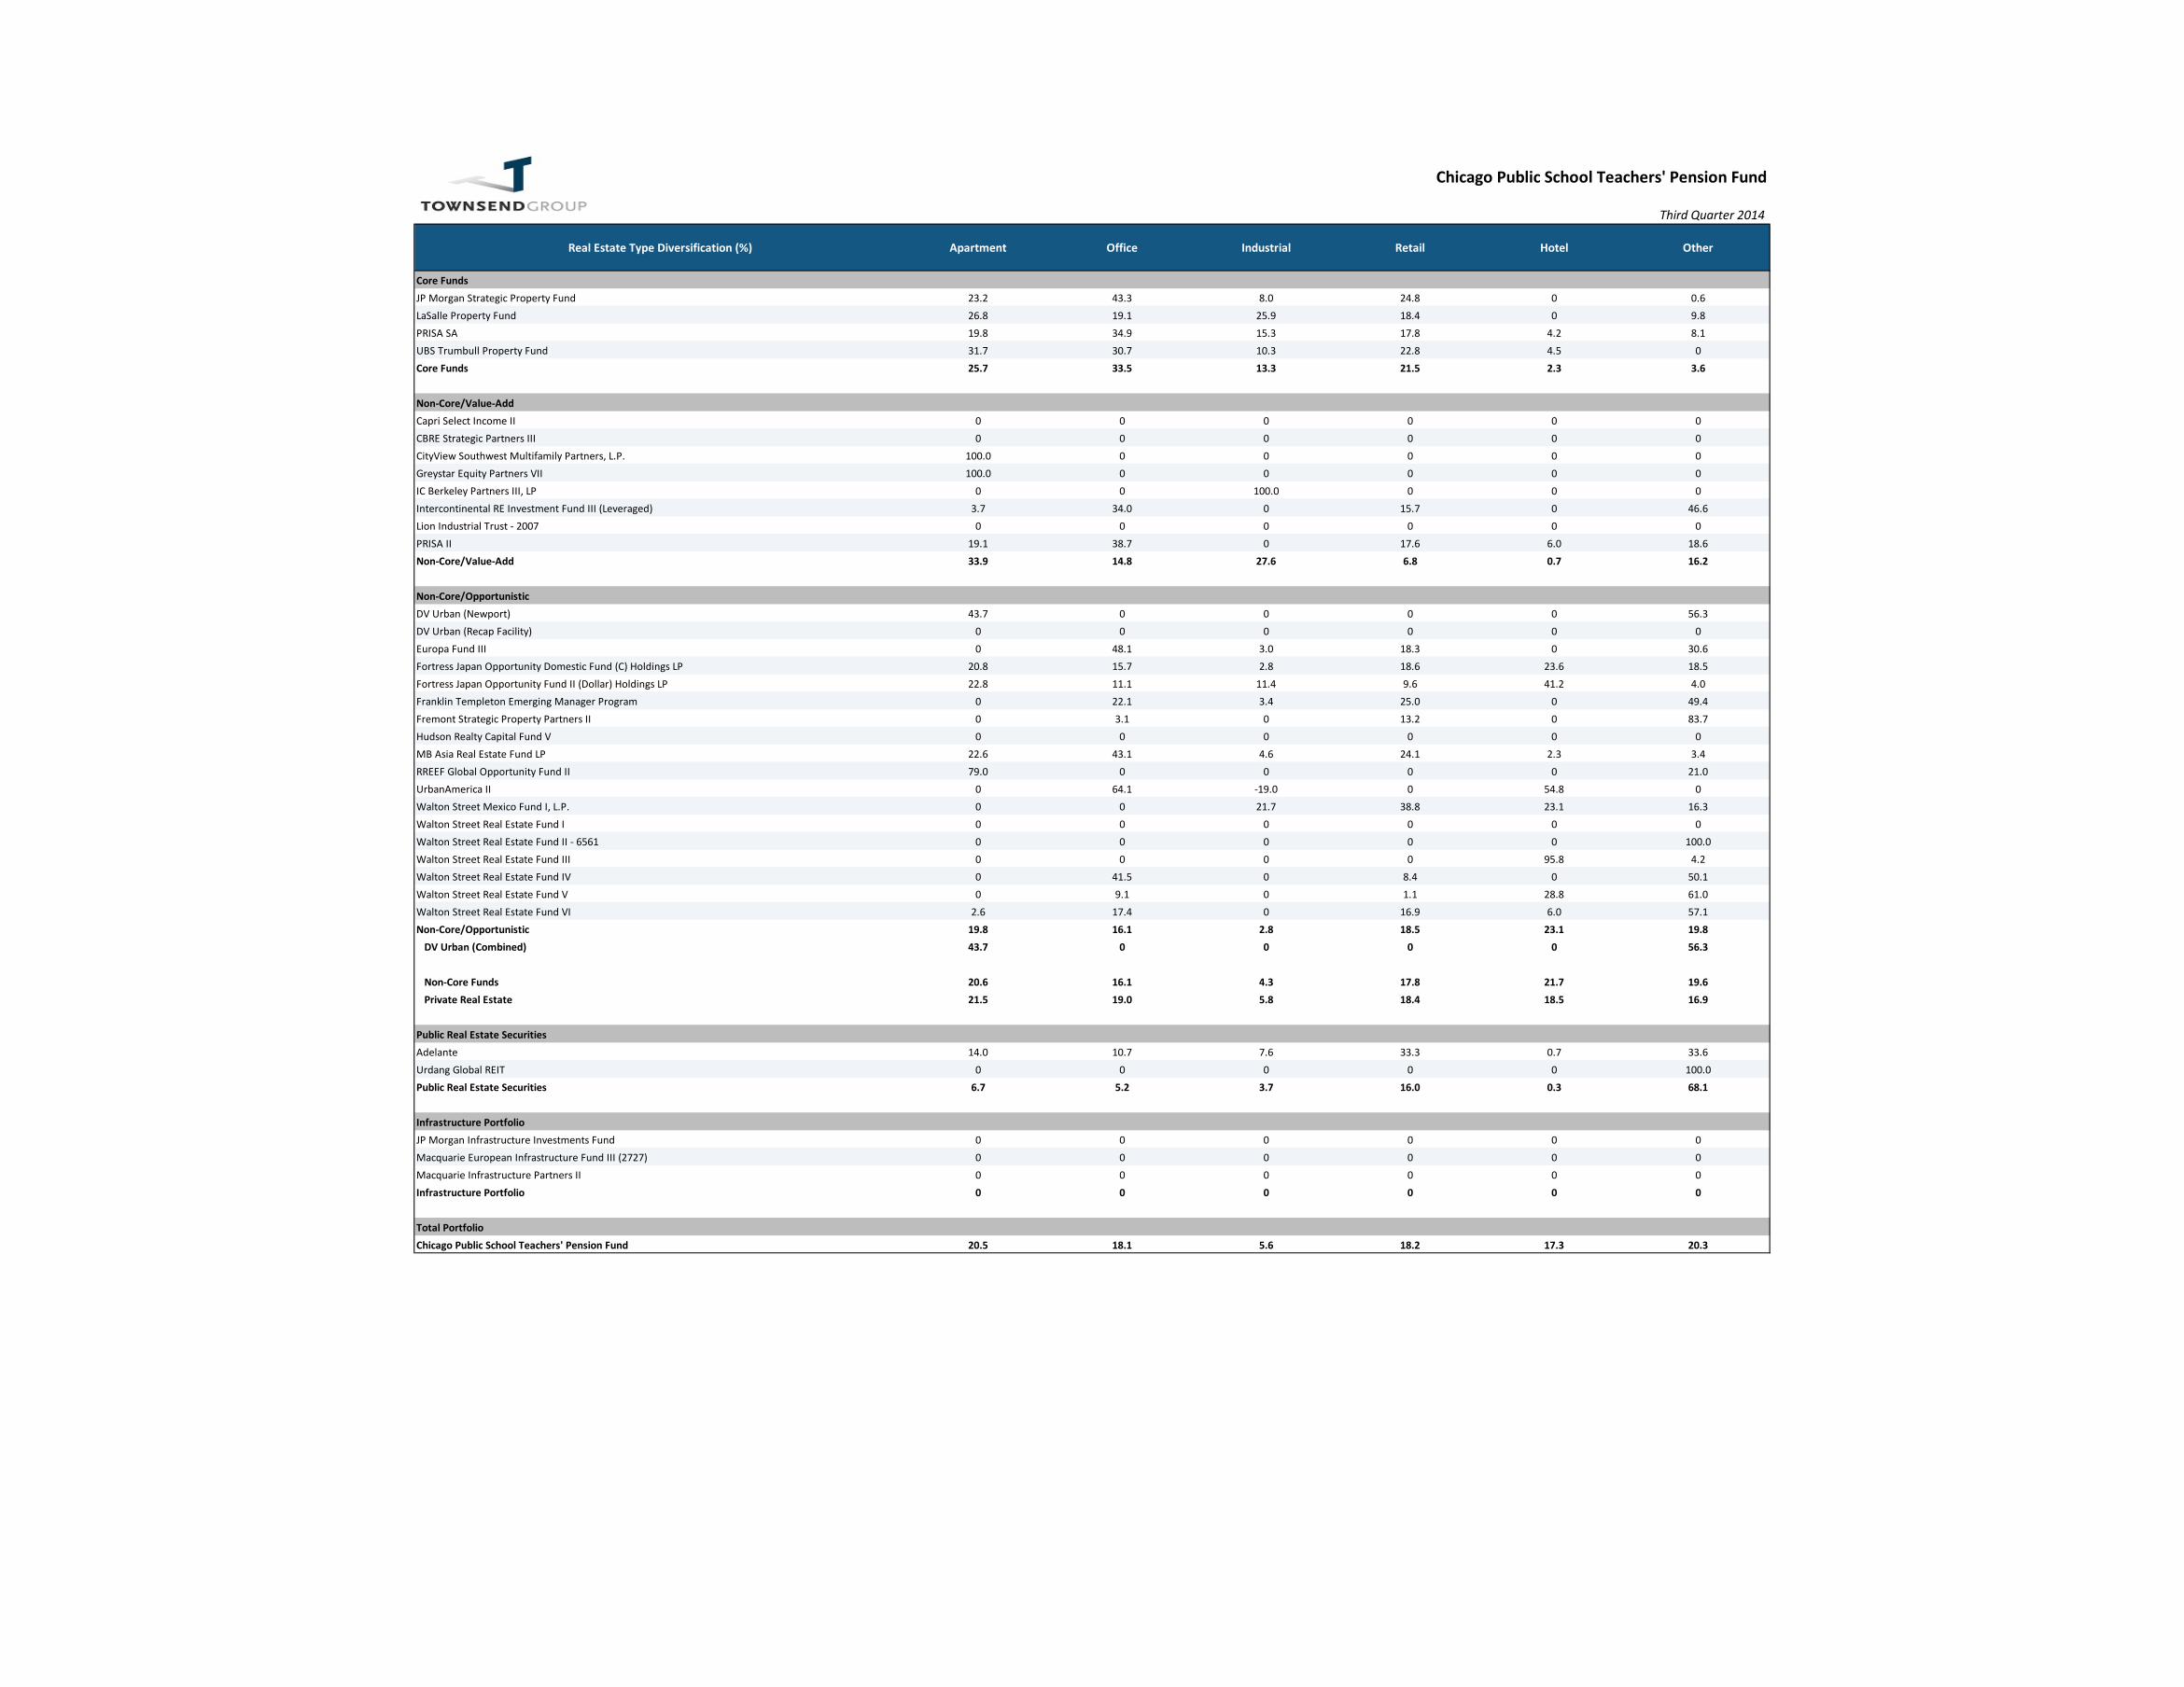
Real Estate Type Diversification (%) Apartment Office Industrial Retail Hotel Other
JP Morgan Strategic Property Fund 23.2 43.3 8.0 24.8 0 0.6LaSalle Property Fund 26.8 19.1 25.9 18.4 0 9.8PRISA SA 19.8 34.9 15.3 17.8 4.2 8.1UBS Trumbull Property Fund 31.7 30.7 10.3 22.8 4.5 0Core Funds 25.7 33.5 13.3 21.5 2.3 3.6
Capri Select Income II 0 0 0 0 0 0CBRE Strategic Partners III 0 0 0 0 0 0CityView Southwest Multifamily Partners, L.P. 100.0 0 0 0 0 0Greystar Equity Partners VII 100.0 0 0 0 0 0IC Berkeley Partners III, LP 0 0 100.0 0 0 0Intercontinental RE Investment Fund III (Leveraged) 3.7 34.0 0 15.7 0 46.6Lion Industrial Trust - 2007 0 0 0 0 0 0PRISA II 19.1 38.7 0 17.6 6.0 18.6Non-Core/Value-Add 33.9 14.8 27.6 6.8 0.7 16.2
DV Urban (Newport) 43.7 0 0 0 0 56.3DV Urban (Recap Facility) 0 0 0 0 0 0Europa Fund III 0 48.1 3.0 18.3 0 30.6Fortress Japan Opportunity Domestic Fund (C) Holdings LP 20.8 15.7 2.8 18.6 23.6 18.5Fortress Japan Opportunity Fund II (Dollar) Holdings LP 22.8 11.1 11.4 9.6 41.2 4.0Franklin Templeton Emerging Manager Program 0 22.1 3.4 25.0 0 49.4Fremont Strategic Property Partners II 0 3.1 0 13.2 0 83.7Hudson Realty Capital Fund V 0 0 0 0 0 0MB Asia Real Estate Fund LP 22.6 43.1 4.6 24.1 2.3 3.4RREEF Global Opportunity Fund II 79.0 0 0 0 0 21.0UrbanAmerica II 0 64.1 -19.0 0 54.8 0Walton Street Mexico Fund I, L.P. 0 0 21.7 38.8 23.1 16.3Walton Street Real Estate Fund I 0 0 0 0 0 0Walton Street Real Estate Fund II - 6561 0 0 0 0 0 100.0Walton Street Real Estate Fund III 0 0 0 0 95.8 4.2Walton Street Real Estate Fund IV 0 41.5 0 8.4 0 50.1Walton Street Real Estate Fund V 0 9.1 0 1.1 28.8 61.0Walton Street Real Estate Fund VI 2.6 17.4 0 16.9 6.0 57.1Non-Core/Opportunistic 19.8 16.1 2.8 18.5 23.1 19.8 DV Urban (Combined) 43.7 0 0 0 0 56.3
Non-Core Funds 20.6 16.1 4.3 17.8 21.7 19.6 Private Real Estate 21.5 19.0 5.8 18.4 18.5 16.9
Adelante 14.0 10.7 7.6 33.3 0.7 33.6Urdang Global REIT 0 0 0 0 0 100.0Public Real Estate Securities 6.7 5.2 3.7 16.0 0.3 68.1
JP Morgan Infrastructure Investments Fund 0 0 0 0 0 0Macquarie European Infrastructure Fund III (2727) 0 0 0 0 0 0Macquarie Infrastructure Partners II 0 0 0 0 0 0Infrastructure Portfolio 0 0 0 0 0 0
Total PortfolioChicago Public School Teachers' Pension Fund 20.5 18.1 5.6 18.2 17.3 20.3
Infrastructure Portfolio
Chicago Public School Teachers' Pension Fund
Third Quarter 2014
Core Funds
Non-Core/Value-Add
Non-Core/Opportunistic
Public Real Estate Securities
Geographic Diversification (%) North East Mid EastEast North
CentralWest North
Central South East South West Mountain Pacific Ex-US
JP Morgan Strategic Property Fund 20.9 9.6 5.2 0.1 9.6 15.1 3.1 36.4 0LaSalle Property Fund 19.0 11.1 14.9 0 12.0 6.3 1.8 35.0 0PRISA SA 20.0 14.2 5.6 1.7 13.1 7.3 1.3 36.6 0UBS Trumbull Property Fund 29.7 10.0 11.6 1.0 7.7 5.8 10.2 24.0 0Core Funds 23.1 11.0 8.9 0.7 10.3 9.0 4.6 32.4 0
Capri Select Income II 0 0 0 0 0 0 82.8 17.2 0CBRE Strategic Partners III 0 0 0 0 0 0 0 0 0CityView Southwest Multifamily Partners, L.P. 0 0 0 0 0 76.4 23.6 0 0Greystar Equity Partners VII 15.7 8.6 1.1 6.1 7.0 17.4 1.7 42.3 0IC Berkeley Partners III, LP 0 0 0 0 19.9 70.4 9.7 0 0Intercontinental RE Investment Fund III (Leveraged) 68.3 11.6 15.7 0 0 4.4 0 0 0Lion Industrial Trust - 2007 0 0 0 0 0 0 0 0 0PRISA II 28.0 12.0 5.4 0 12.6 4.5 2.2 35.2 0Non-Core/Value-Add 26.2 6.6 5.4 1.3 8.3 29.6 8.4 14.1 0
DV Urban (Newport) 0 0 0 100.0 0 0 0 0 0DV Urban (Recap Facility) 0 0 0 100.0 0 0 0 0 0Europa Fund III 0 0 0 0 0 0 0 0 100.0Fortress Japan Opportunity Domestic Fund (C) Holdings LP 0 0 0 0 0 0 0 0 100.0Fortress Japan Opportunity Fund II (Dollar) Holdings LP 0 0 0 0 0 0 0 0 100.0Franklin Templeton Emerging Manager Program 0 0 0 0 0 0 0 0 100.0Fremont Strategic Property Partners II 67.6 0 0 0 13.2 0 15.5 0.6 3.1Hudson Realty Capital Fund V 66.0 8.4 0.2 0 16.7 7.0 1.3 0.3 0MB Asia Real Estate Fund LP 0 0 0 0 0 0 0 0 100.0RREEF Global Opportunity Fund II 0 0 0 0 0 0 0 -0.6 100.6UrbanAmerica II -33.2 21.4 0 -30.9 57.8 14.8 3.6 66.5 0Walton Street Mexico Fund I, L.P. 0 0 0 0 0 0 0 0 100.0Walton Street Real Estate Fund I 0 0 0 0 0 0 0 0 0Walton Street Real Estate Fund II - 6561 0 0 0 0 0 0 4.5 0 95.5Walton Street Real Estate Fund III 0 0 0 0 0 0 95.8 4.2 0Walton Street Real Estate Fund IV 4.4 12.1 45.4 0 0 7.5 0 12.7 18.0Walton Street Real Estate Fund V 0 25.7 4.1 2.7 17.2 0.6 13.8 15.6 20.4Walton Street Real Estate Fund VI 20.9 9.5 4.0 0.4 4.7 6.9 11.4 40.2 2.0Non-Core/Opportunistic 16.6 6.3 4.8 -5.1 6.9 3.1 5.2 9.8 52.5 DV Urban (Combined) 0 0 0 100.0 0 0 0 0 0
Non-Core Funds 21.2 6.5 5.1 -2.0 7.6 15.9 6.7 11.9 27.2 Private Real Estate 22.4 9.2 7.4 -0.3 9.2 11.7 5.5 24.4 10.7
Adelante 14.7 5.5 3.7 1.2 6.6 3.7 2.5 13.0 47.9Urdang Global REIT 12.5 6.1 4.1 1.2 6.1 4.5 1.7 12.6 51.3Public Real Estate Securities 13.5 5.8 3.9 1.2 6.3 4.1 2.1 12.8 49.7
JP Morgan Infrastructure Investments Fund 0 0 0 0 0 0 0 0 0Macquarie European Infrastructure Fund III (2727) 0 0 0 0 0 0 0 0 100.0Macquarie Infrastructure Partners II 4.1 0 0 0 46.0 0 0 50.0 0Infrastructure Portfolio 1.9 0 0 0 21.7 0 0 23.6 52.8
Total PortfolioChicago Public School Teachers' Pension Fund 18.5 7.6 5.9 0.0 10.1 9.1 4.3 22.3 22.1
Infrastructure Portfolio
Chicago Public School Teachers' Pension Fund
Third Quarter 2014
Core Funds
Non-Core/Value-Add
Non-Core/Opportunistic
Public Real Estate Securities
Global Geographic Diversification (%)Developed Americas
Developed Europe Developed Asia Developed Middle East and Africa
Emerging Americas
Emerging Europe Emerging Asia Emerging Middle East and Africa
Frontier Other
JP Morgan Strategic Property Fund 100.0 - - - - - - - - -LaSalle Property Fund 100.0 - - - - - - - - -PRISA SA 100.0 - - - - - - - - -UBS Trumbull Property Fund 100.0 - - - - - - - - -Core Funds 100.0 - - - - - - - - -
Capri Select Income II 100.0 - - - - - - - - -CBRE Strategic Partners III - - - - - - - - - -CityView Southwest Multifamily Partners, L.P. 100.0 - - - - - - - - -Greystar Equity Partners VII 100.0 - - - - - - - - -IC Berkeley Partners III, LP 100.0 - - - - - - - - -Intercontinental RE Investment Fund III (Leveraged) 100.0 - - - - - - - - -Lion Industrial Trust - 2007 - - - - - - - - - -PRISA II 100.0 - - - - - - - - -Non-Core/Value-Add 100.0 - - - - - - - - -
DV Urban (Newport) 100.0 - - - - - - - - -DV Urban (Recap Facility) 100.0 - - - - - - - - -Europa Fund III - 83.0 - - - 9.6 - - 7.4 -Fortress Japan Opportunity Domestic Fund (C) Holdings LP - - 100.0 - - - - - - -Fortress Japan Opportunity Fund II (Dollar) Holdings LP - - 100.0 - - - - - - -Franklin Templeton Emerging Manager Program - - - - - - - - - 100.0Fremont Strategic Property Partners II 96.9 - - - 3.1 - - - - -Hudson Realty Capital Fund V 100.0 - - - - - - - - -MB Asia Real Estate Fund LP - - 49.0 - - - 51.0 - - -RREEF Global Opportunity Fund II -0.6 87.9 - - - 10.2 - - 2.4 -UrbanAmerica II 100.0 - - - - - - - - -Walton Street Mexico Fund I, L.P. - - - - 100.0 - - - - -Walton Street Real Estate Fund I - - - - - - - - - -Walton Street Real Estate Fund II - 6561 4.5 - - - 95.5 - - - - -Walton Street Real Estate Fund III 100.0 - - - - - - - - -Walton Street Real Estate Fund IV 82.0 - - - 3.7 14.3 - - - -Walton Street Real Estate Fund V 79.6 - - - 5.4 - 15.0 - - -Walton Street Real Estate Fund VI 98.0 - - - 0.6 - 1.4 - - -Non-Core/Opportunistic 47.5 7.8 18.3 - 5.4 2.1 3.4 - 0.7 14.8
Non-Core Funds 72.8 4.0 9.5 - 2.8 1.1 1.8 - 0.3 7.7 Private Real Estate 89.3 1.6 3.7 - 1.1 0.4 0.7 - 0.1 3.0
Adelante 52.1 - - - - - - - - 47.9Urdang Global REIT 52.1 18.0 26.9 - 0.3 0.5 2.3 - 0.0 -Public Real Estate Securities 52.1 9.3 14.0 - 0.1 0.3 1.2 - 0.0 23.0
JP Morgan Infrastructure Investments Fund - - - - - - - - - -Macquarie European Infrastructure Fund III (2727) - 96.2 - - - 3.8 - - - -Macquarie Infrastructure Partners II 100.0 - - - - - - - - -Infrastructure Portfolio 47.2 50.8 - - - 2.0 - - - -
Total PortfolioChicago Public School Teachers' Pension Fund 77.2 9.6 5.0 - 0.8 0.6 0.7 - 0.1 6.0
Infrastructure Portfolio
Chicago Public School Teachers' Pension Fund
Third Quarter 2014
Core Funds
Non-Core/Value-Add
Non-Core/Opportunistic
Public Real Estate Securities

B. Watch List Updates
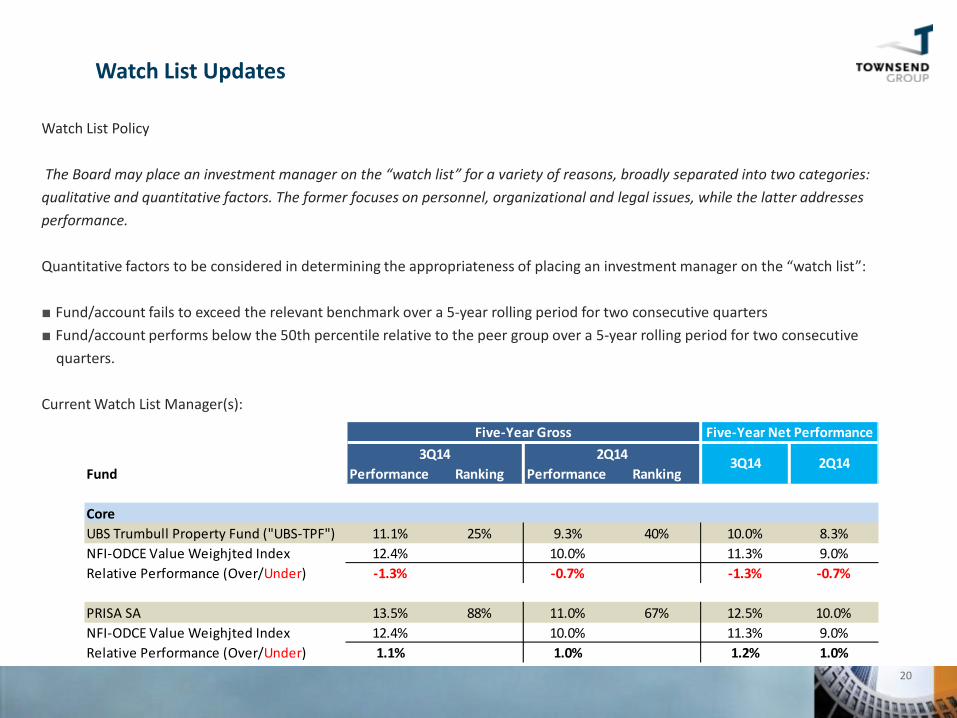
Watch List Policy The Board may place an investment manager on the “watch list” for a variety of reasons, broadly separated into two categories: qualitative and quantitative factors. The former focuses on personnel, organizational and legal issues, while the latter addresses performance. Quantitative factors to be considered in determining the appropriateness of placing an investment manager on the “watch list”: ■ Fund/account fails to exceed the relevant benchmark over a 5-year rolling period for two consecutive quarters ■ Fund/account performs below the 50th percentile relative to the peer group over a 5-year rolling period for two consecutive quarters. Current Watch List Manager(s):
20
Watch List Updates
Fund Performance Ranking Performance Ranking
CoreUBS Trumbull Property Fund ("UBS-TPF") 11.1% 25% 9.3% 40% 10.0% 8.3%NFI-ODCE Value Weighjted Index 12.4% 10.0% 11.3% 9.0%Relative Performance (Over/Under) -1.3% -0.7% -1.3% -0.7%
PRISA SA 13.5% 88% 11.0% 67% 12.5% 10.0%NFI-ODCE Value Weighjted Index 12.4% 10.0% 11.3% 9.0%Relative Performance (Over/Under) 1.1% 1.0% 1.2% 1.0%
Five-Year Gross2Q143Q14
Five-Year Net Performance
3Q14 2Q14
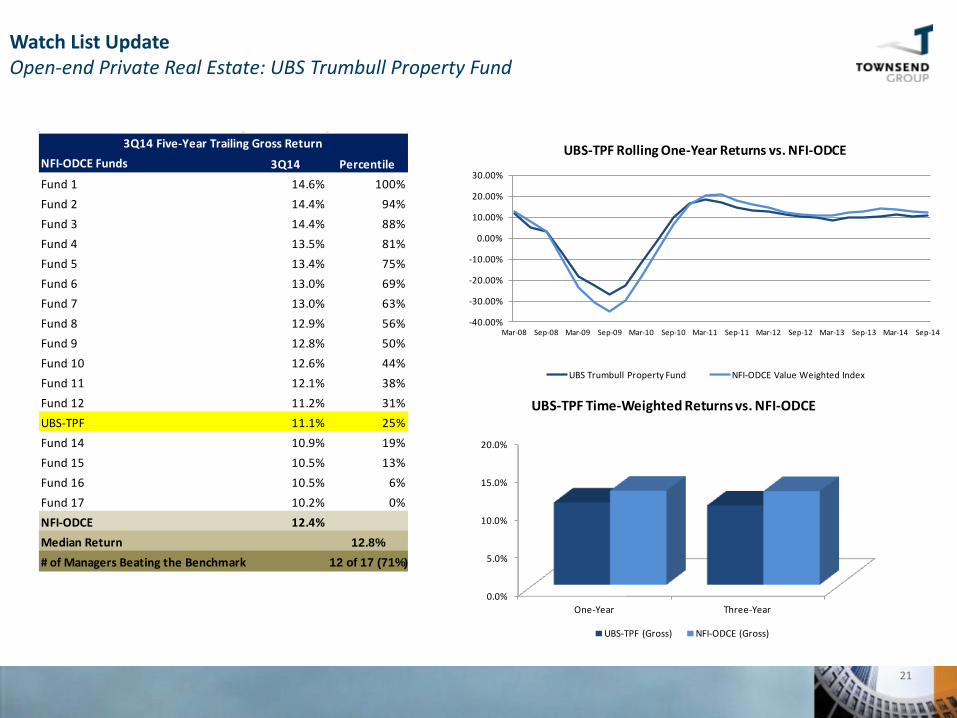
Watch List Update Open-end Private Real Estate: UBS Trumbull Property Fund
21
0.0%
5.0%
10.0%
15.0%
20.0%
One-Year Three-Year
UBS-TPF Time-Weighted Returns vs. NFI-ODCE
UBS-TPF (Gross) NFI-ODCE (Gross)
-40.00%
-30.00%
-20.00%
-10.00%
0.00%
10.00%
20.00%
30.00%
Mar-08 Sep-08 Mar-09 Sep-09 Mar-10 Sep-10 Mar-11 Sep-11 Mar-12 Sep-12 Mar-13 Sep-13 Mar-14 Sep-14
UBS-TPF Rolling One-Year Returns vs. NFI-ODCE
UBS Trumbull Property Fund NFI-ODCE Value Weighted Index
NFI-ODCE Funds 3Q14 PercentileFund 1 14.6% 100%Fund 2 14.4% 94%Fund 3 14.4% 88%Fund 4 13.5% 81%Fund 5 13.4% 75%Fund 6 13.0% 69%Fund 7 13.0% 63%Fund 8 12.9% 56%Fund 9 12.8% 50%Fund 10 12.6% 44%Fund 11 12.1% 38%Fund 12 11.2% 31%UBS-TPF 11.1% 25%Fund 14 10.9% 19%Fund 15 10.5% 13%Fund 16 10.5% 6%Fund 17 10.2% 0%NFI-ODCE 12.4%Median Return 12.8%# of Managers Beating the Benchmark 12 of 17 (71%)
3Q14 Five-Year Trailing Gross Return

C. Glossary Terms
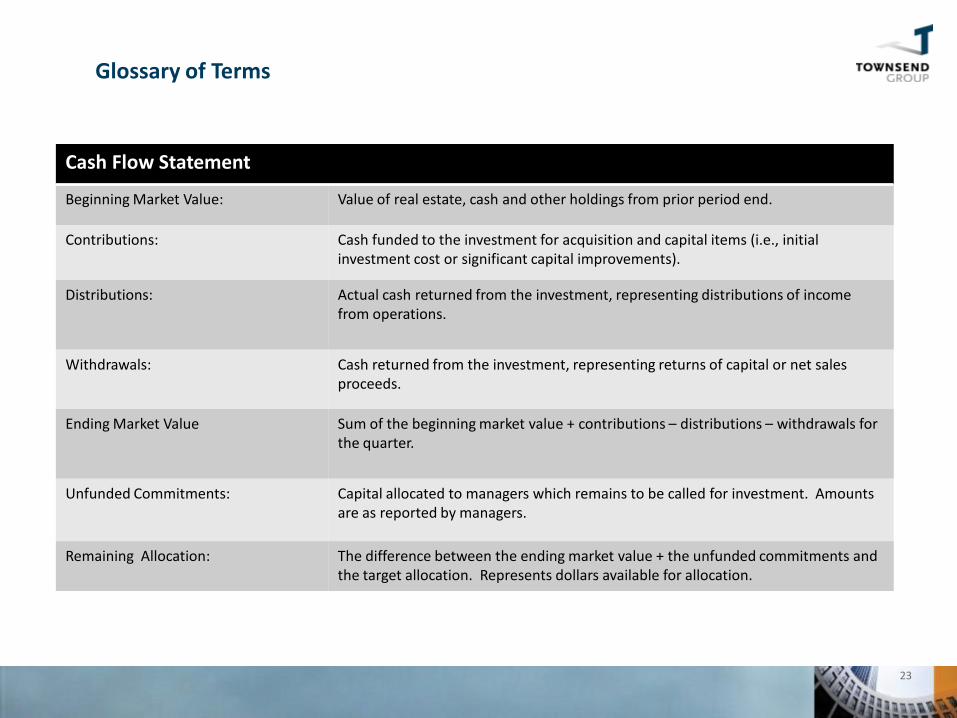
Cash Flow Statement
Beginning Market Value: Value of real estate, cash and other holdings from prior period end.
Contributions: Cash funded to the investment for acquisition and capital items (i.e., initial investment cost or significant capital improvements).
Distributions: Actual cash returned from the investment, representing distributions of income from operations.
Withdrawals: Cash returned from the investment, representing returns of capital or net sales proceeds.
Ending Market Value Sum of the beginning market value + contributions – distributions – withdrawals for the quarter.
Unfunded Commitments: Capital allocated to managers which remains to be called for investment. Amounts are as reported by managers.
Remaining Allocation: The difference between the ending market value + the unfunded commitments and the target allocation. Represents dollars available for allocation.
Glossary of Terms
23
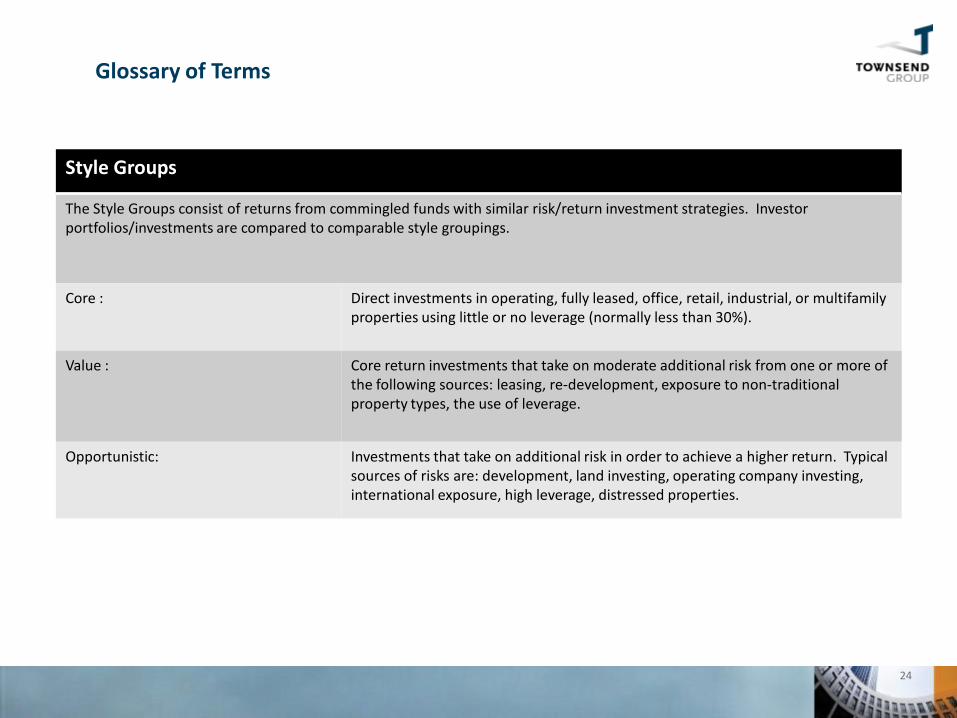
Style Groups
The Style Groups consist of returns from commingled funds with similar risk/return investment strategies. Investor portfolios/investments are compared to comparable style groupings.
Core : Direct investments in operating, fully leased, office, retail, industrial, or multifamily properties using little or no leverage (normally less than 30%).
Value : Core return investments that take on moderate additional risk from one or more of the following sources: leasing, re-development, exposure to non-traditional property types, the use of leverage.
Opportunistic: Investments that take on additional risk in order to achieve a higher return. Typical sources of risks are: development, land investing, operating company investing, international exposure, high leverage, distressed properties.
Glossary of Terms
24
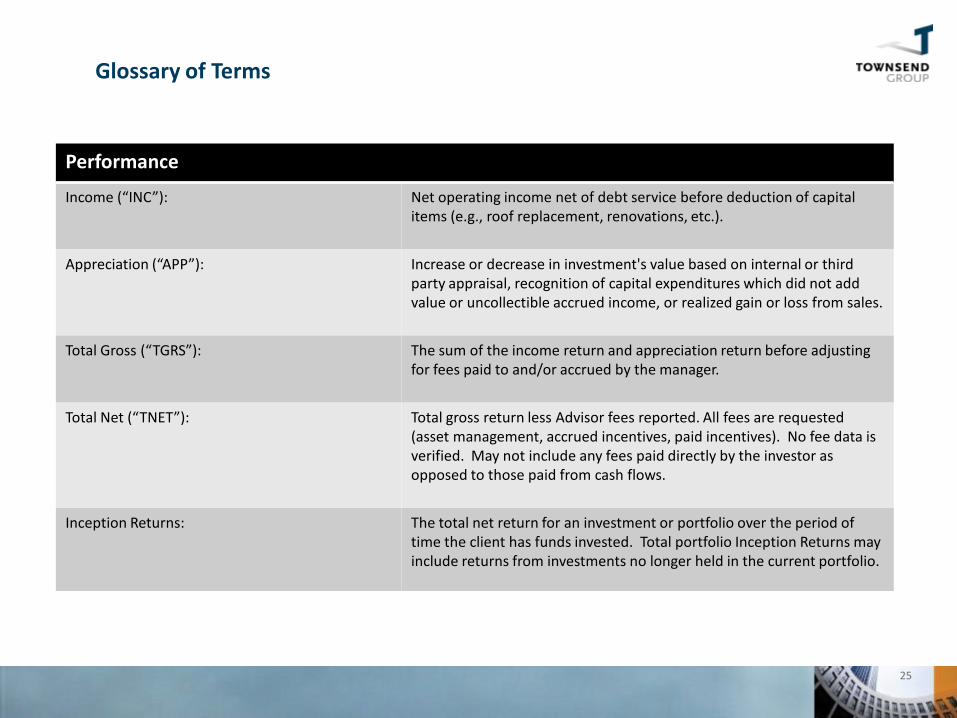
Performance
Income (“INC”): Net operating income net of debt service before deduction of capital items (e.g., roof replacement, renovations, etc.).
Appreciation (“APP”): Increase or decrease in investment's value based on internal or third party appraisal, recognition of capital expenditures which did not add value or uncollectible accrued income, or realized gain or loss from sales.
Total Gross (“TGRS”): The sum of the income return and appreciation return before adjusting for fees paid to and/or accrued by the manager.
Total Net (“TNET”): Total gross return less Advisor fees reported. All fees are requested (asset management, accrued incentives, paid incentives). No fee data is verified. May not include any fees paid directly by the investor as opposed to those paid from cash flows.
Inception Returns: The total net return for an investment or portfolio over the period of time the client has funds invested. Total portfolio Inception Returns may include returns from investments no longer held in the current portfolio.
Glossary of Terms
25

Glossary of Terms
26
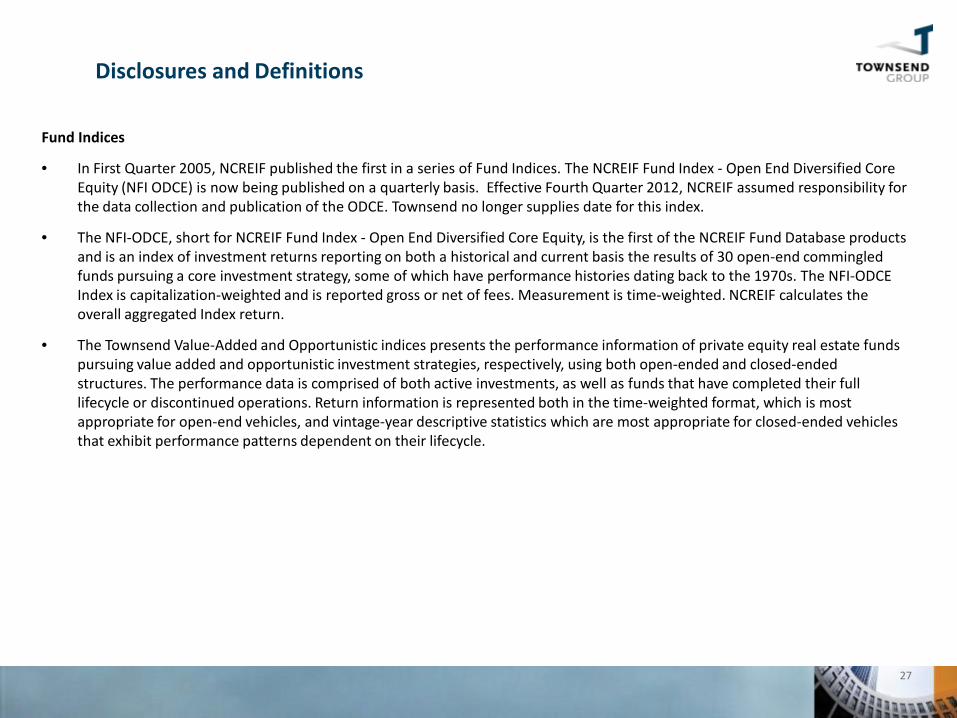
Fund Indices
• In First Quarter 2005, NCREIF published the first in a series of Fund Indices. The NCREIF Fund Index - Open End Diversified Core Equity (NFI ODCE) is now being published on a quarterly basis. Effective Fourth Quarter 2012, NCREIF assumed responsibility for the data collection and publication of the ODCE. Townsend no longer supplies date for this index.
• The NFI-ODCE, short for NCREIF Fund Index - Open End Diversified Core Equity, is the first of the NCREIF Fund Database products and is an index of investment returns reporting on both a historical and current basis the results of 30 open-end commingled funds pursuing a core investment strategy, some of which have performance histories dating back to the 1970s. The NFI-ODCE Index is capitalization-weighted and is reported gross or net of fees. Measurement is time-weighted. NCREIF calculates the overall aggregated Index return.
• The Townsend Value-Added and Opportunistic indices presents the performance information of private equity real estate funds pursuing value added and opportunistic investment strategies, respectively, using both open-ended and closed-ended structures. The performance data is comprised of both active investments, as well as funds that have completed their full lifecycle or discontinued operations. Return information is represented both in the time-weighted format, which is most appropriate for open-end vehicles, and vintage-year descriptive statistics which are most appropriate for closed-ended vehicles that exhibit performance patterns dependent on their lifecycle.
Disclosures and Definitions
27