Embed Size (px)
Citation preview
Email Question Answer
And
Analysis of China Real Estate Market
Kaifeng Xia
Columbia University
May 1st, 2015 - May 3rd, 2015
Kiafeng Xia 1 / 14
Contents
Part I: Question Answer ................................................................................................... 2
Summarize the recent policy adjustment of sales tax for secondary home owners: .... 2
How it will impact the transaction vol and prices in both the primary and secondary
markets ......................................................................................................................... 2
Any quantitative measure of the impact from the adjustments .................................... 3
Who will benefit the most and why? ........................................................................... 3
Whether you think it will help to boost the overall housing market in China. ............ 4
Part II: Analysis of China Real Estate Market .............................................................. 5
Conclusion ................................................................................................................... 5
Overall .......................................................................................................................... 5
Long-term Analysis ...................................................................................................... 6
Short-term Analysis ..................................................................................................... 9
Part III: Quantitative Model .......................................................................................... 10
Part IV: Some Problems .................................................................................................. 11
Problematic Data Source ............................................................................................ 11
Suggested Classification of Cities ............................................................................. 11
Kiafeng Xia 2 / 14
Part I: Question Answer
Summarize the recent policy adjustment of sales tax for secondary home owners:
1) Regarding Secondary House Sales Tax: Non-ordinary residence owner who sells the
property purchased in less than 2 years shall be collected sales tax at full price. Non-
ordinary residence owner who sells the property purchased more than 5 years ago and
ordinary residence owner who sell the property purchased in less than 2 years shall be
collected sales tax against the difference between purchasing price and selling price.
Ordinary residence owner who sells the property purchased more than 5 years ago shall
be full sales tax exempted.
2) Regarding Second Home Minimum Down Payment: Minimum down payment for
purchasing second home has reduced to 40% from 60%-70%
How it will impact the transaction vol and prices in both the primary and secondary
markets
I think it would help the transaction volume and prices going up but not very significantly.
Superficially, the policy adjustments in secondary market are not supposed to impact the
primary market much, but they actually do. I think the adjustments are in favor of buyers
who already owned a home but would like to improve their living condition. That is, the
demand of improvement. Also, the adjustments would help develop the secondary market
in China in a long-term, which is currently relatively small. This is good for society wealth
distribution, if no speculative activities are involved. In conclusion, at present, the
government hope to heat up the overall real estate market through every supportive policy,
regardless they are focused on primary market or on secondary market.
Kiafeng Xia 3 / 14
Any quantitative measure of the impact from the adjustments
The only data source I am able to access now is National Bureau of Statistics of China. The
data there for April has not been available to me yet, so the quantitative measure of impact
from these adjustments on March 30 has not been clear. However, other adjustments issued
by the government last year have shown some impacts quantitatively. According to news
last year, some markets in large cities have responded to the policy adjustments.
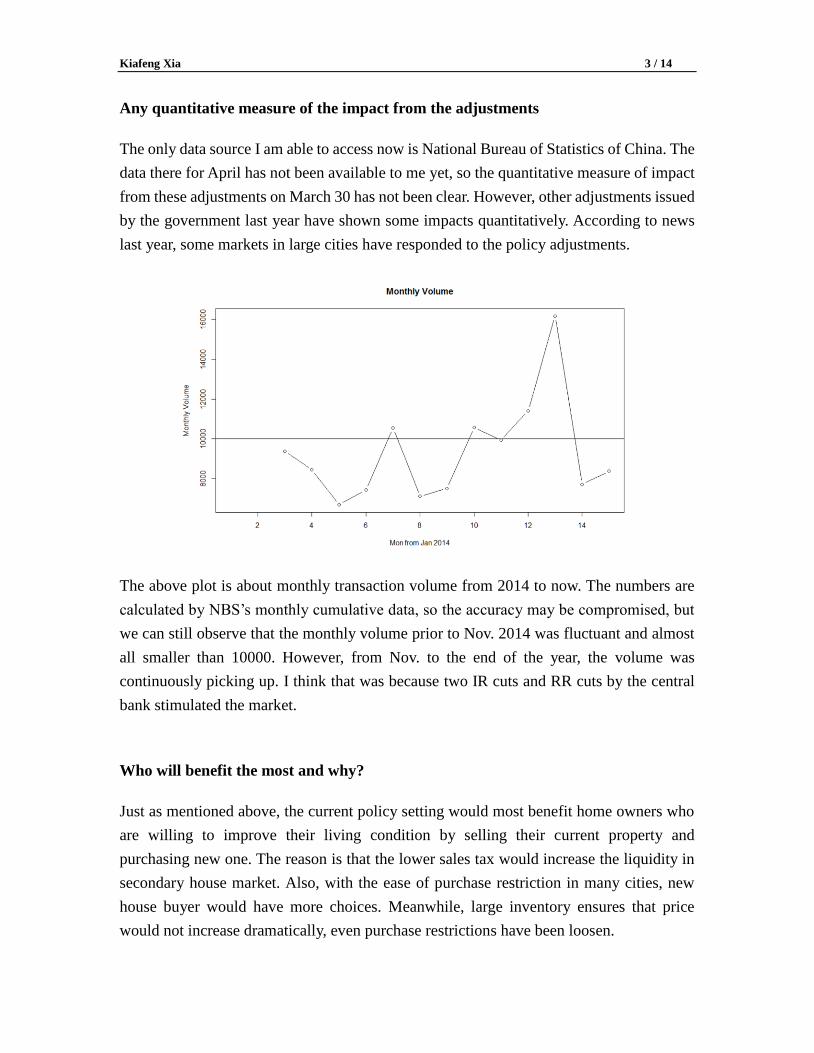
The above plot is about monthly transaction volume from 2014 to now. The numbers are
calculated by NBS’s monthly cumulative data, so the accuracy may be compromised, but
we can still observe that the monthly volume prior to Nov. 2014 was fluctuant and almost
all smaller than 10000. However, from Nov. to the end of the year, the volume was
continuously picking up. I think that was because two IR cuts and RR cuts by the central
bank stimulated the market.
Who will benefit the most and why?
Just as mentioned above, the current policy setting would most benefit home owners who
are willing to improve their living condition by selling their current property and
purchasing new one. The reason is that the lower sales tax would increase the liquidity in
secondary house market. Also, with the ease of purchase restriction in many cities, new
house buyer would have more choices. Meanwhile, large inventory ensures that price
would not increase dramatically, even purchase restrictions have been loosen.
Kiafeng Xia 4 / 14
Whether you think it will help to boost the overall housing market in China.
It cannot be denied that such ease adjustments would somehow help to boost the overall
housing market. However, I doubt the effect of these adjustments, because
1) The secondary house market is relatively small in China. Chinese home buyers are
more willing to buy new residence. Therefore, I think adjustments in secondary market
only play an assistant role.
2) The recent drop in housing market mainly results from large inventory. Secondary
market stimulation may show the impact in a long term as the improvement demand
grows slow.
3) Loosening policy setting may be only expedient, since speculative activities may come
back to the market after purchase restriction was removed for some time, which may
recall the restrictions.
4) The reduction of minimum requirement for down payment was just changing it to a
moderate level. 40% is not very encouraging.
However, to a long-term extent, I think the real estate market in China would recover and
increase stable until the population structure is largely changed in the future. Because the
need is there, no policy or administrative measures could permanently beat the supply-
demand relationship.
Kiafeng Xia 5 / 14
Part II: Analysis of China Real Estate Market
This report mainly analyzes the China real estate market from beginning of 2014 to March,
2015, and secondary house market after policy adjustments.
Conclusion
1) In the long term, China real estate market would develop differentially depending on
regions and cities. Such fragmented development has started showing. The scale of the
market would stay large but fragmented development would cause uneven distribution
of the total. Also, in the future, large real estate companies would have more
opportunities while small ones would have more risks.
2) In the short term, the 2015 real estate market would gradually recover. The volume
would increase mildly and price may not increase significantly in light of large
inventory awaiting. The recovery rate depends on specific situation of each city.
The above 2 opinions are partially referred to monthly data from National Bureau of
Statistics of the PRC and reports from China Index Academy
Overall
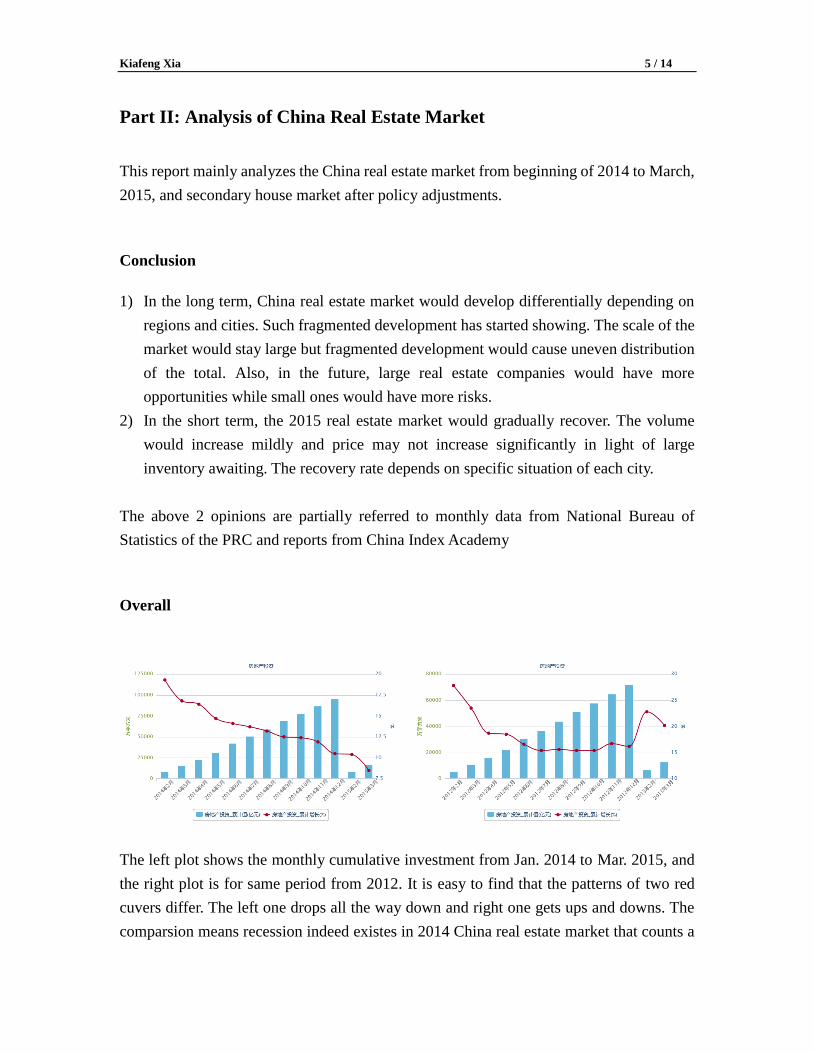
The left plot shows the monthly cumulative investment from Jan. 2014 to Mar. 2015, and
the right plot is for same period from 2012. It is easy to find that the patterns of two red
cuvers differ. The left one drops all the way down and right one gets ups and downs. The
comparsion means recession indeed existes in 2014 China real estate market that counts a
Kiafeng Xia 6 / 14
large portion of the China overall economy. Therefore, its bad performance directly brought
the government relaxing sales tax on March 30, 2015, along with more easy financail
supports issued before, in order to maintain the development of overall economy.
In my opinion, the recession in the market is a consequence of the existance of bubble in
the market. The cause of recession is primarily due to large inventoy levels in many cities.
Deveplors’ expectation was too optimistic on the market, so they built too many houses.
They had such expectation because the speculative activies were prevailing in the past,
which pushed the price skyrocketing. To squeeze out the speculative activies, many cities
implemented purchase restriction couple years ago, which resulted the nowaday redundent
inventory. Impacted by the recession, many small realtors are living hard.
Long-term Analysis
In long term, the gross real estate market would be huge. This judgment comes from 1)
China has a large population base, 2) job opportunities would bring movement of
population, 3) cities are developing and expanding.
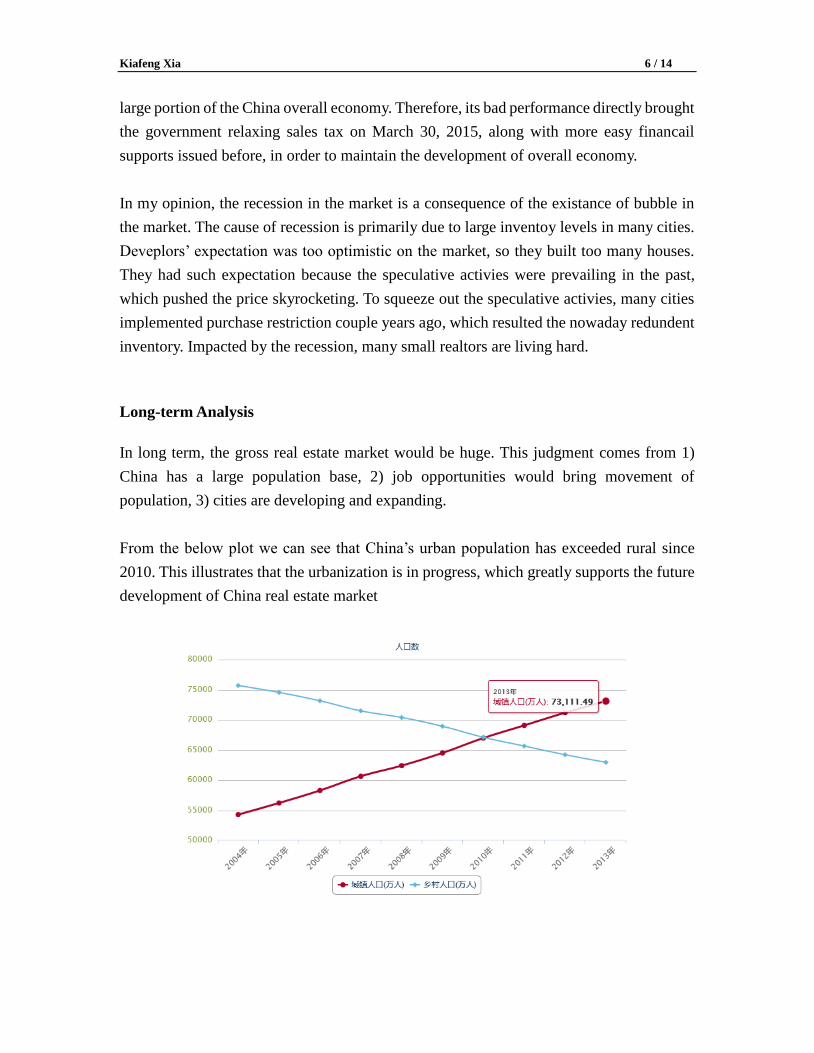
From the below plot we can see that China’s urban population has exceeded rural since
2010. This illustrates that the urbanization is in progress, which greatly supports the future
development of China real estate market
Kiafeng Xia 7 / 14
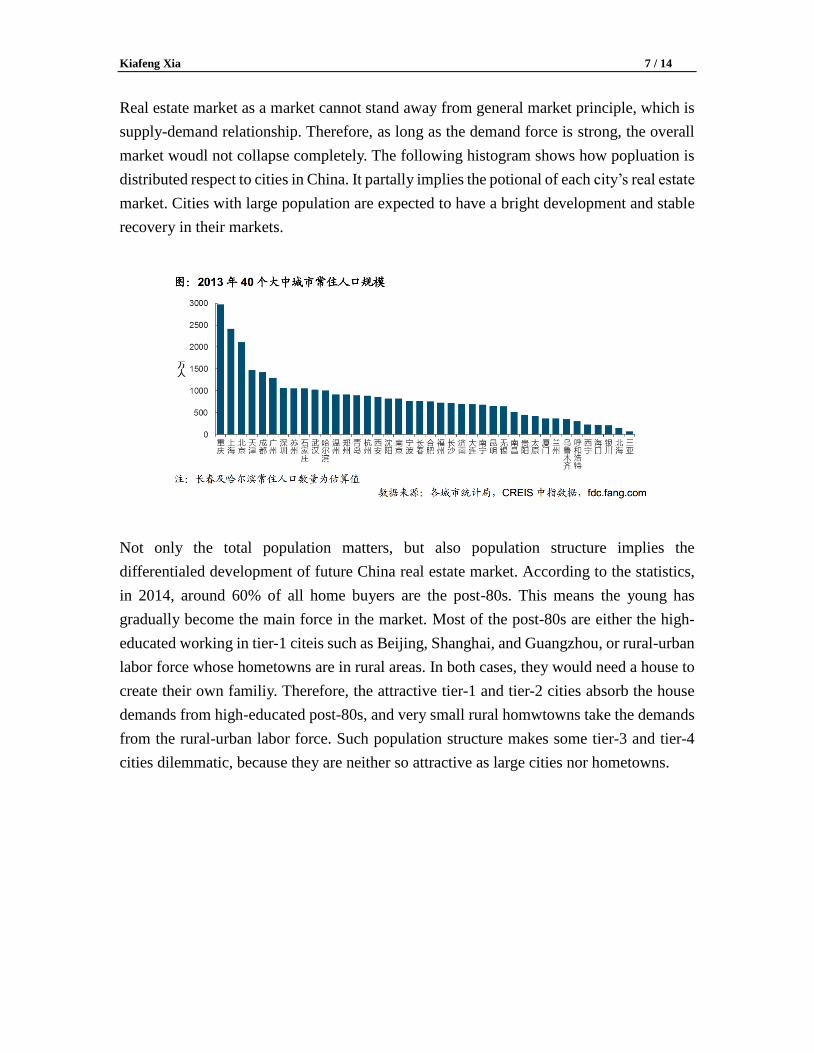
Real estate market as a market cannot stand away from general market principle, which is
supply-demand relationship. Therefore, as long as the demand force is strong, the overall
market woudl not collapse completely. The following histogram shows how popluation is
distributed respect to cities in China. It partally implies the potional of each city’s real estate
market. Cities with large population are expected to have a bright development and stable
recovery in their markets.
Not only the total population matters, but also population structure implies the
differentialed development of future China real estate market. According to the statistics,
in 2014, around 60% of all home buyers are the post-80s. This means the young has
gradually become the main force in the market. Most of the post-80s are either the high-
educated working in tier-1 citeis such as Beijing, Shanghai, and Guangzhou, or rural-urban
labor force whose hometowns are in rural areas. In both cases, they would need a house to
create their own familiy. Therefore, the attractive tier-1 and tier-2 cities absorb the house
demands from high-educated post-80s, and very small rural homwtowns take the demands
from the rural-urban labor force. Such population structure makes some tier-3 and tier-4
cities dilemmatic, because they are neither so attractive as large cities nor hometowns.
Kiafeng Xia 8 / 14
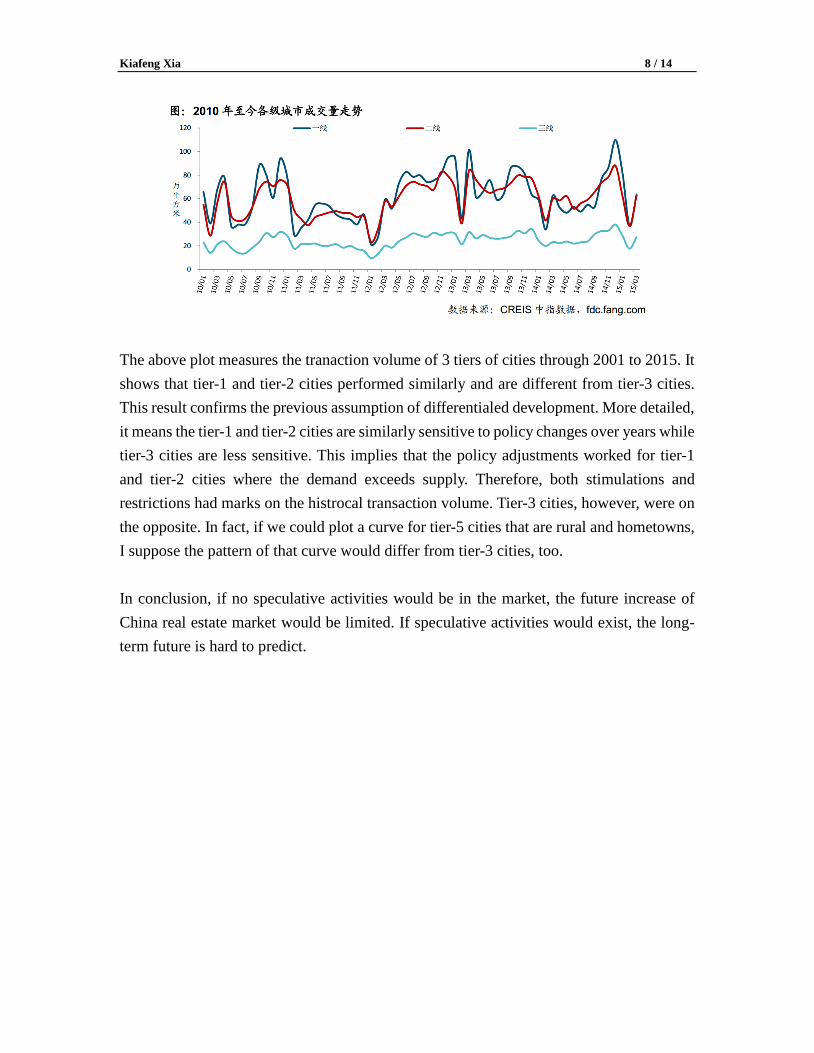
The above plot measures the tranaction volume of 3 tiers of cities through 2001 to 2015. It
shows that tier-1 and tier-2 cities performed similarly and are different from tier-3 cities.
This result confirms the previous assumption of differentialed development. More detailed,
it means the tier-1 and tier-2 cities are similarly sensitive to policy changes over years while
tier-3 cities are less sensitive. This implies that the policy adjustments worked for tier-1
and tier-2 cities where the demand exceeds supply. Therefore, both stimulations and
restrictions had marks on the histrocal transaction volume. Tier-3 cities, however, were on
the opposite. In fact, if we could plot a curve for tier-5 cities that are rural and hometowns,
I suppose the pattern of that curve would differ from tier-3 cities, too.
In conclusion, if no speculative activities would be in the market, the future increase of
China real estate market would be limited. If speculative activities would exist, the long-
term future is hard to predict.
Kiafeng Xia 9 / 14
Short-term Analysis
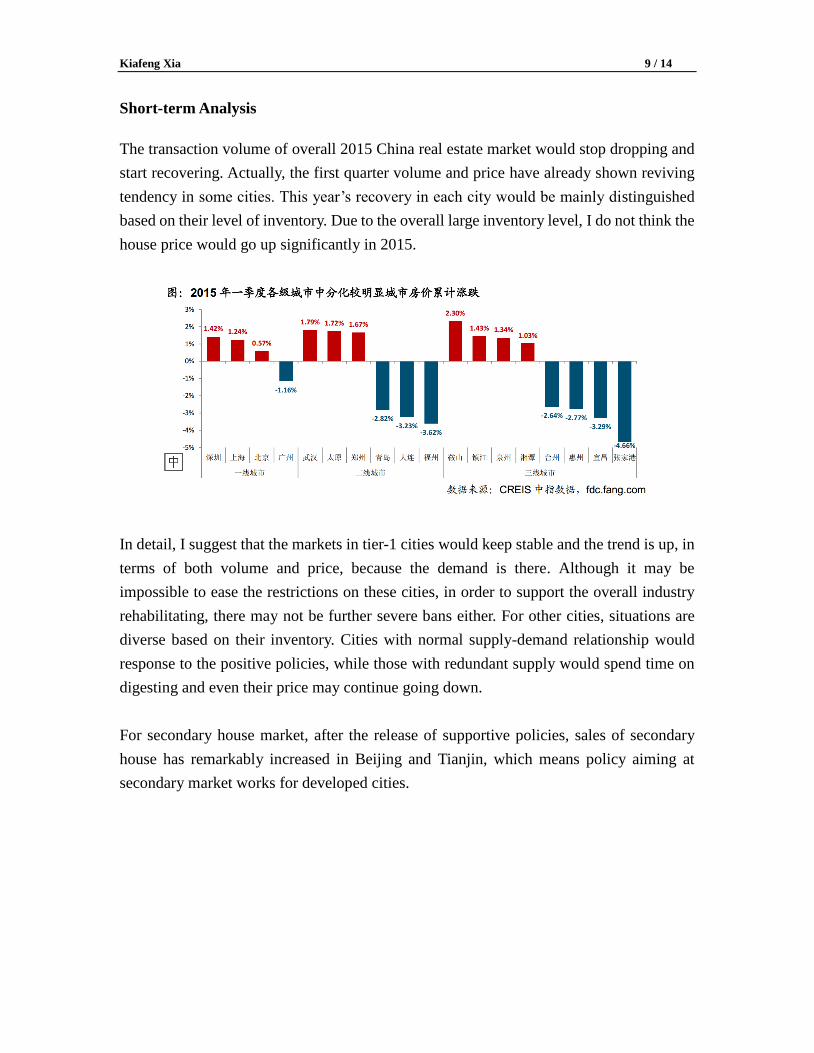
The transaction volume of overall 2015 China real estate market would stop dropping and
start recovering. Actually, the first quarter volume and price have already shown reviving
tendency in some cities. This year’s recovery in each city would be mainly distinguished
based on their level of inventory. Due to the overall large inventory level, I do not think the
house price would go up significantly in 2015.
In detail, I suggest that the markets in tier-1 cities would keep stable and the trend is up, in
terms of both volume and price, because the demand is there. Although it may be
impossible to ease the restrictions on these cities, in order to support the overall industry
rehabilitating, there may not be further severe bans either. For other cities, situations are
diverse based on their inventory. Cities with normal supply-demand relationship would
response to the positive policies, while those with redundant supply would spend time on
digesting and even their price may continue going down.
For secondary house market, after the release of supportive policies, sales of secondary
house has remarkably increased in Beijing and Tianjin, which means policy aiming at
secondary market works for developed cities.
Kiafeng Xia 10 / 14
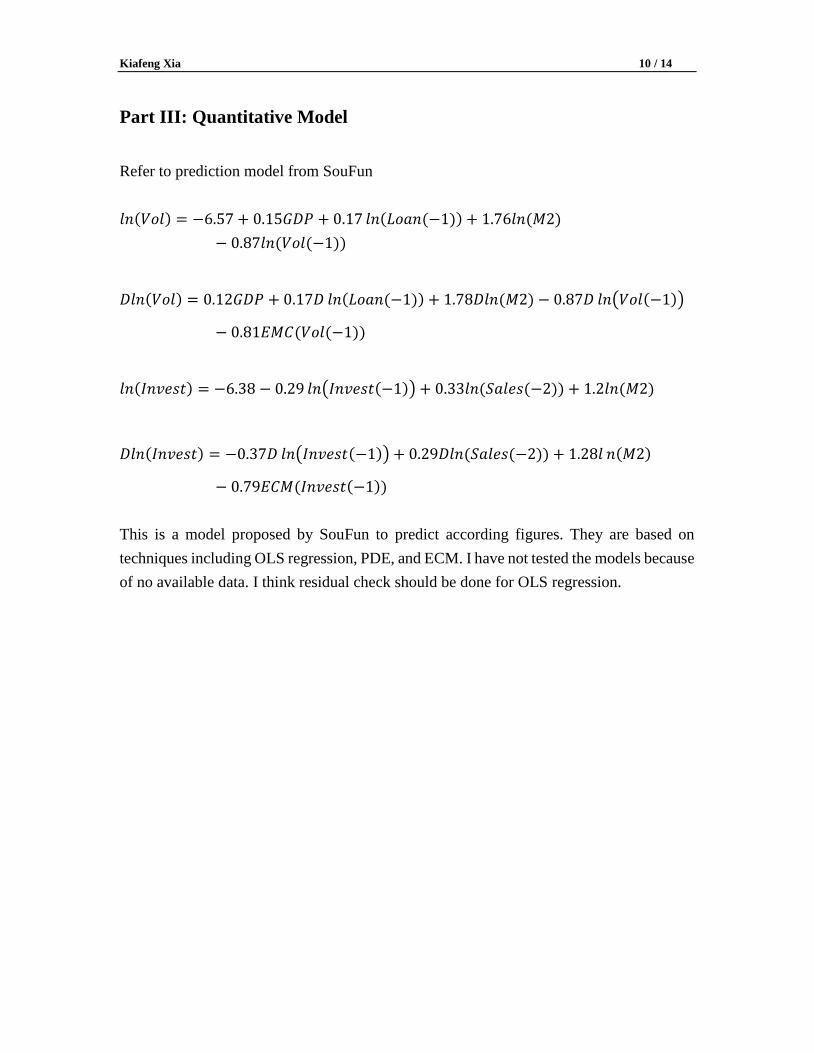
Part III: Quantitative Model
Refer to prediction model from SouFun
𝑙𝑛(𝑉𝑜𝑙) = −6.57 + 0.15𝐺𝐷𝑃 + 0.17 𝑙𝑛(𝐿𝑜𝑎𝑛(−1)) + 1.76𝑙𝑛(𝑀2)
− 0.87𝑙𝑛(𝑉𝑜𝑙(−1))
𝐷𝑙𝑛(𝑉𝑜𝑙) = 0.12𝐺𝐷𝑃 + 0.17𝐷 𝑙𝑛(𝐿𝑜𝑎𝑛(−1)) + 1.78𝐷𝑙𝑛(𝑀2) − 0.87𝐷 𝑙𝑛(𝑉𝑜𝑙(−1))
− 0.81𝐸𝑀𝐶(𝑉𝑜𝑙(−1))
𝑙𝑛(𝐼𝑛𝑣𝑒𝑠𝑡) = −6.38 − 0.29 𝑙𝑛(𝐼𝑛𝑣𝑒𝑠𝑡(−1)) + 0.33𝑙𝑛(𝑆𝑎𝑙𝑒𝑠(−2)) + 1.2𝑙𝑛(𝑀2)
𝐷𝑙𝑛(𝐼𝑛𝑣𝑒𝑠𝑡) = −0.37𝐷 𝑙𝑛(𝐼𝑛𝑣𝑒𝑠𝑡(−1)) + 0.29𝐷𝑙𝑛(𝑆𝑎𝑙𝑒𝑠(−2)) + 1.28𝑙 𝑛(𝑀2)
− 0.79𝐸𝐶𝑀(𝐼𝑛𝑣𝑒𝑠𝑡(−1))
This is a model proposed by SouFun to predict according figures. They are based on
techniques including OLS regression, PDE, and ECM. I have not tested the models because
of no available data. I think residual check should be done for OLS regression.
Kiafeng Xia 11 / 14
Part IV: Some Problems
Problematic Data Source
1) The data source may be the most problematic issue during the research. The data from
National Bureau of Statistics of PRC is terrible. They are too insufficient and in an
unusable form mostly. Therefore, I could not either make my own quantitative
prediction or even test the model from SouFun. It seems that China Index Academy has
a database that provides relatively feasible data, but I do not have access to it. In fact,
the problem of data source has always been a problem when doing China-related
research.
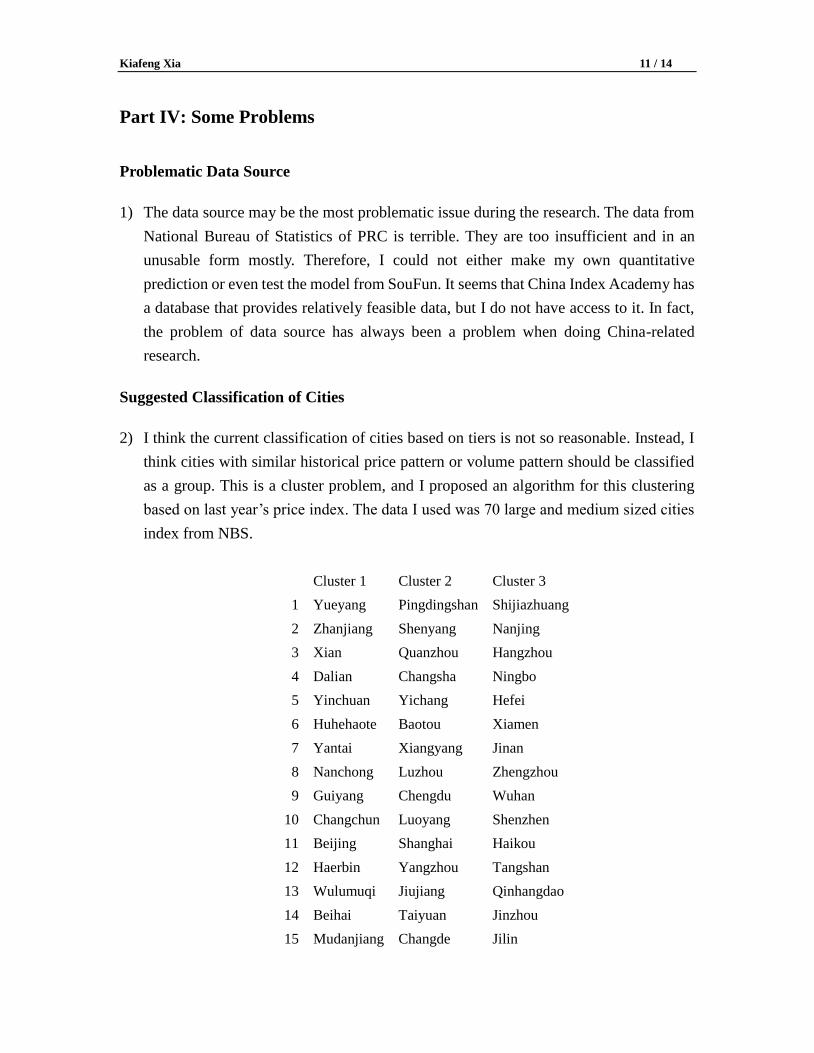
Suggested Classification of Cities
2) I think the current classification of cities based on tiers is not so reasonable. Instead, I
think cities with similar historical price pattern or volume pattern should be classified
as a group. This is a cluster problem, and I proposed an algorithm for this clustering
based on last year’s price index. The data I used was 70 large and medium sized cities
index from NBS.
Cluster 1 Cluster 2 Cluster 3
1 Yueyang Pingdingshan Shijiazhuang
2 Zhanjiang Shenyang Nanjing
3 Xian Quanzhou Hangzhou
4 Dalian Changsha Ningbo
5 Yinchuan Yichang Hefei
6 Huhehaote Baotou Xiamen
7 Yantai Xiangyang Jinan
8 Nanchong Luzhou Zhengzhou
9 Guiyang Chengdu Wuhan
10 Changchun Luoyang Shenzhen
11 Beijing Shanghai Haikou
12 Haerbin Yangzhou Tangshan
13 Wulumuqi Jiujiang Qinhangdao
14 Beihai Taiyuan Jinzhou
15 Mudanjiang Changde Jilin
Kiafeng Xia 12 / 14
16 Qingdao Nanning Wuxi
17 Kunming Fuzhou Xuzhou
18 Zunyi Nanchang Wenzhou
19 Guilin Shaoguan Jinhua
20 Jining Tianjin Bengbu
21 Xining Lanzhou Anqing
22 Dandong Chongqing Ganzhou
23 Guangzhou Sanya Huizhou
24 Yueyang Pingdingshan Dali
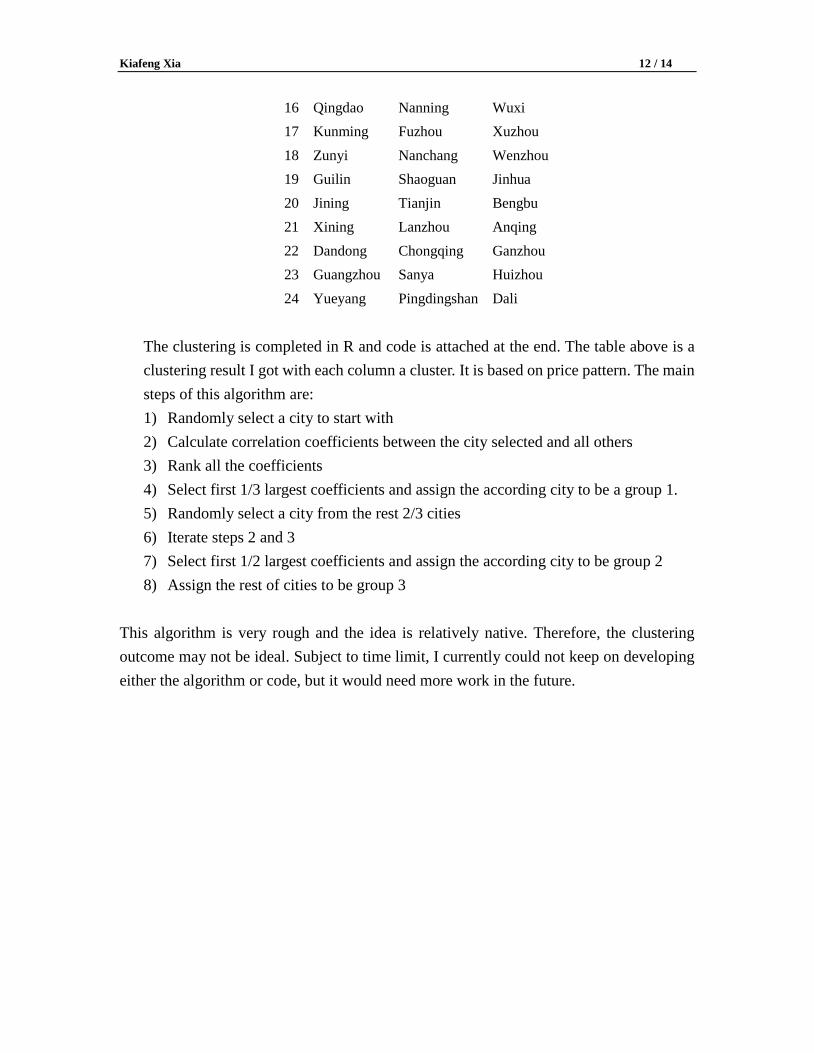
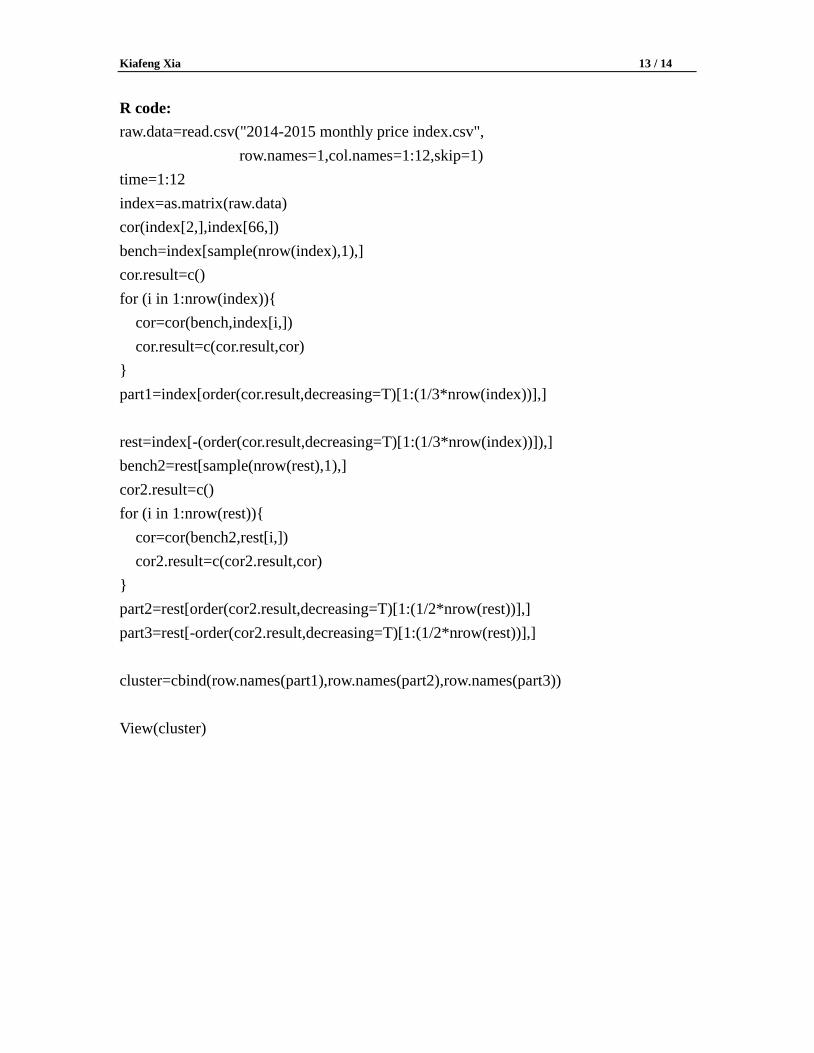
The clustering is completed in R and code is attached at the end. The table above is a
clustering result I got with each column a cluster. It is based on price pattern. The main
steps of this algorithm are:
1) Randomly select a city to start with
2) Calculate correlation coefficients between the city selected and all others
3) Rank all the coefficients
4) Select first 1/3 largest coefficients and assign the according city to be a group 1.
5) Randomly select a city from the rest 2/3 cities
6) Iterate steps 2 and 3
7) Select first 1/2 largest coefficients and assign the according city to be group 2
8) Assign the rest of cities to be group 3
This algorithm is very rough and the idea is relatively native. Therefore, the clustering
outcome may not be ideal. Subject to time limit, I currently could not keep on developing
either the algorithm or code, but it would need more work in the future.
Kiafeng Xia 13 / 14
R code:
raw.data=read.csv("2014-2015 monthly price index.csv",
row.names=1,col.names=1:12,skip=1)
time=1:12
index=as.matrix(raw.data)
cor(index[2,],index[66,])
bench=index[sample(nrow(index),1),]
cor.result=c()
for (i in 1:nrow(index)){
cor=cor(bench,index[i,])
cor.result=c(cor.result,cor)
}
part1=index[order(cor.result,decreasing=T)[1:(1/3*nrow(index))],]
rest=index[-(order(cor.result,decreasing=T)[1:(1/3*nrow(index))]),]
bench2=rest[sample(nrow(rest),1),]
cor2.result=c()
for (i in 1:nrow(rest)){
cor=cor(bench2,rest[i,])
cor2.result=c(cor2.result,cor)
}
part2=rest[order(cor2.result,decreasing=T)[1:(1/2*nrow(rest))],]
part3=rest[-order(cor2.result,decreasing=T)[1:(1/2*nrow(rest))],]
cluster=cbind(row.names(part1),row.names(part2),row.names(part3))
View(cluster)