Embed Size (px)
Citation preview
Real-time full field laser Doppler imaging
Marcel Leutenegger,1,5
Erica Martin-Williams,1,6
Pascal Harbi,2 Tyler Thacher,
2
Wassim Raffoul,3 Marc André,
2 Antonio Lopez,
1 Philippe Lasser,
4 and Theo Lasser
1
1Laboratoire d’Optique Biomédicale, École Polytechnique Fédérale de Lausanne, Lausanne, Switzerland 2Aïmago SA, Parc Scientifique EPFL, Lausanne, Switzerland
3Plastic Surgery Department, Lausanne University Hospital, Lausanne, Switzerland 4Service d'anesthésiologie, réanimation et antalgie, Etablissements hospitaliers du Nord Vaudois, Yverdon,
Switzerland [email protected] [email protected]
Abstract: We present a full field laser Doppler imaging instrument, which enables real-time in vivo assessment of blood flow in dermal tissue and skin. This instrument monitors the blood perfusion in an area of about 50 cm
2 with 480 × 480 pixels per frame at a rate of 12–14
frames per second. Smaller frames can be monitored at much higher frame rates. We recorded the microcirculation in healthy skin before, during and after arterial occlusion. In initial clinical case studies, we imaged the microcirculation in burned skin and monitored the recovery of blood flow in a skin flap during reconstructive surgery indicating the high potential of LDI for clinical applications. Small animal imaging in mouse ears clearly revealed the network of blood vessels and the corresponding blood perfusion.
©2011 Optical Society of America
OCIS codes: (170.1650) Coherence imaging; (170.3340) Laser Doppler velocimetry; (170.3890) Medical optics instrumentation; (170.4580) Optical diagnostics for medicine.
References and links
1. Z. B. Niazi, T. J. Essex, R. Papini, D. Scott, N. R. McLean, and M. J. Black, ―New laser Doppler scanner, a valuable adjunct in burn depth assessment,‖ Burns 19(6), 485–489 (1993).
2. K. Wårdell, A. Jakobsson, and G. E. Nilsson, ―Laser Doppler perfusion imaging by dynamic light scattering,‖ IEEE Trans. Biomed. Eng. 40(4), 309–316 (1993).
3. S. A. Pape, C. A. Skouras, and P. O. Byrne, ―An audit of the use of laser Doppler imaging (LDI) in the assessment of burns of intermediate depth,‖ Burns 27(3), 233–239 (2001).
4. F. W. H. Kloppenberg, G. I. J. M. Beerthuizen, and H. J. ten Duis, ―Perfusion of burn wounds assessed by laser doppler imaging is related to burn depth and healing time,‖ Burns 27(4), 359–363 (2001).
5. E. R. La Hei, A. J. A. Holland, and H. C. O. Martin, ―Laser Doppler imaging of paediatric burns: burn wound outcome can be predicted independent of clinical examination,‖ Burns 32(5), 550–553 (2006).
6. D. J. McGill, K. Sørensen, I. R. MacKay, I. Taggart, and S. B. Watson, ―Assessment of burn depth: a prospective, blinded comparison of laser Doppler imaging and videomicroscopy,‖ Burns 33(7), 833–842 (2007).
7. A. K. Dunn, A. Devor, H. Bolay, M. L. Andermann, M. A. Moskowitz, A. M. Dale, and D. A. Boas, ―Simultaneous imaging of total cerebral hemoglobin concentration, oxygenation, and blood flow during functional activation,‖ Opt. Lett. 28(1), 28–30 (2003).
8. M. Draijer, E. Hondebrink, T. van Leeuwen, and W. Steenbergen, ―Review of laser speckle contrast techniques for visualizing tissue perfusion,‖ Lasers Med. Sci. 24(4), 639–651 (2009).
9. J. D. Briers, ―Laser Doppler and time-varying speckle: a reconciliation,‖ J. Opt. Soc. Am. A 13(2), 345–350 (1996).
10. J. D. Briers, ―Laser Doppler, speckle and related techniques for blood perfusion mapping and imaging,‖ Physiol. Meas. 22(4), R35–R66 (2001).
11. P. Vennemann, R. Lindken, and J. Westerweel, ―In vivo whole-field blood velocity measurement techniques,‖ Exp. Fluids 42(4), 495–511 (2007).
12. H. C. Eun, ―Evaluation of skin blood flow by laser Doppler flowmetry,‖ Clin. Dermatol. 13(4), 337–347 (1995).
13. B. A. Kingwell, M. Formosa, M. Muhlmann, S. J. Bradley, and G. K. McConell, ―Type 2 diabetic individuals have impaired leg blood flow responses to exercise: role of endothelium-dependent vasodilation,‖ Diabetes Care 26(3), 899–904 (2003).
14. C. Pellaton, S. Kubli, F. Feihl, and B. Waeber, ―Blunted vasodilatory responses in the cutaneous microcirculation of cigarette smokers,‖ Am. Heart J. 144(2), 269–274 (2002).
15. A. K. Murray, A. L. Herrick, and T. A. King, ―Laser Doppler imaging: a developing technique for application in the rheumatic diseases,‖ Rheumatology (Oxford) 43(10), 1210–1218 (2004).
16. M. L. Baker, E. K. Marino Larsen, L. H. Kuller, R. Klein, B. E. K. Klein, D. S. Siscovick, C. Bernick, T. A. Manolio, and T. Y. Wong, ―Retinal microvascular signs, cognitive function, and dementia in older persons: the Cardiovascular Health Study,‖ Stroke 38(7), 2041–2047 (2007).
#143526 - $15.00 USD Received 22 Mar 2011; rev. 6 May 2011; accepted 6 May 2011; published 9 May 2011(C) 2011 OSA 1 June 2011 / Vol. 2, No. 6 / BIOMEDICAL OPTICS EXPRESS 1470
17. J. C. Palmer, S. Baig, P. G. Kehoe, and S. Love, ―Endothelin-converting enzyme-2 is increased in Alzheimer’s disease and up-regulated by Abeta,‖ Am. J. Pathol. 175(1), 262–270 (2009).
18. A. Serov, W. Steenbergen, and F. de Mul, ―Laser Doppler perfusion imaging with a complimentary metal oxide semiconductor image sensor,‖ Opt. Lett. 27(5), 300–302 (2002).
19. A. Serov, B. Steinacher, and T. Lasser, ―Full-field laser Doppler perfusion imaging and monitoring with an intelligent CMOS camera,‖ Opt. Express 13(10), 3681–3689 (2005).
20. A. Serov and T. Lasser, ―High-speed laser Doppler perfusion imaging using an integrating CMOS image sensor,‖ Opt. Express 13(17), 6416–6428 (2005).
21. A. Raabe, D. Van De Ville, M. Leutenegger, A. Szelényi, E. Hattingen, R. Gerlach, V. Seifert, C. Hauger, A. Lopez, R. Leitgeb, M. Unser, E. J. Martin-Williams, and T. Lasser, ―Laser Doppler imaging for intraoperative human brain mapping,‖ Neuroimage 44(4), 1284–1289 (2009).
22. M. Draijer, E. Hondebrink, T. van Leeuwen, and W. Steenbergen, ―Twente Optical Perfusion Camera: system overview and performance for video rate laser Doppler perfusion imaging,‖ Opt. Express 17(5), 3211–3225 (2009).
23. S. A. Aïmago, Lausanne, Switzerland, http://www.aimago.com/ (Feb. 2011). 24. R. Bonner and R. Nossal, ―Model for laser Doppler measurements of blood flow in tissue,‖ Appl. Opt.
20(12), 2097–2107 (1981). 25. A. P. Shepherd and P. Å. Öberg, eds., Laser-Doppler Blood Flowmetry (Kluwer Academic, Boston, 1990). 26. H. Nilsson, ―Photon migration in tissue. Laser induced fluorescence for cancer diagnostics and influence of
optical properties on microvascular Doppler spectroscopy,‖ Ph.D. thesis (Faculty of Health Sciences, Linköpings Universitet, 2002).
27. A. Serov, W. Steenbergen, and F. de Mul, ―Prediction of the photodetector signal generated by Doppler-induced speckle fluctuations: theory and some validations,‖ J. Opt. Soc. Am. A 18(3), 622–630 (2001).
1. Introduction
Laser Doppler imaging (LDI) started with scanning LDI instruments [1,2]—these instruments are commercially available for research, medical diagnosis and follow-up of surgery, e.g., monitoring of wound healing. These instruments assess blood perfusion over large areas >1000 cm
2 and find widespread application in burn assessment and
wound healing [3–6]. LDI is a non-invasive imaging modality compatible with classical medical instrumentation, where discomfort and risk to patients is minimized. However, mapping the blood flow with a scanning LDI instrument typically takes minutes; often requiring the subject to be stabilized during the imaging process. Laser speckle contrast imaging (LSI) is closely related to LDI and extracts information on blood flow by observing the variations in speckle contrast [7]. With increasing flow speed the observed speckle contrast reduces due to averaging over more speckle variations during the exposure time. In contrast to the technical challenges for real-time LDI, LSI requires only a moderately fast camera capable of acquiring images at exposure times in the millisecond range. However, for assessing blood perfusion with LSI, the velocity distribution has to be known in principle [8]. Several reviews on LDI and LSI instrumentation are given in [9–11].
Full field LDI of dermal blood flow has gained much interest in recent years, because anomalously altered peripheral blood flow provides an easily accessible indicator for various health disorders [12], e.g. altered vasodilation in the case of diabetes [13], reduced blood flow in the case of smokers [14], inflammatory responses in the case of rheumatic diseases [15] or, presumably, altered perfusion in the brain due to Alzheimer disease which might be evidenced in the retina [16,17]. An array based LDI approach using a fast CMOS camera for full field perfusion imaging was introduced in 2002 by Serov et al. [18]. This initial work triggered the development of several full field LDI instruments with ever increasing performance [19,20]. These full field LDI instruments have allowed mapping the perfusion with 256 × 256 pixels over an area of ~50 cm
2 every few seconds.
Adapted to a surgical microscope, it has already proved useful in mapping active brain regions when the subject performed specific tasks [21]. In 2009, Draijer et al. [22] presented the Twente optical perfusion camera, which represented a further essential step towards real-time full field LDI. This camera acquired images with a size of 128 × 128 pixels at a frame rate of 0.2 frames per second (fps) when analyzed online. If analyzed offline, the camera can acquire perfusion maps (raw data) at up to 26 fps for a few seconds. Recently, the first integrated real-time full field LDI instruments became available as a research instrument in 2010, as well as a fully equipped instrument for medical applications in 2011. These LDI instruments were developed by the authors in close cooperation between academia and industry (Aïmago [23]). The instruments incorporate a high-speed CMOS camera chip and a powerful FPGA chip for controlling the CMOS sensor and for real-time (online) processing of the captured images. The
#143526 - $15.00 USD Received 22 Mar 2011; rev. 6 May 2011; accepted 6 May 2011; published 9 May 2011(C) 2011 OSA 1 June 2011 / Vol. 2, No. 6 / BIOMEDICAL OPTICS EXPRESS 1471

resulting blood perfusion, erythrocyte concentration and intensity maps are then sent to a host computer for further analysis. The performance of the instrument allows continuous videos of blood flow at more than 12 fps to be acquired whilst covering an area of ~50 cm
2 with 480 × 480 pixels. In the following article, we recall briefly the underlying principles and outline the
salient features of this LDI instrument. Finally, we present a selection of perfusion images and a video (online) for a few applications.
2. Laser Doppler imaging
An LDI instrument consists of a coherent light source, typically a monochromatic laser with a long coherence length, a fast detector and a hard- and software unit for recording and analyzing the detected signal. The laser illuminates the tissue which scatters the laser light. Part of the light is scattered at static structures of the tissue; part of it is scattered by dynamic components—typically moving red blood cells. The dynamically scattered light incurs a small wavelength shift due to the Doppler effect. Upon detection of the coherently mixing static and dynamic light fields, the interference of both fields produces a detectable beating of the intensity with a frequency in the kHz range for typical blood cell flow speeds of a few mm/s. Instead of following the time-course of the detected intensity I(t) directly, its dynamics is usually analyzed in frequency space by evaluating
the power spectrum 2
( ) ( )S I t , where υ is the beat frequency and denotes the
Fourier transform. The average intensity (0)I S and the nth
moments
0
( )dn
nM S
are then readily obtained. It has been shown [2,8,24,25] that the
concentration c of moving red blood cells is proportional to the zero moment,
0 / (0)c M S , and that the perfusion P is proportional to the first moment,
1 / (0)P M S . Normalization by the average power (0)S reduces the influence of the
back-scattering efficiency of the tissue.
Fig. 1. Outline of the LDI instrument and the signal processing. The research instrument is controlled via a notebook whereas the embedded instrument integrates the user interface.
Figure 1 outlines the LDI instrument and the signal processing. In this full field real-time LDI instrument, a 150 mW near infrared (NIR) laser (wavelength λ = 808 nm) and an engineered diffuser illuminate an area of ~8 × 8 cm
2 at a typical distance of ~25 cm,
providing an illumination of a field size well suited for medical applications. The back-scattered NIR light is imaged by a video objective on a customized CMOS sensor. A digital camera registers a larger visible field in parallel and allows an intuitive navigation over an extended skin surface. The NIR light is spectrally separated from the visible light by a dichroic mirror. The CMOS sensor features a pixel size of 14 × 14 μm
2 with a
#143526 - $15.00 USD Received 22 Mar 2011; rev. 6 May 2011; accepted 6 May 2011; published 9 May 2011(C) 2011 OSA 1 June 2011 / Vol. 2, No. 6 / BIOMEDICAL OPTICS EXPRESS 1472

quantum efficiency of 18% taking into account the fill factor. A column-wise fixed
pattern noise (FPN) correction is integrated in hardware. At the end of the exposure time, the accumulated charges are memorized and the pixels cleared. The pixel values are then read during the integration of the next frame, which allows nearly uninterrupted exposure whilst capturing the images. The instrument records stacks of 128 raw images with a rate of up to ~20 kfps, resulting in a raw data rate of up to 700MB/s. These image stacks are subsequently processed according to the mentioned power spectrum analysis [19,20,22]. The memory holds two stacks of a total of up to 2
22 pixels each (9 bits/pixel). During the
acquisition of an image stack, the previous stack is processed and the results are written to an output buffer. This high-speed calculation of the moments is solely done by the FPGA as it reduces the amount of data by nearly two orders of magnitude. The resulting average image intensity, the concentration map and the perfusion map are sent via an external PCI Express link to the host computer for further analysis and display. Because the CMOS sensor cannot register the full image at the required frame rate, the image is split into smaller windows for high-speed acquisition and processing of the raw data window per window [19]. Overall, the full field flow maps (480 × 480 pixels) can be acquired with a rate of 12–14 fps, which is sufficiently fast to monitor the heartbeat and to recognize motion artifacts. The LDI instrument can be configured for smaller observation areas if a higher frame rate is required, e.g. for perfusion monitoring in small animals (for example mice, having a heartbeat rate of ~10Hz). Table 1 exemplifies some configurations and the resulting image frame rates. Flow maps of a single window can be obtained at more than 100fps.
Table 1. Image sizes and corresponding frame rates achieved with our LDI instrument
Image (window) size [pixels]
Window frame rate [kHz]
Exposure time τ [μs]
Image frame rate [fps]
480 × 480 (480 × 60) 14.9 58.2 14.6 360 × 360 (360 × 60) 17.6 48.5 22.9 360 × 360 (360 × 90) 12.4 72.5 24.1 240 × 180 (240 × 90) 15.2 57.8 59.2
It is worth noting that full field illumination leads to a back-scattered speckle field, which has to be resolved in time and, more relaxed, in space to detect its intensity fluctuations [11,26]. Detecting the Doppler beating requires a window frame rate of at
least twice the maximum beat frequency, i.e. a frame rate f 10–20kHz is required to detect the Doppler signal from red blood cells moving at a speed of 2–3mm/s. In order to reduce white noise (e.g. read-out noise), we apply a soft threshold Swn on the raw power spectrum [20,22]. During the exposure time τ, an integrating detector averages the signal I(t), which damps the detected intensity fluctuations. Therefore, we applied a correction factor to obtain an unbiased power spectrum. The factor
/2
/2
1sinc cos(2 )dt t
(1)
yields the reduced peak amplitude of a sinusoidal signal with frequency υ measured within a time interval τ. The flow maps are then estimated using the corrected power spectrum
2
wn'( ) max 0, ( ) sincS S S , (2)
from which the moments are obtained by integrating over the available frequency range,
/ 2
/128
'( )d
f
n
n
f
M S . (3)
Although LDI does not strictly require a spatial speckle resolution, we took into account the number of speckles per pixel for the overall instrument design. The average speckle
area 2
s /A NA , where λ = 808 nm is the laser wavelength and NA the numerical
aperture at the image side. With appropriately short exposure times, the speckle contrast
#143526 - $15.00 USD Received 22 Mar 2011; rev. 6 May 2011; accepted 6 May 2011; published 9 May 2011(C) 2011 OSA 1 June 2011 / Vol. 2, No. 6 / BIOMEDICAL OPTICS EXPRESS 1473

is given as 1/2
s p s(2 ) 1 /C A A
, where γ 0.1 is the fraction of Doppler shifted
light [22,27] and Ap 80 μm2 the active area of pixels. The speckle contrast, i.e. the
visibility of speckles, is maximal for p sA A , drops by 30% for
p sA A and decreases
further with the square root of the number of speckles per pixel. Hence, the contrast is maximized for large speckles obtained with small NA, which translates into low image intensity and modest signal-to-noise ratio (SNR). At high frame rates an optimized
contrast with a reduced intensity has been chosen (cf. [27].). We chose NA 0.11 roughly yielding two speckles per pixel, which decreased the speckle contrast by ~40%. This low NA allows sharp imaging over a depth range of ~6 mm.
Following the calculation of Draijer et al. [22], the SNR has been estimated. Assuming a homogeneous illumination and a depolarized, homogeneous and isotropic scattering from the tissue, an upper bound of the SNR can be estimated as
2
s DC
2 2 2AC p s p t
2pe DC d qnoise
22 2
SNR4 42
A i
i A k M
f Aq i i i fi
, (4)
which is obtained without dark noise id and quantization noise iq. Here, qe is the
elementary charge, p is the available photon flux per sensor pixel, ks 0.5 is the
scattering efficiency of the tissue and Mt is the lateral magnification of the imaging optics. Equation (4) clearly shows that the magnification of the optical system is a key parameter to improve the SNR. By decreasing the working distance as compared to other LDI
instruments, we obtained t 0.18M and improved both the image brightness and the
SNR even though we opted for a smaller number of speckles per pixel. We measured a SNR of 2–5 on finger tips, which depends on the local scattering properties (γ, ks) of the tissue.
A noise floor of ~15 (arbitrary units) was measured on white paper with a scaling that yielded ~230 (same units) on finger tips, i.e. the dynamic range of perfusion maps covered about one order of magnitude. For all applications presented in the following, we adjusted the full scale (255) such that the perfusion maps essentially covered the dynamic range from 0 to ~200 at display.
3. Case studies
This section presents a selection of results from several LDI case studies. Figure 2 and Fig. 3 summarize the results of an experiment on the fingers of a volunteer subjected to an arterial occlusion using a blood pressure cuff. Figure 2 shows a color-coded LDI perfusion map; blue denoting low and red, high perfusion levels. We selected four circular
Fig. 2. Color image of fingertips and color-coded blood perfusion map. (Media 1: captured video sequences showing the start of the arterial occlusion and the overshoot after release. The video frames were resized to 50% of the captured images to reduce the file size.)
#143526 - $15.00 USD Received 22 Mar 2011; rev. 6 May 2011; accepted 6 May 2011; published 9 May 2011(C) 2011 OSA 1 June 2011 / Vol. 2, No. 6 / BIOMEDICAL OPTICS EXPRESS 1474
0 30 60 90 120 1500
50
100
150
200
Per
fusi
on [
a.u.]
Time [s]
Occlusion
3+4
1+2
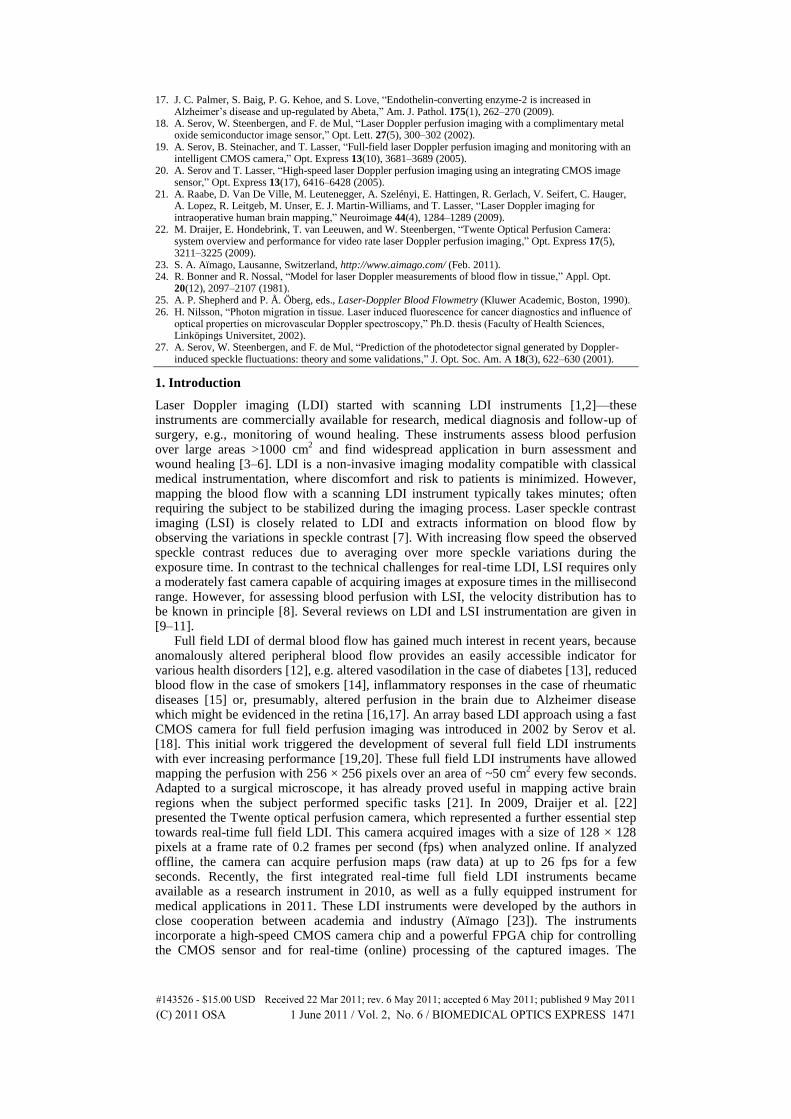
Fig. 3. Blood perfusion in the encircled regions on the fingers (14 fps; see Fig. 2). During the arterial occlusion, the blood perfusion drops and motion artifacts (spikes) become more clearly visible. The heartbeat is shown for a 10 s interval when the blood perfusion returned to normal.
regions for which Fig. 3 shows the average perfusion values plotted over time. The upper arm was occluded with a pressure of ~150 mmHg during the time interval indicated by the black lines, i.e. during ~70 s. During occlusion, the perfusion quickly dropped to a low level and stayed there. A transient increase after ~10 s was probably due to the counteraction of the cardiovascular system, as the occlusion pressure was only slightly higher than the normal blood pressure of the volunteer. Short spikes are due to motion artifacts, which are more pronounced during an occlusion of long duration. On releasing the occlusion, the perfusion increased by ~10% at the fingertips (region 1 + 2) and by ~30% at the mid-fingers (region 3 + 4) above the pre-occlusion level during ~10 s before returning to normal. This is a typical outcome and can be expected for occlusion–reperfusion experiments due to vasodilation. However, it is worth noting that we frequently observed locally differing behaviors after releasing the occlusion. In regions showing immediately after the occlusion release a clear heartbeat signature (1 + 2) the perfusion increased less and returned more promptly to normal than in regions with hardly observable heartbeat (3 + 4).
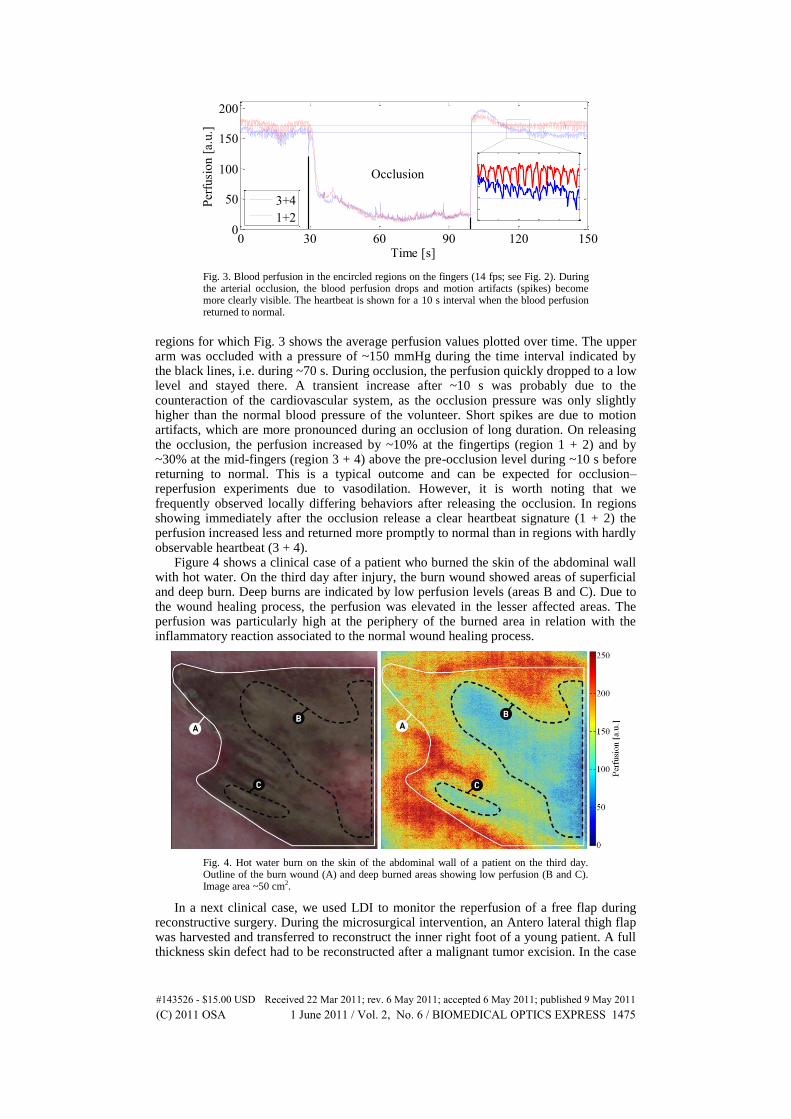
Figure 4 shows a clinical case of a patient who burned the skin of the abdominal wall with hot water. On the third day after injury, the burn wound showed areas of superficial and deep burn. Deep burns are indicated by low perfusion levels (areas B and C). Due to the wound healing process, the perfusion was elevated in the lesser affected areas. The perfusion was particularly high at the periphery of the burned area in relation with the inflammatory reaction associated to the normal wound healing process.
Fig. 4. Hot water burn on the skin of the abdominal wall of a patient on the third day. Outline of the burn wound (A) and deep burned areas showing low perfusion (B and C). Image area ~50 cm2.
In a next clinical case, we used LDI to monitor the reperfusion of a free flap during reconstructive surgery. During the microsurgical intervention, an Antero lateral thigh flap was harvested and transferred to reconstruct the inner right foot of a young patient. A full thickness skin defect had to be reconstructed after a malignant tumor excision. In the case
#143526 - $15.00 USD Received 22 Mar 2011; rev. 6 May 2011; accepted 6 May 2011; published 9 May 2011(C) 2011 OSA 1 June 2011 / Vol. 2, No. 6 / BIOMEDICAL OPTICS EXPRESS 1475

of complications, the surgeons would have had to amputate the big toe and a significant portion of the patient’s foot. During the surgery, an artery and two veins supplying the flap were anastomosed under microscope magnification to the flap vessels, thereby reestablishing blood flow and ensuring tissue survival. Once transplanted the tissue was molded and shaped to cover the skin defect. Figure 5 shows a time series of color-coded perfusion maps over a period >40 s and the corresponding images of the flap. During surgery, the blood flow had been interrupted for transplanting the flap. At time zero, the arterial blood flow was restored and blood injected in the center of the flap, where the perforator vessels are located. The LDI maps clearly show that the perfusion was restored within a few seconds at the injection site and within ~30 s over the entire central region. In the peripheral areas of the flap, the restoration of the blood flow took a few minutes, most likely due to a lower blood pressure. In this case study, LDI perfusion imaging allowed the surgeon to verify the reestablishment of blood supply during surgery, this means at the earliest possible stage when surgical correction is still possible. In such cases, LDI perfusion monitoring helps avoid medical complications and proves to be a valuable instrument to limit risk and enhance the quality of the surgical outcome.
Fig. 5. Reperfusion of a free flap of ~40 cm2 area. The image center corresponds to the perforator location, where arterial blood flow was reinitiated at time point zero. Within ~30s the microcirculation in the central region was restored. A final check after 15 min showed that the entire flap was sufficiently well perfused for the final flap insertion. The least-perfused region in the bottom-center of the perfusion maps corresponds to the position of a staple holding the tissue in place.
In a more life science oriented case, we looked at blood flow in a mouse ear, where the thin internal ear skin layer was removed surgically (Fig. 6). To reduce motion artifacts, mainly due to breathing, we fixed the earlap by gently retaining it between a microscopy slide and a cover slip (top). In the fixed region, the perfusion map clearly shows the arterial and venal vessel systems of the ear. Due to the heart rate of mice (~10 Hz), the heartbeat was hard to resolve and the perfusion map shows an average perfusion level rather than an instantaneous value.
Fig. 6. Blood perfusion shows the vessel network in a mouse ear. The ear had been slightly fixed to suppress motion artifacts due to breathing that show up in the free region of the ear.
4. Conclusions
We have presented our research LDI instrument capable of continuously monitoring blood perfusion over an area of up to ~50 cm
2 in real time. The flow maps presented
clearly show regions of distinctive perfusion and/or microcirculatory responses. Future
#143526 - $15.00 USD Received 22 Mar 2011; rev. 6 May 2011; accepted 6 May 2011; published 9 May 2011(C) 2011 OSA 1 June 2011 / Vol. 2, No. 6 / BIOMEDICAL OPTICS EXPRESS 1476

developments aim to improve the SNR in the flow maps, detect and possibly reduce motion artifacts and to cover a larger field of view. Improvements in the available laser power and further improvements in the photo-sensitivity of high-speed CMOS sensors will support these targets. Meanwhile, handling the instrument like a photo or video camera allows the rapid and interactive assessment of blood perfusion over extended areas of the body by sequentially observing different locations.
Across the selected case studies, LDI was used to visualize vascularization and to monitor blood flow in small animals and in clinical studies. These initial results of LDI blood flow monitoring over large areas in real-time indicate clinical applications with unforeseeable potential. Disturbances in perfusion in general or alterations in blood flow dynamics point to dysfunctions of the affected tissue or the microcirculation. For instance, live observation of the perfusion changes due to the cardiac cycle enables the extraction of additional parameters such as the dynamic range, e.g. peak-to-peak amplitude. LDI blood flow monitoring complements optical coherence tomography (OCT) or photo-acoustic tomography (PAT) imaging of vascularization and blood flow. However, OCT and PAT operate over smaller areas with a shorter working distance than LDI but with a three-dimensional imaging of vascularization and blood flow. We are convinced that real-time full field perfusion imaging improves the assessment of health issues related to microcirculation due to its simplicity and intuitive interpretation.
Acknowledgments
We thank Dr. med. Jens Kauczok, Universitätsklinikum Aachen, Germany, for his kind permission to monitor the free flap reperfusion. We acknowledge Prof. Melody A. Swartz and Dr. Scott R. Oliver, Laboratory of Lymphatic and Cancer Bioengineering, EPFL, Lausanne, Switzerland, for their assistance with the mouse ear perfusion. T. Lasser, M. André, M. Leutenegger and A. Lopez are shareholders and cofounders of Aïmago. P. Lasser is a shareholder of Aïmago. This work was supported by the Commission for Technology and Innovation (CTI project no. 10218.1 PFLS-LS), Switzerland.
#143526 - $15.00 USD Received 22 Mar 2011; rev. 6 May 2011; accepted 6 May 2011; published 9 May 2011(C) 2011 OSA 1 June 2011 / Vol. 2, No. 6 / BIOMEDICAL OPTICS EXPRESS 1477