Embed Size (px)
Citation preview
EasyChair Preprint
№ 702
Real-Time Monitoring System for Polystyrene
Coating Material Deposition onto QCM Sensor
using Ultrasonic Atomizer Spray
Imron Rosadi, Nike Fitayatul Khusnah andSetyawan Purnomo Sakti
EasyChair preprints are intended for rapiddissemination of research results and areintegrated with the rest of EasyChair.
December 27, 2018

Real-Time Monitoring System for Polystyrene Coating Material Deposition onto QCM Sensor using Ultrasonic Atomizer Spray
I Rosadi1, N F Khusnah2 and S P Sakti1,2
1 Department of Physics, Brawijaya University, Jl. Veteran, Malang, Indonesia 2Collaborative Research Center for Advanced Systems and Material Technology, Brawijaya University, Jl. Veteran. Malang, Indonesia E-mail: : [email protected]
Abstract. The polymer coating on a Quartz Crystal Microbalance can be done using spin coating, dipping, spray coating (airbrush) and ultrasonic spray coating. Film thickness and surface morphology of the coating depend on the coating method. Using spray coating, one can control the film thickness and also the morphology by controlling the speed, polymer-solvent particle size, concentration and duration of the deposition process. This paper presents a method for monitoring the deposition of polystyrene onto the QCM sensor by using an ultrasonic atomizer system. The atomizer was working using an ultrasonic generator at 55 kHz. Theoretically, the atomizer was able to produce a mist of solvent and polymer with a diameter of around 28 microns. The system was equipped with a frequency counter which able to monitor the resonance frequency of the sensor being coated in every second with a resolution of 1 Hz. The frequency change was related to the amount of the deposited polymer and solvent on the sensor surface; it means that the deposited polymer can be measured and monitored during the coating process. The deposited polystyrene and its solvent were monitored directly by observing the frequency change of the sensor is coated. For 10 MHz sensor, the resolution was equaled to a deposited mass of 4.2ng. It means that the amount of the coating material to be deposited on the sensor surface can be controlled with high resolution. The evaporation of the solvent after coating process was also able to be monitored directly. The benefit offered by this system besides controlled mass deposited is also the simplicity of the system.
1. Introduction Quartz Crystal Microbalance (QCM) has been used extensively for chemical sensor and biosensor.
The wide range usage of the sensor was supported by the characteristic of the sensor. QCM sensor can be built using simple measurement system. The sensor has stability and sensitivity. With the current state of the technology, the resolution and precision of the QCM sensor system can be achieved [1]. High accuracy and resolution of frequency counter resulted in higher resolution of the QCM sensor system [2].
The key factor of the QCM sensor to be used for chemical and biosensor in gas and the liquid environment was the coating of the sensor [3]. Therefore, many different methods have been developed to change the sensor surface property according to the required application. A coating method using dip coating, spin coat, spray coating, and other deposition technique has been developed. Each method has its own advantages to meet the requirements of the targeted application.

The polymer was one of the materials which have been used as coating material for the QCM sensor[4,5]. The wide range selection of the polymer with many different properties was available in the market and under laboratory development. Some polymer can be deposited on top of the sensor surface by using spin coating, spray coating or dipping. The surface chemical property and also the physical property of the coating can be affected by the coating method.
In other situation, monitoring and controlling the coating process was an important factor to achieve the coating method goal. However, online monitoring of the coating process is not always possible to be done. In the case of the QCM sensor coating procedure, it is possible to monitor the coating process directly during the coating material deposition. This behavior is supported by the fundamental work of the QCM sensor. The QCM sensor has a sensitivity to the mass deposition on its surface as long as the coating, and the deposited mass behaved as a glassy material [6]. This property can be utilized to monitor the coating development of the QCM sensor.
In this experiments, we developed a coating system for the QCM sensor which can directly monitor the coating development of the QCM sensor being coated in real time. The coating system was utilizing an ultrasonic coater. The ultrasonic coating was chosen by as this method was also increasingly used for coating the sensor and other devices [7].
Figure 1. Ultrasonic spray coating with a real-time monitoring system
2. Experiment 2.1. Materials
In this experiment, a commercial 10 MHz AT-cut silver electrode QCM resonator in HC 49/U form was purchased from PT Great Microtama Surabaya, Indonesia. Both side of the resonator then was coated with polystyrene in two different methods, i.e., spin coating for the bottom side and ultrasonically atomized spray for the upper side. A 50 µl of polystyrene dissolved in toluene with 1% (w/v %) at concentration was spin-coated on the bottom side of the resonator at 3000 rpm speed. The bottom side coating was intended to protect its electrode from constant oxidation. The solution to be atomized for upper side coating was consist of polystyrene dissolved in toluene at 0.5% (w/v %). The polystyrene with 192 kDa of molecular weight in beads form was purchased from Sigma Aldrich, while the toluene was purchased from Sigma Lab. 2.2. System Setup
Figure 1 shows the setup of an ultrasonic atomization spray coating system. This system was composed of a peristaltic pump (Shenzhen Pump), the ultrasonic generator at 55 kHz with flattop spray head nozzle (Hangzhou Dowell Ultrasonic Technology Co., Ltd.), and a self-build chamber with frequency counter attached to it. The speed range of the peristaltic pump is 0.1 – 300 rpm with 0.1 rpm in resolution. Theoretically, the ultrasonic generator can produce droplets with a diameter of around 28
µm. This generator has two types of power adjustment, i.e., continuous and step. The frequency counter with 1 Hz resolution which attached to the specimen table in the chamber for real-time monitoring of QCM frequency resonant during ultrasonic spray coating was also a self-build. The specimen table was able to be moved up and down with a range 1 – 25 cm. 2.3. Methods and Measurement Equipment
A cycle of the deposition process is as follow: (i) the initial frequency of QCM, i.e., after bottom side coating was recorded first for at least 200 s; (ii) the solution to be atomized then pumped onto the nozzle head; (iii) the solution being atomized then deposited on QCM upper side by stepping the pedal power of ultrasonic generator; (iv) after the deposition, the QCM then was monitored during the evaporation of the solvent until a stable condition achieved; (v) the QCM then discarded from the specimen holder. In this experiment, a 5 rpm speed of the peristaltic pump was employed which after the conversion is equal to 0.236 ml/min and during spray coating, the pedal of the ultrasonic generator was only stepped once.
The impedance of QCM is measured by the Bode 100 impedance analyzer (Omicron Lab) before and after the coating process. The surface structure and coverage of specimen coating is studied with the Olympus BX 51 microscope optic. A non-destructive surface profile-meter TMS-1200 TopMap µLab from Polytec was employed to study the topography of the specimen surface.
3. Results and Discussion The experiment first carried out for deposition distance (i.e., nozzle-specimen distance) of 5 cm.
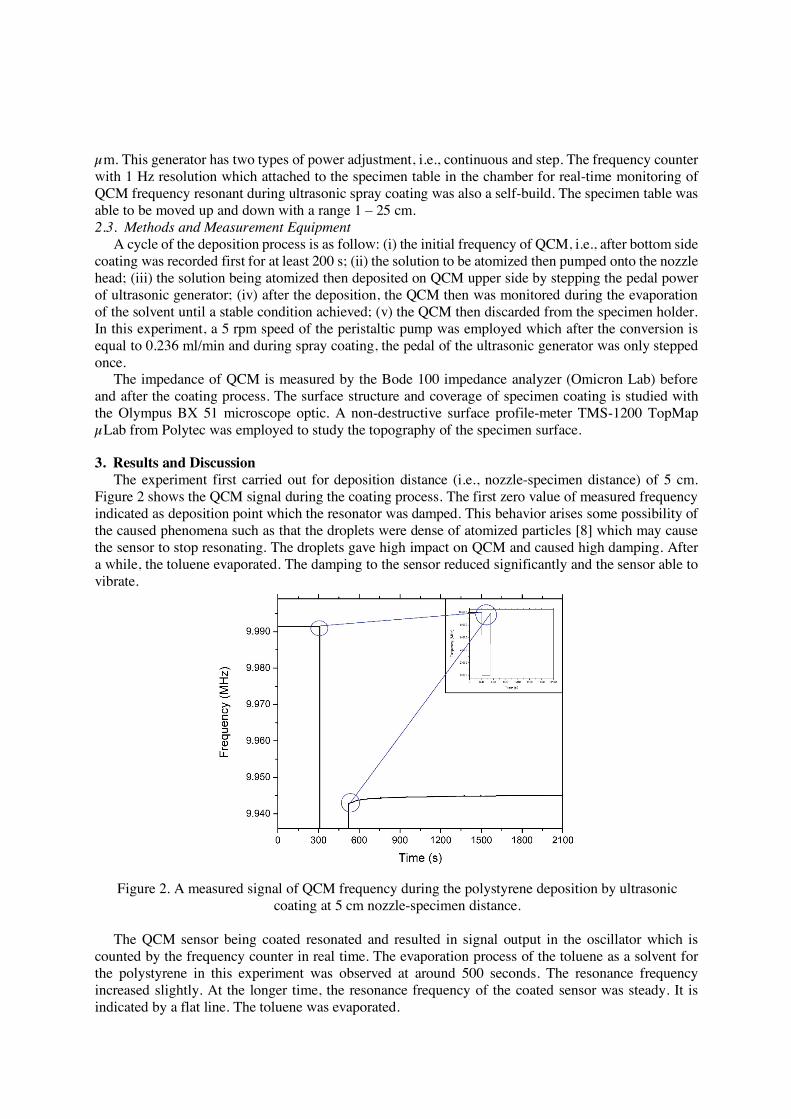
Figure 2 shows the QCM signal during the coating process. The first zero value of measured frequency indicated as deposition point which the resonator was damped. This behavior arises some possibility of the caused phenomena such as that the droplets were dense of atomized particles [8] which may cause the sensor to stop resonating. The droplets gave high impact on QCM and caused high damping. After a while, the toluene evaporated. The damping to the sensor reduced significantly and the sensor able to vibrate.
Figure 2. A measured signal of QCM frequency during the polystyrene deposition by ultrasonic coating at 5 cm nozzle-specimen distance.
The QCM sensor being coated resonated and resulted in signal output in the oscillator which is
counted by the frequency counter in real time. The evaporation process of the toluene as a solvent for the polystyrene in this experiment was observed at around 500 seconds. The resonance frequency increased slightly. At the longer time, the resonance frequency of the coated sensor was steady. It is indicated by a flat line. The toluene was evaporated.

Further analysis of the signal shows the decrease in frequency after deposition around 46.6 kHz. This frequency difference was used to calculate the mass deposited onto QCM by the Sauerbrey equation. The calculated mass is about 40.05 µg.
Other coating process monitoring was carried out at a specimen distance of 20 cm. Extending the distance between the ultrasonic nozzle and the specimen means that the travel time for the droplet to reach the sensor surface increased. Increasing travel time means that more solvent was evaporated before reaching the sensor surface. It is expected that the polystyrene-toluene droplet which is ejected by the ultrasonic coating become more viscous than the droplet with shorter travel time. Less liquid was dropped on top of the sensor surface, and the polymer converted in to point.
The consistency of the deposition process was investigated through three experiments carried out at 20 cm in nozzle-specimen distance. The signal measured is depicted in Figure 3. It can be seen that since the beginning of the droplet reached the sensor surface the resonance frequency of the sensor was observed. It means that the damping to the sensor caused by the droplet was small enough so that the QCM sensor able to resonate and the oscillator oscillated.
Sharp frequency decreased in the figure showed the event when the coating material and the solvent deposited on the sensor surface. It followed by increasing resonance frequency as the solvent evaporated. After a while, the resonance frequency reached a steady state. It indicated that the solvent was completely evaporated and the rest on the sensor surface was the coating material being deposited. It means the frequency counter was successfully monitored by the deposition process.
Figure 3. A QCM frequency signal during ultrasonic atomization spray coating of polystyrene at 20 cm in nozzle-specimen distance.
Based on Figure 3, it was then could be drawn the typical regime of the signal measured in the
ultrasonic atomization spray coating process of polystyrene onto QCM sensor which can be monitored in real time by the system. The typical curve was depicted in Figure 4. A number of information could be retrieved from this signal measurement as follow (i) the solvent evaporation time by determining the point c and d on the signal then subtract them; (ii) the amount of mass deposited onto QCM by determining the initial frequency and the final frequency so the frequency differences will be obtained. By using the Sauerbrey equation then the mass could be determined, and (iii) the deposition behavior of droplets onto the specimen by observing the curve on point c.

Figure 4. The typical regime of the signal measured with frequency counter during ultrasonic atomization spray coating. a-b represent the initial frequency of QCM; b-c represent the droplets
deposition; c-d represent the solvent evaporation; d-e represent the film forming Study on the surface specimen by microscope optic and profilometer shows that the deposition gave
quite full coverage of polystyrene onto the QCM with a microstructure on it. At 5 cm distance between the ultrasonic nozzle and sensor surface resulted in a ring structure. Big dropplet resulted in a wider ring structure coating compare to the small one. The ring-like structure was possibly occurred due to the popping of air bubbles that deposited onto the surface. This result is shown in Figure 5 and Figure 6. This result is slightly different with the result reported in [9]. Smaller droplet which result on a more converge structure.
Figure 5. Digital photograph of QCM surface after polystyrene deposition using ultrasonic at 5 cm nozzle-specimen distance.
Figure 6. 3D profile of QCM surface after polystyrene deposition using ultrasonic at 5 cm nozzle-specimen distance.
4. Conclusion The real-time monitoring system of QCM resonant frequency during polystyrene deposition onto its
surface using an ultrasonic atomizer spray coating has been successfully developed. This system was able to give valuable information such as solvent evaporation time, deposited mass as well as the deposition behavior through the frequency change measurement. The formation of the deposited polystyrene using the ultrasonic deposition at a distance of 5 cm resulted in a ring structure coating.

Acknowledgment This work was part of a research project funded by the Ministry of Research, Technology and Higher
Education of the Republic of Indonesia under the HIKOM research grant scheme.
5. References [1] Schlereth F H, Mahabalagiri A ., Khadeer A, McLoed T, Spencer J T, and Sweder K S 2015
Frequency measurement for QCM applications 2015 International Conference on Industrial Instrumentation and Control (ICIC) (IEEE) pp 1140–3
[2] Valdés M D, Moure M J, Rodríguez L and Fariña J 2008 Improving a Frequency Measurement Circuit for High-Accuracy QCM Sensors 2008 IEEE International Frequency Control Symposium (Honolulu: IEEE) pp 998–1002
[3] Skládal P 2016 Piezoelectric biosensors Trends Anal. Chem. 79 127–33 [4] Sartore L, Barbaglio M, Borgese L and Bontempi E 2011 Polymer-grafted QCM chemical
sensor and application to heavy metal ions real-time detection Sensors Actuators B Chem. 155 538–44
[5] Sakti S P, Chabibah N, Ayu S P, Padaga M C and Aulanni’am A 2016 Development of QCM Biosensor with Specific Cow Milk Protein Antibody for Candidate Milk Adulteration Detection J. Sensors 2016 1–7
[6] Fanget S, Hentz S, Puget P, Arcamone J, Matheron M, Colinet E, Andreucci P, Duraffourg L, Myers E and Roukes M L 2011 Gas sensors based on gravimetric detection—A review Sensors Actuators B Chem. 160 804–21
[7] Liu S, Zhang X, Zhang L and Xie W 2016 Ultrasonic spray coating polymer and small molecular organic film for organic light-emitting devices Sci. Rep. 6 1–10
[8] Roth S V. 2016 A deep look into the spray coating process in real-time - The crucial role of x-rays J. Phys. Condens. Matter 28 403003
[9] Stryckers J, D’Olieslaeger L, Silvano J V M, Apolinario C K, Laranjeiro A C G, Gruber J, D’Haen J, Manca J, Ethirajan A and Deferme W 2016 Layer formation and morphology of ultrasonic spray coated polystyrene nanoparticle layers Phys. Status Solidi Appl. Mater. Sci. 213 1441–6