Embed Size (px)
Citation preview

THESIS FOR THE DEGREE OF DOCTOR OF PHILOSOPHY
IN
PRODUCT AND PRODUCTION DEVELOPMENT
REAL-TIME OPTIMIZATION OF CONE CRUSHERS
ERIK HULTHÉN
DEPARTMENT OF PRODUCT AND PRODUCTION DEVELOPMENT CHALMERS UNIVERSITY OF TECHNOLOGY
GÖTEBORG, SWEDEN
NOVEMBER 2010

Real-Time Optimization of Cone Crushers Erik Hulthén
ISBN 978-91-7385-450-4
Copyright 2010 © Erik Hulthén
Doktorsavhandlingar vid Chalmers tekniska högskola
Ny serie nr 3131
ISSN: 0346-718X
Published and distributed by Chalmers University of Technology Product and Production Development SE-412 96 Göteborg Cover: Collage with photos from Sand & Grus AB Jehander’s Kållered plant, Mölndal, Sweden and NCC Roads’ Glimmingen plant, Uddevalla, Sweden. Printed in Sweden by Chalmers Reproservice Göteborg 2010

To Johanna and Theander


i
ABSTRACT
Cone crushers are used in the mineral, mining, and aggregate industry for fragmentation and production of rock materials. Cone crusher control systems are widely used for machine protection, wear compensation and, to some extent, increasing production. These systems ordinarily focus on the crusher and not the yield of production process.
In this thesis real-time optimization is explored to the control of eccentric speed and on-line CSS adjustment based on information from the process. The objective is to develop theories, models, software and hardware that enable real-time optimization of a single crushing and screening stage. The main hypothesis is that fixed parameters can never be optimal over time because many things in the process vary continuously.
The eccentric speed in a cone crusher determines the number of times a material is compressed and thus the particle size distribution of the product. The speed of the crusher is usually fixed since speed change by changing pulleys is a labor intensive activity. By applying a frequency converter to the crusher motor power supply, it is possible to continuously adjust the eccentric speed. The cost for frequency converters has decreased significantly over the last decade.
By applying mass-flow sensors to the process, e.g. conveyor-belt scales, the crusher result can be monitored and the result can be fed back to an operator or a computer. To analyze data from the process and automatically calculate the appropriate value for the Closed Side Setting (CSS) and eccentric speed, algorithms have been developed. The goal for the algorithms is to maximize the product yield in a given moment. The algorithms are loaded into computer systems that can communicate with sensors and crushers.
The developed algorithms are tested and evolved at full-scale aggregate crushing plants. Crushing stage performance increased 3.5% in terms of production yield compared to a fixed CSS when the algorithm was implemented in addition to the existing control system. The algorithm automatically compensates for changes in the feed material and also decreases the need for calibration of the CSS. The crushing stages where the speed algorithm were tested increased their performance by between 4.2% and 6.9% compared to a good fixed speed. In real life however, the performance was increased by almost 20% since an inappropriate speed was selected during installation. As a bonus, on one of the test plants for the dynamic speed, the lifetime of the manganese wear parts increased 27% on the evaluated crusher, as a consequence of changed crusher dynamics.
In conclusion, real-time optimization has been demonstrated to be feasible and increases the production yield with significantly numbers and should thus be of commercial interest to the industry.
Key words: cone crusher, crushing, real-time optimization, process optimization, CSS, eccentric speed.

ii
PUBLICATIONS
This thesis contains the following papers.
Paper A: Hulthén, E. and Evertsson, M., A Cost Effective Conveyor Belt Scale, Presented at 11th European Symposium on Comminution, Budapest, October 9-12, 2006. Published in conference proceedings.
Paper B: Hulthén, E. and Evertsson, M., Algorithm for dynamic cone crusher control, Minerals Engineering (Journal), 2009. Volume 22, pp 296-303.
Paper C: Hulthén, E. and Evertsson, M., On-Line Optimization of Crushing Stage Using Speed Regulation on Cone Crushers, Proceedings of XXIV International Mineral Processing Congress, 2 pp. 2396-2402. ISBN: 978-7-03-022711-9.
For this paper Erik Hulthén received “Young Author Award” at XXIV International Mineral Processing Congress in Beijing, 2008.
Paper D: Hulthén, E. and Evertsson, M., Two Variable Real-Time Algorithm for Cone Crusher Control, Proceedings of XXV International Mineral Processing Congress, 1 pp. 813-819. ISBN: 978-1-921522-28-4.
Paper E: Hulthén, E. and Evertsson, M., Real-Time Algorithm for Cone Crusher Control with Two Variables, Submitted to Minerals Engineering (Journal), October 2010.
CONTRIBUTIONS TO CO-AUTHORED PAPERS In all the papers A-E, Hulthén and Evertsson initiated the idea. The implementation was performed by Hulthén. Hulthén wrote the paper with Evertsson as a reviewer.
iii
CONTENTS
Abstract .............................................................................................................................. i Publications ....................................................................................................................... ii Contributions to Co-Authored Papers ............................................................................... ii Acknowledgements ........................................................................................................... v 1 Introduction.............................................................................................................. 1
1.1 Crushed Rock Material ................................................................................... 1 1.2 Crushing Plants ............................................................................................... 1 1.3 Operation of Crushing Plants ......................................................................... 2 1.4 Real-Time Operation of Crushing Plants ....................................................... 5
2 Objectives ................................................................................................................ 9 2.1 Research Outline ............................................................................................ 9 2.2 Research Questions ...................................................................................... 10
3 Research Approach ................................................................................................ 11 4 Literature Review .................................................................................................. 13 5 Process Characteristics .......................................................................................... 15
5.1 Production Units ........................................................................................... 15 5.2 Parameters .................................................................................................... 19 5.3 Process Control ............................................................................................. 23
6 Sensors ................................................................................................................... 25 6.1 Mass-Flow Meters ........................................................................................ 25 6.2 Image Analysis ............................................................................................. 28
7 Monitoring and Control System ............................................................................ 31 7.1 Overview ...................................................................................................... 31 7.2 Scada-system ................................................................................................ 31
8 Algorithms for Real-Time Optimization of Crushing Plants ................................ 37 8.1 Control Situation Characteristics .................................................................. 38 8.2 Finite State Machine Algorithm ................................................................... 38 8.3 Model-based Algorithm ............................................................................... 41
9 Results and Discussion .......................................................................................... 45 10 Conclusions ............................................................................................................ 51
10.1 General ......................................................................................................... 51 10.2 Answers to the Research Questions ............................................................. 52 10.3 Future work .................................................................................................. 53
References ....................................................................................................................... 55 Appendix
Paper A: A Cost Effective Conveyor Belt Scale
Paper B: Algorithm for dynamic cone crusher control
Paper C: On-Line Optimization of Crushing Stage Using Speed Regulation on Cone Crushers
Paper D: Two Variable Real-Time Algorithm for Cone Crusher Control
Paper E: Real-Time Algorithm for Cone Crusher Control with Two Variables

iv

v
ACKNOWLEDGEMENTS
First of all, I would like to express my deep and sincere appreciation to my supervisor, Professor Associate Dr. Magnus Evertsson for his inspiration, supervision and for letting me participate in a strong and stimulating research environment. It is a great pleasure to work with you!
My past and present colleagues at Chalmers Rock Processing Research group (CRPR) in the department of Product and Production Development are hereby also gratefully acknowledged! A special thanks to Dr. Per Svedensten (Sandvik SMC, formerly at CRPR) for good advice and laughs during my first three years at CRPR, and to Johannes Quist of the same reasons during the two latest years. To Johannes Quist and the PhD students Elisabeth Lee, Robert Johansson and Gauti Asbjörnsson I wish the best of luck! Special thanks to Elisabeth Lee who helped me in brushing up the English in a lot of text during these years.
I wish to thank the Swedish Mineral Processing Research Association (MinFo), the Ellen, Walter, and Lennart Hesselman Foundation for Scientific Research, and the Development Fund of the Swedish Construction Industry (SBUF) for financial support of this work. I would like to acknowledge Sand & Grus AB Jehander, NCC Roads, Sandvik SMC, Nordkalk, and Cementa for providing test plants, expertise, equipment, material, etc.
Thanks to the involved technical reference group with the following past and present members: Niklas Skoog (Sand och Grus AB Jehander), Pär Johnning (NCC Roads), Lars Sunnebo (Nordkalk), Magnus Bengtsson (Skanska), Arvid Stjernberg (Cementa), Leif Fuxin (Skanska), Marianne Thomaeus (formerly at MinFo), Per Murén (NCC Roads), and Jan Bida (MinFo, formerly at Swedish Aggregates Producers Association). Kudos also goes to Marianne Thomaeus, Kurt Beckius, and Per Murén for all the help regarding the project funding. The personnel at Fjärås, Kållered, Ludden and Glimmingen deserve greetings for their patience and support.
Kent Pettersson (formerly at Sand och Grus AB Jehander) deserves extra thanks for believing in my ideas in the early phase of the project. Thanks to my friend Erik Lindälv for teaching me about databases, web servers, and similar useful things in the beginning of the project. Thanks to Kristoffer Wilhelmsson (Roctim AB, formerly at NCC Roads) for helping me with the implementation at Glimmingen. Thanks to Michael Eriksson (Sand och Grus AB Jehander) for inspiring chats about automation and new ideas.
Thank you Mum and Dad, for giving me self-confidence and curiosity.
Thank you Johanna and Theander for your loving support!
Erik Hulthén
Göteborg, November 2010

vi

1
1 INTRODUCTION
The aims of this chapter are to: − Introduce the concept of crushing plants and their importance in a modern society. − Describe the operation of a crushing plant. − Introduce real-time control of crushing plants. − Describe the main challenges associated with crushing plant control.
1.1 CRUSHED ROCK MATERIAL
Rock crushers are used in the aggregate, mining, and mineral industries. Cost-effective production, including size reduction and size classification, is the primary challenge in these industries. Size reduction is achieved using crushers, while classification is achieved by screens.
Aggregates are used in homes and office buildings as well as in transportation infrastructure. Due to their low inherent value of about €5-15 per tonne, they are usually manufactured less than 40 km from where they are being used. Aggregates can be composed of gravel, crushed rock material, or both. Aggregate rock materials are processed by both crushers and screens, while sand and gravel sometimes are only screened. In Sweden in year 2008, 78 million tonnes of aggregates were produced from crushed rock materials [1], corresponding to 79% of all manufactured aggregate products. The remaining 21% of aggregates were mainly produced from sand and gravel deposits. However, extraction from natural sand and gravel deposits is steadily decreasing, which motivates finding more cost-efficient processing methodologies for crushed rock aggregates. In Europe, about three billion tonnes of aggregates were produced at about 28000 production sites in year 2007 [4].
Crushing plants are used as a pre-processing stage before milling and other fine particle treatments in the mineral and mining industries. In year 2008, 51 million tonnes of ore and bedrock from iron ore mines and non ferrous mines and 9 million tonnes of limestone were extracted in Sweden [9]. These tonnages were pre-processed by crushing plants.
1.2 CRUSHING PLANTS
Crushing plants consist of single machines or a set of machines that are put together to form a process to gradually reduce the size of the processed material. The machines include the following:
• Size reduction machines, e.g. crushers. • Separation machines, e.g. screens. • Transportation equipment, e.g. trucks and conveyor belts. • Storage, e.g. stockpiles or bins. • Extra equipment, such as scrubbers and soil mixers (occasionally).

2
The proof the pcrusher use consometimbetweenmaterial
ill
1.3 O
Crushinmachinematerialautomatautomatappreciaof persoand repmaterialcontroll
ocess is diviplants can di
or sometimne crushers mes achieven the crushel is shown i
Figure 1. Sanlustration (bo
OPERATION
ng plants arees are largel and resistion is oftention is thatably motivaonnel is relaair a few timl feeding wled by an op
ded into seviffer, but in
mes a gyratoas size red
ed in a verters in mostin Figure 1.
nd & Grus ABttom) as often
photo
N OF CRUSH
e dusty, dire and heavyst high inten scarce, spt the low inated automaatively lowmes per yeawhen the cperator.
veral stagesgeneral the
ory crusher. duction maical shaft imt stages. A
B Jehander's crn depicted in oo correspond
HING PLAN
rty, and noisy because thernal loads
pecifically innherent matation develo
w. For instanar. In additicrushers ar
s with differey are as folThe second
achines. Hompact crushsingle-stag
rushing plant order to see thto the number
NTS
sy and therehey need tos. Althoughn the aggregterial valueopment. Annce, most pion, cone crre full. Mo
rent size ranllows. The pdary and terwever, the her (VSI). I
ge crushing
in Fjärås. A phe process morrs on the depi
efore harsh o handle larh it is a pgates indus
e of the manother reasoroduction u
rushers haveost primary
nges in eachprimary stagrtiary stages
final shapeIn addition,plant using
photo (top) anre easily. The ction.
environmerge quantitiprocess indutry. One reaanufacturedon is that thunits only re level indicy jaw crush
h. The confige consists s, on the othe of the pr, screens arg gravel as
nd a schematic numbers on t
ents to workies of abrasustry, the ason for the
d products dhe required equire maincators that shers, howe
iguration of a jaw
her hand, roduct is e placed the raw
c the
k in. The ive rock level of e lack of does not number
ntenance stop raw
ever, are

3
Worn parts are replaced regularly by maintenance personnel. Crusher manganese liners wear quickly in most cone crushers, except when the feed material is a soft material like limestone. A typical wear part change interval for aggregate cone crushers is 100-1000 hours of operation. In highly abrasive quartzite crushing, the wear life can be as low as two weeks. Wear in cone crushers has been thoroughly investigated by Lindqvist [32]. In Figure 2, a cone crusher can be seen during a wear part change.
Figure 2. A Sandvik Hydrocone H6000 at NCC Roads’ crushing plant Ramnaslätt during
assembly after a wear part change. The cone, main shaft and top bearing can be seen in the center of the crusher.
Screen cloths wear out regularly. The cloth consists of either weaved steel wires, punched rubber or molded polymer. The wear of crusher mantle liners and screen cloths dramatically affects the products and the performance of the crushing process, Svedensten [46]. Changing liners in a crusher too late may cause severe mechanical damage. Changing too early, however, will cost money in the form of both unutilized parts as well as production loss.
Loading and unloading rock material is a common task for personnel. The rock material is loaded from the muckpile into the plant, or mobile unit, with an excavator or a wheel loader, which often, but not always, occurs in combination with a dump truck. After the crushing process, the produced material, i.e. the product, lands in either a stockpile or a material bin. If it lands in a bin, it is possible to load trucks or train hoppers directly from the bin. An example of such an automatic loading system can be seen in Figure 3. More often, however, the material has to be handled by an operator-controlled wheel loader when it is loaded onto trucks or train hoppers. When the plant is situated near the sea, ships are also used as a means of delivery. An example of loading equipment for ships can be seen in Figure 4.

4
Figure 3. Loading and weigh station at the same place. VMC’s Reliance operation, Irwindale, CA,
USA.
Depending on the size of the crushing plant, personnel duties can vary greatly. For larger plants, the tasks are more specialized, such as maintenance, loading, and process operation, while for smaller plants, one person may have several or even all of the mentioned tasks.
Figure 4. Loading equipment on the quay that can be used for ships and trucks. Norstone AS’ Tau
plant, Norway.

1.4 R
Crushindesigninwhich ipropagafeedbacas real-t
OPEN LMost coprogramon and ocontrollproportiautomatsetpointshell onas descroperatorThe crumachinecrusher.
PROBLE
Aggregaproductdistribuprocess
Raw mDependearlier ccan genand cru
REAL-TIME
ng plants tong the circuis also, hopates back tock together wtime optimi
OOP CONTR
one crushermmable logioff accordinled continuional-integrtic control st. This is don its threadsribed later. r or, when susher controe almost fu. A block di
EMS WITH RE
ate production of a sution of diff
and that aff
material variding on whecrushers andnerate an exushers later
E OPERATI
oday operauits and opepefully, as g the operatowith controzation of cr
ROL OF CONE
rs are fed auic controllerng to signalously with ral-derivativsystem prevone by adjus, thereby aThe controsize reductiool system iully indepeniagram for t
Figure
EAL-TIME Oction, incluingle particferently sizffect the qua
ies dependiere the focud other prodxcess of fin
in the pro
ON OF CRU
ate in a sterating themgood as posor, unlike inol would imprushing plan
E CRUSHERS
utomaticallyr (PLC) or s from feeda frequenc
ve (PID) cvents the clousting the cadjusting thel systems aon is imporis an open-ndently of the control s
5. Open-loop
OPTIMIZATIO
uding the ccle size is
zed particlesantities and
ng on the us is in theduction unit
ne material, ocess. Typic
USHING PL
tatic mode,m is to achiessible. Hown many otheprove the pnts.
S y; the matea relay that
d level sensocy convertecontroller. Sosed side secone verticae concave v
attempt to krtant, at a co-loop config
what happsystem is ill
p control of CS
ON crushing pnot possib
s is manufaqualities th
excavation e process, thts. For examaffecting t
cally, finer
LANTS
which meeve an even
wever, no, oer industriesprocess in th
erial level ist switches aors. Sometimer, this leveSome cone
etting (CSS)ally with hyvertically, deep the CSS
onstant maxguration; thpens to the lustrated in
SS on a cone c
process, is ble using toactured. Therein are als
site and hhe feed mample, a crusthe performr material a
eans that tn and smoothor at least vs. It is the auhis industry
s kept in a a feeder andmes, if the bel is kept ie crushers ) from deviaydraulics ordepending oS at a value
ximum presshe control s
material pFigure 5.
crusher.
a complexoday’s tech
he parameteso complex
how the maaterial can asher earlier
mance of theaffects the
the intentioh productio
very little, futhor’s opinand is defin
specific rand/or a belt cbelt and/or in its rangeare automa
ating from ar by turningon the mache determinesure or powsystem contpassing thro
x process hnology. Iners involvedx.
aterial was also be affein the proc
e followinghydraulic p
5
on when on result, feedback nion that ned here
nge by a conveyor feeder is e with a ated; an a desired g the top hine type ed by the wer draw.
trols the ough the
because nstead, a d in this
blasted. ected by
cess flow g screens pressure,

6
power draw, additional generation of fine material, and capacity. The raw material parameters can vary periodically and stochastically with a long or short time scale.
Manganese liner wear affects crusher performance. A worn crusher chamber has undergone physical changes and has a different profile than that of a new chamber, which affects both the capacity of the crusher and the size and shape of the produced particles. Some crushing chambers are more sensitive to wear than others. Further, crushers with worn liners can behave differently, with some increasing and others losing their capacity as a function of wear.
CSS is the parameter used to adjust many contemporary crushers online. Crushers with a hydraulic CSS adjustment can be controlled online in an open-loop configuration as previously described. Crushers using a threaded top shell design can also be controlled using an open-loop configuration; however, the control is limited by the thread clamping system, which cannot be released when material is present in the crushing chamber. Some crushers using a threaded top shell design can be adjusted when loaded; however, making adjustments when loaded will probably shorten the lifetime of many of the machine parts.
Cone crushers usually run at a fixed eccentric speed. Frequency converters can potentially control the eccentric speed by controlling the frequency of the alternating current to an asynchronous motor. However this has historically been too expensive to implement. Manual speed changes, on the other hand, require changing belt pulleys, which is labor intensive.
Because aggregate crushing is a process industry with a continuous flow of processed rock material, the performance of the process is difficult to obtain online. One way to determine the effect of a change is to take a belt cut before and after the change. Unfortunately, belt cuts stop production and may not accurately represent changes (a typical belt cut only contains rock from 0.5 seconds of production). In addition, they are often divided down to a couple of kilos before being sieved. Thus, substantial manual work is required before anything can be said about the process, and further, by the time the result is ready, the crushing conditions may have already changed several times.
One way to obtain process information is to use mass-flow meters, commonly being a belt scale, on the conveyor belts. Unfortunately, traditional belt scales are relatively expensive, on the order of € 5000-10000, and are therefore sparsely installed. Consequently, the high cost associated with implementing flow meters has hindered the development of process control in this kind of process industry.
Operators are busy and do not have enough time to control an open-loop crusher as effectively as well-configured computer software. Such software coupled with adequate sensors can facilitate closed-loop control, as depicted in Figure 6, which was originally presented by Evertsson [20]. This control configuration also requires models or rules to transform user requests into machine setpoints.

Figure 66. Possible sys
tem for closedd-loop processs control for aa single crushing stage.
7

8

9
2 OBJECTIVES
The aims of this chapter are to: − Describe the purpose of the research project resulting in this thesis. − Formulate the research questions.
2.1 RESEARCH OUTLINE
The purpose of this research project is to understand the production process of rock materials in which cone crushers are used and to develop knowledge and methods for optimizing the operation of these machines in real-time to maximize product yield. Real-time is here interpreted as what is possible to adjust during operation with sufficient feedback from the process. Real-time optimization will potentially increase the automation in the aggregates, mineral, and mining industries and will thus assist operator decision making and increase production. Crushing plants are investigated in particular, with the goal of helping producers at crushing plants directly select which products they want to produce, which is accomplished by real-time optimization of the machines.
This thesis focuses on optimizing a single crushing and screening stage, see Figure 7. The reasons for focusing on a single crusher are that there are currently two real-time adjustable parameters and that even by optimizing a single crusher, the output of the crushing plant will be directly affected in terms of final products.
The objective for this thesis is to develop theories, models, software and hardware that enable real-time optimization of a single crushing and screening stage. An important part of this investigation is to find or develop suitable sensors for this type of process.
The main hypothesis is that fixed parameters can never be optimal over time because several other parameters change continuously.
Figure 7. The focus of this thesis is a crusher and screening stage, depicted in the dashed box.

10
2.2 RESEARCH QUESTIONS
There are five research questions that have been formulated within the scope of this work:
• Crusher control systems are widely used for wear compensation and machine protection (e.g. over load, fatigue life). Is it possible to improve the production process by complementing these open-loop systems with feedback from the process and product yield and thereby obtain a closed-loop control system?
• In order to control crushers using information about the product yield, it is necessary to monitor the material flows at different positions in the process. Is there a more cost effective alternative to expensive belt scales?
• CSS is the most common control parameter for adjusting the product from cone crushers. Is it possible to use other parameters such as eccentric speed for real-time optimization?
• Is it possible to optimize the process with two real-time adjustable parameters at the same time?
• Is it possible for a real-time algorithm to perform the optimization described above?
3 R
The aim− I− E
t
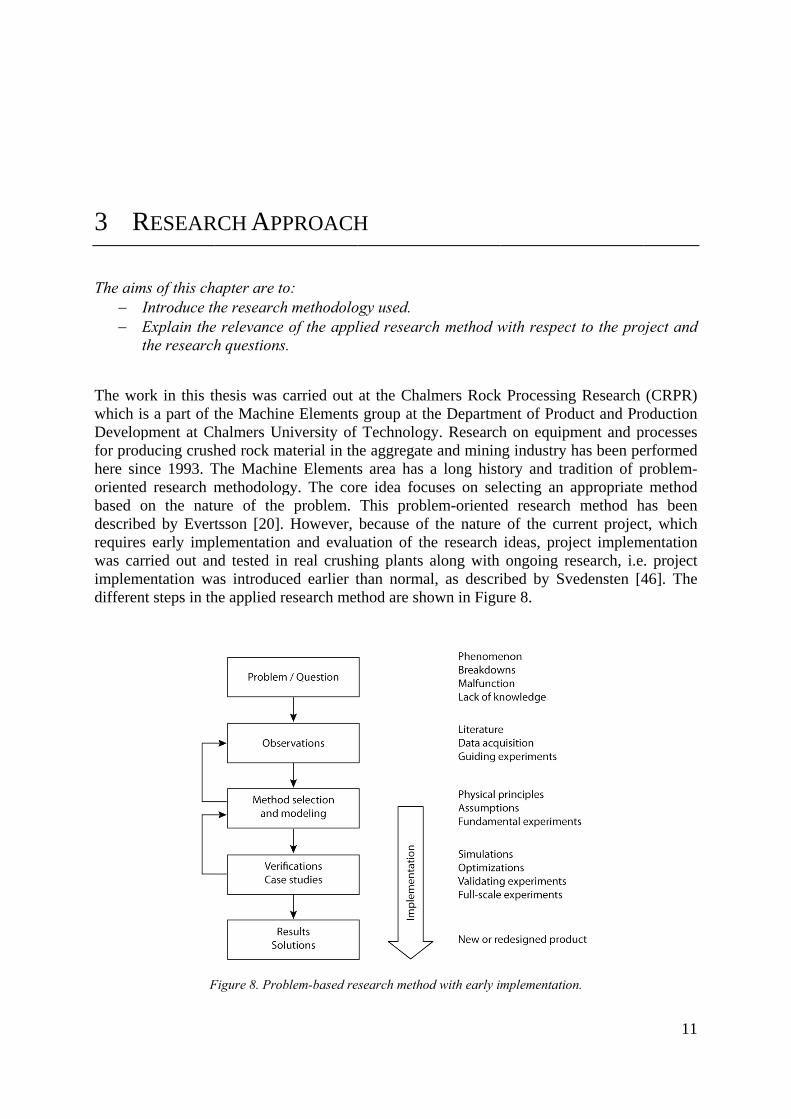
The wowhich iDevelopfor prodhere sinorientedbased odescriberequireswas carimplemdifferen
RESEAR
ms of this chIntroduce thExplain thethe research
ork in this ts a part of tpment at Chducing crushnce 1993. Td research mon the natued by Everts early imprried out an
mentation want steps in th
F
RCH APP
apter are tohe researche relevance h questions
thesis was cthe Machinhalmers Unhed rock mThe Machinmethodologure of the tsson [20].
plementationnd tested inas introduche applied r
Figure 8. Prob
PROACH
o: h methodolo
of the appl.
carried out ne Elementsniversity of aterial in thne Elementsgy. The cor
problem. However,
n and evalun real crushed earlier tesearch met
blem-based re
H
ogy used. lied researc
at the Chals group at thf Technologhe aggregates area has re idea focuThis problbecause of
uation of thhing plants than normathod are sho
esearch metho
ch method w
lmers Rockhe Departmgy. Researche and minina long histuses on sellem-orientef the naturehe research along with
al, as descriown in Figu
d with early im
with respec
k Processingment of Prod
h on equipmng industry htory and tralecting an ad research of the curideas, projongoing re
ibed by Svure 8.
mplementatio
t to the proj
g Research duct and Proment and phas been peadition of pappropriate
method hrrent projecect implemesearch, i.e
vedensten [4
n.
11
oject and
(CRPR) oduction
processes erformed problem-
method has been t, which
mentation . project 46]. The

12
Problem-based research begins by identifying a problem or question that needs to be solved to achieve some benefit or improvement. The nature of the problems can, of course, be very different, which is why the method is not selected beforehand. The problem in question does not necessarily originate from a malfunction, but can, as in this research project, start with an assumed potential of increased productivity.
The problem area in question is observed to identify its nature. This can be done with field studies, examining the literature, guiding experiments, or performing interviews, for example.
Subsequently, appropriate methods are selected and models are developed. During this phase, several potential methods and models, in combination with previously reported literature, are studied to select the ones most suitable for the problem. The process is iterative, and a new method is selected if the previous is found to be insufficient.
The result of this work is then tested and verified, preferably together with the industry. This verification phase is also an iterative process, meaning that further potential improvements may lead to a new iteration.
To assist the previously described steps and to ensure that the result is applicable, implementation should begin during the course of research. Implementation leads to product and process development, which is a separate challenge and research field unto itself. However, doing the opposite, i.e. not considering implementing the results, likely leads to unrealistic solutions to the problems and results that are of no practical use.
This project was conducted in collaboration with aggregate producers, which involved regular meetings between project members and industry workers and the utilization of their plants for the discussed case studies. The advantage, and challenge, of this arrangement was to design test equipment to be handled by the producers themselves, both during the studies and afterward.
One of the most important scientific challenges in working in this type of project is interpreting industrial needs. In support of this function, the CRPR group has complemented the problem-based research method with a value-based approach. The Value Model [33], which originates from value management, is a method that aims to improve the value of products and services by focusing on the value created for the customers. The concept of value is based on the relationship between satisfying needs and expectations and the resources required to achieve them [10]. Value engineering was first used at General Electric during World War II with the purpose to use limited resources as effectively as possible. The method was later adopted by many other industries.
In this five years project everything was not set from the beginning. Research is evolutionary itself, also in the short perspective in the meaning that the hypotheses that are confirmed are also the same as the next generation hypotheses are built upon. Furthermore, those that were not confirmed, or perhaps showed to be false, are not the basis for the next step, even though it is only from these anomalies new knowledge can be achieved. The fact that the problem-oriented research method does not accept that a certain method or solution did not work, and instead finds a new way to solve the problem makes it suitable for engineering fields. This evolutionary development of the research presented in this thesis is best reflected in the appended consecutive papers, A-E.

13
4 LITERATURE REVIEW
The aim of this chapter is to: − Provide an overview and introduction to the research performed for optimizing
crushing plant control and control in similar process industries.
The amount of research around real-time optimization of crushing plants is very limited. Even with a wider focus including many crushing plant simulations the amount of work is sparse. Although process control with respect to the produced products is a common practice in many other process industries, it is rarely seen in an aggregates context.
CRUSHING AND CRUSHER PARAMETERS Since the 1970’s models of production units and processes in the comminution industry has been modeled, e.g. by Whiten [49] from the Julius Kruttschnitt Mineral Research Center (JKMRC). Work more specific on cone crusher performance have been published e.g. Briggs [19] from JKMRC and Evertsson [20] from Chalmers. Unfortunately, many of these models requires both crusher geometry and feed input data and the subsequent calculation is time consuming, which make them less useful in a real-time optimization perspective. Sensors capable of providing data for use in these systems are rare. However, these models can still be used for validation and for understanding.
Karra [28] tested several parameters on cone crushers in the 1970’s by investigating eccentric speed as a parameter setting and found speed had no significant effect on the particle size distribution or the capacity. These results are difficult to explain, but could possibly be due to effects of other much more significant parameters. The lack of an accurate procedure for long-term evaluation is another explanation. No references or investigations for dynamic speed control have been found. Bearman has investigated how several material parameters affect comminution machines, e.g. in [13]. Bearman and Briggs [14] have investigated how several time dependant parameters affect the crusher output. They state that an active use of these parameters, including a better control system, would help in keeping up performance.
SIMULATION AND OPTIMIZATION Maximum plant output can be obtained by theoretically optimizing gross profit using simulation software, and then running the plant according to those optimizations. Such simulation software are provided by for example Sandvik (Plant Designer), Metso (Bruno), JK Tech (SimMet) and BedRock Software (Aggflow) [40]. The optimization in this kind of software is described by Svedensten [46]. Many variables impact plant operation: natural variations of rock material properties in the feed, equipment wear, weather, and unscheduled stops. To implement real-time control of a crushing plant, an accurate measurement of the process status with these variables in mind is crucial.

14
SENSORS For both the aggregate and the mining industry there are several image analysis systems entering the market during the recent years. Most of them consist of cameras above the conveyor belt. The good thing with this is that almost all of the flow can be investigated, in contrast to batch based systems as PartAn [27]. On the other hand systems like PartAn, where the material is falling and rotating in front of the sensor, are the only way how to get all the fine particles, and at the same time include the shape of the material.
Moshgbar et al. [38] described a product driven control strategy for cone crushers using wear sensors and adaptable control parameters. They used a laser-based aggregate particle size monitoring device.
REAL-TIME OPTIMIZATION Impact crushers are controlled by adjusting their feed capacity. Reitemeyer [41] described a method by which the feed rate to an impact crusher is controlled by a system using information about the material flows as a control input. The throughput of feldspar was doubled using this control technique. The same principle of determining the capacity through the power draw of lifting conveyor belts was used in this work.
Milling operations have been more extensively investigated in the mining industry with numerous of publications each year due to the high intrinsic economic value of the products. At the PT Freeport copper mine, Mills et al. [36] have developed a real-time, adaptive optimization system based on continuously calibrated models. The system is described as an “optimizer on a higher level”. This system runs on a conventional personal computer and delivers setpoints to the existing control system. Further, it also presents a number of non-measurable variables as estimates to the operator screen. Using this system increased the throughput of the mill circuit by 5.7%.
Moshgbar et al. utilized integrated sensors in the manganese liners for determining wear, thereby enabling the ability for dynamical wear compensation [38] and [39].
ALGORITHMS An algorithm is an effective method for solving a problem with a finite number of steps [2]. It is simply a set of rules in how to act or calculate in a deterministic way. In a comminution context, it is sometimes seen for solving optimization problems theoretically. For instance Svedensten [46] uses Evolutionary Algorithms (EA) for plant optimization, While et al. [48] use EA for designing machine and process parameters on a crusher and Lee [30] uses EA for theoretical optimization of crushing.
Evolutionary operation (EVOP), as described in Box and Draper [17], is a method wherein the process variations are used for process improvements. The method is not an automated method, rather on the contrary; it is used manually in manufacturing and process industries. Holmes has successfully optimized a cement plant with an automatic EVOP system without any explicit model [25]. The result was that the desired variable increased by 37% at the same time as the mixture of raw materials used was changed to a more profitable one.
15
5 PROCESS CHARACTERISTICS
The aims of this chapter are to: − Describe the production units used in crushing plants. Because the cone crusher is a
very common machine and has a significant impact on the result, the focus will be on cone crushers.
− Describe the different parameters that are investigated for use in real-time optimization.
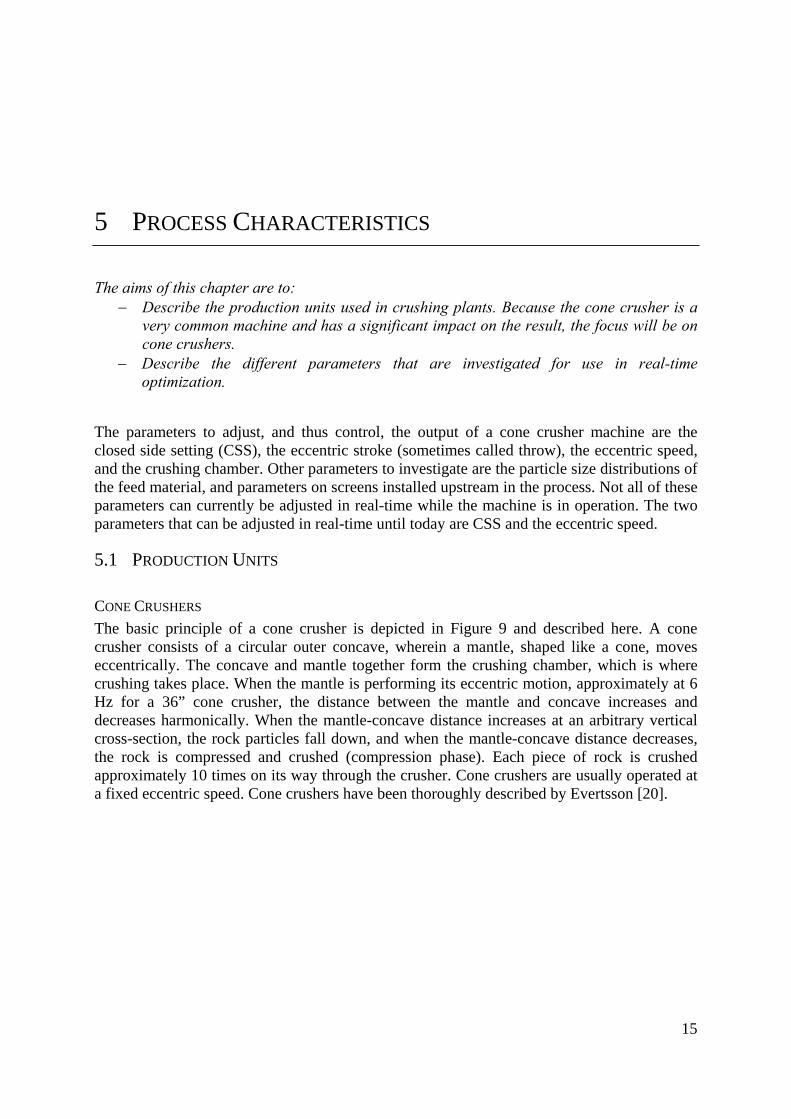
The parameters to adjust, and thus control, the output of a cone crusher machine are the closed side setting (CSS), the eccentric stroke (sometimes called throw), the eccentric speed, and the crushing chamber. Other parameters to investigate are the particle size distributions of the feed material, and parameters on screens installed upstream in the process. Not all of these parameters can currently be adjusted in real-time while the machine is in operation. The two parameters that can be adjusted in real-time until today are CSS and the eccentric speed.
5.1 PRODUCTION UNITS
CONE CRUSHERS The basic principle of a cone crusher is depicted in Figure 9 and described here. A cone crusher consists of a circular outer concave, wherein a mantle, shaped like a cone, moves eccentrically. The concave and mantle together form the crushing chamber, which is where crushing takes place. When the mantle is performing its eccentric motion, approximately at 6 Hz for a 36” cone crusher, the distance between the mantle and concave increases and decreases harmonically. When the mantle-concave distance increases at an arbitrary vertical cross-section, the rock particles fall down, and when the mantle-concave distance decreases, the rock is compressed and crushed (compression phase). Each piece of rock is crushed approximately 10 times on its way through the crusher. Cone crushers are usually operated at a fixed eccentric speed. Cone crushers have been thoroughly described by Evertsson [20].

16
Figure 9. Principle of a cone crusher.
The distance between the concave and mantle, measured at the narrowest is called the closed side setting (CSS). The narrowest distance is normally at the outlet of the crushing chamber. The CSS is adjusted and controlled differently depending on the type of cone crusher. In one cone crusher design, the main shaft assembly with the supporting cone and mantle is adjusted vertically by hydraulics underneath the main shaft, while the concave is fixed. The hydraulic system protects the machine from overloading and potential damage from large non-crushable objects, such as mill balls, bolts and excavator teeth, by evacuating the oil and thereby lowering the mantel rapidly. During normal operation, the hydraulic system keeps the CSS at a given position by controlling the vertical position of the mantle. This type is denoted as Hydrocone from here on. For instance, most of Sandvik’s cone crushers, Metso’s G-series and Thyssen Krupp’s Kubria-series are of this type.
In a different cone crusher design, the crusher head and its mantle are fixed vertically and rotate eccentrically. The concave is fixed in the top shell, which is connected to the crusher through a thread with a large diameter. As the mantle and concave are worn, the top shell rotates and moves down and thus keeps the CSS at a given number. To protect the machine from large non-crushable particles, the top shell also has a hydraulic release system that can open the crusher rapidly if needed. This type is denoted as the HP type from here on. For instance, Metso’s HP-series and FL Smidth’s Raptor-series are of this type. The two crusher types are depicted in Figure 10.
Figure 10. Crusher types. The Hydrocone crusher (left) has a top bearing, and the angle between the horizontal plane and the cone is steeper (~55 degrees), while the angle of the HP type (right) is flatter (~45-50 degrees).
Mantle
ConcaveConcave
Mantle
ConcaveConcave

VERTICA
A Vertipump, tand minfor qualcrushersincreaseIn minienergy cheaperthis macand the is beyoncrusher mineralrotor, an
Figur
AL SHAFT IM
ical Shaft Imthrowing thening industrlity reasons s produce aes compareding, on the effective [3
r to buy, howchine are thspeed. The
nd the scop(HSI). The
s industry. nd never by
re 11. VSI crus
MPACTERS (mpact crushe particles ories. VSI cin the aggr
a more cubd to a cone other hand
31]. The mawever the che feed itsele speed is thpe of this the HSI crush In an HSI
y the materia
sher seen from
(VSI) her (VSI) iout from rotcrushers havregates indubical particlcrusher, wh
d, fines are achine itselfcosts for welf, by-pass
he most obvhesis. An alher is mainI crusher, tal itself.
m above, mode
s an impactor. VSI cruve been thoustry are desle shape, hhich is often
often wantf is lighter ear parts maof a portion
vious paramlternative imnly used forthe material
eled with disc
t crusher, wushers are uroughly des
scribed by Bhowever then non-desirated, and Vthan a cone
ay be highern of the fee
meter to wormpact crushr softer mal is hit by h
crete element m
which workused both inscribed RycBengtsson [e productionable in the aSI crusherse crusher, wr. The param
ed material, rk with in reher is Horizaterials, e.ghammers th
modeling. Illu
ks like a cenn aggregate,chel [42]. T15]. Generan of fine maggregates is can then bwhich also mmeters to chthe rotor g
eal-time, hozontal Shaft. Limestonehat are fixe
ustration by J.
17
ntrifugal mineral
Their use ally, VSI materials industry. be more makes it hange in
geometry owever it ft Impact e, in the ed to the
Quist.

18
SCREEN
Screenssizes frorubber throughStafhamwhich sHowevefor sepacloths wdifferenoperatiosizes (leaerodyn
Figure 1d
CONVEY
Conveyproductenergy changesdesign conveyoin Figur
NS s are used inom each othcloths whic
h the apertummar [45]. Ssome might er, screens taration of twear rapidlnt sizes of on. An examess than 2
namic drag.
12. This screedifferent conve
YORS yors are freqts. The sizeseffective th
s in form acriteria andors used in tre 20 in Cha
n aggregateher and therch oscillateures. The Screens havbe on-line
themselves the productly (dependeparticles p
mple of a smm) air cl
en is fed from teyor belts awa
quently uses of the parthan vehicleand distancd examples the same plapter 6.1.
, mining anreby form thes in order screening p
ve, just like adjustable, are beyond ts, which inent of the
pass dependscreen in anlassifiers ca
the conveyor oay from the scr
d in crushinticles are ofes [26]. Hoe vehicles of conveyo
lant can be s
nd mineral ihe products
to transpoprocess wacrushers, seand would the scope o
n their turnabrasivene
ding of hown aggregate an be used
on top comingreen. NCC’s G
ng plants foften less thaowever, it i
are often uor belts canseen in Figu
industries tos. Screens coort the mateas investigaeveral machthus be po
of this thesin will be mess of the rw long theplant can bto separate
g in from the rGlimmingen op
or the transan 200 mm. is a fixed iused insteadn be foundure 13. A de
o separate ponsist of steerial and toated thorouhine and prossible to ops, apart from
measured inrock matere screen clbe seen in e the partic
right. The prooperation, Udd
sportation oA conveyo
installation d because
d in [5]. Anepicted con
particles of deel wire of po let partic
ughly by Socess paramptimize in rem that they
n real-time. rial), and wloths have Figure 12. cles by grav
ducts are condevalla, Swed
of feed mateor belt is mu
and since of flexibilit
n example onveyor belt i
different punched
cles pass oldinger
meters, of eal-time. are used Screens
will thus been in For fine vity and
veyed on
den
erial and uch more
quarries ty. Both of many is shown

Figure 1
5.2 PA
The varoperatin[20] in paramet
CLOSED
The CSmachineimpact loop cocontrol operatioother hadrawbacbelow. TFigure 1
13. Conveyor b
ARAMETER
riable paramng parametematrix formters also exi
D SIDE SETTI
SS is the moe and thus in Karra’s
ontrol in numsystems th
on. In manyand, the gapck that the The effect o15a (HP typ
belts are frequplants.
RS
meters can ers. For conm, showingist, such as
ING ost commonthe particleexperimentmerous cruhat have a y other crusp between tprocess m
of varying tpe).
uently used foVMC’s Relian
be dividedne crushers,g what each
selecting th
nly used pae size distrit [28]. As m
ushing plantfeature tha
shers that dthe mantle
must be stopthe CSS par
or transportatince operation,
d into desi, these para
h of the parahe time for c
arameter to ibution. It imentioned pts all over tat compens
do not haveand concav
pped while rameter is s
ion between d, Irwindale, C
ign parametameters haveameters affchanging we
adjust the is also the previously, the world. Ssates for cr
a fully autve is contro
adjusting tshown in Fi
different produCA, USA.
ters, machie been desc
fects. In addear parts.
degree of cparameter tit is curren
Some crushrushing chatomatic conlled manuathe CSS, sigure 14 (H
uction units in
ine paramecribed by Edition, man
comminutiothat has thently used fohers have auamber wearntrol systemally. This bree Process
Hydrocone ty
19
crushing
ters and Evertsson
agement
on in the e largest or open-utomatic r during
m, on the rings the
Control ype) and

20
Figur
The CSconcaveEvertssothe numthe curdiagramdirectiocrusher
F
re 14. Particle
SS affects the changes, on [20]. Th
mber of comrves are bam, i.e., both
n. In termstypes.
Figure 15. Par
e size distribucapacity
he particle and thus,
he amount ompressions itasically shifh the top-ss of the CS
rticle size distrthe c
tion (main illuy for the same
size distribthe crushi
of time that t will be exfted horizoize and fin
SS paramete
ribution as a fclosed side se
ustration) as aCSS range (e
bution becauing ratio aa particle s
xposed to. Nontally in tnest size arer, there is
function of thettings (CSS). b
a function of Cembedded illus
use the distand the capstays in the
Note that in the cumulare affected no major
e investigated b) eccentric sp
CSS in a Hydrstration).
tance betwepacity chan
e crushing cboth Figure
ative particlby the chdifference
parameter in peed.
rocone crushe
een the manges, accorchamber dete 14 and Figle size dist
hanges in thbetween th
the HP type:
er. The
antle and rding to termines gure 15a tribution he same hese two
a)

ECCENT
Eccentrthe numsize distthe discimpact While chorizonmeasureHP crucrusher,shown icrusher;
One thedifferenother costays inincreasecrusher,least wimore. Tlonger s
How thEvertssoHP, are in the sa
TRIC SPEED ric speed hamber of mattribution of
cussion of thof differenchanges in
ntally, changements of thsher the sh, on the othin Figure 16; as the spee
Figure 16. P
eory to expnt effects, anoncept. Then the crushines as the , on the othithin a rang
The reason wsince the ecc
he crusher on [21]. Thoperating t
ame directio
as a significterial compf the produchis phenom
nt CSS and the CSS m
ges in the he largest phare of fineher hand, th6. The direced increases
Particle size di
plain the dind one is pre first effectng chamberspeed increher hand, thge) because why the effcentric spee
capacity iese principlto the right on by speed
cant impact pressions, thct. Similarly
menon is beyeccentric s
move the pspeed tend particles, is er particles
he rotation oction, at leas, the numb
istribution as
ifference brominent in t is that the r in the Hyeases becauhe number the effectiv
fective stroked is slower
s affected les can be sof the max
d, regardless
on the prohe effectivey, speed alsoyond the scospeeds on tproduct cum
to rotate inot signifi
s increases of the parti
ast in the finer of finer p
a function of e
etween theone type ofeccentric sp
ydrocone cruuse the rocof fine par
ve stroke iske is largerr.
by the ecceen in Figu
ximum capas of crusher
duct in a coe compressio determineope of this tthe producemulative pait. The top-cantly affecwith a red
icle size disner particlesparticles inc
eccentric spee
types of cf crusher, anpeed affectsushers; thusk gets crus
rticles incres larger andr is because
centric speure 17. Bothcity, i.e. the
r type.
one crusherion ratio, anes the shapethesis. Figued particlesarticle size-size of thected by diffduced speedstribution iss, is opposicreases.
ed in a Hydroc
crushers is nd the others the amouns, the numbshed more eases with dd thus the p the particle
eed has beeh crusher type crushers’
r. The speednd thus thee of the produre 15 comp in an HP
e distributioe particles, ferent speedd. In a Hys less promite to that of
cone crusher.
that there r is prominent of time aber of fine ptimes. For
decreased sarticles get es have tim
en investigpes, Hydroccapacity is
21
d affects particle duct, but pares the crusher.
on curve i.e., the
ds. In an ydrocone inent, as f the HP
are two ent in the a particle particles the HP
speed (at crushed
me to fall
gated by cone and affected

22
Figure
In mostwhich isome ccrushingthe speetime-cothat muare opebefore ausually at least product
STROKE
The strotoday tomeasurerelationpoint wdown thoptimiz
Practicapoint. Itway of crusherswhen chadjustedknowled
FEED The feeincreasematerialthus flapressure
17. Total cap
t cases, the is labor-inteases, whereg plants haved change imnsuming, itst be combirated at a ca new speeonly used afor the ag
tion plants s
E oke is the eo be a mached in the low
nship of the when it is clo
he chambering the repe
ally, the strt also has sproducing fs, a change hanging lind from the odge, there is
d strongly aed feed sizel in the bin
akier particle, become to
pacity in a Hydmarks
speed of aensive and e so-called ve no accurmplies. Takt requires ained with fuconstant speed is selectas soft-start
ggregates insee how mu
eccentric dihine paramewer end of tdistance be
osed determr, as has beeated compr
roke on a msome effect fewer fine por an adjus
ners but is soutside of ts no crusher
affects the pe may resuon top of itles. When too large, wh
drone H3000.the operation
a cone crustime-consudirect driv
rate or reliabking belt cutadditional siurther sampeed. A seleted. Frequenters. Until andustry. Hoch the speed
istance the eter that canthe cone, seetween the
mines the redeen shown ression step
machine affon the num
particles is stment of thseldom donhe crusher r available w
performanceult in a poot. This situatthe feed cohich causes
Original illusnal area for mo
her can be uming, andve is applieble way of mts is one meieving, and les for accu
ected speed ncy conver
a few years owever, theyd parameter
cone movennot be adjee Figure 9. liners at th
duction ratiby Evertss
ps in a cone
fects the camber of finto decrease
he eccentricne. On Metand only rewith a strok
e of a cone orly chokedtion will ca
ontains mans the crusher
stration from odern cone cr
adjusted byd is therefored, it is nomonitoring easurement
in the end urate assessm
is usually rters are rarago, they wy have becr affects the
s during hausted or coFor the ma
he point wheo. This ratioson [20]. Acrusher has
apacity lineae particles. the stroke. bushing m
tso’s GP300equires a fewke adjustable
crusher. Bed crusher, euse increase
ny fine partr to open to
Evertsson [21
rushers.
y changingre not donot possible.the changestrategy. Hit is still ju
ment. Thereused for lo
re, and if twere considcome increae output.
alf a round.ontrolled duraterial that isen the crusho varies dur
A detailed ts been done
arly aroundIf the rock
To changemust be done
0 and 300Sw minutes e in real-tim
engtsson [15even thoughed single paticles, the fo protect the
1]. The dashed
g belt drive e unnecess. In additio
es in producowever, thiust a singleefore, cone ong periodsthey exist, dered too exasingly com
This is coring operatis being crusher is openring a partictheoretical we by Lee [30
d a given ok is very bre the stroke e, which is pS, the stroke[6]. To the
me.
5] describesh there is particle breakforces, and e machine. S
d ellipse
pulleys, arily. In
on, most ction that is is very e sample crushers of time they are
xpensive, mmon as
nsidered ion. It is shed, the
n and the cles path work on
0].
operating rittle one on most practical e can be author’s
s how an plenty of kage and thus the
Size (top

23
size), the number of fine particles, and the amount of feed has a large impact on the product and the crusher. The top size affects how deep in the chamber a rock falls and how many times it remains in the chamber.
CHANGE OF WEAR PARTS Changing worn parts will affect the performance on all of the production units in a crushing plant, but here the focus is on the liners (mantle and concave). With knowledge about how well a production unit can perform with changed liners, an alarm signal can be set off to indicate that it is time for a replacement, if enough data about the current performance is collected. This long term degradation in performance during the lifetime of the liners for flat angled crushers is well known and described e.g. for a Symons 7’-crusher by Andersen and Napier-Munn [11] and for a base supported crusher with 900 mm head diameter by Bearman and Briggs [14]. An example can be seen in Figure 7 in Paper E.
5.3 PROCESS CONTROL
From a process control point of view, the most obvious area of improvement at most crushing plants is the sparse number of measurement points and thus the lack of process data. The measurement points that do exist consist of mass flow meters (belt scales), load sensors (ampere meters), level indicators (light beams, radar, ultrasonic sensors), and machine type specific parameters. On cone crushers, the latter consists of CSS, hydraulic pressure, and the load (power draw or amps).
Hydrocone crushers, equipped with a crusher control unit which controls the hydraulic pump, are operated in one of two possible modes where either the CSS or the hydraulic pressure is kept constant. Since this crusher type adjusts for wear automatically the control question is limited to selection of control method and its setpoint. Crushers in a mining application, i.e. where the purpose is to get as fine product as possible are often operated in the pressure, or power, limited mode. This implies that the crusher is operating as hard as the manufacturer allows, of strength or fatigue reasons. This mode can also be used in the aggregates industry, but there CSS-constant mode is also used. Running the crusher at a constant CSS helps to keep the quality of the produced material high. The particle shape is best for sizes around the CSS [15].
Since HP crushers are seldom adjusted when filled with material, they are adjusted, or controlled, after a specific period of time or when the power draw drops below a certain limit. This results in two disadvantages, which are illustrated in Figure 18. First, while the liners are worn they gradually decline in performance, which is the triangle of lost production in the illustration. Second, when the liners are to be adjusted the production cost can be significant. Even after the feed is running again, it can take several minutes to fill the crushing chamber again. Monitoring during the course of this thesis shows that a typical production loss period is more than five minutes. How often such adjustment is carried out varies from plant to plant, everything between once a week and four times a day is common. If an adjustment is done four times a day and takes six minutes on a plant with one shift this is equal to five percent of the total available time. If not time, e.g. four times a day, an ampere meter is often used as an indicator for liner adjustment.

24
F
The selmeasureduring simulati(Metso)on somOnce thare seld
Figure 18. The
lection of sement pointhe design ions are pe), SimMet (e paramete
hese setpoindom modifie
e losses in an
setpoints fots in the prof the plan
erformed w(JK Tech), Ars are usua
nts are seleced or even q
HP crusher.
or the procrocess. Selent or is a hwith softwaAggflow (B
ally performcted, sometquestioned.
The two majo
ess is diffiecting setpoheritage if are, for insBedRock So
med. The strimes a coup
r losses are d
icult. One roint, i.e. cothe plant is
stance Planoftware). Teroke is ofteple of setpo
depicted with t
reason for onfiguring ts old. Som
nt Designerests during en used to aoints in so c
the filled areas
this is the the process
metimes stear (Sandvik)the commi
adjust the ccalled recip
s.
lack of is done
ady state ), Bruno issioning capacity. pes, they

25
6 SENSORS
The aim of this chapter is to: − Describe sensors suitable for monitoring mass-flows in crushing plants. − Introduce the theory of an alternative, cost-effective mass-flow meter.
To measure is to know. It is hard to measure the output from crushers and other production units at crushing plants in real-time. Measuring properties of the machines themselves is rather easy; amperes, power, pressure, speed and temperature are commonly measured. Flows are more difficult to measure. One might be interested in the flow, the particle size distributions, particle shape and material properties, such as strength. Since the focus of this thesis is to close the loop from the settings of the machines to the material being produced and back to the optimization system, to measure the material in real-time is crucial. In the past this has not been possible. Typically, particle size distribution is measured by sieving in a laboratory. This is far from real-time. One way to measure particle size distributions in real-time is to use optical belt sensors, which are described briefly below. In this thesis, the measuring method uses material flows from production screens.
6.1 MASS-FLOW METERS
The most common way to measure mass-flows in comminution plants is to use conveyor belt scales. Conveyor belt scales are typically used at one or several conveyor belts due to payment or state regulations. In many production plants, these scales are only installed in a few locations due to cost. As previously stated, there is an increasing need for process flow information in comminution circuits. Real-time process knowledge drastically increases the possibility of process control. In aggregate production, mobile units are becoming more common, and consequently, the economic burden of expensive conveyor belt scales is also increasing. Developing a cheaper belt scale would be of significant economic value.
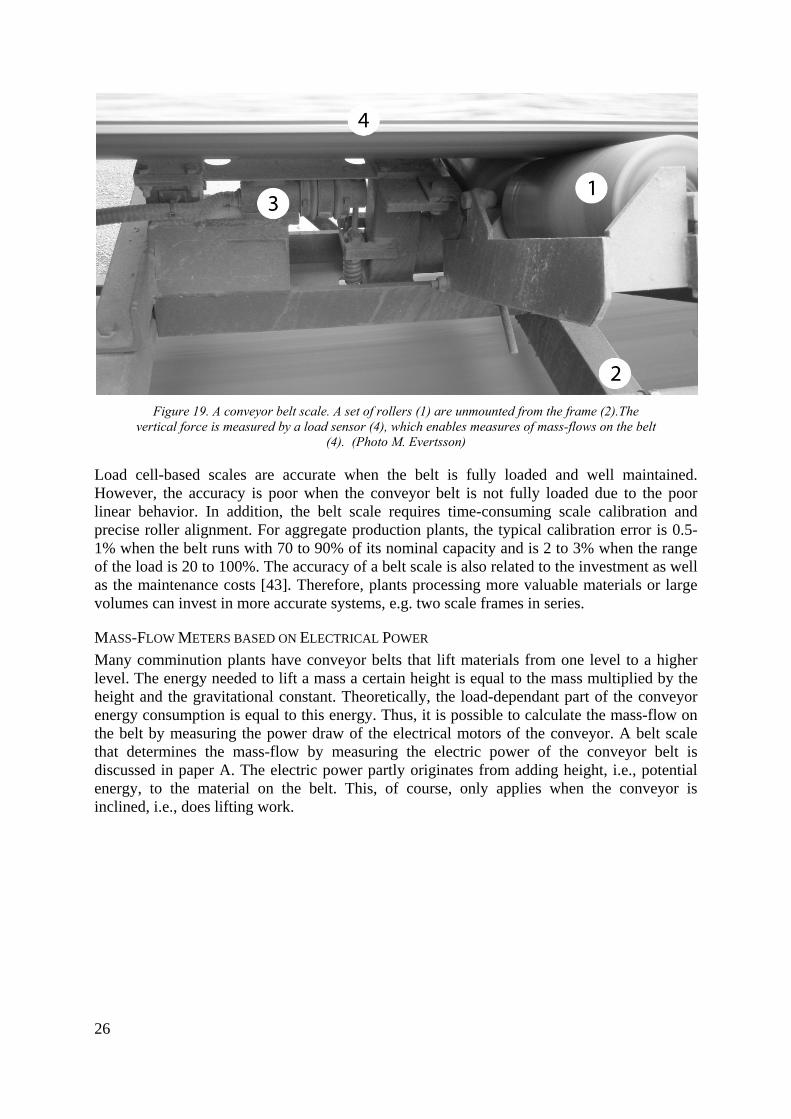
CONVENTIONAL CONVEYOR BELT SCALES A classic conveyor belt scale consists of load cells mounted on a scale frame, as depicted in Figure 19. One of the idler frames of the conveyor is mounted on the scale frame, which, in turn, is mounted on the conveyor frame. In addition, a speed sensor is installed on the conveyor. By combining the signals from the load cells, which measure the mass on a given part of the belt, with the speed of the conveyor belt, a measure of the mass-flow is obtained. Conveyor belt scales are described in detail by Soederholm [44].
26
Figure 19. A conveyor belt scale. A set of rollers (1) are unmounted from the frame (2).The
vertical force is measured by a load sensor (4), which enables measures of mass-flows on the belt (4). (Photo M. Evertsson)
Load cell-based scales are accurate when the belt is fully loaded and well maintained. However, the accuracy is poor when the conveyor belt is not fully loaded due to the poor linear behavior. In addition, the belt scale requires time-consuming scale calibration and precise roller alignment. For aggregate production plants, the typical calibration error is 0.5-1% when the belt runs with 70 to 90% of its nominal capacity and is 2 to 3% when the range of the load is 20 to 100%. The accuracy of a belt scale is also related to the investment as well as the maintenance costs [43]. Therefore, plants processing more valuable materials or large volumes can invest in more accurate systems, e.g. two scale frames in series.
MASS-FLOW METERS BASED ON ELECTRICAL POWER Many comminution plants have conveyor belts that lift materials from one level to a higher level. The energy needed to lift a mass a certain height is equal to the mass multiplied by the height and the gravitational constant. Theoretically, the load-dependant part of the conveyor energy consumption is equal to this energy. Thus, it is possible to calculate the mass-flow on the belt by measuring the power draw of the electrical motors of the conveyor. A belt scale that determines the mass-flow by measuring the electric power of the conveyor belt is discussed in paper A. The electric power partly originates from adding height, i.e., potential energy, to the material on the belt. This, of course, only applies when the conveyor is inclined, i.e., does lifting work.

27
α
h
droph
v
Q
P
Figure 20. The principles of a conveyor belt lifting material a height h. The particles are dropped on the belt from a height hdrop, accelerated to speed v, and lifted to a height h.
The potential energy work for lifting a mass m the height h is given by:
potentialW mgh= (1)
where g is the acceleration of gravity. The parameters for the conveyor belt are shown in Figure 20. When a conveyor belt is lifting material, it converts electrical energy into potential energy of the material. In addition, the acceleration of the material and the loading of the belt also consume energy, as discussed in Paper A. The power can be computed as:
2( 2 sin )materialmaterial drop
dWP m gh v v ghdt
α= = + + (2)
where m is the mass-flow, hdrop is the height from which the material is dropped onto the belt, α is the angle of inclination of the conveyor, and v is the speed of the conveyor belt. Morin [37] has explained this classic example, but in the formula above the material is being dropped from a non negligible height. If the losses, e.g. due to friction, are neglected, this is the minimum amount of energy required to lift the material.
Apart from this power, other losses occur when electrical energy is converted to material potential energy. A model comprising the electrical motor, the belt transmission, the gear stage, and the belt pulley has been developed for the efficiency, which can be computed as:
tot iη η=∏ (3)
where ηi is the efficiency for the ith drive. Using the efficiencies derived from Gerbert [22], the total efficiency of a typical belt conveyor is in the range 0.702 to 0.826. If poorly maintained, this average range can adjusts downwards. In Paper A, the efficiency of a well-conditioned belt, determined by averaging 15 efficiency tests, was found to be 0.758, which is in the published range.
The power that remains after these losses can be expressed as
material load totP P η= ⋅ (4)
where Pload is the load dependant electric power. The total electric power is
electrical idle loadP P P= + (5)
where Pidle is the idle power. The mass-flow can now be computed as

28
( )2 2 sin
electrical idle tot
drop
P Pm
gh v v ghη
α−
=+ +
(6)
The causes of idle power are not fully understood and need to be investigated further. The most likely explanations for idle power are mechanical friction losses, e.g. in rollers and bearings, and the dissipative component of the rubber in the belt. For each revolution, the belt is bent two to five times (depending on the belt tensioning system). This causes energy loss. The dissipation of mechanical power depends on the shear modulus, frequency, and the strain rate of the material [29]. The shear modulus for rubber is strongly temperature dependant. Gerbert [23] shows examples of the strong relationship between loss module ( E ′′ ) and temperature for a typical V-belt rubber. Martins and Mattoso [34] tested used tire rubber and found that the loss factor (tan δ) varied from 0 to 0.54 at -100°C and -30°C, respectively, and back to 0.08 at 190°C. Thus, if the temperature range for conveyor belts is maintained between -30°C to +30°C, conveyor belt power loss decreases with increasing temperature. This is also shown in Paper A, where the idle draw of a conveyor belt at the startup was evaluated as a function of the outdoor temperature; the correlation was 0.874, and the temperature was measured at a distance of 18 km from the belt.
Carlo Gavazzi WM-12 and 14 power transducers were used to monitor conveyer belt power. It is important to use a measurement device that calculates the power as
cosP U I ϕ= ⋅ ⋅ (7)
where U is the voltage, I the current, and cos φ is the power factor. The power factor, often labeled on the electrical motor in the range of 0.85 to 0.9, can be as small as 0.35 for low power draws.
LIGHT BEAM SENSOR Another sensor used for monitoring the current material flow on a conveyor belt is a light beam sensor, which is mounted on a frame positioned around the material. The frame holds a laser beam that measures the contour of materials that pass through it. This process requires the density of the material to be known, or at least be constant. Such a system is sold by Hartle Sensortechnik GmbH [7]. The price is not significantly lower than that of a traditional belt scale and thus is not further investigated here. The advantage of a beam sensor system is that it can be mounted without affecting the conveyor frame or idling rollers, and it is not sensitive to misalignment.
6.2 IMAGE ANALYSIS
There are a number of measurement systems that claim to directly monitor particle size distributions. Most of these systems use optical sensors. Some systems ([16], [24]) take still images of the material, e.g. in a pile, on the ground or on a conveyor belt (it does not matter if the belt is moving), as shown in Figure 21. As soon as a material is placed in a static pile, the finer particles stratify downward and are hidden by larger, overlaying particles. Therefore, this measurement system struggles to accurately monitor fine particle concentrations due to this fine particle stratification effect. However, this problem can be avoided. Sometimes it is important to identify the top-size of a material flow, and sometimes it is possible to get enough information about the particle size distribution by looking at the coarser end.

Figure
Anothersuitablebeen deas well the ordecrushingalso expis high.
21. Output fr
r type of ime for laborateveloped fur
as their shaer of €50,00g plants it hpensive, but
om an image
maging methtories. It wrther [3]. Thapes, can be00-100,000.has to be cot it would pr
analysis systepermissi
hod analyzeas describehe advantage measured. To get a s
ombined witrobably be
em by Stone Thion from Ston
es images od in detail ge is that ald. Unfortunasystem like th an automa viable sol
Three (illustrate Three).
of falling paby Jørgensl sizes of paately systemthis to work
matic samplilution if the
tion by Stone T
articles. Then in 1990 articles with
ms like thesk for real-tiing system. e value of th
Three, publish
his type of s[27] and h
hin the distre are expenime optimizThese samp
he produced
29
hed with
sensor is has since ribution,
nsive, on zation of plers are
d product

30

7 M
The aim− E
c− D
7.1 O
Real-timcommundifferencomputestored init after pThis sys
Figu
7.2 S
A Superprocesse
1. H2. 3. R4. P5. C
MONITO
m of this chaExplain thecrusher. Describe th
OVERVIEW
me optimizanicating wi
nt communier. The coln a databaspreset rulesstem is illus
ure 22. A mon
CADA-SYS
rvisory Cones and for c
Human macSupervisoryRemote termProgramminCommunica
ORING A
apter is to: e support
he systems d
ation at the ith measurcation protollected datase. There mus. Finally, thstrated in Fi
nitoring and co
STEM
ntrol And Dcommunicat
chine interfy computer minal units ng logic conation (infras
AND CO
system nee
developed in
industrial sement deviocols or, ina and the cust be a prohere must bigure 22.
ontrol system controllabl
Data Acquisiting with us
face (HMI)
(RTU) ntroller (PLstructure)
ONTROL
eded to per
n this projec
scale requirices and a
n some casecalculated cocessing unbe a user int
needs to be ale units, and th
ition (Scadasers. It is div
LC)
L SYSTE
rform real-
ct.
res a compuactuators. Tes, directly control signnit that can cterface to co
ble to commuhe operator.
a) system isvided into fi
EM
-time optim
uter or PLCThis can be
from an annals need tocalculate thommunicate
nicate with se
s used for cofive parts [8
mization of
C system cae done via
nalog IO-caro be organihe data and e with the o
ensors, a datab
ontrolling in]:
31
f a cone
apable of a several rd to the ized and interpret operator.
base,
ndustrial

32
Implementation is an important part of this thesis, and Scada systems on different levels have been used as tools. Scada systems are not direct parts of the research questions, but they are crucial parts of real-time optimization. Each part is explained briefly below.
The systems (HMI and the supervisory computer) used in this thesis can be divided into two generations. The first generation was built on a Linux platform with a simple homemade web-HMI (Papers A-C), whereas the second generation is built on a Windows platform with a full industrial HMI package from Iconics (Papers D and E).
HUMAN MACHINE INTERFACE A human machine interface (HMI) is the interface through which the operators control a process. On old pulpet systems, the switchboard with its buttons was the HMI, whereas on modern computer-based systems, the HMI is made graphically to give a good overview and at the same time be intuitive. Graphical software HMIs are flexible, intuitive, easier to copy, and can be remotely controlled.
A web interface was developed by the author for the first generation of SCADA, see Figure 23. It was developed to facilitate remote control of the system. A remote-controlled Scada helps during both the development and the usage of a system. Using this interface, operators can see material flows, the status of machines as text and graphs, and changes to the operating mode, and they can set limits for the algorithm. The same information can be accessed via the Internet by the author from Chalmers in Göteborg. Successful installation of this kind of system requires that the onsite operators trust the system. If they are not comfortable with the algorithm, they should be able to change limits or manually control the system if necessary.

33
Figure 23. Human machine interface via a web browser. The crushing plant shown is Jehander
Ludden’s, wherein the eccentric speed optimization tests were first performed (Paper C).
The second generation of HMIs were built on a platform called Genesis from Iconics, see Figure 24. Using this interface, operators can see material flows, the status of machines as text and graphs, and changes to the operating mode, and they can set limits for the algorithm. The system uses a Windows-PC and is widely used the industry. Other manufacturers of HMI platforms include Citect, Siemens, and Wonderware. Some of the benefits of an HMI platform include:
• Standard of graphical illustration of production • Adaptability • Connectivity to other devices • Plug & play graphical modules • Fully supported
These upsides come with the drawback of less flexibility.

34
Figure 24. Human machine interface for the research implementation at NCC’s aggregates plant,
Glimmingen (Papers D and E).
SUPERVISORY COMPUTER In a Scada system, a supervisory computer is used to display the HMI, to send control signals to the process and to collect data in a database. The process is often controlled and supervised by a PLC (see below). However, the PLC often gets its commands from the supervisory computer.
In this thesis, the supervisory computer is also used for executing algorithms. In the first generation, the supervisory computer was an industrial PC with Linux. The advantage with this was that Linux is very stable and cost effective. This computer had no graphical user interface (GUI), but hosted a webpage with which the operator could monitor the process from another PC.
In the second generation of the system, which was developed in this project, a server with a Microsoft Windows operating system (OS) was used. In this case, the process was monitored from the host computer. The advantage with Windows is that it was easier to maintain.
All measured data and changes are logged and stored into databases. For example, if the set-point limit is changed by a user, then this event is stored in the database and is later used to determine if a process change was caused by the user or by some phenomena in the machines or raw material. In the first generation, the data were loaded into a database using software developed in the programming language C. This software also analyzes the data and provides new set-points based on an algorithm that will be discussed later. In the second generation, an
OPC sewritten
REMOTE
Remotecommunor perfosensors
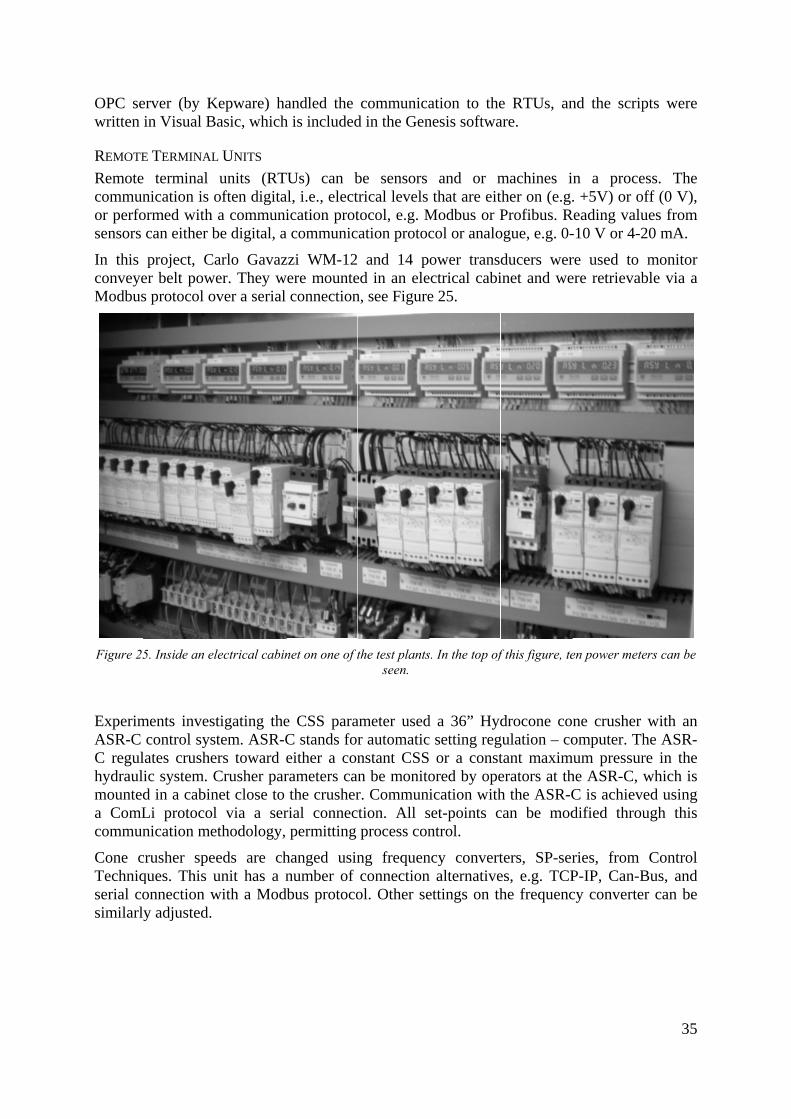
In this conveyeModbus
Figure 25
ExperimASR-C C regulhydraulmounteda ComLcommun
Cone cTechniqserial cosimilarl
erver (by Kin Visual B
E TERMINAL
e terminal nication is oormed with can either b
project, Cer belt pows protocol o
5. Inside an el
ments invescontrol sys
lates crusheic system. Cd in a cabinLi protocolnication me
crusher speques. This uonnection wy adjusted.
Kepware) haBasic, which
L UNITS units (RT
often digitaa communi
be digital, a
arlo Gavazwer. They wover a serial
lectrical cabin
stigating thestem. ASR-Cers toward Crusher parnet close to l via a serethodology,
eeds are chunit has a nwith a Mod
andled the h is included
TUs) can bal, i.e., electication prot
a communic
zzi WM-12were mounte
connection
net on one of t
e CSS paraC stands foreither a conrameters cathe crusher
rial connecpermitting
hanged usinnumber of
dbus protoco
communicad in the Gen
be sensors trical levels tocol, e.g. M
cation protoc
and 14 ped in an elen, see Figure
the test plantsseen.
ameter usedr automaticnstant CSSn be monitor. Commun
ction. All sprocess con
ng frequenconnection
ol. Other se
ation to thenesis softwa
and or mthat are eit
Modbus or Pcol or analo
ower transectrical cabie 25.
s. In the top of
d a 36” Hydc setting reg or a constored by opeication with
set-points cntrol.
ncy convertn alternativeettings on th
e RTUs, anare.
machines ither on (e.gProfibus. R
ogue, e.g. 0-
ducers werinet and we
f this figure, te
drocone cogulation – cotant maximerators at thh the ASR-Ccan be mod
ters, SP-seres, e.g. TCPhe frequenc
nd the scrip
in a proce. +5V) or o
Reading valu-10 V or 4-2
re used to ere retrievab
en power mete
one crusher omputer. Th
mum pressurhe ASR-C, wC is achievdified throu
ries, from P-IP, Can-Bcy converte
35
pts were
ess. The ff (0 V), ues from 20 mA.
monitor ble via a
ers can be
with an he ASR-re in the which is ed using ugh this
Control Bus, and er can be

36
PROGRA
In a Scameasuredistributhat is dtransferin specithan com
Figure 2
In this tin existresearch
COMMU
Commuconnect
In the controllor TCPpermittiresearchnetworkIn the se
AMMING LO
ada system,ement data
uted, meanindistributed. rred over a ial languagemmonly bel
26. A rack-bas
thesis, sometent cases, h computer
UNICATION A
unication betions or Eth
systems dlable producP/IP. In theing remote hers to reacks. Remote econd gener
GIC CONTRO
, the PLC isa from the ng that an aIn the nodelong distanes to a detelieved a PC
sed PLC from
e of the test control waswas connec
AND INFRAS
etween differnet. Typic
developed ction units ae first gene
connectivitch the systeconnectionration the S
OLLER s the brain
measuremanalog signae, the signa
nce to the ceerministic b
C does. An e
m Schneider. Tand com
plants had s bypassed cted separat
TRUCTURE
fferent unitscal protocol
here, comare perform
eration, the ty via intraems via then has been aSCADA was
that controlment units (
al (e.g. 4-20al is converentral procebehavior. Texample of a
The PLC is divmmunication m
PLCs, somthe PLCs
tely to the R
s and comls are Modb
mmunicationmed using th
supervisoranets and the Internet asan advantags stand alon
ls starts and(RTUs). A 0 mA) is corted to a digessing unit (his means ta PLC can b
vided into a CPmodules.
me did not. Aof safety r
RTUs.
mputers in abus and Prof
n with thehe Modbus pry computehe Internet. s well as bge during thne.
d stops, intePLC is o
onnected bygital signal,(CPU). PLCthat they mbe seen in F
PU, analog an
Anyhow, thereasons. Th
a SCADA fibus.
e measuremprotocol viar was netwThis madey the operahe developm
erlocks andoften more y a node to which canCs are prog
must be morFigure 26.
nd digital IO-
e measuremus, the sup
is done vi
ment devica serial con
worked via e it possibleators via thment of the
d collects or less
the PLC n then be grammed re stable
modules,
ment and, pervisory
ia serial
ces and nnections
TCP-IP e for the eir local system.
37
8 ALGORITHMS FOR REAL-TIME OPTIMIZATION OF CRUSHING PLANTS
The aim of this chapter is to: − Introduce the hypothesis behind real-time optimization. − Explain why normal control theory in practice can be difficult to apply. − Introduce algorithms for selecting set-points of CSS and eccentric speed on cone
crushers. − Explain the differences between the finite state machine and model based algorithms.
The purpose of this thesis is to give set-points to crushing plants to let them perform optimally given the rock material and machine equipment. The rock material varies all the time. The hypothesis is that it is possible to use this variation and control the plant in a suitable way. Earlier chapters have described how the crushing process works, which parameters can be used to manipulate them, how to collect data from the process and how to handle this data and control the plant with a SCADA system. With this information, a skilled operator would definitely increase the yield or performance of the plant. However, in several ways a computer can be more effective than an operator:
• It is hard for an operator to determine what is significant in a signal if it is noisy. • An operator cannot get an overview of the entire business, including sales, stocks,
maintenance, spare part cost, and other factors. • Their decisions regarding the process will affect many factors and thus the gross profit
of the company. • It is likely that an operator will increase the deviation of the process, which is not
desirable from a quality management perspective [12]. • The retention time is longer for the operators than a computer, i.e. the time between a
change is introduced until enough information is collected for an operator to draw conclusions and act from it.
For these reasons the author’s wish and aim is to organize many of these decisions and to make set-point selections automatically using a computer system. This is defined as real-time optimization. A computer is also better than humans at handling large numbers of data because a computer is deterministic and can calculate deviations.
Many contemporary cone crushers are equipped with automatic systems to control the CSS and to protect the equipment from over-loading. The settings are determined by the operator most of the time. The quality and the size distributions of feed materials normally change with time. In addition, wear occurs on both the crusher manganese liners and screen cloths. What is the objective of the crushing stage? The answer is to produce the largest possible amount of one or several desired products. The quality of the material, e.g. the particle shape, must be sufficiently high.

38
8.1 CONTROL SITUATION CHARACTERISTICS
In many processes, the important control issue is to keep a parameter on a certain value or move the process to a certain position when a set-point makes a step change. However, in this situation, there is no target set-point as the best possible production yield will be dependant on the varying feed and wear situation. The goal for the crushing plant is to maximally produce a certain product or to keep the product yield as high as possible. However, the rock material is constantly varying, so the product yield also varies. Thus, there is no obvious set-point. Due to the fact that the set-points are unknown, classic control theory cannot be used. This is a special situation, and it is hard to copy control theories from other engineering areas. Therefore, an algorithm is introduced. An algorithm is an effective method for solving a problem [2]. The output from the algorithm can be a set-point to the controllable parameters on the production units in the process, e.g. CSS or eccentric speed on crushers. In this thesis, two types of algorithms have been tested; Finite state machines (FSM) and Evolutionary operation (EVOP) with an empirical model.
8.2 FINITE STATE MACHINE ALGORITHM
Flowcharts are often used to represent algorithms graphically. An FSM algorithm from Paper B is shown in Figure 27. It is assumed that there exists an optimal setting for each parameter at every point in time, as depicted by Figure 28. However, it may exist constraints, e.g. limited power draw, which make the optimal operating point on the border of the constraint. Several factors can vary over time, so a fair comparison between two different settings at different times is difficult. When determining the best choice of parameter values, usually CSS, several manual, repeated step changes are performed. The performance of the crushing plant before and after the change can then be compared under equal conditions. If there is an overlying trend, it is important to alter the order of the trials, for instance with so called split-plot designs, e.g. by Box et al. [18].

39
Figure 27. A flowchart can be used for explaining the algorithm more pedagogically. A finite state machine is
used in some algorithms in this thesis.
2Decrease CSS
Operate a short while
3Decrease CSS
Operate a short while
5Increase CSS
Operate a short while
4Increase CSS
1Operate a short while
6Increase CSS
Operate a short while
7Decrease CSS
Better?
Time?
Better?
Better?
Better?
Yes
Yes
Yes
Yes
No
No
No
NoNo, but too high pressure
No, but too high pressureYes, but too high pressure
Yes, but too high pressure

40
Figure 28. The fitness landscape is compared with a ridge, where time is pushing in the direction of the ridge. At
each moment it is assumed that there is an optimal setting of the studied parameter.
ALGORITHM FOR CLOSED SIDE SETTING Paper B describes the development of the first algorithm. The first algorithm, which was designed as a naïve pathfinder, found an assumed maximum; however, it was oscillatory around a value, which degraded the performance. This can be compared to a PID control system with too much gain, i.e. too high P-factor. A finite state machine (FSM) based on a Mealy machine [35] was subsequently used as an improved algorithm.
The FSM was developed manually (in contrast to a computer generated algorithm) to find an optimal CSS and stay there for a period of time. The structure of the developed FSM is summarized in Figure 27. The developed FSM has seven states, of which two are directly transient, i.e. the action connected to the state is performed thereafter a new state is entered.
The introduction of the FSM also permitted the use of crusher load (hydraulic pressure) when computing the next set-point. The pressure was controlled after each state with an exit condition. If the pressure was too high, then a state that opens the crusher to reduce the pressure is selected. The pressure protection is still performed by the crusher control system, but with this feature, a set-point generating too high of a pressure can be avoided before the crusher automatically stops operation due to a long time period with too much load.
The developed algorithm was tested in a 36” Hydrocone crusher equipped with an ASR-C control system. The algorithm was written in a script and executed in a computer and evaluated the process continuously via belt scales. The goal for the algorithm was to maximize a selected product. The output from the algorithm was delivered as a set-point value to the crusher.
41
ALGORITHM FOR ECCENTRIC SPEED The algorithm for the eccentric speed is a development built upon the previously described CSS algorithm. Instead of the crusher control system executing the set-point CSS, the frequency converter executes the frequency of speed change of the asynchronous motor turning the eccenter. The states for avoiding high pressure were removed. The eccentric speed algorithm is thoroughly described in Paper C.
The developed speed algorithm was implemented and tested on a Metso Nordberg HP300 (Paper C) and confirmed on a Metso Nordberg HP4 (Paper D). The algorithm was written in a script and executed in a computer. It evaluated the process continuously via belt scales. The goal for the algorithm was to maximize the yield of a certain product. The output from the algorithm was delivered as a set-point value to the frequency converter.
There is a significant difference between a CSS-controlled and speed-controlled crusher in terms of the electrical current behavior (measured in amperes). At the test plant, operators use a current meter to determine when they have an acceptable CSS. When they turn the top shell part of the crusher with the hydraulic motor to decrease the CSS, the current increases. The crusher responds to an increased speed by pulling less current. It is important to inform the operator of this fact.
8.3 MODEL-BASED ALGORITHM
The idea behind a model-based algorithm is to actively use several parameters to control the process. The FSM algorithm above also uses a model, see Figure 28. While working with the FSM algorithm in the NCC Glimmingen aggregate plant, a large quantity of data was collected and subsequently used for fitting the model.
The data from the first trials in Glimmingen were used to build a simple model for the crushing-stage performance during one stint. A run is the operating time, e.g. between two CSS adjustments on a crusher of the HP type. On a Hydrocone crusher, runs are short and occur often if operated intermittently. In the best case, a run can last the entire shift (or more, if operated over several shifts). The model, which was described in Paper D, resembles a hill or a mountain ridge, see Figure 29. It has the mathematical form:
(8)
where is the crushing-stage output, is the eccentric speed, is the time since the last CSS adjustment, and are constants. During later tests, the constant was shown to be very close to zero. This means that the quadratic term in the time since the last liner adjustment is almost negligible.
When the model is tuned and accepted, the algorithm simply follows the top of the ridge. As the time since calibration increases, there is always an optimal speed adjustment, which, according to Equation 8, is linear. This linear change of eccentric speed was tested in Paper D.

42
Figure 29are spe
CONSID
In Papeprocess implemregularlof coursmaterialadjustedrestartinsteady-sof timesdefined conside
1. Phb
2. E3.
mThese thin x andependethe EVO
9. The suggeseed and time s
DERING A CO
r E, the moautomatic
mented on thly, but not dse, on the al before thed by stopping the feedstate mode s during eacas a run inration, three
Power drawhigh reductbefore a newEccentric spSpeed chanminutes. hree parame
nd y directioent on how OP algorithm
ted and fitted since the last C
s
ONTINUOUSL
del in Equacally. Therhe same Metdynamicallyapplication)e CSS can ing the feedd. This takeagain. Therch shift. Evn an EVOP e parameter
w when adjution but decw adjustmepeed when tnge, i.e. how
eters are illuon and rotamuch the g
m.
model for theCSS adjustmenspeed and spee
LY CHANGIN
ation 8 is aprefore, an tso crusher y, typically ). When thebe adjusted
d, unclampies six to terefore, this
very operatincontext. Ta
rs are resolv
usted. If thecreased capant is neededthe run is stw much the
ustrated in Fation in thegap is tighte
e crushing stagnt. In the EVOed change rat
NG CLOSED
pplied, but thEvolutiona
from the Nevery two
e liners becd, because oing the thren minutes adjustment ng time peraking the mved:
e power draacity. A smd. tarted, n0. e eccentric
Figure 29 ane x-y-planeened, this w
ge performancOP test, paramte, respectively
-SIDE SETTI
he issue herary Operat
Nordberg HPor three hou
come wornof the desigead, turningbefore the can only b
riod betweenmodel and th
aw is high, mall CSS wil
speed shou
nd correspo. Because P
was excluded
ce looks like ameters 1-3 cory.
ING re is how totion (EVOP range. Theurs of operathe crusher
gn of the crg the top shprocess is e performedn adjustmen
he crusher-ty
the CSS is ll also lead
uld be chan
ond to positiParameter d as a contr
a ridge. The parrespond to CS
o use it to imOP) approae CSS was ation (this dr must be erusher. Thehell, clampup and run
d, at most, nts can therype limitati
small. Thisto a longer
nged, e.g. e
ioning of th1 (Power Drolling para
arameters SS, start
mprove a ach was adjusted depends, empty of e CSS is ing, and nning in a couple refore be ions into
s implies runtime
very ten
he model Draw) is ameter in

43
The main reason why fixed settings are not optimal is that several factors in crushing plants vary with time. In addition to the short-term wear period of the crushing chamber discussed above, the factors that are beyond operator control are raw-material variation, screen-cloth wear, and total crushing-chamber wear over its useful lifetime.
The developed EVOP algorithm was implemented and tested (Paper E). The algorithm was written as a script and executed on a computer. It delivered set-point values to the frequency converters based on the different runs in the EVOP. The process was monitored and logged continuously via belt scales. After a set of runs, when entering a new phase, new directions for the EVOP were taken by the author based on the information from the previous phase and a knowledge of the process and its constraints. As stated previously, EVOP is a manual method.

44

45
9 RESULTS AND DISCUSSION
The aim of this chapter is to: − Present and discuss the results from previous chapters. − Discuss the work in more general terms.
POWER DRAW BASED MASS-FLOW METERS The power draw based mass-flow meter, described in Chapter 6.1, was tested on an inclined conveyor belt with a belt scale mounted on another belt in series. The worst error during a test day was 2.33%, with an average error of 1.12%. The coefficient of correlation between the power draw based mass-flow meters and the belt scale was 0.998.
Power-based mass-flow meters have been used in this project since 2006 for measuring flows for process control in Fjärås (3 units), Ludden (4 units) and Glimmingen (10 units), 17 units altogether. The companies involved in this project have installed these sensors on additional belts, a total installation of 62 belts.
Both the validation of the belt scales in Kållered (Paper A) and the fact that it was possible to use them for process monitoring at all other plants in this work, i.e., Fjärås (Paper B), Ludden (Paper C) and Glimmingen (Paper D and E), demonstrate that the belt scales do work for this purpose. The most common doubt about them is usually related to what might happen if an idler gets stuck, i.e., the increased friction between the rubber belt and the idler might increase the idle power draw and, because the belt scale cannot differentiate between idle power and material power, it might show an increased mass flow on the display. However, for the purposes of the belt scales used in this work, such a stuck roller would increase the measured flow if this occurred but would then continue to show a too-high mass flow. Thus, the next time this flow is used for monitoring a step change of a parameter it will give the correct direction again. This works as long as the comparisons are made within a short period of time. This also raises the possibility that if the idle power draw is carefully monitored, it could be beneficially used for preventive, or even predictive, maintenance. Although classical belt scales are negatively affected by the tough environment in a crushing plant, they are usually only calibrated once a year, however, many things can happen during this time. Two further reflections can be made on the performance of power-based belt scales: they work better on a belt with more inclination and they work better on newer or well maintained conveyors.
REAL-TIME OPTIMIZATION WITH CSS The CSS control algorithm was tested on an Allis Chalmers 36” Hydrocone crusher. The crusher was operated by alternating between a fixed CSS and an algorithm-controlled CSS to determine the effectiveness of the algorithm. Due to large variations, the evaluation took place over the entire period of the fall of 2007. The crusher was often limited by pressure rather than the CSS setpoints. The reason for this was that the target product was a very fine product (2-5 mm) and thus required a large reduction ratio which leads to a high hydroset pressure. In

46
the cases where the desired CSS was achieved (by the algorithm or a constant value), the algorithm was 3.5% better on average than the constant CSS. A t-test was performed, showing that the algorithm was better under a 3% significance level, meaning that the algorithm was better than the constant CSS with 97 % certainty.
The work on adjusting the CSS on a crusher with a control unit demonstrates that the focus must be shifted from the crusher itself to the process as a whole. The fact that the crusher was often limited by the pressure means that it did not matter what algorithm was used to set the CSS, as it could not be maintained. Therefore, a shift from CSS control to load control should be considered, i.e., with the crusher tightening the CSS until the pressure or motor power becomes too high. However, this is actually a decision that an algorithm could possibly make.
REAL-TIME OPTIMIZATION WITH SPEED The speed control algorithm was tested on a Metso Nordberg HP300 cone crusher, which was operated in a closed-loop configuration during the late fall of 2007. The crushers were operated in three different modes: a fixed standard speed of 1500 rpm, a speed corresponding to the operator’s choice, and a speed determined by the algorithm. The operators chose which mode was used. The algorithm was tested during a full mantle lifetime. Every time the mode was switched, a comparison between the prior and the new operating modes was performed. The crushing-stage total throughput, which increasing was the plant management’s highest-priority goal, was increased by 4.2%. A t-test showed the superiority of the crushing operation with either the operators’ choice of speed or the algorithm speed over crusher operation at a standard speed at a significance level of 0.05%. This means that with 99.95% certainty, the operator/algorithm together was better than the standard speed. The same algorithm was also tested on a Metso Norberg HP4 cone crusher operated in a closed-loop configuration during the fall of 2009. Here, the results, shown in Table 1, were confirmed with the algorithm showing a superiority of 5.3% compared to running at the best fixed speed. Compared to the OEM-specified speed, the superiority was even higher, at 16.7%. However, the tests with the HP4 were not performed on the same statistical grounds as those with the HP300.
Table 1. Results with different modes in Glimmingen.
Method: Ridge-model FSM 1380 rpm 1500 rpm
Results at 7200 seconds operation in one stint
262.5 tph 258.4 tph 245.5 tph 221.5 tph
Comparison: Ridge-model - 1.6% 6.9% 18.5%
FSM - 5.3% 16.7%
1380 rpm - 10.8%
The results from the two plants with speed control on the HP crusher types demonstrate a huge potential. It is strange that frequency converters have not been implemented on a wider scale. The reason is probably a combination of several factors, and a lack of process monitoring and the cost of frequency converter the two most important. As a conservative business, the aggregates industry has not accelerated this development. Some people consider frequency converters unreliable. It is understandable, however, that if you cannot measure things and the environment is tough, it is probably a good idea to keep things simple.

47
An unexpected result was that the mantle lifetime increased by 27% during the HP300 trials in Paper C. Since these trials and because of the achieved improvement, the plant management has not allowed any running at a constant speed. The explanation to this result is beyond the scope of this thesis but is believed to depend of changed internal dynamics in the crushing chamber or a difference in work hardening of the crusher manganese liners.
REAL-TIME OPTIMIZATION WITH TWO VARIABLES The model-based algorithm, described in Paper D, follows the top of the modeled “ridge” linearly. The operators normally adjust the crushers every two hours. Therefore, a time of 7200 seconds was chosen as the period for which performances were compared. The results, shown in Table 1, were an improvement of 6.9% compared to the best fixed speed. Compared to the OEM speed, the improvement was 18.5%. Note that there is no statistical confidence associated with these numbers as in Paper C, although the trend was repeatable.
The EVOP approach, which is tested in Paper E, is intended to change the parameters of the linear dynamic algorithm. An economical optimum for the time between CSS adjustments is probably between one and two hours. Therefore, a time of 5000 seconds was chosen as the period for which performances were compared, regardless of whether or not a run was continued for a much longer time; runs of less than 5000 seconds were neglected. The reason why 7200 seconds was not chosen, as in Paper D, was that too few of the runs would then be taken into account, and EVOP requires several runs with each configuration in a phase. Note that these several runs were not performed in consecutive order.
The EVOP was run in four phases. The results can be seen in detail in Paper E, Table 1. The most important to note are that in every phase there was a difference of between 20 and 30% between the best and worst runs. After Phase I and II, an increase in performance was observed when moving to a slower speed and a lower speed increase. After Phase III, the direction was the same, but the best performance was the same as the center point. Then, after a change of liners, in Phase IV the speed and speed increase continued to point downwards. The actual speeds with the different algorithms are shown in Figure 30. During an entire liner lifetime, the difference in performance was more than 100 tph, or 50%.
Figure 30. A comparison of the actual speeds in the different phases of the EVOP, the "Ridge" and the FSM.

48
When combining several parameters, it is important to change the parameters in controlled combinations. In this work, the level of two parameters was controlled, however, only one (speed) was actively and continuously variable. It was not possible to control the other (CSS) because of the limitations of the crusher type. The introduction of a model with two variables increased the improvement from 5.3% to 6.9%. Because speed and CSS are two different parameters that affect the crusher differently, the combination of the two is important.
ALGORITHMS An algorithm is an effective method for solving a problem. In this work, two different kinds of algorithms were used. First, the FSM was chosen to optimize one parameter on single crushing stages operated in closed circuit. The reason for selecting an FSM was that it is both possible to configure manually, as in this thesis with appended papers, but also automatically by for instance an evolutionary algorithm (EA), described e.g. by Wahde [47].
While the FSM successfully optimized one parameter at the time, the EVOP, in contrast, could find the correct directions for optimizing the combination of two parameters. The EVOP-algorithm clearly pointed towards lower speeds and smaller speed changes. To understand this, new adaptations of the models were made from data collected during the EVOP tests. The result, as shown in Figure 30, was that all runs were performed at higher speeds than the model optimum. Thus, the correct direction for any algorithm was downwards. The EVOP algorithm successfully gave the direction for the dynamic optimal speed. In comparison with the earlier algorithm, FSM, the EVOP algorithm is less sensitive to noise and more stable. However, it cannot react to short-term variations, e.g. changes in raw-material properties. EVOP is therefore more likely to be suitable for a crusher where the CSS can be kept constant. EVOP can be useful for evaluation and parameter testing when building new models (incorporating new understanding) of the process.
GENERALITY The models used in this thesis (Papers B, C and D) are created with the general knowledge of the process behavior, for instance knowing that a decreased CSS will also decrease the capacity, and that the wear of an HP crusher will decrease its performance. However, the process models do not include a mechanistic model of the crusher. At this stage, the models have been created in order to repeat the most significant behaviors of the process, rather than to include too many parameters and thereby risking difficulties in explaining inconsistencies from data or the risk of fitting noise to the model.
Real-time optimization as implemented here is so general that it can probably be applied to a VSI crusher so that its rotor speed becomes optimal. The speed of the rotor will in turn affect both the reduction and the capacity [42]. Since the crusher, the screen cloths and the feed material also change in this crusher type, a similar situation as with the cone crusher will arise.
In this thesis, a single crushing stage at the time has been optimized. From a plant perspective this is probably a sub-optimization if no other actions are taken. For example, if the demand for material is larger than the possible supply and a real-time optimization algorithm increases the production with X percent, then X percent more material can be sold. But if the plant already produces what it can sell, real-time optimization will instead result in the possibility of the maintenance being planned differently and thus stop hours to be saved. Different parts of the plant can have different goals, but they will affect one another. There is thus a risk for sub-optimization and therefore a general plant optimization which also takes plant economics

49
into consideration is recommended, described e.g. by Svedensten [46]. Also with a real-time perspective there are examples where coordination of the local crushing stages is needed.
Generally, the operators on the test sites were very positive in their feedback. There is always the risk that they might feel watched when introducing more sensors and on-line connections as in some of the tests here. However, the overall feeling was nevertheless positive as the operators felt that someone actually cared about their work.

50

51
10 CONCLUSIONS
The aims of this chapter are to: − Present the most important conclusions drawn in this thesis. − Answer the research questions stated in Chapter 2. − Discuss what has been found important for future work but not researched.
The purpose of this work was to monitor the material mass flows in crushing plants and to tune crusher control parameters to improve process performance. During the course of this work, two generations of monitoring and control systems were designed and implemented. These systems can communicate with sensors and actuators (for crushers), store data, process data, and communicate with users via graphical user interfaces.
Crushing plants can be very different in their layouts, and thus there is a need for a general system that can be adopted to many crushing plants. This work therefore focused on developing a new theory and methods to be used as a toolbox for solving different crushing plant problems.
10.1 GENERAL
The intention of this work was to find methods for the real-time optimization of crushing plants, rather than maximizing the output of a single plant. To be able to truly optimize a crushing plant, several things are required:
• An understanding of the customers and the market situation to know exactly what would be the most beneficial to produce.
• Models of the equipment and the process. • Sensors able to monitor everything important in the process but nothing else. • Computers fast enough and equipped with an algorithm to calculate the perfect
settings in real-time, including all the factors mentioned above. It cannot be stated that everything mentioned above is in perfect order. However, the author does not doubt that that is the direction we are heading. This work does contain some elements of each point above, in particular, models of the process as a basis (Papers B, C and D), but here the models are not too detailed. At this stage, there might be a risk of fitting the models to noise and odd phenomena at singe-crushing plants instead of understanding the models. Optimize a plant in steady state either manually or with one of the software programs mentioned above would be a good start, and adding the time dynamics as a factor in the future will make these simulations even better. However, this does not contradict the practice of adjusting the plant in real-time while depending on un-modeled phenomena. Today, these phenomena are mainly machine wear and raw material properties. In the future, it may be
52
other factors. The FSM algorithm described above can handle unpredictable things on a short time scale (hours), while the EVOP approach, as tested here, is better for optimization when the parameters do not change quickly. Additionally, the EVOP approach can be very good for evaluation and parameter testing when building new models (incorporating new understanding) of the process.
A recommendation from the author is to run a HP type crusher with a frequency converter and an FSM algorithm. For the Hydrocone crushers, the EVOP is probably a good way of continuously trying to find the best combination of speed and CSS.
10.2 ANSWERS TO THE RESEARCH QUESTIONS
Here the answers to the research questions stated in chapter 2.2 are given.
Is it possible to improve the production process by complementing these open-loop systems with feedback from the process and product yield and thereby obtain a closed-loop control system?
Yes, it is definitely possible. These results obtained from testing both algorithms show that using a system in addition to the machine-specific system can control the crushing process with respect to the amount of products produced. In practice, an improvement of 4.2% has been demonstrated on an HP crusher with a frequency converter. On a Hydrocone, a ~3.5% performance increase has been demonstrated on a crusher equipped with an automatic setting regulation system using a closed-loop feedback data input from the process. The control of a crushing process with a varying feed is an unusual control problem as there is not a known setpoint. The absence of a setpoint value can be solved by using an algorithm that continuously improves the process.
In order to control crushers using information about the product yield, it is necessary to monitor the material flows at many different positions in the process. Is there a more cost effective alternative to expensive belt scales?
The algorithm tests and the belt scale tests demonstrate that materials flow monitoring can be performed with sufficient accuracy by measuring the power draw of the conveyor belt. It is possible to accurately monitor materials flows and product yields in the process by measuring the electrical power on inclined conveyor belts. This has been demonstrated by comparing tests conducted with traditional belt scales as well as in two full-scale process control cases. Changes in the process are difficult to observe due to noise, spread, and natural variations. Repeated or continuous measurements with statistical analysis are required to accurately measure changes in the process.
CSS is the most common control parameter for adjusting the product from cone crushers. Is it possible to use other parameters such as eccentric speed for real-time optimization?
The results from the tests investigating the effect of speed control on a cone crusher clearly show that the eccentric speed parameter can be used to control and improve the process. Speed is an important machine parameter that, up to now, has not been used for active control of cone crushers. It has been demonstrated to have a great impact on the efficiency of cone
53
crushers. It can also be used to compensate for both slow changes in the crushing chamber geometry and wear and input material variation and to tune the product particle size distribution.
Is it possible to optimize the process with two real-time adjustable parameters at the same time?
Yes, on an HP crusher, the speed can constantly be used to compensate for the lack of CSS compensation. The results obtained from tests in which both CSS and speed were taken into account show that the total performance space that can be accessed by tuning the parameters is about 20% on an HP crusher. Not all crushers are operated in the worst-case scenario, making roughly half of this increase possible in practice. Typically, a performance increment of 6.9% has been demonstrated.
Is it possible for a real-time algorithm to perform the optimization described above?
Natural stochastic and systematic variations in the crushing process can definitely be taken advantage of and be compensated for in order to improve the production yield in a crushing process. A finite state machine (FSM) has proved to be a successful way of creating an algorithm capable of selecting setpoints for the CSS and the speed, respectively. An algorithm inspired from EVOP can be used for tuning long term optimization with feed-back from the process on a continuous basis.
10.3 FUTURE WORK
Several things have been investigated and put together to achieve real-time optimization in this thesis, and subsequently improvements can be done in several areas:
• The development of improved sensors, e.g. image analysis equipment directly after the crusher, would make it easier to optimize crushers with respect to the products, because more measurement points on the cumulative particle size distribution will be accessible. As an alternative to image analysis, the use of mass-flow meters after screens would be much more applicable if they could be placed on horizontal belts to a reasonable cost.
• To improve the models of the process behavior and have a simulation environment where the algorithms could be improved automatically would probably be fruitful. Especially the FSM algorithm is suitable for such training.
• Real-time optimization for only one crushing stage (a crusher with consecutive screens) has been investigated. A crushing plant often has several consecutive crushing stages. In order to avoid a sub-optimization, the entire plant must be optimized simultaneously. This applies also when the optimization is performed in real-time. To optimize the entire plant also economics, stocks, maintenance and scheduling would be necessary to include.
• The phenomenon with the extended lifetime of the liners in Paper C can have several explanations (less long term changes on crushing chamber, changed wear hardening) and an investigation why this phenomenon occurs would be interesting.

54

55
REFERENCES
[1] Aggregates - Production and resources 2008, in L. Norlin, ed., SGU - Geological Survey of Sweden, Uppsala, 2009.
[2] Algorithm, Wikipedia, 2010. [3] Anatec, 2010. [4] Annual report 2007, UEPG (European aggregates association), 2008. [5] Belt Conveyors for Bulk Materials (5th Ed), Conveyor Equipment Manufacturers
Association, 1997. [6] Nordberg GP Series cone crushers, Metso Minerals, Tampere, 2010, pp. 6. [7] Optische bandwaage, Hartl Sensortechnik GmbH, 2007. [8] SCADA, Wikipedia, 2010. [9] Statistics of the Swedish mining industry 2008, SGU - Geological Survey of Sweden,
Uppsala, 2009. [10] What is Value?, The Institute of Value Management, Leicester, UK, 2010. [11] J. S. Andersen and T. J. Napier-Munn, The influence of liner condition on cone
crusher performance, Minerals Engineering, 3 (1990), pp. 105-116. [12] B. Bergman and B. Klefsjö, Quality from customer needs to customer satisfaction,
Studentlitteratur, Lund, Sweden, 2003. [13] R. A. Bearman, The use of the point load test for the rapid estimation of Mode I
fracture toughness, International Journal of Rock Mechanics and Mining Sciences, 36 (1999), pp. 257-263.
[14] R. A. Bearman and C. A. Briggs, The active use of crushers to control product requirements, Minerals Engineering, 11 (1998), pp. 849-859.
[15] M. Bengtsson, Quality-Driven Production of Aggregates in Crushing Plants, Ph.D. thesis, Chalmers University of Technology, Sweden, Chalmers University of Technology, Göteborg, 2009, pp. 1-67.
[16] T. W. BoBo Jr and M. Taylor, On-line imaging of aggregates for process control, 2005 SME Annual Meeting: Got Mining - Preprints, 2005, pp. 81-88.
[17] G. Box and N. R. Draper, Evolutionary Operation, John Wiley & Sons, New York, NY, 1998.
[18] G. E. P. Box, J. S. Hunter and W. G. Hunter, Statistics for experimenters: design, innovation and discovery, Wiley-Interscience, Hoboken, N.J., 2005.
[19] C. A. Briggs, A Fundamental Model of a Cone Crusher, Ph.D. thesis, University of Queensland, 1997.
[20] C. M. Evertsson, Cone crusher performance, Ph.D. thesis, Chalmers University of Technology, Goteborg, Sweden, 2000, pp. 1-49.
[21] C. M. Evertsson, Output prediction of cone crushers, Minerals Engineering, 11 (1998), pp. 215-231.
[22] G. Gerbert, Maskinelement del B (Machine Elements part II), Maskin- och fordonskonstruktion, Chalmers, Göteborg, 1993.
[23] G. Gerbert, Traction Belt Mechanics, Machine and Vehicle design, Göteborg, 1999. [24] O. Guyot, T. Monredon, D. LaRosa and A. Broussaud, VisioRock, an integrated vision
technology for advanced control of comminution circuits, Minerals Engineering, 17 (2004), pp. 1227-1235.
[25] D. S. Holmes, Model-free optimization in cement plants, IEEE Cement Industry Technical Conference (Paper), Dallas, TX, 2003, pp. 159-173.

56
[26] E. Hulthén, STEM-projekt Energimodul i krossanläggningar (Energy module for crushing plants), MinFo rapport nr P2000-10: 6, In Swedish, 2004, pp. 1-22.
[27] T. Jørgensen, A particle analyser for measuring particle size distribution and shape, on-line or in the laboratory, Nutrient Cycling in Agroecosystems, 28 (1991), pp. 109-114.
[28] V. K. Karra, Process performance model for cone crushers, XIV International mineral processing congress, CIM, Montreal, Que, Canada, Toronto, Canada, 1983, pp. III 6.1 - III 6.14.
[29] C. Klason, Kubàt, J., Plaster - materialval och materialdata, Förlags AB Industrilitteratur, Göteborg, 1995.
[30] E. Lee, Theoretical Optimization of Compressive Crushing, Licentate thesis, Chalmers University of Technology, Sweden, Chalmers University of Technology, Göteborg, 2009, pp. 1-62.
[31] M. Lindqvist, Energy considerations in compressive and impact crushing of rock, Minerals Engineering, 21 (2008), pp. 631-641.
[32] M. Lindqvist, Wear in cone crusher chambers, Ph.D. thesis, Chalmers University of Technology, Sweden, 2005, pp. 1-44.
[33] P. Lindstedt, Burenius, J., The value model. How to master product development and create unrivalled customer value, Value Model ccop. , Stockholm, 2006.
[34] M. A. Martins and L. H. C. Mattoso, Short sisal fiber-reinforced tire rubber composites: Dynamical and mechanical properties, Journal of Applied Polymer Science, 91 (2004), pp. 670-677.
[35] G. H. Mealy, A Method for Synthesizing Sequential Circuits, Bell System Technical Journal, 34 (1955), pp. 1045–1079.
[36] P. Mills, A. Supomo and A. Partanen, Real-time Optimisation of SAG Mills at PT Freeport Indonesia, 2004.
[37] D. Morin, Introduction to classical mechanics : with problems and solutions, Cambridge University Press, Cambridge, UK ;, 2008.
[38] M. Moshgbar, R. A. Bearman and R. Parkin, Optimum control of cone crushers utilizing an adaptive strategy for wear compensation, Minerals Engineering, 8 (1995), pp. 367-376.
[39] M. Moshgbar, R. Parkin and R. A. Bearman, Impact of system tribology on automatic control of cone crushers, Transactions of the Institute of Measurement and Control, 1995, pp. 2-9.
[40] A. L. H. Mular, D. N.; Barratt, D. J., Mineral Processing Plant Design and Control, Society for Mining, Metallurgy, and Exploration, Inc. (SME), Littleton, CO, USA, 2002.
[41] D. Reitemeyer, Doubling the throughput of feldspar processing with load-driven process control, Aufbereitungstechnik, 47 (2006), pp. 10-16.
[42] R. Rychel, Modellierung des Betriebsverhaltens von Rotorschleuderbrechern, Ph.D. thesis, der Technischen Universität Bergakademie Freiberg, 2001.
[43] S. Shepherd and R. Slauson, Selecting and Installing Conveyor Belt Scales, in J. Marinelli, ed., Ask Joe!, Camber Southeast, Inc. , pp. 6/20/2006.
[44] A. Soederholm, Conveyor belt scales - a mechanical dilemma, Bulk Solids Handling, 20 (2000), pp. 534-537.
[45] M. S. Stafhammar, Screening of crushed rock material, Ph.D. thesis, Chalmers University of Technology, Sweden, 2001, pp. 1-40.
[46] P. Svedensten, Crushing Plant Performance, Ph.D. thesis, Chalmers University of Technology, Sweden, Chalmers University of Technology, Göteborg, 2007, pp. 1-82.

57
[47] M. Wahde, An introduction to adaptive algorithms and intelligent machines, Göteborg, 2002.
[48] L. While, L. Barone, P. Hingston, S. Huband, D. Tuppurainen and R. Bearman, A multi-objective evolutionary algorithm approach for crusher optimisation and flowsheet design, Minerals Engineering, 17, pp. 1063-1074.
[49] W. J. Whiten, The Simulation of Crushing Plants with Models Developed using Multiple Spline Regression, Journal of the South African institute of mining and metallurgy (1972), pp. 257-264.

58