Embed Size (px)
Citation preview

Journal of Theoretical and Applied Information Technology
© 2005 - 2009 JATIT. All rights reserved.
www.jatit.org
538
REAL TIME RADAR IMAGING: AN IMPACT ON NAVIGATION IN WIRELESS COMMUNICATION AND ITS
SYSTEMS
1PROF. NIRMALENDU BIKAS SINHA, 2 DR. R. BERA, 3 DR. M. MITRA.
1Assistant Prof., Department of Electronics and Communication Engineering and Electronics and Instrumentation Engineering, C.E.M.K, K.T.P.P.Township,W.B, India-721171.
2 Prof., Department of E.C.E, SMIT, Sikkim,Majitar India - 737132. 3Assistant Prof., Department of E.T.E,BESU, Howrah, W.B, India.
E-mail: [email protected],
ABSTRACT
We are proceeding towards a broadband age both for the communication as well as remote sensing.
Recently, CALM standard has already been formulated by ITU with objectives of collision avoidance between car to car as well as car to roadside communication and safety by utilization of Sensor-friendly vehicle. Millimetre wave radar is mandatory in every car to locate accurate position. Lots of works can be thought of relating to the radar. In radar, a target is characterized by its radar cross section (RCS) function. This paper presents an overview of recent progress of radar for the image detection and characterization of targets. Radar Cross section measurement capability of full scale targets of interest is an utmost requirement for country like INDIA, considering the nature of threat it has from its neighboring countries. The full scale facility helps in identifying the radar signature of various operational configurations of different class of targets present in our country as well as with our neighbors. This will help in fine tuning and judging the survivability/ striking capability of our weapons. The system is tested to find out RCS of a simple as well as complex object and its imaging by hardware and software .The results are very much useful in quantifying the target different parameters. Finally, the paper addresses the current questions regarding the integration of radar in practical wireless systems and standards
. Keywords: Wi-Fi, ITS, Radar cross section (RCS), DSSS (Direct Sequence Spread Spectrum), modelling.
1. INTRODUCTION Scientists and Technologists involved in the development of radar and remote sensing systems all over the world are now trying to involve themselves in saving of manpower in the form of developing a new application of their ideas in ITS. Radar theory has been a vibrant scientific field for the last fifty years [1], [2], [3]. Over the years, radar systems have developed considerably, and contemporary advanced radars use an array of antennas that can synthesize beams and simultaneously scan the whole space [4]. Radar targets generally consist of many small elemental scatterers that are fused by the radar waveform and the processing at the receiver to result in echoes with fluctuating amplitude and phase. The range to, and the orientation of, the target determines the amount of energy reflected from these scatterers, and small changes in range or orientation can result in a large increase or decrease in the amount of
energy reflected from the target [5],[6]. In radar, a target is characterized by its radar cross section (RCS) function [3].A target’s RCS represents the amount of energy reflected from the target toward the receiver as a function of the target aspect with respect to the transmitter/receiver pair.The performance of radar systems is limited by target scintillations [5]. Both experimental measurements and modelling results demonstrate that scintillations of 20 dB or more in the reflected energy can occur by changing the target aspect by as little as one milli-radian. These RCS scintillations/ fluctuations are responsible for signal fading, which can cause large degradations in the radar detection and estimation performances. Therefore, RCS estimation and calibration for the Radar is a very important aspect for the accurate estimation of target information. Through analysis and numerical results, we demonstrate that radar greatly improves detection and estimation performance due to the reduction in target fades.

Journal of Theoretical and Applied Information Technology
© 2005 - 2009 JATIT. All rights reserved.
www.jatit.org
539
1.1. Radar Cross Section (RCS): The range equation of the radar gives the maximum range at which the target may be detected with a given probability. It includes the radar cross section (RCS) of the target, which is nothing but a measure of the proportion of the incident energy scattered back to the radar. Of course, the return energy varies with the transmitted wavelengths, target geometry, orientation and reflectivity. The radar cross section of a target (σ) may be defined as Power reflected towards source/unit solid angle
σ = --------------------------------------------------- Incident power flux / 4π
The RCS of an isotropic reflector is equal to its geometric area projected to the radar. σ is expressed in dBsm i.e. amount of excess power in dB compared to one sq. m of reference object.RCS depends upon frequency, target size, shape of the object, target aspect (i.e. direction of illumination), viewing aspect (i.e. direction of scattering) and the incident and observed polarization. Radar cross section plays an important role in the radar equation given by PR = (PTGT/4πRT
2)(1/LMTLT)(σ/4πR2)(1/LMRLR)(GRλ2/4πLP) Where, GR= gain of the receiving antenna GT= gain of the transmitting antenna RT= distance between transmitter and receiver R = distance between receiver and target LT = loss factor of the transmitting channel LR = loss factor of the receiver channel LMT = material loss factor in the propagating medium due to dissipation between the target and transmitter LMR = material loss factor in the propagating medium due to dissipation between the target and the receiver LP = polarization loss factor due to improper polarization match between transmitter and receiver(if the radar is not monostatic) ,scatter depolarization and effect Faraday rotation if any. Radar cross-section depends on the radar range if observations are made in the near zone of the target, and on time if there is relative motion between the target and the radar. Radar target can be divided into two broad classes (a) Artificial like aircraft and (b) natural like terrain. Depending upon their structural complexity, targets are also classified as simple – sphere, frustum, flat-plate, cylinder or complex- cylinder-flatplate, aircraft, missile, ship etc.
1.2. Conventional Radar Vs Imaging Radar:
With the advancement of technology towards wide-band receivers, fast computational speed, availability of data acquisition system, imaging radar is a possibility today. The user will prefer this imaging radar as it will give a definite image of the target in its PPI indicator. This will enable the personnel at the radar terminal take a more definite decision regarding the target. 2 SIMULATION ON VARIATION OF RCS: 2.1. RCS Dependency on the Aspect Angle: Radar cross-section fluctuates as a function of radar aspect angle. Consider two unities (1 meter sq.) isotropic scatterers are aligned and placed among the radar line of sight (zero aspect angle) at a far field range R as shown in figure1. The spacing between these two is 1 m. The aspect angle is then changed from 0 to 180 degrees and the composite RCS of the two is measured. The composite radar cross-section consists of superposition of the two individual radar cross-sections. When the angle is varied, the RCS is modified by the phase that corresponds to the electrical spacing between the two scatterers. The plot has been reproduced by using the MATLAB. Also a FFT of the plotted data has been added so as to get a feel of the nature of radiation receive. Knowledge of the constructive and destructive interference between the individual scatterers can be very critical when radar is used to extract the RCS of a complex target. This is true because the aspect angle may be continuously changing while detection in actual scenario. Also the complex target RCS may be thought to be made up of individual scattering points distributed on the target surface. ● ● 1m ● .707m ● Figure1, RCS dependency on the aspect angle

Journal of Theoretical and Applied Information Technology
© 2005 - 2009 JATIT. All rights reserved.
www.jatit.org
540
0 20 40 60 80 100 120 140 160 180-40
-35
-30
-25
-20
-15
-10
-5
0
5
10
aspect angle in degrees
RC
S in
dBs
m
Frequency is 8GHz; scatterrer spacing is .25m
Figure 2, Variation of aspect angle with RCS (scat-
spacing =0.25, Frequency=8 GHZ)
0 20 40 60 80 100 120 140 160 180-60
-50
-40
-30
-20
-10
0
10
aspect angle in degrees
RC
S in
dB
sm
Frequency is 8GHz; scatterrer spacing is .3m
Figure 3, Variation of aspect angle with RCS (scat- spacing =0.3, Frequency=8 GHZ)
0 20 40 60 80 100 120 140 160 180-25
-20
-15
-10
-5
0
5
10
aspect angle in degrees
RC
S in
dB
sm
Frequency is 9GHz; scatterrer spacing is .3m
Figure 4, variation of aspect angle with RCS (Scat- spacing =0.3, Frequency=9 GHZ).
2.2 RCS Dependency on Frequency RCS also depends on the frequency. A little frequency change causes serious RCS fluctuations when the scatter spacing is large. Alternatively when the scatter centers are relatively close, it requires more frequency variations to produce significant RCS fluctuations.
8 8.5 9 9.5 10 10.5 11 11.5 12 12.5-50
-40
-30
-20
-10
0
10
Frequency in GHz
RC
S in
dBs
m
Figure 5, Variation of RCS with Frequency
(Scat- spacing =0.3)
2.3 Ambiguity Diagram: The radar ambiguity diagram represents the response of the matched filter to the signal for which it is matched as well as to Doppler frequency shifted (mismatched) signals. It provides an indication of the limitations and utility for particular classes of radar waveforms, and gives the radar designer general guidelines for the selection of suitable waveforms for various applications.
-4-2
02
4
-2-1
0
120
0.2
0.4
0.6
0.8
1
Delay in secondsDoppler in Hz
Am
bigu
ity fu
nctio
n
Figure 6. Radar ambiguity diagram. 3. SIMULATION ON RCS OF DIFFERENT
STANDARD TARGETS: A target’s RCS is most easily visualized as the product of the projected cross section, Reflectivity and Directivity. Reflectivity is the percent of intercepted power reradiated (scattered) by the target. Whereas Directivity is the ratio of the power scattered back in the radar's direction to the power that would have been backscattered had the scattering been uniform in all directions (i.e. isotropically).It is quite interesting to note that RCS doesn’t equal to geometrical area. As we know that physical area for flat plate is wholly depends upon length & breath but, RCS value also depends on wavelength (λ), also in case of sphere it is different from the well-known physical area. Measurements of radar targets can be classified in terms of the relative distance(R) of the target as a function of its cross-range dimension(d), and the illuminating wavelength,(λ). The following Rayleigh criterion is useful for determining the relative range(R) required between a radar and target for far-field conditions to occur, R ≥ 2d2/λ When relative distance between target & radar is less than the dimension of target size is termed as near field & far field is known for range greater than projected dimension of target size. When the

Journal of Theoretical and Applied Information Technology
© 2005 - 2009 JATIT. All rights reserved.
www.jatit.org
541
target is in the near field, the illuminating wave fronts are sufficiently curved that the returns from the individual scatterer which comprise a target recombine with different phase relationships than when the target is in the far field. For low frequency radar in the RF frequency range of 300-3000 MHz, far-field conditions hold and the data required for accurate simulation and analysis should be far-field data. 3.1 Condition for far-field RCS measurement: There are two necessary & sufficient conditions for Far-Field RCS Measurement: i) Wavelength (λ) < < Range (R), and ii) λ < < Target Diameter (d). For minimum dimension projected radius of target (�min): = 10 x λ) / 2π ...... (i) For maximum dimension projected radius of target �max = {√ (MaxRange x λ)}/ 2....... (ii) Roughness (Rh) = λ / 200................... (iii) Table-1: Minimum dimension required for keeping low optics approximation:
Table 2: Target Dimension for Selection of Standard Targets.
λ
cm
r =
3.65λ cm
σ (RCS) (in sq. m) Sphere
(σ = πr2 )
Flat Plate Area > 12 λ2
σ=4πa4/ λ2
Cylinder σ = 2 π r2 h / λ
Square Dihedra
l Length
& Width > 3.5 λ σ=8πa4/
λ2
Square Trihed
ral Length
& Width > 3.5 λ σ=12π a4/λ2
100 363 41.39 2373 3550 65491 98237
60 219 15.06 1069 1465 21394 32092
30 108.1 3.671 2104 314.8 5150.0 7725
20 71.96 1.626 933 139.4 1011.2 1517
15 53.96 0.914 627 78.40 319.50 479
12 43.156 0.585 335 50.17 131 196
10 5.941 0.405 233 34.79 63 94
In above theoretical calculation, assumption has been taken for keeping low error of optical dimension. When the wavelength has comparable dimension as of target dimension then it gets suffered by these regular variations are due to two mechanisms, one a specular reflection from the surface of the sphere and the other a creeping wave that skirts the shadowed side. From the Table 2, it is clear that the radius which we are using for theoretical calculations is between the limit of �MIN and �MAX and to evaluate the RCS, we have calculated the radius or length, width, height for different standard targets. It is interesting to note that at 300 MHz frequency, the radius required for good result (i.e., RCS value) for sphere is 365 cm which is really difficult to construct for performing the experiment. But we can make the corner reflector and flat plate for performing the experiment. As frequency increases, the wavelength gets reduced and hence we can construct the sphere, cylinder for experiment at higher frequency. In this tabulation we have kept the range of target fixed (2 kms) and corresponding to this we have calculated the RCS of various standard scatterers. However, it is difficult to make the standard targets such as sphere and cylinder for lower frequency (i.e, 300 & 500 MHz) but for higher frequency we can construct the scatterers. From the Table 2 it is quite interesting to note that the RCS values of various Scatterers are decreasing exponentially as the radius of the sphere. If scatterers required for sphere is 3.65 m at 300 MHz, 2.19 at 500 MHz, 1.095 at 1 GHz, 0.73m at 1.5
Frequency λ ( cm) �min ( cm)
�max
( cm)
Rh
( cm)
300 MHz 100 159.2 1581 0.4978
500 MHz 60 95.49 1224.5 0.3000
1 GHz 30 47.77 866 0.1498
1.5GHz 20 31.85 707 0.1016
2.0GHz 15 23.89 612.5 0.0736
2.5GHz 12 19.10 547.5 0.0584
3.0GHz 10 15.92 500 0.0102

Journal of Theoretical and Applied Information Technology
© 2005 - 2009 JATIT. All rights reserved.
www.jatit.org
542
GHz, 0.54m at 2GHz and 0.365m for 3GHz respectively. Also cares have been taken for smoothness of the surface. 3. 2. RCS of Simple Targets: The RCS of simple targets can be calculated from EM theory. Often a complex object can be subdivided into small scattering centers having different fundamental shapes like cylinder, sphere, flat plate etc. So to implement RCS computation of a complex object we start with a MATLAB simulator of some fundamental single shapes. In the simulator program, we successively place a sphere, a cylinder, an ellipsoid, and a frustum of different dimensions in front of X band radar and compute the RCS value in each case. In this case a fixed frequency of 10 GHz is used and objects are rotated from 0-180 degrees in 500 angle increments. 3.1 RCS of a Sphere: The scattering properties of a sphere illustrate the nature of RCS’s dependence on wavelength (or frequency). It has been found that for RCS, there are three distinct regions of behavior for a sphere of radius r: 1) The Raleigh Region: In this region, 2πr/λ <1 and the RCS is proportional to λ-4 2) The Mie Region: Here 2πr/λ=1 and the RCS oscillates 3) Optical Region: In this region λ is very small compared to the dimensions of the sphere and fluctuation in Mie region converges to a constant optical cross-section Πr2 for all shorter wavelengths. The Raleigh Region: The radar targets usually don’t fall into the Raleigh region except particles like precipitation. It has been found that for most bodies of revolution, the RCS along the axis of symmetry is given by: σ = (4/π) k4v2F2, where k= 2π/λ v = volume of the scatterers F= dimension loss factor which depends on the gross shape of the body. The above approach is less accurate if the scatterer becomes more flat since a flat surface has zero volume but a non zero cross-section. The Mie Region: In between Raleigh region and optical region, there is a region where the body geometry is a critical factor. For this, no simple computation of RCS is possible. The Optical Region:
In this region, most of the targets are found. The RCS is estimated to be given by σ= R1R2 Where, R1 and R2 are the principle radius of curvature at the surface normal. The RCS behavior is monotonic in this region. In a Raleigh region, we have radar cross-section (σ) = 0.1 π r2 =1/10 x projection of sphere. In Mie or resonance region, σ = 4πr2 = 4 x projection of sphere. Features in Raleigh, Mie and Optical Regions: We have in Raleigh region for (Circumference/Wavelength) = 2π/λ= 1/3, Radar cross section σ = 0.1πr2 = 1/10 x projection of sphere. For, 2πa/λ = 0.7 In Mie or resonance region, RCS is maximum for circumference wavelength 2πa/λ = 1 for which σ = 4πr2 =4 x projection of sphere.RCS of metallic sphere of radius r in the optical region for Circumference/Wavelength) = 2π/λ =10 is given by σ = πr2 projection of sphere which is valid for 2π/λ >= 10. To implement RCS of sphere we consider normalized exact back scattered RCS for a perfectly conducting sphere in Mie series is given by σ/ πr2 =(j/kr) Σ(-1)n(2n+1)[KrJn-1(kr)-nJn(kr)/KrHn-
1(1)(kr)-nHn
(1)(kr)-Jn(kr)/Hn(1)(kr)] .....(iv)
Where r is the radius of the sphere, K=wavelength in Jn is the spherical Bessel of the first kind of order n & Hn (1) is the Hankel function of order n & given by Hn (1) (kr) =Jn (kr) +jYn (kr) Yn is the spherical Bessel function of the second kind of order of n. In figure 7 three regions are identified first is Raleigh region (small sphere), in this σ =9πr2 (Kr) ^4 r<< λ Second is the Mie region. In this region are oscillatory in nature. Third is optical region (large sphere). In this case σ = πr2 r>>λ The back scattered RCS for a perfectly conducting sphere is constant in the optical region. For this region Radar designer typically use spheres of known cross section to experimentally calibrate radar system.

Journal of Theoretical and Applied Information Technology
© 2005 - 2009 JATIT. All rights reserved.
www.jatit.org
543
0 5 10 150
0.2
0.4
0.6
0.8
1
1.2
1.4
1.6
1.8
2
[2X3.14X r]/wavelength
RC
S/[3
.14
x(r)2
]OPTICALMIERAYLEIGH
Figure 7, Variation of sphere 2Πr/λ with σ/Πr2 3.2 Implementation RCS of Ellipsoid: To implement RCS of ellipsoid we consider the general equation of the ellipsoid (x/a) 2 + (y/b) 2 + (z/c) 2 = 1 ............ (v) One widely accepted approximation for the ellipsoid back scattered RCS is given by σ = πa2b2c2/(a2(sin2θ)(cos2φ)+b2(sin2θ)*(sin2φ)+c2(cos2θ))2 …...........................................(vi) When a=b the ellipsoid becomes roll symmetric. The ellipsoid is independent of φ. The eqn. (vi) reduces to σ= πa2b4c2 / (a2 (sin2θ) +c2 (cos2θ)) 2 ....... (vii) and for the case when a=b=c, σ= πc2…. (viii) Eqn (viii) defines the back scattered RCS of a sphere. This should be expected under the condition a=b=c. The ellipsoid becomes a sphere.
Figure8, Variation of aspect angle with RCS for ellipsoid.
3.3. Implementation RCS of Cylinder:
Figure9, Variation of aspect angle with RCS for circular cylinder.
Figure10, Variation of aspect angle with RCS for Elliptic cylinder. 3.4. RCS for Corner Reflector: It's a structure that is used as a radar target, often in calibrating test equipment such as in an anechoic chamber. Corer reflectors are used for many reasons, because they have very high radar-cross-section (RSC) for a small size, the high RCS is maintained over a wide incidence angle and an exact solution is known for their RCS. Corner reflectors are easy to make from sheet metal such as aluminum, but care must be used to be sure that the surfaces join at exactly at 90 degrees. There are two main types of corner reflector: Dihedral and Trihedral. The dihedral has two surfaces that are on orthogonal planes, the trihedral has three.
Journal of Theoretical and Applied Information Technology
© 2005 - 2009 JATIT. All rights reserved.
www.jatit.org
544
Here the equations for maximum cross-section of both types of corner reflector, along their principal axes: 3.4.1. Dihedral Corner Reflector: σ =8Πa2b2/λ2, Where a and b is the length and width of the flat plate. 3.4.2. Trihedral Corner Reflector: σ =12Πa4/λ2, where, a is the side of square face. Note that for the trihedral case, the formula is accurate for reflectors with square sides. If we cut them into triangles or arcs (like the photo at the top of the page), the constant "12" will be reduced. 3.5. RCS for Truncated cone (Frustum):
0 20 40 60 80 100 120 140 160 180-60
-50
-40
-30
-20
-10
0
aspect-angle(degrees)
RC
S(d
bsm
)
Figure 11, Back scattered RCS for frustum (λ=.861m)
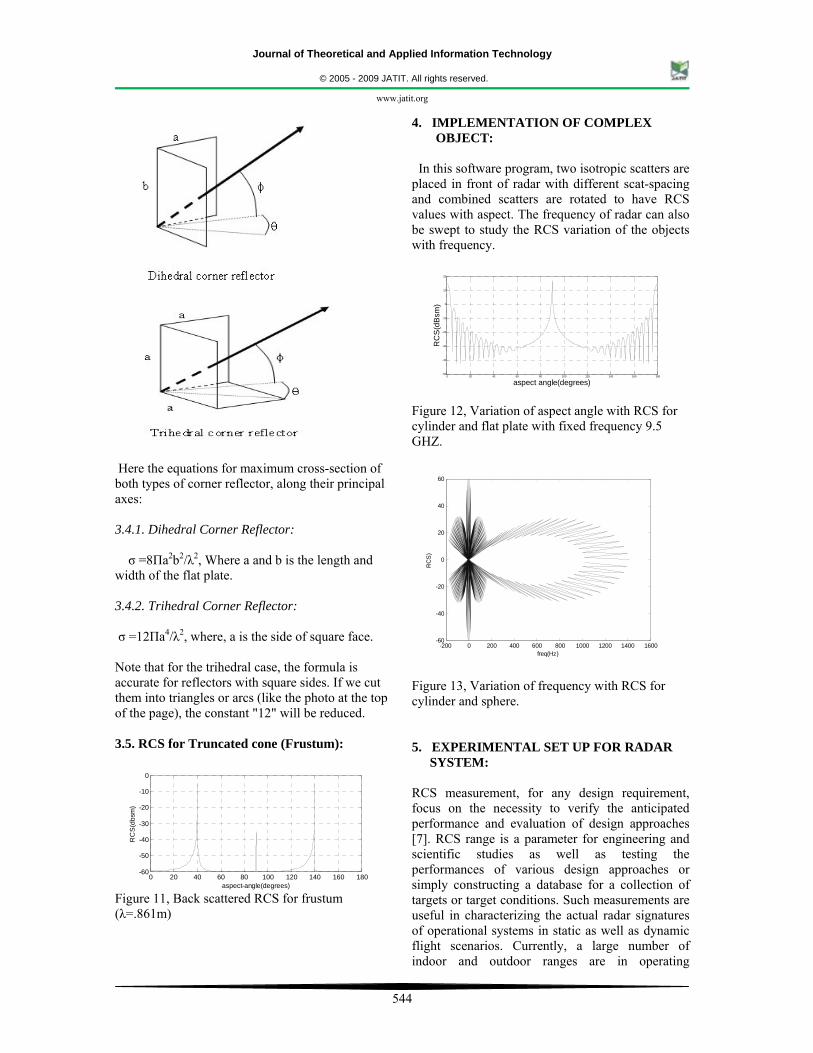
4. IMPLEMENTATION OF COMPLEX OBJECT:
In this software program, two isotropic scatters are placed in front of radar with different scat-spacing and combined scatters are rotated to have RCS values with aspect. The frequency of radar can also be swept to study the RCS variation of the objects with frequency.
0 20 40 60 80 100 120 140 160 180-50
-40
-30
-20
-10
0
10
20
aspect angle(degrees)
RC
S(d
Bsm
)
Figure 12, Variation of aspect angle with RCS for cylinder and flat plate with fixed frequency 9.5 GHZ.
-200 0 200 400 600 800 1000 1200 1400 1600-60
-40
-20
0
20
40
60
freq(Hz)
RC
S)
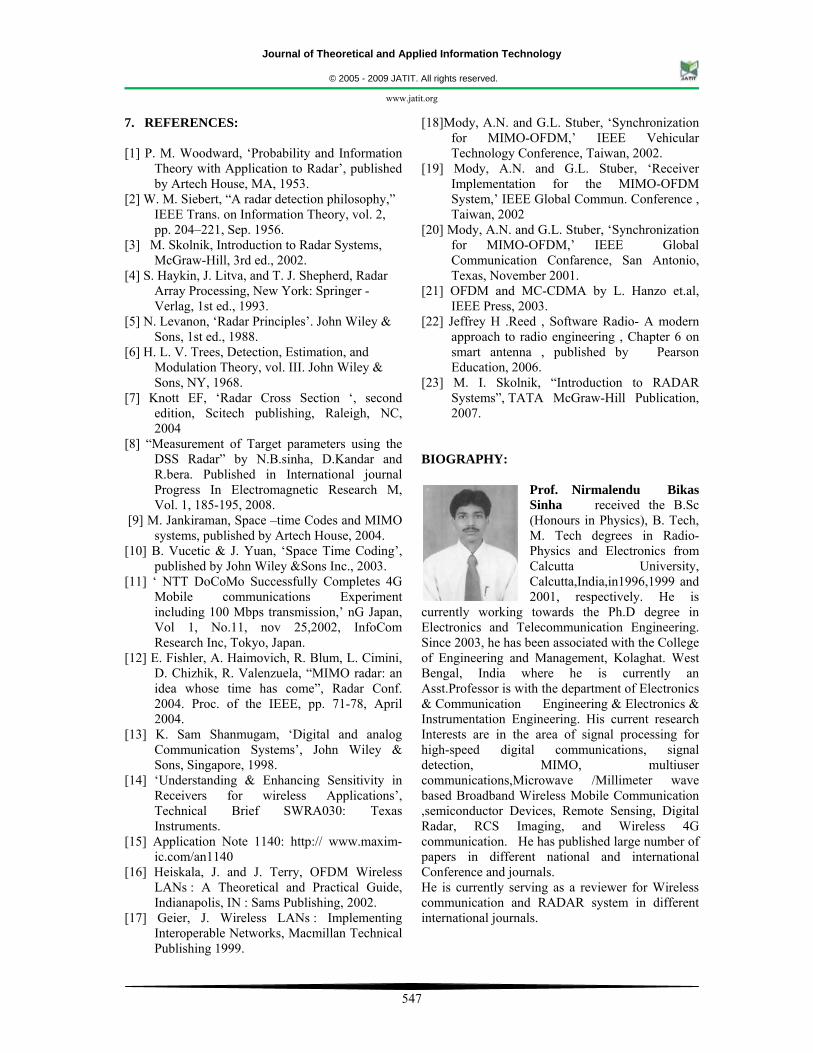
Figure 13, Variation of frequency with RCS for cylinder and sphere. 5. EXPERIMENTAL SET UP FOR RADAR
SYSTEM: RCS measurement, for any design requirement, focus on the necessity to verify the anticipated performance and evaluation of design approaches [7]. RCS range is a parameter for engineering and scientific studies as well as testing the performances of various design approaches or simply constructing a database for a collection of targets or target conditions. Such measurements are useful in characterizing the actual radar signatures of operational systems in static as well as dynamic flight scenarios. Currently, a large number of indoor and outdoor ranges are in operating

Journal of Theoretical and Applied Information Technology
© 2005 - 2009 JATIT. All rights reserved.
www.jatit.org
545
throughout the world in different size and measurement methodologies. Outdoor range are described as static with the target supported on low RCS pylon or column and dynamic with the target moving (e.g. Flying) through the field of view of the range instrumentation. The attraction of outdoor ranges for RCS measurements is that they can be designed to measure larger targets over wide frequency ranges. The drawback of an outdoor range is that it is difficult to conduct measurements in a secure environment. The quality and complexity of test range instrumentation vary considerably from one installation to another. Generally, a Pulse Doppler Radar is configured with an ISAR technique to process images for RCS measurements. The transmitter generate the RF signal to be radiated and the receiver detects the echo signals and coverts them to other signals that can be recorded as a permanent record. The signal out of the transmitter is a train of rectangular pulses of modulated at RF frequency. The generation of each pulse is controlled by a system timer that delivers a trigger signal to the transmitter at uniform time intervals. The timer also supplies that receiver with a delayed pulse command that alerts the receiver to the arrival of an echo pulse. This methodology needs to be designed carefully for optimum power utilization, rang resolution, etc.
The radar range is an important parameter which depends mainly on transmitter power output, receiver sensitivity and target RCS. For a given target RCS and receiver sensitivity, the range decides the transmitter power output based on operating wavelengths. Every kilometer distance amounts to 30dB in link budget. Therefore, optimum selection of the parameters is very essential.The purpose of the pulsed waveform is to exclude as much as possible all signals except those reflected by the target, otherwise the receiver would respond continuously to all echo returns in addition to the target echo. The receiver sensitizing command is a pulse called the range gate and it must lag the transmitter trigger by approximately the time it takes a signal to propagate out to the target and back to the receiver. This delay obviously depends on the range to the target. To minimize background echoes from all other sources except the test target, the range gate pulse should be as narrow as possible, but not so narrow that it excludes the echo from some parts of the target. The maximizing of receiver sensitivity on the other hand demands the use of long pulses. Therefore the overall system design is essentially a reconciliation of design conflicts. Recognizing that no signal
pulse width may serve all users or all test conditions, the designers of some instrumentation systems allow the radar operator to make the optimization decision by providing the option to select the pulse with or system bandwidth. Common options are pulse widths of 30.100 and 300ns.
To achieve the benefits of narrow as well as wider pulses and to avoid multi-path signals, spread spectrum based radar instrumentation is adopted. The system is configured in such a way that the transmitter power output is optimized with improved receiver sensitivity and selection of operating wavelengths. This new technology of RCS measurements is challenging and opens avenues for futuristic technology trends. Before highlighting the instrumentation, a brief introduction of spread spectrum technique is discussed in the following section.
Figure 14, Block diagram of Experimental setup for RCS measurement. A RADAR system for RCS measurement is fabricated in the laboratory, a pseudo random sequence is modulated with an RF signal and transmitted. The transmitted as well as the received signal are compared on CRO.
Figure 15, Experimental Setup for RCS measurement.
CRO
TX
RX
BALANCE MIXER
RF GENERATOR CLK
Spread spectrum Generator
Attn

Journal of Theoretical and Applied Information Technology
© 2005 - 2009 JATIT. All rights reserved.
www.jatit.org
546
Figure 16, view of the set up from Tx/Rx Side. The set up consists of a sequence generator RF generator, clock , double balance mixer and two 15dB standard gain horn antennas as shown in fig.15 & fig 16.
Figure 17, setting on RCS sequence generator used for generating PN sequence Figure. 17 shows the sequence generator is set with a feedback pattern and preset condition at 6 MHz clock for maximal sequence. The output of the sequence generator is BPSK modulator with the help of double balanced mixer at 2.5 GHz RF frequency. In order to maintain the input signal levels to protect the mixer a 10dB attenuator is placed between sequence generator and the mixer.
Figure18, Tx & Rx waveforms on CRO.
Figure 19, Delay depicted on CRO Figure18 & 19 exhibit the returns with and without the target. The transmitted signal is also displayed to compare the signals. Fig 19 highlights the delay between Tx signal and Rx signal. This delay is due to the propagation delay between the Tx and Rx antennas.
Figure 20, Measured Beam pattern of 1 ft 2 Flat Plate 6. CONCLUSION The concept of RCS measurement for different standard target is developed at laboratory using DSSS RADAR and the results are found to be encouraging. In hardware experiment a pseudo random sequence is generated. BPSK signals could be modulated and demodulated using Pseudo random sequence. Target returns from Sphere and Flat Plate and an available copper cladded PCB laminate are observed with the BPSK modulated signal. The simulation results for different standard targets and the hardware experiment results are supporting each other to calibrate the RCS values of unknown objects. The concepts are supported with Simulations for different standard targets. The same was repeated with commercially available Wi-Fi B adapter [8].
Journal of Theoretical and Applied Information Technology
© 2005 - 2009 JATIT. All rights reserved.
www.jatit.org
547
7. REFERENCES: [1] P. M. Woodward, ‘Probability and Information
Theory with Application to Radar’, published by Artech House, MA, 1953.
[2] W. M. Siebert, “A radar detection philosophy,” IEEE Trans. on Information Theory, vol. 2, pp. 204–221, Sep. 1956.
[3] M. Skolnik, Introduction to Radar Systems, McGraw-Hill, 3rd ed., 2002.
[4] S. Haykin, J. Litva, and T. J. Shepherd, Radar Array Processing, New York: Springer - Verlag, 1st ed., 1993.
[5] N. Levanon, ‘Radar Principles’. John Wiley & Sons, 1st ed., 1988.
[6] H. L. V. Trees, Detection, Estimation, and Modulation Theory, vol. III. John Wiley & Sons, NY, 1968.
[7] Knott EF, ‘Radar Cross Section ‘, second edition, Scitech publishing, Raleigh, NC, 2004
[8] “Measurement of Target parameters using the DSS Radar” by N.B.sinha, D.Kandar and R.bera. Published in International journal Progress In Electromagnetic Research M, Vol. 1, 185-195, 2008.
[9] M. Jankiraman, Space –time Codes and MIMO systems, published by Artech House, 2004.
[10] B. Vucetic & J. Yuan, ‘Space Time Coding’, published by John Wiley &Sons Inc., 2003.
[11] ‘ NTT DoCoMo Successfully Completes 4G Mobile communications Experiment including 100 Mbps transmission,’ nG Japan, Vol 1, No.11, nov 25,2002, InfoCom Research Inc, Tokyo, Japan.
[12] E. Fishler, A. Haimovich, R. Blum, L. Cimini, D. Chizhik, R. Valenzuela, “MIMO radar: an idea whose time has come”, Radar Conf. 2004. Proc. of the IEEE, pp. 71-78, April 2004.
[13] K. Sam Shanmugam, ‘Digital and analog Communication Systems’, John Wiley & Sons, Singapore, 1998.
[14] ‘Understanding & Enhancing Sensitivity in Receivers for wireless Applications’, Technical Brief SWRA030: Texas Instruments.
[15] Application Note 1140: http:// www.maxim-ic.com/an1140
[16] Heiskala, J. and J. Terry, OFDM Wireless LANs : A Theoretical and Practical Guide, Indianapolis, IN : Sams Publishing, 2002.
[17] Geier, J. Wireless LANs : Implementing Interoperable Networks, Macmillan Technical Publishing 1999.
[18]Mody, A.N. and G.L. Stuber, ‘Synchronization for MIMO-OFDM,’ IEEE Vehicular Technology Conference, Taiwan, 2002.
[19] Mody, A.N. and G.L. Stuber, ‘Receiver Implementation for the MIMO-OFDM System,’ IEEE Global Commun. Conference , Taiwan, 2002
[20] Mody, A.N. and G.L. Stuber, ‘Synchronization for MIMO-OFDM,’ IEEE Global Communication Confarence, San Antonio, Texas, November 2001.
[21] OFDM and MC-CDMA by L. Hanzo et.al, IEEE Press, 2003.
[22] Jeffrey H .Reed , Software Radio- A modern approach to radio engineering , Chapter 6 on smart antenna , published by Pearson Education, 2006.
[23] M. I. Skolnik, “Introduction to RADAR Systems”, TATA McGraw-Hill Publication, 2007.
BIOGRAPHY:
Prof. Nirmalendu Bikas Sinha received the B.Sc (Honours in Physics), B. Tech, M. Tech degrees in Radio-Physics and Electronics from Calcutta University, Calcutta,India,in1996,1999 and 2001, respectively. He is
currently working towards the Ph.D degree in Electronics and Telecommunication Engineering. Since 2003, he has been associated with the College of Engineering and Management, Kolaghat. West Bengal, India where he is currently an Asst.Professor is with the department of Electronics & Communication Engineering & Electronics & Instrumentation Engineering. His current research Interests are in the area of signal processing for high-speed digital communications, signal detection, MIMO, multiuser communications,Microwave /Millimeter wave based Broadband Wireless Mobile Communication ,semiconductor Devices, Remote Sensing, Digital Radar, RCS Imaging, and Wireless 4G communication. He has published large number of papers in different national and international Conference and journals. He is currently serving as a reviewer for Wireless communication and RADAR system in different international journals.

Journal of Theoretical and Applied Information Technology
© 2005 - 2009 JATIT. All rights reserved.
www.jatit.org
548
Dr. Rabindranath Bera is a professor and Dean (R&D), HOD in Sikkim Manipal University and Ex-reader of Calcutta University, India. B.Tech, M.Tech and Ph.D.degrees from Institute of Radio-Physics and Electronics,
Calcutta University. Field of Interests are in the area of Digital Radar, RCS Imaging, Wireless 4G Communication, Radiometric remote sensing. He has published large number of papers in different national and international Conference and journals.
Dr. Monojit Mitra is an Assistant Professor in the Department of Electronics & Telecommunication Engineering of Bengal Engineering & Science University, Shibpur. He obtained
his B.Tech, M.Tech & Ph. D .degrees from Calcutta University. His research areas are in the field of Microwave & Microelectronics, especially in the fabrication of high frequency solid state devices like IMPATT. He has published large number of papers in different national and international journals. He has handled sponsored research projects of DOE and DRDO. He is a member of IETE (I) and Institution of Engineers (I).