Embed Size (px)
Citation preview

© 2013 SteelConsult International Page www.steelconsult.com
1
Realities of Survival for
European Steel – Is there a
future for Steel in Europe?
23 May 2013, London (UK)
Platts 9th Steel Markets Europe Conference 2013
© 2013 SteelConsult International Page www.steelconsult.com
2
• The information included in this presentation is supplied as an information source only and on the specific understanding that while
SteelConsult International has made every reasonable effort to compile any information with care and diligence, SteelConsult makes no
statements, representations nor guarantees about the accuracy or completeness of the information or any part of it and that no-one
should seek to rely on the report or any part of it for any purpose.
• SteelConsult International cannot accept and disclaims all responsibility and all liability (including, and without limitation, liability in
negligence) for any costs, damages, expenses or losses incurred from any reference to the report by any party, howsoever arising.
Realities of Survival for European Steel
Disclaimer

© 2013 SteelConsult International Page www.steelconsult.com
3
Realities of Survival for European Steel
About SteelConsult International
Services Product Areas Why SteelConsult?
• Strategic Consulting • Steelmaking Raw Materials • Specialised in Iron & Steel
• Market Research • Semis • Expertise & experience
• Economics Analysis • Flat Products • Background in industry
• Customer Satisfaction Surveys • Long Products • Wide contact network
• We know the steel industry
• We know the market
• Extensive databases
• Strong network of senior consultants,
with a background in the industry

© 2013 SteelConsult International Page www.steelconsult.com
4
Realities of Survival for European Steel – Contents
Contents
• Realities for EU steel
• Short term outlook
• Long term challenges:
• Imports
• Offshoring
• CO2 emissions costs
• Conclusions

© 2013 SteelConsult International Page www.steelconsult.com
The global steel industry has done well over the last 10 years, especially compared to the automotive sector. Profitability has fallen sharply in 2012, though remains significantly higher than before the China boom
5
Source: SteelConsult International
0
500
1000
1500
2000
2500
3000
3500
'99 '00 '01 '02 '03 '04 '05 '06 '07 '08 '09 '10 '11 '12
Global Steel Earnings
Automotive Earnings
Iron Ore Earnings
EBITDA (Index (US$, 2000=100))
2 8
3 6
2 2
2 9
4 2
8 4
9 1
9 8
118
14 0
4 5
8 78 3
6 1
2 3 3 3 4 6
1418
2 2
4 2
2 5
6 6
9 0
6 0
0
20
40
60
80
100
120
140
160
'99 '00 '01 '02 '03 '04 '05 '06 '07 '08 '09 '10 '11 '12
Global Steel Earnings (Top-70)
Iron Ore Earnings (Top-9)
EBITDA (bln US$)
Top-70 publicly listed mills
(65% of global steel output)
Top-9 publicly listed iron
ore mining companies
(45% of global iron ore
output, 75% of seaborne
trade)
Top-12 Automotive OEMs
(90% of global car output)
Realities of Survival for European Steel – Realities
2,068
170
129

© 2013 SteelConsult International Page www.steelconsult.com
Realities of Survival for European Steel – Realities
However, EU steel mills have been hit hard since 2008, with profitability down by 80% in 2012 from the pre-crisis peak reached in 2008
Source: SteelConsult International
EBITDA main listed steel companies Europe (bn €)
4
7
4 4
6
12
13
16
18 18
2
7
3
8
0
2
4
6
8
10
12
14
16
18
20
'99 '00 '01 '02 '03 '04 '05 '06 '07 '08 '09 '10 '11 '12
6
0
20
40
60
80
100
120
'99 '00 '01 '02 '03 '04 '05 '06 '07 '08 '09 '10 '11 '12
Global Steel EU Steel
EBITDA (Index (US$, 2008=100))
2008 pre-crisis peak
© 2013 SteelConsult International Page www.steelconsult.com
7
Source: SteelConsult analysis
Notes: *YTD **Incl. net energy credit
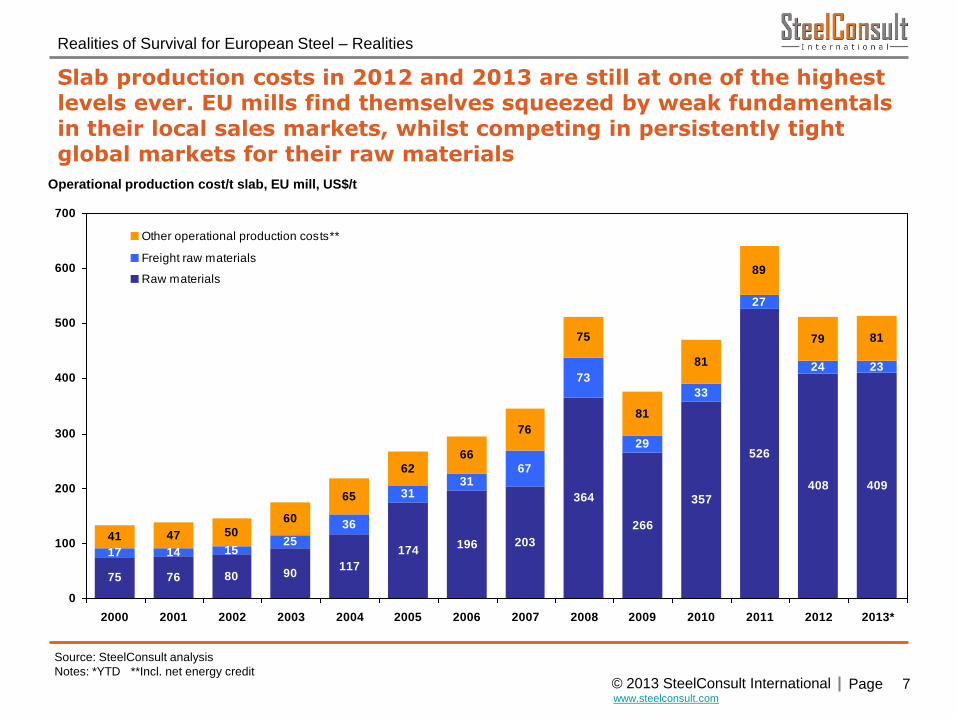
Operational production cost/t slab, EU mill, US$/t
75 76 80 90117
174196 203
364
266
357
526
408 409
17 15
36
3131
67
73
29
33
27
24 23
41 47 5060
65
6266
76
75
81
81
89
79 81
2514
0
100
200
300
400
500
600
700
2000 2001 2002 2003 2004 2005 2006 2007 2008 2009 2010 2011 2012 2013*
Other operational production costs**
Freight raw materials
Raw materials
Realities of Survival for European Steel – Realities
Slab production costs in 2012 and 2013 are still at one of the highest levels ever. EU mills find themselves squeezed by weak fundamentals in their local sales markets, whilst competing in persistently tight global markets for their raw materials

© 2013 SteelConsult International Page www.steelconsult.com
8
0
50
100
150
200
250
'67'68'69'70'71'72'73'74'75'76'77'78'79'80'81'82'83'84'85'86'87'88'89'90'91'92'93'94'95'96'97'98'99'00'01'02'03'04'05'06'07'08'09'10'11'12'13'14'15'16'17'18'19'20
Europe (excl. Turkey)
Source: WSA, SteelConsult
Realities of Survival for European Steel – Realities
The EU steel market is mature and declines by 0.3% per year on average over the long term. The 2007/2008 peak was an exceptional level that was last reached 30 years before. Today’s market can be considered a sustainable level in line with the long term trend
Finished steel consumption (mln tonnes)

© 2013 SteelConsult International Page www.steelconsult.com
9
Data: WSA, SteelConsult
Steel output by country/region (mln tonnes)
Realities of Survival for European Steel – Realities
Steel production is moving from the Atlantic region to Asia, which in 2012 produced 66% of global output, compared to only 11% in 1960
37%28%
11%
48%
14%
14%
20%
7%
5%
7%
2%12%
4%
37%
4%
47%
3%1%
0%
20%
40%
60%
80%
100%
120%
1900 1960 2012 2020
Americas Europe CIS Japan
China Other Asia ROW
Europe
Asia
?
Source: Hatch Consulting

© 2013 SteelConsult International Page www.steelconsult.com
10
Realities of Survival for European Steel – Realities
Also on an individual level, EU steel is loosing scale and influence. 25 years ago the global Top-10 steel mills counted 4 European players, today the Top-10 includes 1 global player and 9 Asian mills
Source: WSA, SBB, SteelConsult
11
12
12
12
12
13
14
15
18
28
0 20 40 60 80 100
Sumitomo
Bethlehem Steel
ILVA
Thyssen
NKK
POSCO
US Steel
British Steel
Usinor
Nippon Steel
Crude steel output Top-10 mills, 1988 (mln tonnes)
1988
31
31
36
40
45
69
46
43
32
94
0 20 40 60 80 100
JFE
Shougang Group
Shagang Group
Wuhan Group
POSCO
Baosteel Group
Angang Group
Nippon Steel & Sumitomo
Hebei Group
ArcelorMittal
2012
Crude steel output Top-10 mills, 2012 (mln tonnes)

© 2013 SteelConsult International Page www.steelconsult.com
11
Realities of Survival for European Steel – Realities
Europe is indeed the worst performer with regard to market growth...
-1%
1%
4%4% 5%
5%7%
8%
15%
-1%
7%
-4%
-2%
0%
2%
4%
6%
8%
10%
12%
14%
16%
Europe North
America
East Asia
(excl.
China)
Other
World
Latin
America
CIS Global MENA Turkey India China
Finished steel consumption growth, CAGR 2000-2012
Source: WSA, SteelConsult

© 2013 SteelConsult International Page www.steelconsult.com
12
Realities of Survival for European Steel – Realities
Slow growth notwithstanding, the EU is still a major steel market in tonnage terms, about the same as USA + Japan, and larger than the fast growing “BRI” markets (Brazil, Russia and India) combined
131
47 56
202
646
7329 20
146
63
0
100
200
300
400
500
600
700
North
America
Latin
America
Europe CIS East Asia
(excl.
China)
China India Turkey MENA Other
World
Source: WSA, SteelConsult
Finished steel consumption, 2012, m tonnes
© 2013 SteelConsult International Page www.steelconsult.com
13
Realities of Survival for European Steel – Contents
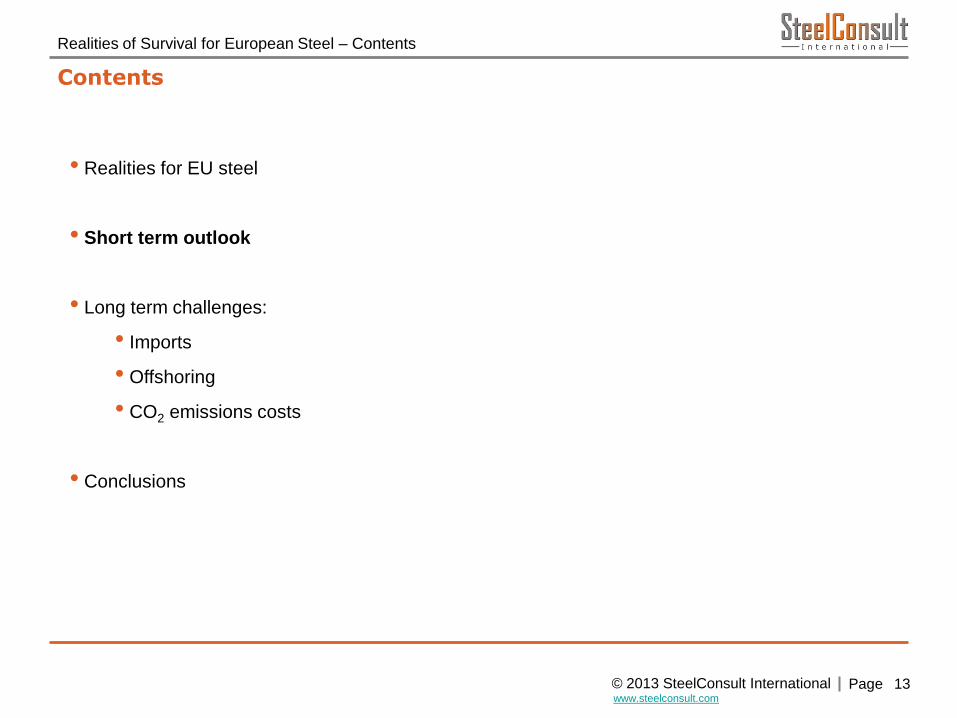
Contents
• Realities for EU steel
• Short term outlook
• Long term challenges:
• Imports
• Offshoring
• CO2 emissions costs
• Conclusions

© 2013 SteelConsult International Page www.steelconsult.com
0
20
40
60
80
100
120
140
160
J F M A M J J A S O N D J F M A M J J A S O N D J F M A M J J A S O N D J F M A M J J A S O N D J F M A M J J A S O N D J F M A
0
20
40
60
80
100
120
140
160
China
EU
World
14
Realities of Survival for European Steel – Short term outlook
Whilst Chinese steel output has continued to rise firmly post-2008, EU mills are producing at 75% utilization. This roughly suggests 25% overcapacity in Europe, though real overcapacity is significantly lower
Crude steel output, index (May 2008 = 100)
Source: WSA, SteelConsult
2008 2009 2010 2011 2012 2013
© 2013 SteelConsult International Page www.steelconsult.com
15
3.3% 3.4%
2.6%
-2.3%
0.4%
4.7% 4.8%
13.7%
1.2%
3.6%
-2.7%
-1.0%
-2.7%
2.6%
0.7%
10.0%
2.2%
2.9%
-1.5%
0.0%
3.0%3.5%
4.0%
10.3%
3.2% 3.3%
0.9%
3.1%3.5% 3.6%
6.7%
9.6%
-4%
-2%
0%
2%
4%
6%
8%
10%
12%
14%
16%
Global USA Eurozone Japan Brazil Russia India China
2011 2012 2013f 2014f
Source: EIU, SteelConsult
BRIC countries Global
Industrial Production growth (%)
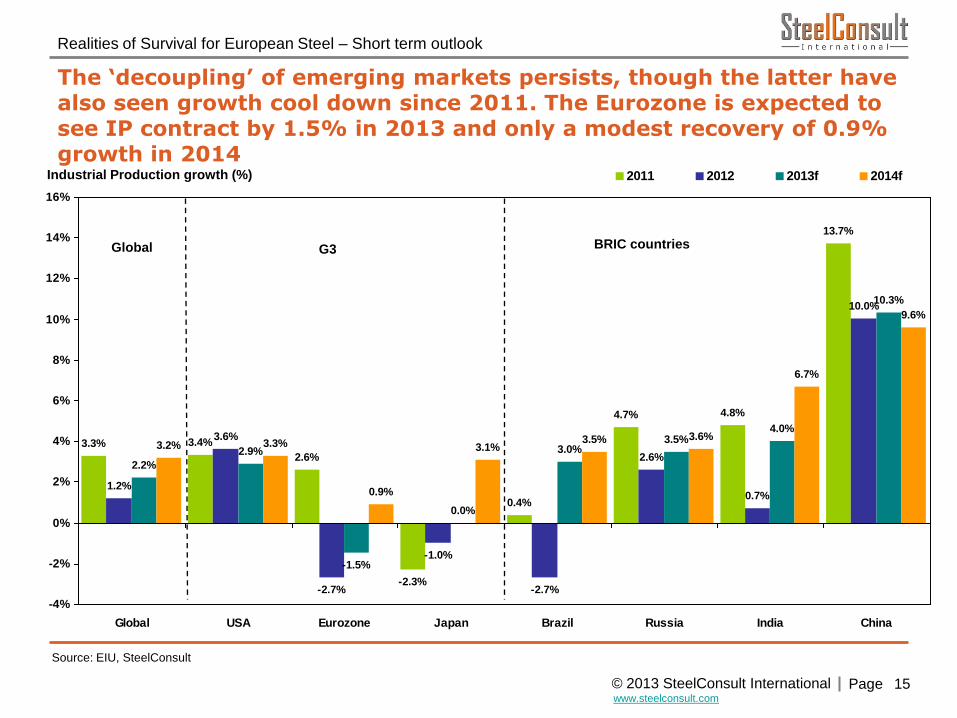
Realities of Survival for European Steel – Short term outlook
The ‘decoupling’ of emerging markets persists, though the latter have also seen growth cool down since 2011. The Eurozone is expected to see IP contract by 1.5% in 2013 and only a modest recovery of 0.9% growth in 2014
G3

© 2013 SteelConsult International Page www.steelconsult.com
16
Source: Eurostat
Realities of Survival for European Steel – Short term outlook
The EU-27 manufacturing sector shows signs of stabilization, but the construction sector, the largest steel end-use sector, is still dropping sharply
Leading economic indicators EU (Index 2010=100)
80
85
90
95
100
105
110
115
120
125
J F M A M J J A S O N D J F M A M J J A S O N D J F M A M J J A S O N D J F M A M J J A S O N D J F M A M J J A S O N D J F M A M J J A S O N D J F M
Industrial production manufacturing EU-27
Construction production EU-27
2007 2008 2009 2010 2011 2012 2013

© 2013 SteelConsult International Page www.steelconsult.com
17
Source: ACEA, SteelConsult
Realities of Survival for European Steel – Short term outlook
Adding to weakness in construction, the automotive sector in the EU is neither showing any firm signs of recovery as yet, though April sales data marked the first positive YoY growth since September 2011
Car output and sales EU-27 ('000 units)
0
1,000
2,000
3,000
4,000
5,000
6,000
Q1 Q2 Q3 Q4 Q1 Q2 Q3 Q4 Q1 Q2 Q3 Q4 Q1 Q2 Q3 Q4 Q1 Q2 Q3 Q4 Q1 Q2 Q3 Q4 Q1
Car output EU-27
Car registrations EU-27
2007 2008 2009 2010 2011 2012 2013

© 2013 SteelConsult International Page www.steelconsult.com
18
Source: Eurostat
Note: Data is seasonally adjusted
Realities of Survival for European Steel – Short term outlook
Looking forward, new building permits are also down in the EU, but, typically, the average for the EU-27 hides large differences in performance between Northern Europe and the South
Leading economic indicators - forward looking
0
20
40
60
80
100
120
140
160
J F M A M J J A S O N D J F M A M J J A S O N D J F M A M J J A S O N D J F M A M J J A S O N D J F M A M J J A S O N D J F M A M J J A S O N D J F M
Building permits Germany (Jan. 2007=100)
Building permits Spain (Jan. 2007=100)
2007 2008 2009 2010 2011 2012 2013

© 2013 SteelConsult International Page www.steelconsult.com
19
Source: Markit
Realities of Survival for European Steel – Short term outlook
The PMI indicator for Eurozone Manufacturing has turned down since mid-2011 and remains well below the 50 level, suggesting continued economic contraction in the months ahead
Leading economic indicators - forward looking
0
10
20
30
40
50
60
70
J F M A M J J A S O N D J F M A M J J A S O N D J F M A M J J A S O N D J F M A M J J A S O N D J F M A M J J A S O N D J F M A M J J A S O N D J F M A
Eurozone Manufacturing PMI
2007 2008 2009 2010 2011 2012 2013
PMI>50 = expansion
PMI<50 = contraction
PMI balance point = 50
© 2013 SteelConsult International Page www.steelconsult.com
20
Realities of Survival for European Steel – Contents
Contents
• Realities for EU steel
• Short term outlook
• Long term challenges:
• Imports
• Offshoring
• CO2 emissions costs
• Conclusions

© 2013 SteelConsult International Page www.steelconsult.com
21
Realities of Survival for European Steel – Long term challenges – Imports
China, Russia and Ukraine are the three largest single exporters of steel to the EU
2.9 3.8 3.8 3.62.1 2.9 2.7
1.62.0 1.5 1.6
1.52.2 2.8 1.9
1.1
4.9
9.4
7.0
1.3
3.24.3
2.8
10.2
14.5
16.9
14.1
7.9
7.4
10.1
6.3
2.8
0
5
10
15
20
25
30
35
2005 2006 2007 2008 2009 2010 2011 2012
Other
China
Ukraine
Russia
Source: ISSB, SteelConsult
3rd country imports of finished steel into the EU-27 (mln t)

© 2013 SteelConsult International Page www.steelconsult.com
22
Source: SteelConsult analysis
Operational production cost/t slab/billet, US$/t, 2012
Realities of Survival for European Steel – Long term challenges – Imports
Chinese steel mills are competitive in their own domestic market, but not sufficiently competitive to be major structural exporters of steel to Europe
408 410 414 408 407347
435
318
24 11 41
47
16
50
2828
28
7
28
5131
27 6872
40
77
11547
16
0
100
200
300
400
500
600
700
800
EU Coastal EU Inland Brazil Ukraine China USA Turkey (scrap
based EAF)
Middle East (DRI
based EAF)
Raw materials Freight raw materials Labour Other operational production costs and energy
Integrated mills EAF mills

© 2013 SteelConsult International Page www.steelconsult.com
23
Realities of Survival for European Steel – Long term challenges – Imports
Ukrainian imports of finished steel into the EU rose sharply post WTO entry in 2010 and 2011, but have come down in 2012...
2.9
3.8 3.83.6
2.1
2.9
2.7
1.6
2.0
1.5 1.61.5
2.2
2.8
1.9
2.8
0.0
0.5
1.0
1.5
2.0
2.5
3.0
3.5
4.0
4.5
5.0
2005 2006 2007 2008 2009 2010 2011 2012
Russia Ukraine
Source: ISSB, SBB, SteelConsult
Imports of finished steel into the EU-27 (mln t)
Russia accedes to the WTO in
August 2012, former quota
amounting to 3.3 mln tonnes for
selected rolled products Ukraine accedes to the
WTO in May 2008,
former quota
amounting to 1.4 mln
tonnes for selected
rolled products

© 2013 SteelConsult International Page www.steelconsult.com
Imports of finished steel into the EU-27 (kt)
Source: ISSB, SteelConsult
2008 2009 2010 2011 2012 2013
0
50
100
150
200
250
300
350
400
450
500
J F M A M J J A S O N D J F M A M J J A S O N D J F M A M J J A S O N D J F M A M J J A S O N D J F M A M J J A S O N D J F
Russia Ukraine
Realities of Survival for European Steel – Long term challenges – Imports
Russian exports of steel to the EU have so far not significantly increased following the country’s access to the WTO in August 2012, except for an expected temporary peak in Jan/Feb 2013
24
Russia accedes
to the WTO in
August 2012
Ukraine accedes
to the WTO in
May 2008

© 2013 SteelConsult International Page www.steelconsult.com
25
Realities of Survival for European Steel – Long term challenges – Imports
Contents
• Some realities for EU steel
• Short term outlook
• Long term challenges:
• Imports
• Offshoring
• CO2 emissions costs
• Conclusions

© 2013 SteelConsult International Page www.steelconsult.com
26
Realities of Survival for European Steel – Long term challenges – Offshoring
Brazil has seen a number of investment plans for new greenfield slab-for-export plants in the last decade, but the CSA and CSP plants are the only export projects to actually have gone ahead
Source: SteelConsult
Bacabeira:
CSM - 10m tpy
Sepetiba:
CSA (TKS/Vale) - 5m
tpy Itaguai:
CSN – 4.5m tpy
Sao Luis:
Baosteel/Arcelor/
Vale - 5m tpy
Pecem:
CSP
(Dongkuk/POSCO/Vale)
– 3m tpy
Anchieta: CSV
(Baosteel/Vale) – 5m
tpy
Congonhas:
CSN – 4.5m tpy
TMK – 3m tpy
CSN – 4.5m tpy
Anchieta: CSU (Vale)
– 5m tpy

© 2013 SteelConsult International Page www.steelconsult.com
27
Realities of Survival for European Steel – Long term challenges – Offshoring
Brazil principally exports its Fe in the shape of ore and not in the shape of processed products. Brazil does not seem to offer a robust business case for investing in greenfield export capacity for supply to the European market
0
50,000
100,000
150,000
200,000
250,000
'80 '81 '82 '83 '84 '85 '86 '87 '88 '89 '90 '91 '92 '93 '94 '95 '96 '97 '98 '99 '00 '01 '02 '03 '04 '05 '06 '07 '08 '09 '10 '11 '12
Semis & finished steel
Pig iron - Fe content
Ore & pellets - Fe content
Source: WSA, IBS
Net exports Brazil (’000 tonnes)

© 2013 SteelConsult International Page www.steelconsult.com
28
Realities of Survival for European Steel – Long term challenges – Offshoring
By contrast, the CIS has more potential as a supply base for steel to Europe, and a number of supply flows (mainly in slabs) already exist today
Source: SteelConsult
Note: Some EU facilities mentioned above have their own steelmaking processes
Dansteel (NLMK) -
Frederiksvaerk (plate)
NLMK La Louviere
(Belgium) (strip)
NLMK Clabecq
(plate)
ISD Dunaferr
(strip)
Evraz Vitkovice
(plate)
Metinvest
Trametal (plate)
Evraz Palini e
Bertoli (plate)
NLMK Verona
Steel (plate)
NLMK Beautor (strip)
NLMK ISD Huta
Czestochowa
(plate)
Metinvest Spartan
(plate)
Metinvest Ferriera
Valsider (plate)
Metinvest
Evraz
ISD
Metinvest Promet
Steel (longs)

© 2013 SteelConsult International Page www.steelconsult.com
29
Realities of Survival for European Steel – Contents
Contents
• Realities for EU steel
• Short term outlook
• Long term challenges:
• Imports
• Offshoring
• CO2 emissions costs
• Conclusions

© 2013 SteelConsult International Page www.steelconsult.com
16
25
8
-10
-5
0
5
10
15
20
25
30
2005 2006 2007 2008 2009 2010 2011 2012 2013* 2014* 2015* 2016* 2017* 2018* 2019* 2020*
-10
-5
0
5
10
15
20
25
30
Actual cost
Case 3: High case scenario (EUR60/t CO2 by 2020)
Case 2: Middle case scenario (EUR40/t CO2 by 2020)
Case 1: Low case scenario (EUR20/t CO2 in 2020)
30
Realities of Survival for European Steel – Long term challenges – CO2 emissions costs
CO2 emissions costs are expected to rise to levels of €8-25/t crude steel in Phase III
CO2 emissions costs, average of integrated EU steel mills (€/t crude steel)
Free
Phase I Phase II Phase III
Source: SteelConsult analysis
Note: Indicative only, forecasts are subject to specific assumptions

© 2013 SteelConsult International Page www.steelconsult.com
31
Realities of Survival for European Steel – Long term challenges – CO2 emissions costs
These costs would represent 15%-45% of average EBITDA margins of the EU steel industry over the last three years
96
114
132
155
168
19
71
33
64
0
20
40
60
80
100
120
140
160
180
2004 2005 2006 2007 2008 2009 2010 2011 2012
Source: SteelConsult analysis
Average EBITDA margin EU steel industry (€/t crude steel)

© 2013 SteelConsult International Page www.steelconsult.com
32
Realities of Survival for European Steel – Contents
Contents
• Some realities for EU steel
• Short term outlook
• Long term challenges:
• Imports
• Offshoring
• CO2 emissions costs
• Conclusions
© 2013 SteelConsult International Page www.steelconsult.com
33
Realities of Survival for European Steel – Conclusions
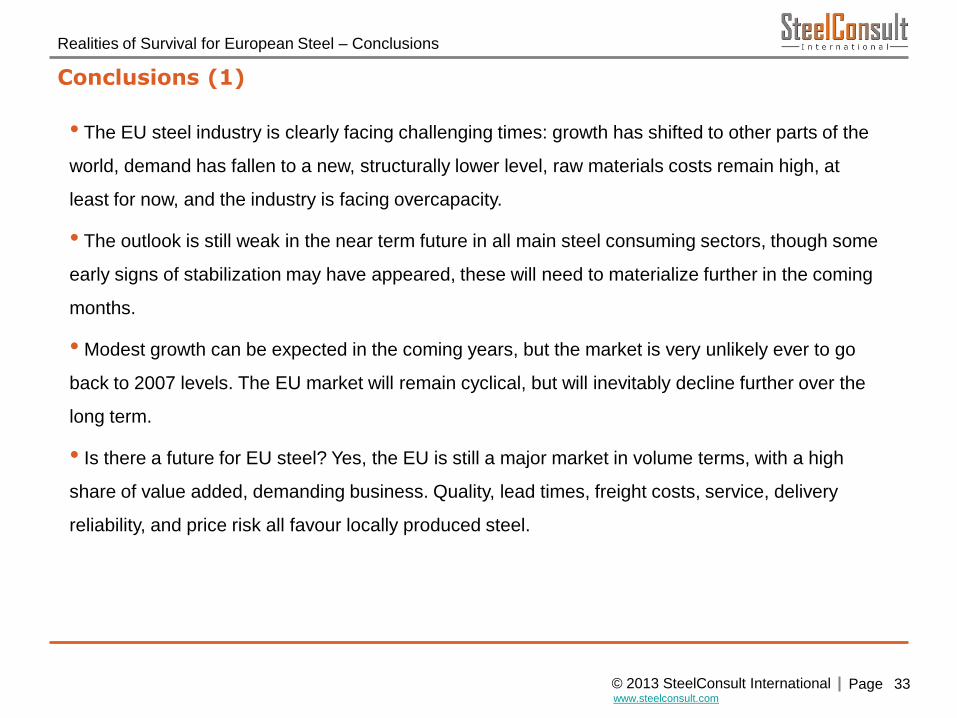
Conclusions (1)
• The EU steel industry is clearly facing challenging times: growth has shifted to other parts of the
world, demand has fallen to a new, structurally lower level, raw materials costs remain high, at
least for now, and the industry is facing overcapacity.
• The outlook is still weak in the near term future in all main steel consuming sectors, though some
early signs of stabilization may have appeared, these will need to materialize further in the coming
months.
• Modest growth can be expected in the coming years, but the market is very unlikely ever to go
back to 2007 levels. The EU market will remain cyclical, but will inevitably decline further over the
long term.
• Is there a future for EU steel? Yes, the EU is still a major market in volume terms, with a high
share of value added, demanding business. Quality, lead times, freight costs, service, delivery
reliability, and price risk all favour locally produced steel.

© 2013 SteelConsult International Page www.steelconsult.com
34
Realities of Survival for European Steel – Conclusions
Conclusions (2)
• China is not sufficiently competitive to become a major exporter of steel on a structural basis.
However, European mills may still on occasion be hit by temporary exports of excess steel from
China. Any small imbalance in China will translate to large tonnages hitting the global market. A
10% reduction in capacity utilization in China equals the entire amount of overcapacity in the CIS in
the early nineties, after the collapse of the former Soviet Union, at any point in time.
• Imports of finished steel from Ukraine and Russia may rise at times, but so far the accession of
these two countries to the WTO has not led to excessive increases in exports to the EU.
• For high value added steel products, there is a robust case for shipping the raw materials to and
producing the steel in Europe, rather than shipping large volumes of semis from other parts of the
world.
• The only region that has a potential role to serve as a steel supply base to Europe is the CIS.
• Depending on the development of carbon prices, CO2 emissions costs may translate to a
significant part of EBITDA margins and thus put further pressure on integrated mills, in particular
those with low value added products.

© 2013 SteelConsult International Page www.steelconsult.com
35
Realities of Survival for European Steel
Thank you for your attention!
SteelConsult International
Binderij 3-S
1185 ZH Amstelveen
The Netherlands
Tel: +31 20 661 8900
Fax: +31 20 661 8901
Email: [email protected]
www.steelconsult.com