Embed Size (px)
Citation preview
1
REGIONAL FISHERIES LIVELIHOODS PROGRAMME
FOR SOUTH AND SOUTHEAST ASIA (RFLP)
---------------------------------------------------------
Reality check on the potential to generate income
from mangroves through carbon credit sales and
payments for environmental services
For the Regional Fisheries Livelihoods Programme for South and Southeast Asia
Prepared by
J.S. Broadhead
Food and Agriculture Organization
15 April 2011
2
Disclaimer and copyright text
"This publication has been made with the financial support of the Spanish Agency of International
Cooperation for Development (AECID) through an FAO trust-fund project, the Regional Fisheries
Livelihoods Programme (RFLP) for South and Southeast Asia. The content of this publication does
not necessarily reflect the opinion of FAO, AECID, or RFLP.‖
All rights reserved. Reproduction and dissemination of material in this information product for
educational and other non-commercial purposes are authorized without any prior written permission
from the copyright holders provided the source is fully acknowledged. Reproduction of material in this
information product for resale or other commercial purposes is prohibited without written permission
of the copyright holders. Applications for such permission should be addressed to:
Chief
Electronic Publishing Policy and Support Branch
Communication Division
FAO
Viale delle Terme di Caracalla, 00153 Rome, Italy
or by e-mail to: [email protected]
© FAO 2011
Bibliographic reference
For bibliographic purposes, please reference this publication as:
Broadhead, J.S. (2011). Reality check on the potential to generate income from mangroves through
carbon credit sales and payments for environmental services. Regional Fisheries Livelihoods
Programme for South and Southeast Asia (GCP/RAS/237/SPA) Field Project Document 2011/REG/2.
i
Contents
1. Introduction ..................................................................................................................................... 1 2. Assessment of mangroves and mangrove related institutional frameworks in RFLP countries ..... 4
2.1. Cambodia ............................................................................................................................... 4 2.2. Indonesia ................................................................................................................................ 5 2.3. The Philippines ...................................................................................................................... 6 2.4. Sri Lanka ................................................................................................................................ 6 2.5. Timor-Leste............................................................................................................................ 6 2.6. Viet Nam ................................................................................................................................ 7
3. Carbon stocks and carbon sequestration in mangroves ................................................................... 9 3.1. Carbon stocks ......................................................................................................................... 9 3.2. Carbon sequestration ............................................................................................................ 10 3.3. Other greenhouse gas fluxes ................................................................................................ 11 3.4. Uncertainties ........................................................................................................................ 11
4. Accommodation of mangrove carbon sequestration in climate change mitigation mechanisms and
standards ................................................................................................................................................ 13 4.1. Clean Development Mechanism (CDM) ............................................................................. 13 4.2. Voluntary Carbon Standard (VCS) ...................................................................................... 16 4.3. Key considerations ............................................................................................................... 17
5. Recommendations ......................................................................................................................... 19 6. References ..................................................................................................................................... 20 Annex I. CO2 reductions by global CDM forestry projects as of 10 Feb 2011 ..................................... 23 Annex II. Worldwide projects working on mangrove carbon credit sales - past, present and future .... 25
1. Batam City, Indonesia .............................................................................................................. 25 2. Indonesia .................................................................................................................................. 25 3. Weru River basin in Chanthaburi province, Thailand .............................................................. 26 4. Kien Giang, Mekong Delta, Phu Quoc Island, Vietnam .......................................................... 27 5. Sine Saloum and Casamance deltas, Senegal ........................................................................... 27 6. Gazi Bay, Kenya ...................................................................................................................... 28 7. Republic of Panama ................................................................................................................. 29 8. Wetland in Cuero and Salado Wildlife Refuge (pilot area) Honduras ..................................... 29 9. Solomon Islands, Island of Ranonga in Western Province, Choiseul Province, Malaita
Province ............................................................................................................................................. 30 10. Fiji, Samoa, Solomon Islands, Tonga and Vanuatu, ............................................................ 30
ii
Summary
Forests have been cited as an essential component of efforts to limit global temperature rise due to
anthropogenic emissions of greenhouse gases to within 2oC. Mangrove ecosystems commonly contain
much larger amounts of carbon than most terrestrial forests and also have higher rates of primary
productivity than many other tropical forests types. Although there is great variability, in many
mangrove ecosystems, a large proportion of the carbon is contained within the anaerobic soils which
can continue to accrete carbon even after vegetation has reached its maximum potential
biomass/carbon content.
Mangroves provide a range of additional benefits including wood production, production of non-wood
forest products (e.g. crabs, honey, bark for tannin production, etc.) and production of a range of
environmental services including: protection from coastal hazards, erosion control, water filtration,
maintenance of coastal fisheries productivity, bio-diversity conservation.
Due to the difficulty in marketing many of the services produced by mangroves and the lack of clarity
over ownership of natural ecosystems, the value of the goods and services produced by mangroves has
in almost all cases, not been fully realized. In Asia, mangrove forests have been cleared at higher rates
than other forest types. Several factors are involved including the high value and easy accessibility of
coastal land and the high value of mangrove wood, especially for wood fuel. In particular, large areas
have been cleared for the establishment of aquaculture and rice production and also urban
developments. Significant degradation of mangroves has also taken place as a result of excessive fuel
wood collection.
In addition to these pressures the difficulty of realizing the non-market benefits of mangroves are
compounded by the fact that the benefits accrue to many people, the majority of whom are often in
poverty or of limited means. Conversion of mangroves is generally associated with a change in
ownership towards an individual or an established entity while common access rights and the benefits
that go with them are lost.
With the exception of carbon emissions reduction, markets for most environmental services have yet
to develop to any great extent. In the case of carbon, rising concern over the possible impacts of
climate change has stimulated demand and markets have been established both through voluntary and
internationally agreed measures. Technical considerations have, however, generally prevented the
widespread inclusion of forest related activities in these markets. In particular issues associated with
monitoring and quantifying carbon flows with precision, setting baselines and with leakage and
permanence have meant that costs associated with including forestry activities in markets have
exceeded associated benefits.
Some progress is, however, being made and a range of forestry activities are eligible for inclusion in
internationally agreed (compliance) carbon markets and under standards widely accepted by voluntary
carbon markets.
Broadly, two classes of forestry activity may secure carbon emissions reductions: (i) afforestation and
reforestation (A/R) or (ii) reduced emissions from deforestation and degradation (REDD). A/R
activities are technically simpler to include in carbon accounting frameworks because the baseline
level of carbon is more or less fixed at zero. REDD activities are more complex as a background rate
of deforestation and degradation has to be estimated before emissions reductions resulting from
project interventions can be assessed. REDD activities are now generally accepted to additionally
include conservation and sustainable management of forests, and enhancement of carbon stocks
(REDD+).
Under the Clean Development Mechanism (CDM) of the Kyoto protocol, only A/R activities are
eligible. To date 19 forestry projects worldwide have been registered under the scheme, none of them
in mangrove areas. Another four have requested registration. The average rate of CO2 emissions
reduction of existing projects is 14 tonnes per year and the range 4-34 tonnes. One CDM project in a
mangrove area, in Indonesia, is currently under validation. The estimated sequestration rate is 33.2
tonnes CO2e ha-1
yr-1
.
iii
A/R activities under the CDM have not proliferated to a greater extent because of the high validation,
registration and verification costs1 of projects in relation to the low value (<$5) of the temporary
certified emissions reductions (tCERs) available for forestry projects. Thus, even with carbon
emissions reductions of 34 tonnes per year, a project would have to cover over 1 000 ha to break even
within 5 years given a sale price of $5 per carbon credit.
Given the high transaction costs associated with compliance markets, voluntary markets have become
a focus for forestry related activities. Project validation is simpler than under the CDM and costs are
therefore lower. Carbon credits for forestry activities under voluntary standards also generally fetch
higher prices than the tCERs available under the CDM. This is largely because, despite the potentially
temporary nature of forestry emissions reductions, permanent credits have been made available
through voluntary standards by employing a buffering system. The buffer refers to a cache of credits
that are withheld from sale until permanence risks are proved to be low. This does mean, however,
that, depending on the level of assessed risk, up to 60% of credits may not be sold; 10% of the buffer
is released every 5 years if risk is proved to be low.
The Voluntary Carbon Standard (VCS) is the best recognised of the voluntary standards and covers a
range of forestry activities under different endorsed methodologies. Currently there is no
methodology that relates specifically to mangrove areas but CDM A/R methodologies are eligible.
Activities associated with reduced emissions from deforestation and degradation although not
accepted under compliance mechanisms are accepted under voluntary standards. Other methodologies
exist for improved forest management and soil carbon can also be included in small projects under the
VCS scheme.
The inclusion of soil carbon, in addition to carbon in biomass, is particularly important in the case of
mangroves as soil carbon stocks may account for well over half of the total carbon present in the
ecosystem. This is potentially of particular importance in relation to REDD+ activities as inclusion of
forecast losses of soil carbon could dramatically increase the number of credits available. Currently,
the CDM only includes soil carbon in large projects (>16 000 tonnes CO2 e yr-1
).
If rates of accretion of soil carbon are high in relation to rates of biomass development, and the
additional carbon can be included in A/R or improved forest management methodologies, income
should also be considerably increased.
Although inclusion of additional carbon pools is likely to increase the number of credits available for
sale, costs will be associated with development of methodologies and measurement of additional
pools. However, rates of soil carbon accretion as a result of root turnover and litter fall are not well
known and may be highly variable. For example, in some areas crabs may consume almost all litter
fall and aerobic bacteria present on the soil surface may reduce carbon before it is stored in the
anaerobic zone. Where litter is carried out to sea, there will also be losses given that carbon projects
generally work on the basis of carbon stocks within a given area rather than flows of carbon.
Because the current level of understanding of carbon cycling in mangrove ecosystems is low, time
consuming methodological work is likely to be necessary before rates of accretion/conservation of soil
carbon can be quantified, validated and credited. This has to be taken into account in relation to the
potential benefits from eventual sale of credits.
A further consideration in relation to soil carbon in mangrove ecosystems is that in implementing
small scale CDM projects there can be no hydrological changes made. This is because of the
anaerobic nature of mangrove soils and release of methane and nitrous oxide (both greenhouse forcing
gases) that occur upon rewetting. This is particularly important in relation to rehabilitation of
abandoned shrimp ponds/rice paddy where hydrological changes would be required for restoration of
mangrove ecosystems. A methodology for rewetting of peat soils is currently under review for
inclusion under the Voluntary Carbon Standard (VCS) although not all mangroves are classified as
growing on peat – some, according to the soil type, are considered wetlands.
1 ~$160,000 + $14,000 every 5 years for verification.
iv
In addition to the technical issues, investment in mangrove related carbon emissions reduction suffers
risks associated with transitions in the global climate change architecture. Firstly, a post-2012
replacement for the Kyoto Protocol has yet to be agreed and the continuation of the CDM and its
component methodologies beyond 2012 is therefore not certain. Secondly, voluntary markets for
forestry related carbon sales will end once national level REDD mechanisms are established given that
forestry related emissions reduction activities will be accounted for under the national level
programme. Currently, REDD readiness activities are being undertaken in all Regional Fisheries
Livelihoods Programme (RFLP) countries except Timor-Leste. Although it is likely that provision will
be made to ensure that continuing projects are maintained or are subsumed into REDD, the terms are
not yet clear.
Institutional and administrative issues must be taken into account in assessing the feasibility of setting
up carbon sales. For example, costs will be associated with distributing and monitoring benefits to
local communities in relation to mangrove activities such that income per hectare will be spread
among many people and only a certain proportion will make it to the local level.
In all RFLP countries in there are also uncertainties over jurisdiction in mangrove areas. Overlaps
commonly exist between local and national government agencies and between sectoral agencies. Lack
of law enforcement at the local level can also mean that the laws that exist are not adhered to. Such
issues should not, however, create problems providing agreement with national authorities can be
arrived at prior to inception of any potential project. Further risks may exist in relation to selling
carbon in international markets as few countries have established laws in relation to ownership, sale
and trade of carbon and carbon rights. These would have to be negotiated during project
implementation.
Globally, there are currently around 10 carbon projects focussing on mangrove areas, of which four
are in Asia. Almost all focus on reforestation, restoration and conservation although readily available
information for some of the projects is scarce.
Given the nature of mangrove ecosystems and potential for sequestering carbon/reducing emissions,
the most profitable sites are likely to be (i) REDD activities in threatened degraded mangrove areas
with peat soils; and (ii) A/R activities in abandoned fish ponds. Additionally, large project sites will
have lower start-up and administration costs per unit area. Methodologies will, however, need to be
refined to include rewetting and/or soil carbon dynamics unless a simple A/R or REDD project
providing a more limited number of credits is to be considered. For this to be considered, the area
would probably have to be in excess of 1 000 ha. It should also be considered that REDD activities
would need to be in areas where the background rate of deforestation and degradation is high, or plans
for deforestation and degradation exist and could be reversed, for carbon credits to be gained.
Given these limitations, and as income is unlikely to be more than US$ 200 per hectare per year under
the best conditions, and probably considerably less given likely reductions of 30%+ for buffering
under the VCS scheme, the mangrove area would almost certainly have to provide goods and services
beyond carbon sequestration/ conservation.
Beyond technical and institutional issues, the essential element in any project will be finding a
promising site and gaining the support of local communities and national authorities. Given the
technical complexities and caveats, beginning from the ground level would seem essential, i.e. it
would be better to begin with a definite problem that could be addressed rather than to set up a concept
and then look for an area which fits the idea. If there are good sites and the community and
government are supportive then the prospects for carbon crediting and for corporate support would be
much higher.
Although working in several countries simultaneously and developing in-house expertise should
reduce set-up costs, current carbon prices, the lack of well fitting methodologies and the need to
provide communities with income within a short time frame (~3 years) suggests that the sale of carbon
credits is not a practical course for RFLP to follow in providing alternative means of livelihood
support to fisher communities.
v
However, under current conditions it is still possible that mechanisms could be developed to enable
coastal communities to benefit financially from mangrove related activities. For example the
following steps could be considered:
Identify potential mangrove areas and consult with stakeholders to determine interest;
Provide livelihoods support through traditional mangrove related activities and alternative
means (e.g. disaster risk reduction) in association with national NGO and/or local
government;
Facilitate agreement over mangrove restoration/conservation between authorities and local
community;
Identify possible corporate2 entity to provide sponsorship and facilitate agreement with local
community and authorities over payment for mangrove conservation;
Identify inter-governmental or civil society institution to act provide local technical support
and act as intermediary;
Work with consultants to:
a. Work towards carbon accreditation including addressing any methodological issues,
and also work towards accreditation with social and environmental standards (e.g.
CCB); or
b. Develop an alternative lower cost accreditation framework that does not yield carbon
credits, but provides a socially and environmentally sound ‗sustainable development
product‘ focussing on payments for mangrove protection and aimed at corporate
buyers.
As global carbon prices remain low, major carbon markets look set to remain relatively closed to
forest related carbon credits (e.g. European Emissions Trading Scheme) and major players including
the US and China are demonstrating reluctance in backing a post-Kyoto agreement that includes deep
cuts in emissions, option b. may prove the only economically feasible alternative where mangrove
areas are less than 1 000-2 000 hectares. Additionally, voluntary carbon markets for forestry will be
extinguished by national REDD+ frameworks once established. Voluntary sales will only continue in
the same form in non-REDD countries although it is likely that in REDD countries (all RFLP
countries except Timor-Leste) that provision will be made for existing carbon projects.
Finally, given the variability of mangrove forests and the environmental, social and environmental
situations in which they exist, it is of great importance is to locate potential field sites such that
interventions can be designed with specific situations in mind, e.g. potential sequestration rates, threats
to existing carbon, local support, etc.
2 Corporate support for mangrove-carbon projects has also been provided, most notably by Danone,
which has set up a funding mechanism and supported various international meetings. Others may
become interested as confidence grows and ad hoc agreements between corporate entity and mangrove
stakeholders could take many forms.
1
1. Introduction
Mangrove ecosystems are highly productive and contain large amounts of carbon both within
vegetation and soils. As such they have great potential value in relation to climate change mitigation.
They also have value in production of timber and non-timber forest products, including wood fuel and
crabs in particular, and provide productive fishing grounds and nursery areas for juvenile fish and
shrimp as well as a habitat for oysters, clams, estuarine crocodiles and snakes. Mangroves filter
chemical and organic pollution from the water, which keeps the waters on reefs and seagrass beds
cleaner (Murdiaso et al 2009). Mangroves also contribute substantially to coastal fisheries in terms of
providing trophic and refuge support, and larval retention (Chong 2007).
Erosion control and entrapment of sediments by mangroves is of relevance in coastal ecosystems
where removal of mangroves can lead to loss of land and saline intrusion. Removal of mangroves can
also expose coastal populations and assets to increased risk from coastal hazards (FAO 2006c, Forbes
and Broadhead 2007). In particular, mangroves provide a degree of protection against coastal hazards
such as storms, tsunamis and cyclones.1
Although they cannot prevent inundation, tall dense
vegetation attenuates wave action and provides structure for survivors to cling to. Coastal forests also
act as a windbreak in reducing the impact of cyclones and coastal storms on local communities. These
functions are particularly pertinent given that climate change in Southeast Asia is expected to result in
increasing intensity of floods, storms and droughts as well as sea level rise.
Mangroves are present on low energy coastlines around much of tropical Asia. Communities resident
in and around mangrove areas are often highly dependent on fisheries resources and mangroves have
traditionally played a role in fishing community‘s livelihoods by providing timber for boat building
and wood for drying and smoking fish. As coastal populations have increased in recent years, fish
stocks have been depleted and the extent of mangroves has been much reduced due to demands for
wood and timber, and for land for expansion of agriculture and aquaculture and residential
development. The high value of coastal land, easy accessibility of mangroves and the high value of
wood from mangrove species for energy production have accelerated clearance. As a result, mangrove
loss across Asia has been at higher rates than for other forest types.
The pressures on mangroves and associated fisheries resources mean that there is an acute need to
introduce and encourage alternative livelihoods that are less detrimental to natural resources and that
facilitate sustainable development and a balanced realisation of environmental, social and economic
values.
For alternative ‗environmentally sustainable‘ livelihoods to be viable, replacement of benefits from
unsustainable fishing and mangrove exploitation activities is necessary. Much talk in recent years has
centred on the possibility of selling environmental services as a means of sustaining communities in
managing natural resources. Because a number of benefits from environmental services produced by
forests, including mangroves, such as climate change mitigation, bio-diversity conservation, and those
related to fisheries production, are accrued at the national and international levels while costs are born
at the local level, mechanisms facilitating transfer of benefits from consumers to providers are a
logical way of incentivising production. There has, however, been limited development of markets
enabling people at the local level to benefit from continued provision of environmental services from
forests.
Project scale schemes to pay local residents for provisions of water related environmental services
have been developed around Asia and in some countries including the Philippines and Viet Nam, these
have been adopted more widely. Payments for bio-diversity related services have yet to become
widely established.
1 Research carried out in Orissa following the super cyclone of 1999 showed that had mangroves been present
around affected villages, loss of life would have been considerably lower (SANDEE 2007). During cyclone Sidr
that struck southern Bangladesh in November 2007, the Sunderbans forests also helped to mitigate the effects of
the cyclone (FAO 2008a).
2
Several impediments exist to wider implementation of payments for environmental services (PES)
including determining who should be paid, what they should be paid for, what the production baseline
is and whether the services are actually being provided. Lack of clarity over tenure – especially in
remote areas – and differences in de facto and de jure rights erode the operability of PES because it is
not clear who should be paid to provide the service. Where many people benefit from the utilization of
resources it is also not generally feasible to pay them all off (Wunder 2007). As such, the potential to
provide benefits to fisher communities through mangrove related conservation and management is
limited, although it is possible that informal sale could be made, or national systems of payment could
be established.
The one area in which payments for environmental services from forests have become more developed
is in relation to climate change mitigation. Many of the problems encountered with other PES also
apply, e.g. technical and political complexity, but these are gradually being overcome albeit with
additional costs. Because mangroves contain and sequester large amounts of carbon, however, and
because large quantities of carbon dioxide are released to the atmosphere when mangroves are cleared
and converted, implications for global climate change are considerable (Murdiyarso and Adiningsih
2007). The value of mangroves is therefore concomitantly high.
Realising the value of mangroves for climate change mitigation in monetary terms is, to some extent, a
distinct issue. Activities that reduce the amount of CO2 emitted or increase the amount sequestered are
potentially eligible for crediting under various current and anticipated compliance2
and non-
compliance (or voluntary) mechanisms and methodologies for climate chance mitigation. By deriving
carbon credits from protection and/or rehabilitation of mangroves while simultaneously reducing
fishing effort in adjacent waters, local communities could benefit from improved productivity of
mangrove resources, income from carbon credit sale and, in the longer term, improved and more
sustainable production of fisheries and forest products.
Voluntary and compliance markets have both been expanding in recent years although the extent of
inclusion of forest and forestry has been limited, particularly in the case of mangroves. This is,
however, changing as experience grows and standardised methodologies become available to account
for carbon emissions in forests and mangroves.
Global mechanisms to market the climate change mitigation values of forests have been developed
under the United Nations Framework Convention on Climate Change (UNFCCC), which recognizes
the importance of land use and land-use change and forestry (LULUCF) activities in stabilizing
atmospheric greenhouse gas concentrations. The Kyoto Protocol makes provision for associated
activities. At present, only afforestation and reforestation (A/R) activities qualify under the Clean
Development Mechanism (CDM) of the Kyoto Protocol, which aims to reduce emissions in
developing countries by funnelling payments from industrialized countries to help meet their
emissions targets. Only a handful of projects, have, however, successfully tapped CDM funds. More
widespread implementation has been curtailed by methodological complexities related to leakage,
permanence, additionality and monitoring. The low price of temporary credits available for A/R
activities and the small proportion of revenue from CDM in relation to other revenues from A/R have
also been an obstruction (Neeff and Henders 2007).
Apart from A/R activities, it has been estimated that the cost of reducing emissions from deforestation
and degradation (REDD) will be low in comparison with current carbon credit prices (Chomitz 2007).
As well as REDD, options open for consideration in a new climate change agreement include
afforestation, reforestation and enhancement of sinks through forest restoration, and substitution of
forest products for electricity and fuel (Robledo and Blaser 2008). Greater inclusion of forestry in a
post-Kyoto agreement is greatly anticipated although many doubts remain over the expected
effectiveness of REDD mechanisms (Lang 2008). In particular, it has been suggested that addressing
deforestation and its ―deeply-entrenched social causes‖ may prove to be more expensive than
alternative ways of reducing emissions of greenhouse gases (Raffensperger 2007). The failure to
reach encompassing agreement on an international framework on REDD at the United Nations
2 Regulated under international agreements.
3
Climate Conference in Copenhagen in December 2009 (COP 15) and subsequent meetings suggests
that there is still some way to go before forests become an integral part of international climate change
mitigation regimes.
Owing to the difficulty of accessing, or present unavailability of internationally regulated
‗compliance‘ markets for forest-related emissions reductions, voluntary carbon markets have become
the main vehicle for investment in forestry-related climate change mitigation. Prices per tonne of CO2
equivalent (CO2 e) have been lower for avoided deforestation than for A/R projects, although great
variation exists (Hamilton et al. 2008).
In anticipation of the inclusion of REDD activities in a post-2012 climate change agreement, many
countries in Asia, are beginning processes to become ‗REDD ready‘, i.e. preparing strategies and
frameworks that will meet expected requirements of global REDD markets.
The workability of REDD will be depend on a wide range of political, institutional and technical
issues. The Stern review emphasized defining property rights to forest land and determining rights and
responsibilities of landowners, communities and loggers in effective forest management (Stern 2006).
Institutional capacity is likely to pose a particular challenge in countries where forest cover remains
high and governance systems are relatively undeveloped.
With respect to mangroves, carbon accounting has been particularly difficult in wetlands because of
limited information on carbon stocks and on emissions. In particular, knowledge of the fate of carbon
fixed by mangrove ecosystems and the nature and variability of carbon cycling remains poorly
understood. Fluxes of other greenhouse gases (GHGs), particularly methane (CH4) and nitrous oxide
(N2O) are also not well quantified or understood and although the 2006 revised National Greenhouse
Gas Inventory Guidelines laid out methods for GHG accounting in these ecosystems, they remain
incomplete (Murdiaso et al. 2009).
Given the current situation, a number of questions surround the feasibility of developing mechanisms
and structures to acquire income from mangrove related climate change mitigation that may be utilised
in supporting the livelihoods of fisher communities, including the following:
How much can carbon emissions be reduced and how much income will this provide?
How much will it cost to qualify for carbon emissions verification and how long will it take to
receive income?
Are methodologies available to facilitate realisation of the value of all carbon sequestered and
stored in mangroves?
What provision do current institutional measures make for the ownership and sale of carbon?
What risks can be expected in relation to, e.g., natural hazards, market fluctuations, corruption,
social strife and coastal erosion?
What is the opportunity cost of the prospective land area in comparison with the highest and
best use?
This report addresses these questions and others in determining whether carbon credits are currently
worth pursuing as a means of supporting the livelihoods of fisher communities in coastal areas in the
countries covered by the Spanish funded FAO Regional Fisheries Livelihood Programme: Cambodia,
Indonesia, the Philippines, Sri Lanka, Timor-Leste and Viet Nam.
4
2. Assessment of mangroves and mangrove related institutional
frameworks in RFLP countries
Across the sub-region, mangroves have been particularly susceptible to conversion and degradation
owing to the high value of the land they occupy, easy accessibility and the value of wood from
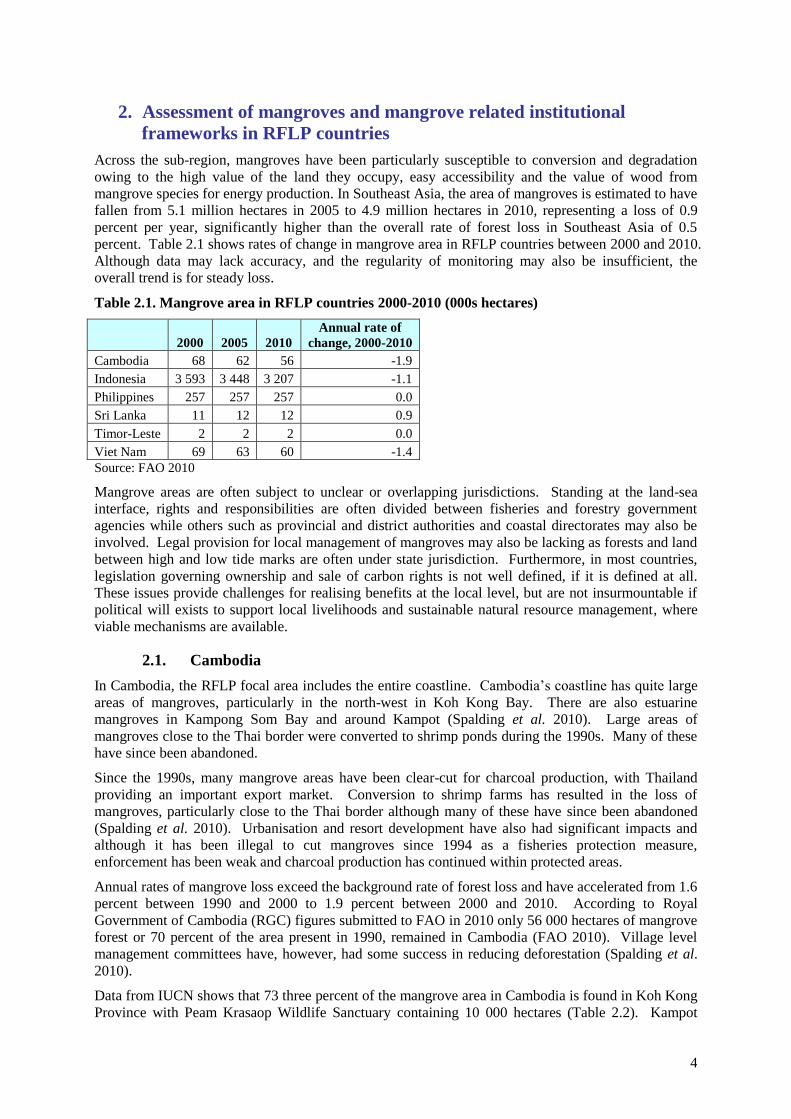
mangrove species for energy production. In Southeast Asia, the area of mangroves is estimated to have
fallen from 5.1 million hectares in 2005 to 4.9 million hectares in 2010, representing a loss of 0.9
percent per year, significantly higher than the overall rate of forest loss in Southeast Asia of 0.5
percent. Table 2.1 shows rates of change in mangrove area in RFLP countries between 2000 and 2010.
Although data may lack accuracy, and the regularity of monitoring may also be insufficient, the
overall trend is for steady loss.
Table 2.1. Mangrove area in RFLP countries 2000-2010 (000s hectares)
2000 2005 2010
Annual rate of
change, 2000-2010
Cambodia 68 62 56 -1.9
Indonesia 3 593 3 448 3 207 -1.1
Philippines 257 257 257 0.0
Sri Lanka 11 12 12 0.9
Timor-Leste 2 2 2 0.0
Viet Nam 69 63 60 -1.4
Source: FAO 2010
Mangrove areas are often subject to unclear or overlapping jurisdictions. Standing at the land-sea
interface, rights and responsibilities are often divided between fisheries and forestry government
agencies while others such as provincial and district authorities and coastal directorates may also be
involved. Legal provision for local management of mangroves may also be lacking as forests and land
between high and low tide marks are often under state jurisdiction. Furthermore, in most countries,
legislation governing ownership and sale of carbon rights is not well defined, if it is defined at all.
These issues provide challenges for realising benefits at the local level, but are not insurmountable if
political will exists to support local livelihoods and sustainable natural resource management, where
viable mechanisms are available.
2.1. Cambodia
In Cambodia, the RFLP focal area includes the entire coastline. Cambodia‘s coastline has quite large
areas of mangroves, particularly in the north-west in Koh Kong Bay. There are also estuarine
mangroves in Kampong Som Bay and around Kampot (Spalding et al. 2010). Large areas of
mangroves close to the Thai border were converted to shrimp ponds during the 1990s. Many of these
have since been abandoned.
Since the 1990s, many mangrove areas have been clear-cut for charcoal production, with Thailand
providing an important export market. Conversion to shrimp farms has resulted in the loss of
mangroves, particularly close to the Thai border although many of these have since been abandoned
(Spalding et al. 2010). Urbanisation and resort development have also had significant impacts and
although it has been illegal to cut mangroves since 1994 as a fisheries protection measure,
enforcement has been weak and charcoal production has continued within protected areas.
Annual rates of mangrove loss exceed the background rate of forest loss and have accelerated from 1.6
percent between 1990 and 2000 to 1.9 percent between 2000 and 2010. According to Royal
Government of Cambodia (RGC) figures submitted to FAO in 2010 only 56 000 hectares of mangrove
forest or 70 percent of the area present in 1990, remained in Cambodia (FAO 2010). Village level
management committees have, however, had some success in reducing deforestation (Spalding et al.
2010).
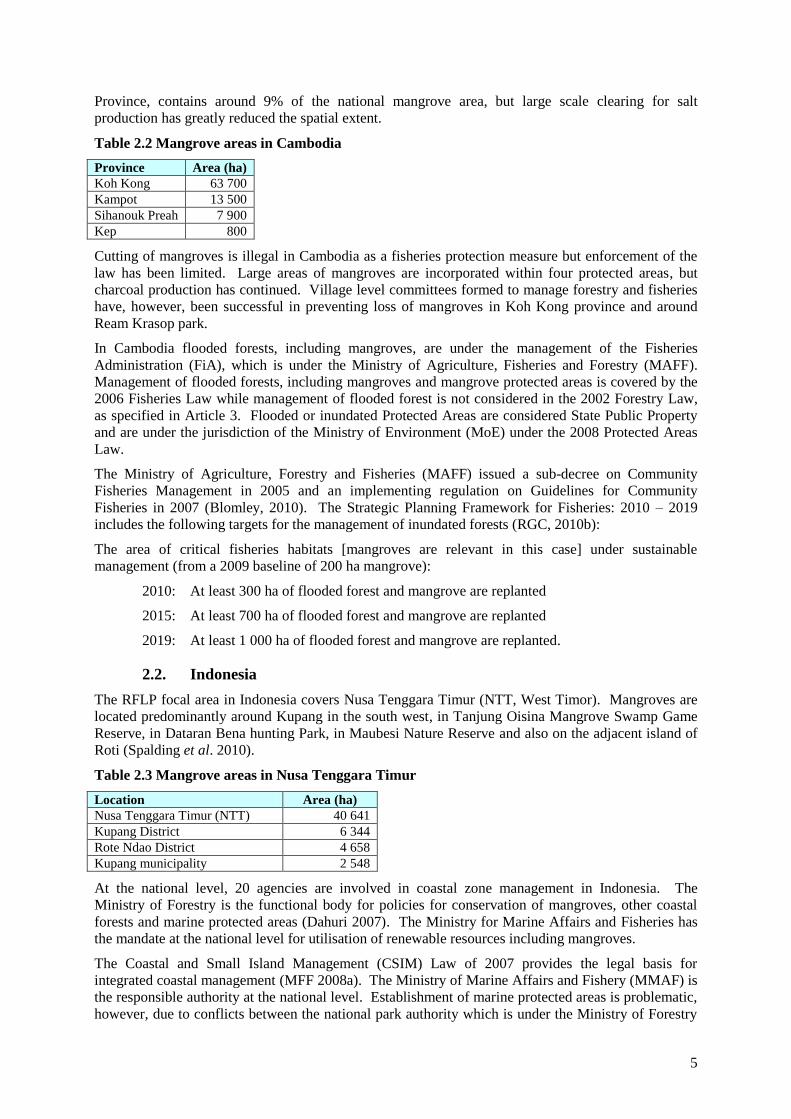
Data from IUCN shows that 73 three percent of the mangrove area in Cambodia is found in Koh Kong
Province with Peam Krasaop Wildlife Sanctuary containing 10 000 hectares (Table 2.2). Kampot
5
Province, contains around 9% of the national mangrove area, but large scale clearing for salt
production has greatly reduced the spatial extent.
Table 2.2 Mangrove areas in Cambodia
Province Area (ha)
Koh Kong 63 700
Kampot 13 500
Sihanouk Preah 7 900
Kep 800
Cutting of mangroves is illegal in Cambodia as a fisheries protection measure but enforcement of the
law has been limited. Large areas of mangroves are incorporated within four protected areas, but
charcoal production has continued. Village level committees formed to manage forestry and fisheries
have, however, been successful in preventing loss of mangroves in Koh Kong province and around
Ream Krasop park.
In Cambodia flooded forests, including mangroves, are under the management of the Fisheries
Administration (FiA), which is under the Ministry of Agriculture, Fisheries and Forestry (MAFF).
Management of flooded forests, including mangroves and mangrove protected areas is covered by the
2006 Fisheries Law while management of flooded forest is not considered in the 2002 Forestry Law,
as specified in Article 3. Flooded or inundated Protected Areas are considered State Public Property
and are under the jurisdiction of the Ministry of Environment (MoE) under the 2008 Protected Areas
Law.
The Ministry of Agriculture, Forestry and Fisheries (MAFF) issued a sub-decree on Community
Fisheries Management in 2005 and an implementing regulation on Guidelines for Community
Fisheries in 2007 (Blomley, 2010). The Strategic Planning Framework for Fisheries: 2010 – 2019
includes the following targets for the management of inundated forests (RGC, 2010b):
The area of critical fisheries habitats [mangroves are relevant in this case] under sustainable
management (from a 2009 baseline of 200 ha mangrove):
2010: At least 300 ha of flooded forest and mangrove are replanted
2015: At least 700 ha of flooded forest and mangrove are replanted
2019: At least 1 000 ha of flooded forest and mangrove are replanted.
2.2. Indonesia
The RFLP focal area in Indonesia covers Nusa Tenggara Timur (NTT, West Timor). Mangroves are
located predominantly around Kupang in the south west, in Tanjung Oisina Mangrove Swamp Game
Reserve, in Dataran Bena hunting Park, in Maubesi Nature Reserve and also on the adjacent island of
Roti (Spalding et al. 2010).
Table 2.3 Mangrove areas in Nusa Tenggara Timur
Location Area (ha)
Nusa Tenggara Timur (NTT) 40 641
Kupang District 6 344
Rote Ndao District 4 658
Kupang municipality 2 548
At the national level, 20 agencies are involved in coastal zone management in Indonesia. The
Ministry of Forestry is the functional body for policies for conservation of mangroves, other coastal
forests and marine protected areas (Dahuri 2007). The Ministry for Marine Affairs and Fisheries has
the mandate at the national level for utilisation of renewable resources including mangroves.
The Coastal and Small Island Management (CSIM) Law of 2007 provides the legal basis for
integrated coastal management (MFF 2008a). The Ministry of Marine Affairs and Fishery (MMAF) is
the responsible authority at the national level. Establishment of marine protected areas is problematic,
however, due to conflicts between the national park authority which is under the Ministry of Forestry
6
and local authorities, which are responsible for coastline demarcation. Decrees issued prior to the
CSIM law provide for granting of management rights to coastal communities and enable participation
of local communities in monitoring.
2.3. The Philippines
The RFLP focal area in the Philippines covers North Mindanao. Mindanao has two thirds of the
remaining mangroves of the Philippines, mostly in the northern and western areas. Mindanao is rarely
visited by typhoons, except its northeastern section that is occasionally hit.
An area of mangroves of 4 000 ha is situated on Siargao Island off the north-east coast of Mindanao
(Spalding et al .2010). In Western Mindanao, Murciellagos Bay has an area of 785 hectares of
mangroves3, while the adjacent Dipolog Bay has 1 520 hectares (RFLP report).
Some legislation exists to protect mangroves including restrictions on the development of new
aquaculture and a requirement for the maintenance of greenbelt strips long the edges of aquaculture
areas – up to 100 m in width in typhoon-prone areas (Spalding et al. 2010).
2.4. Sri Lanka
Mangroves in Sri Lanka are concentrated in fringes and around estuaries and lagoons (Spalding et al.
2010). The RFLP focal area in Sri Lanka covers Puttalam District in which the largest mangrove
ecosystem in the country is located. The mangrove system is located in the Puttalam Lagoon – Dutch
Bay – Portugal Bay complex and covers 3 385 hectares (IUCN data).
Some 1 500 ha of coastal area between Chilaw and Puttlam, most of it mangrove forest, have been
developed for aquaculture, and about 63 percent of the previously existing mangroves in Puttalam
Lagoon were lost in the ten-year period 1982 - 1992 (Samaranayake 2007). The area of shrimp farms
is around 4 490 hectares although 2 884 hectares are abandoned. Some of this area is used for salt
production, and in total there are 3 368 hectares used by the salt industry (RFLP report).
The Coast Conservation Department is mandated with ―the sustainable development of coastal
resources and the management of coastal processes to optimise social, economic and environmental
status of Sri Lanka‖. However, under the Urban Development Authority (UDA) Act, No 41 of 1978,
the entire coastal zone has been gazetted as an urban development area. Any development plans
therefore have to be referred to the UDA (Samaranayake 2007). Additionally, the Department of
Wildlife and Conservation designates and manages protected areas, the Forest Department manages
forests including mangroves, the Ministry of Fisheries and Ocean Resources manages fisheries and the
National Aquaculture Development Authority promotes the conversion of mangroves for prawn
culture (MFF 2008b).
The existing legal framework recognises only public and private property but not communal property,
which creates obstacles for implementing coastal management in which communities share benefits
(MFF 2008b).
Puttalam district is included in a Special Area Management (SAM) plan. The overall SAM process is
coordinated by the Special Area Management Coordinating Committee headed by the Divisional
Secretary of the area and facilitated by the Coast Conservation Department. The Coordinating
Committee includes the main governmental and non-governmental stakeholders including the fisheries
Cooperative Societies in the SAM area (Samaranayake 2007).
2.5. Timor-Leste
The RFLP focal area covers the entire coastline of Timor-Leste. Mangroves are not extensive
although fringing mangroves are found to the east of Dili, including in Metinaro and to the west in
3 Partnership for rural and technical services: http://parts-
ngo.org/index.php?option=com_content&view=article&id=46&Itemid=40
7
Tibar and Maubara (Spalding et al. 2010; FAO 2003). On the south coast, Mangroves are restricted to
estuaries and lagoons
There is a legal framework for environmental protection including specific regulations to protect
mangroves, but enforcement is weak (Spalding et al. 2010).
2.6. Viet Nam
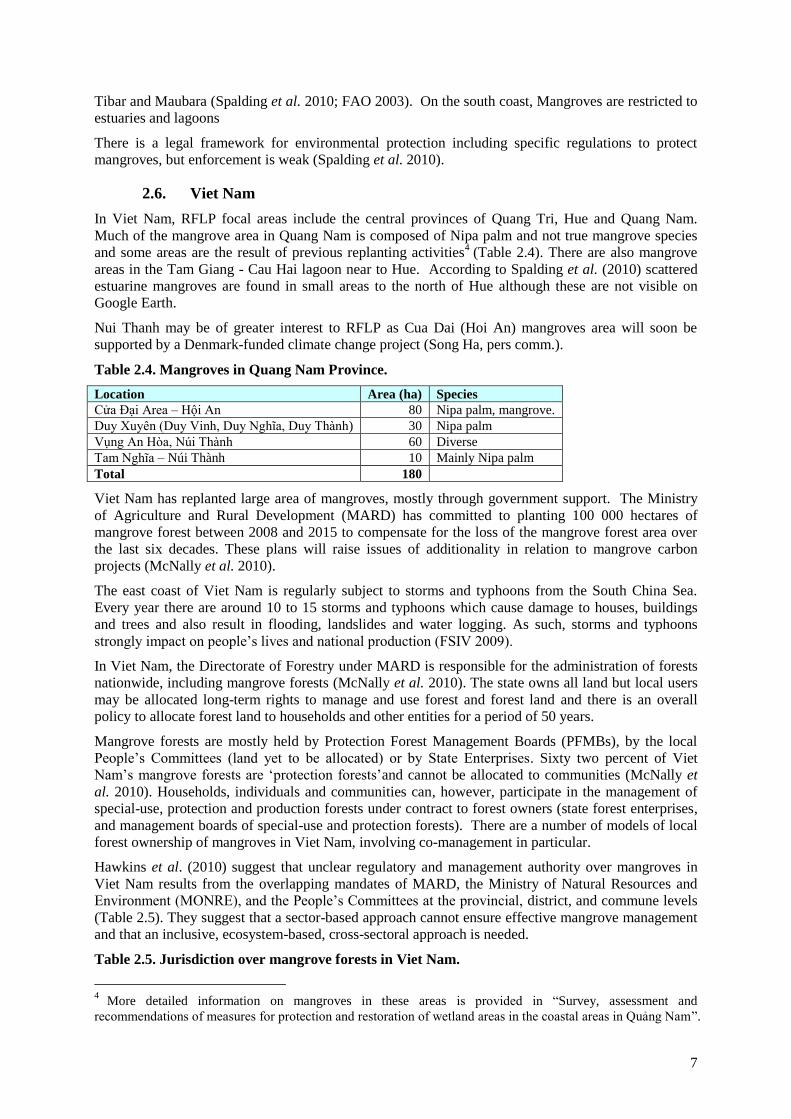
In Viet Nam, RFLP focal areas include the central provinces of Quang Tri, Hue and Quang Nam.
Much of the mangrove area in Quang Nam is composed of Nipa palm and not true mangrove species
and some areas are the result of previous replanting activities4 (Table 2.4). There are also mangrove
areas in the Tam Giang - Cau Hai lagoon near to Hue. According to Spalding et al. (2010) scattered
estuarine mangroves are found in small areas to the north of Hue although these are not visible on
Google Earth.
Nui Thanh may be of greater interest to RFLP as Cua Dai (Hoi An) mangroves area will soon be
supported by a Denmark-funded climate change project (Song Ha, pers comm.).
Table 2.4. Mangroves in Quang Nam Province.
Location Area (ha) Species
Cửa Đại Area – Hội An 80 Nipa palm, mangrove.
Duy Xuyên (Duy Vinh, Duy Nghĩa, Duy Thành) 30 Nipa palm
Vụng An Hòa, Núi Thành 60 Diverse
Tam Nghĩa – Núi Thành 10 Mainly Nipa palm
Total 180
Viet Nam has replanted large area of mangroves, mostly through government support. The Ministry
of Agriculture and Rural Development (MARD) has committed to planting 100 000 hectares of
mangrove forest between 2008 and 2015 to compensate for the loss of the mangrove forest area over
the last six decades. These plans will raise issues of additionality in relation to mangrove carbon
projects (McNally et al. 2010).
The east coast of Viet Nam is regularly subject to storms and typhoons from the South China Sea.
Every year there are around 10 to 15 storms and typhoons which cause damage to houses, buildings
and trees and also result in flooding, landslides and water logging. As such, storms and typhoons
strongly impact on people‘s lives and national production (FSIV 2009).
In Viet Nam, the Directorate of Forestry under MARD is responsible for the administration of forests
nationwide, including mangrove forests (McNally et al. 2010). The state owns all land but local users
may be allocated long-term rights to manage and use forest and forest land and there is an overall
policy to allocate forest land to households and other entities for a period of 50 years.
Mangrove forests are mostly held by Protection Forest Management Boards (PFMBs), by the local
People‘s Committees (land yet to be allocated) or by State Enterprises. Sixty two percent of Viet
Nam‘s mangrove forests are ‗protection forests‘and cannot be allocated to communities (McNally et
al. 2010). Households, individuals and communities can, however, participate in the management of
special-use, protection and production forests under contract to forest owners (state forest enterprises,
and management boards of special-use and protection forests). There are a number of models of local
forest ownership of mangroves in Viet Nam, involving co-management in particular.
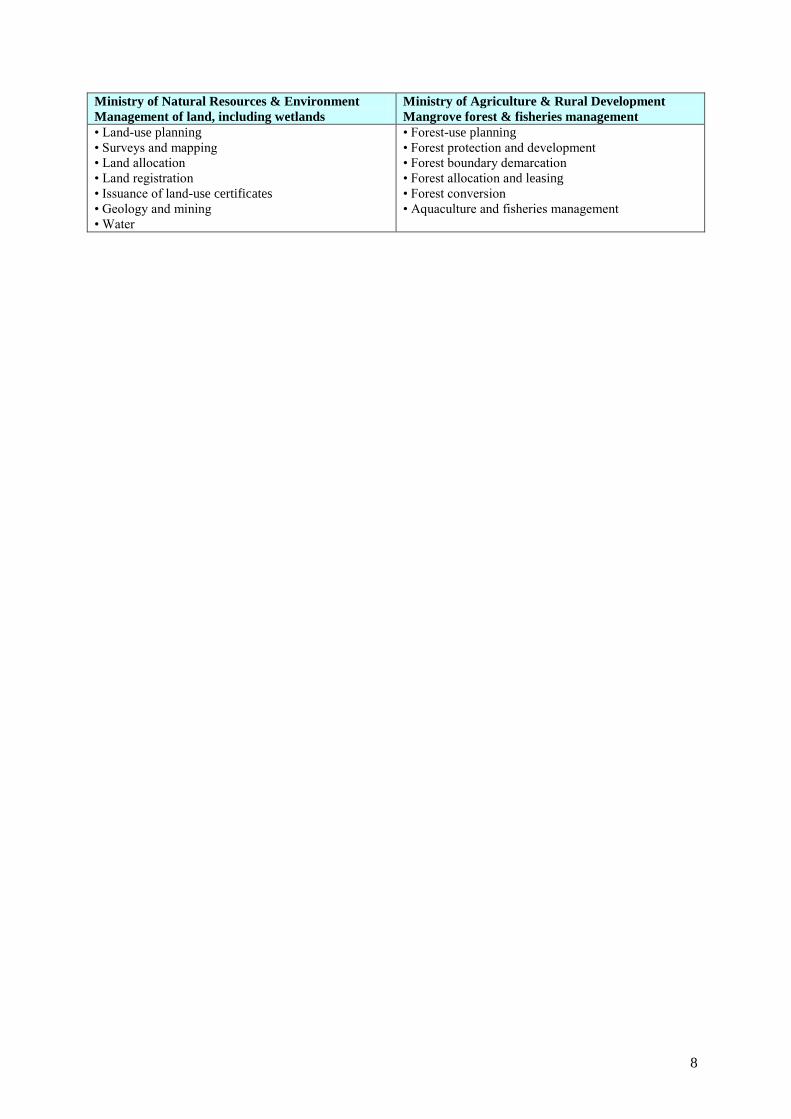
Hawkins et al. (2010) suggest that unclear regulatory and management authority over mangroves in
Viet Nam results from the overlapping mandates of MARD, the Ministry of Natural Resources and
Environment (MONRE), and the People‘s Committees at the provincial, district, and commune levels
(Table 2.5). They suggest that a sector-based approach cannot ensure effective mangrove management
and that an inclusive, ecosystem-based, cross-sectoral approach is needed.
Table 2.5. Jurisdiction over mangrove forests in Viet Nam.
4
More detailed information on mangroves in these areas is provided in ―Survey, assessment and
recommendations of measures for protection and restoration of wetland areas in the coastal areas in Quảng Nam‖.
8
Ministry of Natural Resources & Environment
Management of land, including wetlands
Ministry of Agriculture & Rural Development
Mangrove forest & fisheries management
• Land-use planning
• Surveys and mapping
• Land allocation
• Land registration
• Issuance of land-use certificates
• Geology and mining
• Water
• Forest-use planning
• Forest protection and development
• Forest boundary demarcation
• Forest allocation and leasing
• Forest conversion
• Aquaculture and fisheries management
9
3. Carbon stocks and carbon sequestration in mangroves
Mangroves are important in climate change mitigation as they fix large amounts of carbon, a
proportion of which is, importantly, sequestered in mangrove soils for long periods of time (Ong et al.
1995; Matsui and Yamatani 2000; Kaufmann et al. in prep.). Because mangroves and peat swamp
forests have high root–shoot ratios and occur on organic-rich soils several metres deep, the claim has
been made that they may contain the largest forest carbon pools on earth (Murdiyarso et al. 2009).
Much attention in recent years has been given to peat swamp forests and their role in climate change
mitigation while mangroves have been prioritised to a much lesser extent. In contrast to peatlands,
however, mangroves release negligible amounts of greenhouse gases and store more carbon per unit
area (Chmura and Anisfeld 2003).
Large amounts of carbon are contained in mangrove soils as well as that contained in above and below
ground biomass. Amounts stored are potentially of importance in REDD style schemes in which the
focus is on retaining existing carbon stocks. Soils and vegetation are also important in sequestering
carbon through root turnover and these fluxes will be of interest in relation to afforestation and
reforestation activities.
3.1. Carbon stocks
Mangroves often have an organic-rich soil layer for the first ~0.5–5 m depth, followed by an abrupt
transition to mineral soils or sands beneath (Murdiyarso et al. 2009). Soil carbon accounts for between
50 and 90% of total above and below ground carbon, the rest being contained in living biomass
(Murray et al. 2011). As such, mangrove soils are of primary importance in relation to climate change
mitigation, especially in relation to conversion of existing mangroves. In mangroves, peat formation
primarily occurs through deposition and turnover of mangrove roots as above ground tissues rapidly
decay or are transported from the system (Middleton and McKee, 2001).
Based on wide ranging measurements of soil carbon density in tidal saline wetlands around the world,
and assuming a soil depth of 0.5 m, Chmura et al. (2003) estimated mangrove soil carbon storage at
1 012 ± 81 Mt CO2e ha-1
although as average soil depths are closer to 1 m, soil carbon storage may
equal over 2 024 Mt CO2e ha-1
. More recently, Murray et al. (2011) have estimated global mean soil
organic carbon in the first metre of soil to amount to 1 060 Mt CO2e ha-1
in estuarine mangroves and
nearly 1 800 Mt CO2e ha-1
in oceanic mangroves.
At Matang mangroves in Malaysia, some 5.5 Mt CO2e ha-1
yr-1
of soil carbon was estimated to have
accumulated each year over the past 8 000 years such that conversion of the mangroves would result
in the release of an estimated 275 Mt CO2e ha-1
yr-1
to the atmosphere over a 10-year period (Ong
1993).
Following mangrove rehabilitation in abandoned shrimp pond in Thailand, soil carbon storage
increased from 403 to 587 Mt CO2e ha-1
in two years at lower tidal elevations. Levels of storage
before and after regeneration were low compared to natural mangroves (1 357- 1954 Mt CO2e ha-1
) but
similar to deltaic sediment suggesting that large amounts of carbon were lost during pond construction,
use and abandonment and that carbon storage could increase significantly. At higher tidal elevations,
however, soil carbon storage fell by half after mangrove rehabilitation, suggesting that carbon
decomposition was accelerated by drying of soils in higher tidal zones (Matsui et al. 2010). As such,
it was concluded that areas in which mangroves grow well are likely to sequester carbon whereas areas
in which drying occurs may become net sources of carbon.
The above ground biomass (AGB) of mangrove forests in Kien Giang Province ranges from 10 Mt
DW ha-1
in riverine, upper intertidal scrub vegetation to 424 Mt DW ha-1
in a multi-stemmed R.
apiculata plantation.5 The mean AGB was 126 Mt DW ha
-1, equivalent to around 231 Mt CO2e ha
-1.
This is slightly lower than the IPCC default value of 180 Mt DW ha-1
(330 Mt CO2e ha-1
) for terrestrial
5 GTZ (2010), Assessment of Mangrove Forests, Shoreline Condition and Feasibility for REDD in Kien Giang
Province, Viet Nam: A Technical Report, GTZ, Rach Gia.
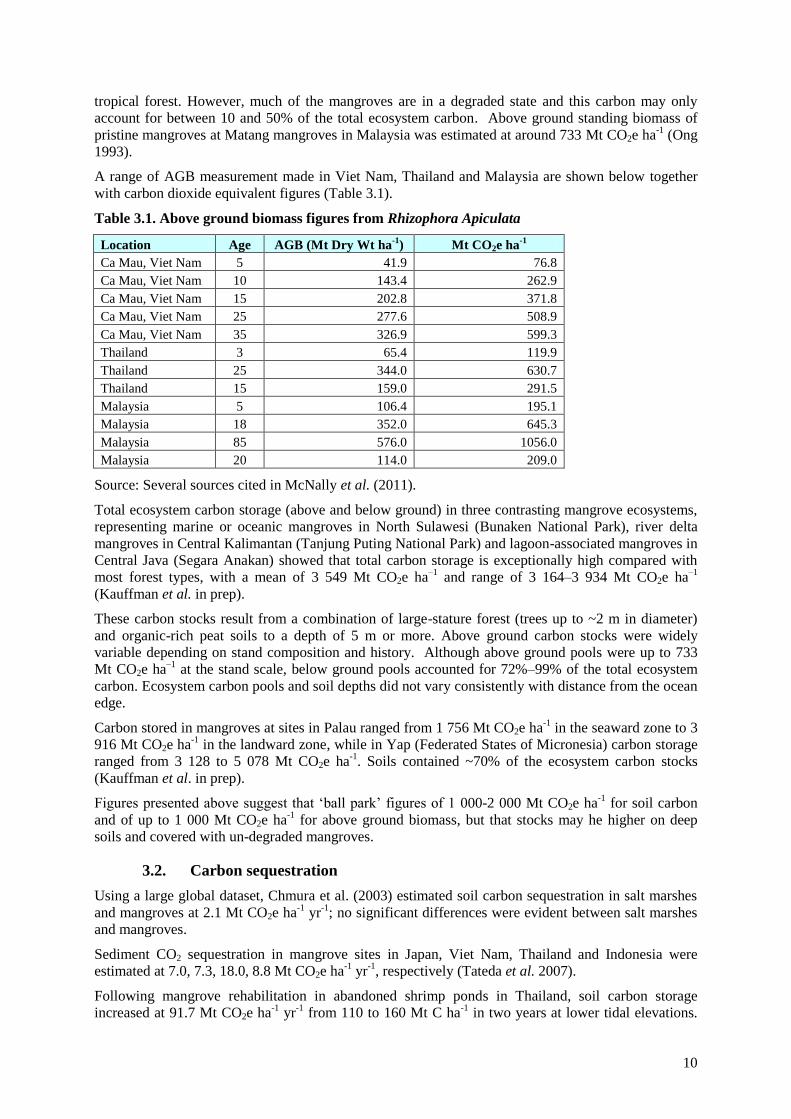
10
tropical forest. However, much of the mangroves are in a degraded state and this carbon may only
account for between 10 and 50% of the total ecosystem carbon. Above ground standing biomass of
pristine mangroves at Matang mangroves in Malaysia was estimated at around 733 Mt CO2e ha-1
(Ong
1993).
A range of AGB measurement made in Viet Nam, Thailand and Malaysia are shown below together
with carbon dioxide equivalent figures (Table 3.1).
Table 3.1. Above ground biomass figures from Rhizophora Apiculata
Location Age AGB (Mt Dry Wt ha-1
) Mt CO2e ha-1
Ca Mau, Viet Nam 5 41.9 76.8
Ca Mau, Viet Nam 10 143.4 262.9
Ca Mau, Viet Nam 15 202.8 371.8
Ca Mau, Viet Nam 25 277.6 508.9
Ca Mau, Viet Nam 35 326.9 599.3
Thailand 3 65.4 119.9
Thailand 25 344.0 630.7
Thailand 15 159.0 291.5
Malaysia 5 106.4 195.1
Malaysia 18 352.0 645.3
Malaysia 85 576.0 1056.0
Malaysia 20 114.0 209.0
Source: Several sources cited in McNally et al. (2011).
Total ecosystem carbon storage (above and below ground) in three contrasting mangrove ecosystems,
representing marine or oceanic mangroves in North Sulawesi (Bunaken National Park), river delta
mangroves in Central Kalimantan (Tanjung Puting National Park) and lagoon-associated mangroves in
Central Java (Segara Anakan) showed that total carbon storage is exceptionally high compared with
most forest types, with a mean of 3 549 Mt CO2e ha–1
and range of 3 164–3 934 Mt CO2e ha–1
(Kauffman et al. in prep).
These carbon stocks result from a combination of large-stature forest (trees up to ~2 m in diameter)
and organic-rich peat soils to a depth of 5 m or more. Above ground carbon stocks were widely
variable depending on stand composition and history. Although above ground pools were up to 733
Mt CO2e ha–1
at the stand scale, below ground pools accounted for 72%–99% of the total ecosystem
carbon. Ecosystem carbon pools and soil depths did not vary consistently with distance from the ocean
edge.
Carbon stored in mangroves at sites in Palau ranged from 1 756 Mt CO2e ha-1
in the seaward zone to 3
916 Mt CO2e ha-1
in the landward zone, while in Yap (Federated States of Micronesia) carbon storage
ranged from 3 128 to 5 078 Mt CO2e ha-1
. Soils contained ~70% of the ecosystem carbon stocks
(Kauffman et al. in prep).
Figures presented above suggest that ‗ball park‘ figures of 1 000-2 000 Mt CO2e ha-1
for soil carbon
and of up to 1 000 Mt CO2e ha-1
for above ground biomass, but that stocks may he higher on deep
soils and covered with un-degraded mangroves.
3.2. Carbon sequestration
Using a large global dataset, Chmura et al. (2003) estimated soil carbon sequestration in salt marshes
and mangroves at 2.1 Mt CO2e ha-1
yr-1
; no significant differences were evident between salt marshes
and mangroves.
Sediment CO2 sequestration in mangrove sites in Japan, Viet Nam, Thailand and Indonesia were
estimated at 7.0, 7.3, 18.0, 8.8 Mt CO2e ha-1
yr-1
, respectively (Tateda et al. 2007).
Following mangrove rehabilitation in abandoned shrimp ponds in Thailand, soil carbon storage
increased at 91.7 Mt CO2e ha-1
yr-1
from 110 to 160 Mt C ha-1
in two years at lower tidal elevations.
11
At higher elevations, however, soil carbon storage fell by half suggesting that carbon decomposition
was accelerated due to drying of soils (Matsui et al. 2010).
Global datasets estimate net primary productivity of mangroves at 13.625 ± 4.5 Mt C ha-1
yr-1
or just
under 50 Mt CO2e ha-1
yr-1
with litter fall, wood and root production accounting for ~31, 31, and 38%
of the overall production respectively (Bouillon et al. 2008).
CO2 fixation (above and below ground) in 10 year old reforested Kandelia candel mangrove in Thanh
Hoa Viet Nam was estimated as 34.3 and 26.6 Mt CO2e ha-1
yr-1
by gas exchange and growth curve
analysis respectively. (Okimoto, et al. 2008).
An early study of the Matang mangroves in Malaysia estimated rates of above ground carbon
accumulation in pristine mangroves at around 33 Mt CO2e ha-1
yr-1
(Ong 1993).
A summary of Clean Development Mechanism projects in a range of forest types is shown in Annex I.
The average carbon sequestration rate over all projects is 9.6 Mt CO2e ha-1
yr-1
, with a range of 4-34 Mt
CO2e ha-1
yr-1
. The figures above show that CO2 sequestration rates in mangroves may be much higher
but also are also highly variable. Mangrove regeneration under good conditions is likely to provide
very high rates of sequestration where soil carbon is included. Comparison with available information
on worldwide projects working on carbon credit sales in mangrove areas shows that claimed
sequestration rates are highly variable (carbon sequestration in Mt CO2e ha-1
yr-1
, numbers in brackets
refer to example numbers in Annex II): 33.2 (1), 8.8 (2) 16.875 (3), 1.33 (5), 23.8 (6), 28.7 (7).
3.3. Other greenhouse gas fluxes
Methane (CH4) has a global warming potential 23 times that of CO2 over a 100 year time horizon
(Ramaswamy et al. 2001). Some tidal saline wetlands have been reported to be large sources of
methane while others have been reported to be methane sinks. In Thailand, mangroves have been
reported to be a net source of atmospheric methane with the source strength being very small
compared with freshwater wetlands, although emissions vary with tidal period and position/species
within the tidal range (Lekphet et al. 2003). Emission rates also vary seasonally with the highest rate
in the rainy season followed by the summer and cold seasons (Lekphet 2005).
Tateda et al. (2007) estimated that the amount of nitrous oxide (N2O) emission from mangrove
ecosystems is lower than carbon fixation in terms of greenhouse impacts but that the concentration of
N2O in seawater in the rainy season and levels of N2O in sub-surface sediments were high. The
greenhouse effect in terms of CO2 equivalent from N2O released from mangrove sediments to the air
was estimated at -1.8-7.0 Mt CO2e ha-1
yr-1
, while that passing from sediment to water to air was
estimated at -0.1-1.1 Mt CO2e ha-1
yr-1
. The combined values were thus small compared to the CO2
sequestration by mangrove ecosystem (18.3-36.7 Mt CO2e ha-1
yr-1
).
3.4. Uncertainties
Published global estimates on central components of the mangrove carbon budget have several
shortcomings (Bouillon et al. 2008):
(i) information on mangroves is very limited and carbon budgets are based on relatively small
data sets; and
(ii) estimates on below ground allocation and wood production are still scarce. Moreover,
mangrove systems occur in a wide range of environmental settings, and the degree of organic
matter retention and export vary according to geomorphology, tidal amplitude, local climate,
vegetation type, and biotic influences, etc.
In relation to point (ii), despite the large average stocks of carbon in mangrove soils, the range of soil
carbon densities from single mangrove sites is broad with respect to the global range and great
variability exists within regions (Chmura 2003). There is also high variability in carbon accumulation
rates within different mangrove zones. Much of the variation can be explained by differences in
suspended sediment supply and tidal water inundation.
12
More generally, many uncertainties exist in relation to carbon cycling, particularly as regards the fate
of detritus. Most mangrove detritus that enters the sediment is degraded by micro-organisms while
organic carbon that escapes microbial degradation is stored in sediments. Many mangrove forests,
however, also lose a significant fraction of their net primary production to coastal waters, during tidal
flows, although large differences occur between mangrove forests with respect to litter production and
export (Kristensen et al. 2008).
Available estimates of various carbon sinks (organic carbon export, sediment burial, and
mineralization) suggest that >50% of the carbon fixed by mangrove vegetation is unaccounted for
(Bouillon et al. 2008). It is likely that tidal exports of dissolved inorganic carbon and fluxes from
intertidal sediments, that are currently underestimated, make up a large proportion of the unaccounted
carbon.
Measurements made show that mangroves release high levels of dissolved inorganic carbon to
estuaries and function in removing CO2 from the atmosphere and releasing it into estuarine waters
(Miyajima et al. 2009). Sunlight destroys molecules during transport offshore, removing about one
third of mangrove-derived dissolved inorganic carbon, while the remainder is thought to be distributed
over the oceans (Dittmar et al. 2006).
These uncertainties have to be taken into account when planning carbon projects as variability
increases sampling intensity and cost. More importantly, as carbon accounting is generally conducted
on an area basis, export of carbon to areas outside the project area, as may be common, will count as
an emission regardless of whether the carbon is ultimately accreted or released into the atmosphere.
High levels of variability and an incomplete understanding of carbon cycling and the cycling of other
greenhouse gasses are likely to act as impediments in bringing carbon projects in mangrove areas to
market. In particular, carbon accounting frameworks covering the wide range of situations that may
be encountered in implementing efforts to increase sequestration, or reduce emissions, of carbon in
mangroves need to be developed. Existing accounting methodologies applicable to forests in general
can be used for some mangrove related climate change mitigation activities, although there are
significant limitations as discussed in the following section.
13
4. Accommodation of mangrove carbon sequestration in climate change
mitigation mechanisms and standards
As detailed in the preceding sections, there are several distinct carbon sinks in mangrove ecosystems
including above and below ground living biomass, leaf litter and dead wood, soil carbon, carbon
suspended as detritus in water bodies and dissolved organic carbon (DOC).
Broadly, climate change mitigation activities in mangroves can consider the following areas:
rehabilitating degraded mangroves (involving sequestration of carbon in above and below
ground biomass);
re-establishing mangroves including changes in soil hydrology (involving sequestration of
carbon in above and below ground biomass and soil); and,
Reducing deforestation and degradation in mangroves (potentially involving reduction of losses
of carbon from above and below ground biomass and soil).
Two main carbon payment mechanisms for climate change mitigation are currently applicable for
forestry. The Clean Development Mechanism, which having been developed under the Kyoto
Protocol qualifies as a ‗compliance‘ mechanism credits from which can be sold in compliance markets
which normally fetch relatively high prices, and the Voluntary Carbon Standard (VCS), which
qualifies as a ‗non-compliance‘ or voluntary standard. Carbon emissions reduction can, of course,
also be sold ‗over the counter‘ on an unregulated basis as agreed by the contracting parties although
one of the carbon standards is often adopted. There are also other carbon emissions reduction
standards such as the Gold Standard, but of all the voluntary standards, none cater for forests or are as
widely recognised as the VCS.
Both the CDM and VCS consider pools of carbon but not fluxes, which means that even if carbon is
fixed and transported outside the defined project area, it will not be eligible for carbon credits. This is
relevant in the context of ‗out-welling‘ of detritus and DOC from mangrove areas into coastal waters.
If carbon fluxes are to be accounted for, a change in the current system of accounting will be required
(DFN 2010).
Only net growth of above and below ground biomass is considered by the small scale CDM
methodology6 applicable to mangroves (AR-AMS0003) while burial of litter resulting from annual
turnover is also considered in large-scale AR-CDM methodologies and under the Voluntary Carbon
Standard. More details of both schemes are provided in the following sections.
4.1. Clean Development Mechanism (CDM)
The Clean Development Mechanism (CDM) of the Kyoto Protocol, which aims to reduce emissions in
developing countries by funnelling payments from industrialized countries to help meet their
emissions targets, covers only afforestation and reforestation (A/R) activities.
To be eligible for the CDM project participants have to provide evidence that the land within the
planned project boundary does not contain forest or young trees that will become forest under the
definition defined by the designated national authority (DNA) or is temporarily unstocked forest.7
They must also demonstrate, for reforestation projects, that the land was not forest at the end of 1989
and for afforestation products that the land has not been forest for at least 50 years.
Only a few forestry projects have successfully registered for CDM. There are currently a total of 56
A/R projects at various stages of development in the CDM pipeline, only 15 of which are registered
and none of which have yet been issued Certified Emission Reductions (CERs) (McNally et al. 2010).
More widespread implementation has been curtailed by methodological complexities related to
leakage, permanence, additionality and monitoring. The low price of temporary credits available for
6 Less than 16 000 CO2e/yr
7 http://cdm.unfccc.int/methodologies/ARmethodologies/tools/ar-am-tool-10-v1.pdf
14
A/R activities and the small proportion of revenue from CDM in relation to other revenues from A/R
have also been an obstruction (Neeff and Henders 2007).
Large scale projects (>16 000 Mt CO2 equivalent per year) include above- and below ground biomass
carbon pools and also dead wood, litter and Soil Organic Carbon (SOC) although the CDM tool for
estimating SOC is not applicable to organic soils or wetlands.8
Small scale A/R projects must fulfil the following conditions:9
(1) Net anthropogenic GHG removals by sinks must be less than 16 000 tonnes of CO2 per year;
and
(2) The projects must be developed or implemented by low-income communities and individuals
as determined by the host Party.
Implementation of small scale projects is less complex than large scale and probably more relevant for
the RFLP where the extent and fragmentation of mangroves in project focal areas and time limitations
are deciding factors.
There are currently 8 approved small scale A/R methodologies and 12 large scale methodologies
approved with another 4 awaiting review.
Small scale AR-CDM project methodologies include the following:
AR-ACM0002 Afforestation or reforestation of degraded land without displacement of pre-
project activities;
AR-AMS0001 Simplified baseline and monitoring methodologies for small-scale A/R CDM
project activities implemented on grasslands or croplands with limited displacement of pre-
project activities;
AR-AMS0002 Simplified baseline and monitoring methodologies for small-scale
afforestation and reforestation project activities under the CDM implemented on settlements;
AR-AMS0003 Simplified baseline and monitoring methodology for small scale CDM
afforestation and reforestation project activities implemented on wetlands;
AR-AMS0004 Simplified baseline and monitoring methodology for small-scale agroforestry
– afforestation and reforestation project activities under the clean development mechanism;
AR-AMS0005 Simplified baseline and monitoring methodology for small-scale afforestation
and reforestation project activities under the clean development mechanism implemented on
lands having low inherent potential to support living biomass;
AR-AMS0006 Simplified baseline and monitoring methodology for small-scale silvopastoral
– afforestation and reforestation project activities under the clean development mechanism;
and,
AR-AMS0007 Simplified baseline and monitoring methodology for small-scale A/R CDM
project activities implemented on grasslands or croplands.
AR-AMS0003 is applicable for mangrove areas but does not allow for change in the hydrological
process, because of CH4 and NOx emissions from rewetting land (DFN 2010). Many mangrove areas
have been degraded by wood cutting for fuel wood and charcoal production and the methodology is
aimed at A/R projects in such degraded mangroves. Otherwise, in areas where land has been converted
following degradation to other uses by bunding for agricultural production or excavation and
construction of dykes for aquaculture, the methodology would not be applicable.
Importantly, the following eligibility criteria which apply for AR-AMS0003, include the following:10
8 http://cdm.unfccc.int/methodologies/ARmethodologies/tools/ar-am-tool-16-v1.pdf
9 http://cdm.unfccc.int/methodologies/documentation/meth_booklet.pdf
10 http://cdm.unfccc.int/methodologies/DB/Y77PTS8P50VTJBHQ46A06GZ6EZSIVL
15
Project activities conform to applicable national policies and legislation for wetlands;
Afforestation or reforestation is on degraded wetlands, which may be subject to further
degradation and have a tree and / or non tree component that is declining or in a low carbon
steady-state;
Project activities shall not lead to changes in hydrology. (GHGs emitted from wetlands may
consist of CO2, CH4 and N2O but this condition ensures that hydrology is not changed and that
the chemical properties of the wetland soils influencing the GHG emissions therefore will not
change11
); and,
Carbon pools considered are above- and below-ground biomass (i.e. living biomass) of trees.
(soil carbon is not included).
Project participants must demonstrate that the project land is degraded and eligible for the project and
that the project activity is additional. Additionality is proved by demonstrating that the project activity
would not have occurred anyway due to the existence of barriers related to investment, institutions,
technology, local tradition, prevailing practice, ecological conditions, or social conditions.
A new CDM methodology has recently been submitted by International Union for the Conservation of
Nature, which, if approved will enable sale of carbon credits for large-scale restoration of degraded
tidal (mainly mangrove) forests. The methodology may not be commonly applicable in Asia as it
explicitly excludes ecological mangrove restoration, reclamation or displacement of fish ponds
(William Battye, pers comm.)
Project costs include project development, implementation and operational costs as well as the CDM
transaction costs. McNally et al. (2011) have estimated costs for Viet Nam as follows:
The CDM transaction costs are one-off, up-front costs for CDM registration and amount to
around US$ 160 000, including CDM consultants, validation and registration fees. Costs for
verification, which must be completed every five years, are approximately US$ 14 000.
Project development costs including designing the project, negotiating approval, consultation
with the communities, establishment of a management team and training amount to around at
least US$ 130 000.
Project implementation, including planting costs are around US$ 1 500ha-1
.
Project management and perhaps periodic inter-planting may be a further US$ 30 000 yr-1
although part of this could be paid to communities.
Over a 16 year project period, these costs come to US$ 1 562 000 for 500 hectares. This means that
for a site where sequestration rates were 20 Mt CO2e ha-1
yr-1
, a carbon credit price of U$$ 10 would
be necessary to make a project economically viable. With a rate of 30 Mt CO2e ha-1
yr-1
, a price of
US$ 7 would be necessary. With a rate of above 32 Mt CO2e ha-1
yr-1
, the project would exceed the
maximum size for a small CDM project, although the arithmetic would still apply for a voluntary
carbon project using a CDM methodology (see below).
With the current price of temporary Certified Emissions Reductions12
(tCER) of around US$ 4, only a
site where sequestration rates were over 49 Mt CO2e ha-1
yr-1
, would be profitable. It is possible that
such rates would be attainable under the right conditions and with soil carbon pools included (which
for a small project would only be possible under VCS – see below).
It should be noted that these calculations do not take into account risks such as failing to be registered,
forest loss, large scale erosion, planting failure, etc. at the same time, benefits that mangroves provide
11
IPCC Good Practice Guidance for Land Use, Land-Use Change and Forestry, available at http://www.ipcc-
nggip.iges.or.jp/public/gpglulucf/gpglulucf.html 12
tCERs are available for forestry projects under CDM and sell for around a third of the price of the standard
CERs (McNally et al. (2011). Also see: http://www.carbonpositive.net/viewarticle.aspx?articleID=1304
16
such as non-wood forest products (NWFPs), coastal protection and support for fisheries protection,
etc. are not taken into account.
There are likely to be changes in the CDM scheme after expiration of the Kyoto agreement in 2012
and as such, investment in a CDM project may be inadvisable, especially given the lack of financial
feasibility for small areas.
4.2. Voluntary Carbon Standard (VCS)
The Voluntary Carbon Standard includes forestry in the AFOLU (Agriculture, Forestry and Other
Land Uses) group of emissions reduction activities.13
Three project categories could potentially be
applied to mangroves (McNally 2011):
Afforestation, Reforestation and Revegetation (ARR). There are no VCS approved
methodology for afforestation/reforestation yet, but CDM methodologies could be used.
Reducing Emissions from Deforestation and Degradation (REDD). Projects must demonstrate a
baseline scenario and the expected reduction in carbon emissions and must also account for
leakage and permanence risks. There are three project categories:
o Avoiding planned deforestation (APD). Evidence of planned conversion is
required;
o Avoiding unplanned frontier deforestation and degradation (AUFDD); and
o Avoiding unplanned mosaic deforestation and degradation (AUMDD).
Improved Forest Management (IFM). There are four project categories:
o Conversion from conventional logging to reduced impact logging (RIL);
o Conversion of logged forests to protected forests (LtPF);
o Extending the rotation age of evenly aged managed forests; and,
o Conversion of low-productive forests to high-productive forests (LtHP).
If forest degradation is legally sanctioned, then stopping forest degradation (e.g. logging) is an eligible
activity under IFM, otherwise it qualifies under REDD. Different project categories can be combined
into a single project.
Currently approved VCS methodologies in different categories include:
VM0003 Methodology for Improved Forest Management through Extension of Rotation Age;
VM0004 Methodology for Conservation Projects that Avoid Planned Land Use Conversion in
Peat Swamp Forests;
VM0005 Methodology for Conversion of Low-productive Forest to High-productive Forest;
VM0006 Methodology for Carbon Accounting in Project Activities that Reduce Emissions
from Mosaic Deforestation and Degradation;
VM0007 REDD Methodology Modules (REDD-MF); and,
VM0009 Methodology for Avoided Mosaic Deforestation of Tropical Forests.
CDM A/R methodologies are also eligible under VCS. A number of additional methodologies are
under development, although no methodologies relate specifically to mangroves. A ―Peatland
Rewetting and Conservation‖ (PRC) category was, however, issued for public consultation 19 May
13
The ―Voluntary Carbon Standard 2007.1‖ provides general guidance for developing VCS projects. The
―Guidance for Agriculture, Forestry and Other Land Use Projects‖ provides specific guidance to AFOLU
projects.
17
2010 with final release targeted for January 2011.14
This methodology may be useful for mangrove
rewetting as, in some cases, mangroves are considered peatlands. In order to use the PRC guidelines,
a project area should meet the definition of peatland.15
At the time of writing, VCS had not heard of any proposals to develop a REDD methodology with the
inclusion of soil carbon, which would fall under both the REDD and PRC categories.
There are several important differences between CDM and VCS (MvNally et al. 2011).
Registration with the VCS is less complex and less time consuming than CDM and transaction
costs are lower.
VCS forestry projects adopt a buffer approach to impermanence which serves to reduce
revenues per hectare.
VCS allows consideration of all carbon pools even for small-scale projects, including above-
ground biomass, below ground biomass, dead wood, litter, soil carbon and wood products.
Under VCS, AFOLU projects can have a crediting period from 20 to 100 years (compared to 16
years on a renewable basis or 30 years on a one-off basis for AR CDM projects).
The VCS scheme is voluntary and is thus not limited to the term of the Kyoto Protocol.
Projects on land converted from ‗native ecosystems‘ within 10 years prior to the project start
date are not eligible under the VCS, while under the CDM, land that has been ‗forest‘ in the
period since 1989 is not eligible for reforestation.
VCS has a buffer approach to managing risk associated with impermanence in forestry activities.
Under this approach, a proportion of the carbon credits may not be sold until risk is proven to be low.
The required buffer may be as high as 60% where risk is judged to be high and only 10% of the buffer
can be released every five years if risks are proven to be low. The price of the resulting credits has
proven to be higher than that of the temporary Certified Emissions Reductions (tCERs) sold under the
CDM for forestry projects.
Set-up costs for VCS projects can be considerable although projects are commonly believed to be less
complex than under the CDM. A large VCS project in lowland forest in Cambodia is estimated to
have cost US$ 300 000 – US$ 400 000 (Tom Evans pers. comm.). As such, it is likely to be
uneconomically feasible to certify small projects unless costs could be considerably reduced through
availability of existing inventory data or if the potential emissions reductions were very large and
immediate (e.g. cancellation of a shrimp farm zoning decision that would reverse an expected 100%
deforestation event in the space of a few years).
4.3. Key considerations
The main considerations in applying for carbon verification are high set-up costs, insufficient
methodological development and a lack of knowledge of carbon cycling in mangrove ecosystems, on
the one hand, and low carbon prices on the other. More general risks identified in investing in forest
carbon have recently been identified by Forest Trends (2011, Box 1).
The average sale price of forest credits cited by Chenost et al. (2010) was 3 Euros (~US$ 3.9) per Mt
CO2e for CDM and 4.7 (US$ 6.1) per Mt CO2e for voluntary over-the-counter markets16
. Given that
14
http://www.v-c-s.org/docs/VCS-Program-PRC-Public-Consultation-Document.pdf 15
Peatlands are a subset of the FAO class of histosols (or: organic soils). The FAO (2006/7) definition of
organic soil (histosol) is complex; it refers to thickness of soil layers and organic content in relation to their
origin, underlying material, clay content and water saturation. Under the VCS PRC, a peatland is an area with a
layer of naturally accumulated organic material (peat) of at least 30 cm in thickness at the surface (excluding the
plant layer), which consists of at least 30% organic material by dry weight. Peat originates because of water
saturation. Peat soil is either saturated with water for long periods or (artificially) drained. (PRC public
consultation document: http://www.v-c-s.org/docs/VCS-Program-PRC-Public-Consultation-Document.pdf) 16
US$ conversions assume exchange rate of US$1.3 per Euro.
18
international negotiations on a post-Kyoto climate change mitigation mechanism are progressing only
slowly and large global emitters and potential buyers of carbon are demonstrating reluctance in
agreeing to deep cuts in emissions, while major carbon markets look set to remain relatively closed to
forest related carbon credits (e.g. European Emissions Trading Scheme), carbon prices are not set to
increase rapidly. The global economic slowdown is also likely to keep carbon prices low and as such
times for investing could be better.
Murray et al. (2011) estimated that, assuming costs at upper bounds, returns on mangrove protection at
carbon prices of US$ 5 per Mt CO2e are negative in 40-50% of mangrove countries and around 15%
of countries at carbon prices of US$ 15. The costs of protection used were mean values for each
country and consisted of protected-area establishment and management costs plus opportunity costs.
The study did not, however, take into account the high transaction costs of bringing carbon to market
and the negative correlation between opportunity costs of land and quality of institutional
environments. As such, mangrove protection costs may be raised in countries with low opportunity
costs by costs associated with institutional inefficiencies.
Box 1. The key risks identified by stakeholders in investing in forest carbon.
(1) uncertainty around whether or not regulatory markets will include forest carbon, which has
adversely affected demand;
(2) a lack of clarity on legal issues associated with project design and transactions; and,
(3) a lack of approved methodologies for measuring forest carbon in the voluntary market.
Additionally, projects have high costs associated with carbon measurement and forest management
that are borne prior to assessment of potential revenues.
It remains to be seen whether key up-front costs will continue be borne primarily by philanthropic and
public sector sources, or whether the private sector will engage more actively and broadly.
Source: Forest Trends (2011)
In Viet Nam, McNally et al. (2011) identified the following critical issues:
The willingness of the local People‘s Committee to devolve ownership and power over
mangrove areas to local people, particularly when competing with other potential lucrative uses
of the tidal flats such as renting/selling to clam or aquaculture farmers;
The problem of allocating limited areas of mangrove forest between large numbers of
households due to dense populations in most coastal areas and the current use of the mangrove
areas by many households (this would support community, rather than household allocation);
The need to provide sufficient incentives per hectare of forest to the local management team to
ensure that the mangroves are adequately protected and tended (based on CER revenue sharing
and rights to other benefits from the mangroves (such as deadwood, aquatic products etc.); and,
The exclusion of some households from mangrove areas in order to have clearly defined
beneficiaries, particularly those who are traditional users of the area and those who need to go
through the mangroves to access the bare inter-tidal flats and fishing grounds. It could be the
landless poor are most affected.
Taking into account these risks and complexities and in view of the mangrove resources in RFLP
countries and the needs of the project to provide livelihood benefits to fishing communities,
recommendations are given in the next section.
19
5. Recommendations
Given the mangrove resource situation in the six RFLP countries, the current state of knowledge of
carbon cycling in mangroves, the current state of carbon verification standards and the current and
likely future prices of carbon, it is recommended that efforts are made to develop potential
mechanisms enabling coastal communities to benefit financially from mangrove related activities.
For example the following steps could be considered:
Identify potential mangrove areas and consult with stakeholders to determine interest;
Provide livelihoods support through traditional mangrove related activities and alternative
means (e.g. disaster risk reduction) in association with (a) national NGO(s) or local
government;
Facilitate agreement over mangrove restoration/conservation between authorities and the local
community;
Identify possible (a) corporate17
entity/ies to provide sponsorship and facilitate agreement
with the local community and authorities over payment for mangrove conservation;
Identify inter-governmental or (a) civil society institution(s) to act provide local technical
support and act as intermediary;
Work with consultants to:
a. Work towards carbon accreditation including addressing any methodological issues,
and also work towards accreditation with social and environmental standards (e.g.
CCB); or
b. Develop an alternative lower cost accreditation framework that does not yield carbon
credits, but provides a socially and environmentally sound ‗sustainable development
product‘ focussing on payments for mangrove protection and aimed at corporate
buyers.
Option b. may prove the only economically feasible alternative where mangrove areas are less than
1 000 – 2 000 hectares. The exception would be in an area of mangroves planned for conversion to
aquaculture where large amounts of carbon could be released although, even under these
circumstances methodological developments to existing carbon accounting frameworks would be
necessary.
More generally, given the variability of mangrove forests and the environmental, social and
environmental situations in which they exist, it is of great importance to locate potential field sites
such that interventions can be designed with specific situations in mind, e.g. potential sequestration
rates, threats to existing carbon, local support, etc. The backing of local people and of authorities will
also be of primary importance in developing projects. The existence of clear alternative economic and
non-economic benefits from mangroves is further likely to support project success, as will the levels of
interest and demand from the local communities and authorities.
17 Corporate support for mangrove-carbon projects has also been provided, most notably by Danone,
which has set up a funding mechanism and supported various international meetings. Others may
become interested as confidence grows and ad hoc agreements between corporate entities and
mangrove stakeholders could take many forms.
20
6. References
Blomley, T. Tola, P., Kosal, M., Dyna, E. and Dubois, M. 2010. Review of Community Forestry and
Community Fisheries in Cambodia. Report prepared for the Natural Resource Management and
Livelihoods Programme.
Bouillon, S., et al. (2008), Mangrove production and carbon sinks: A revision of global budget
estimates, Global Biogeochem. Cycles, 22, GB2013, doi:10.1029/2007GB003052.
Chenost, et al. 2010. Bringing Forest Carbon Projects to the Market. UNEP.
Chmura, G. L., Anisfeld, S. C., Cahoon, D. R., and Lynch, J. C. 2003 Global carbon sequestration in
tidal, saline wetland soils, Global Biogeochem. Cycles, 17(4), 1111, doi:10.1029/2002GB001917.
Chomitz, K.M. 2007. At loggerheads?: agricultural expansion, poverty reduction, and environment in
the tropical forests. World Bank Policy Research Report.
Chong, V.C. (2007) Mangroves-fisheries linkages—the Malaysian perspective. Bulletin of Marine
Science, 80(3): 755–772, 2007.
Dahuri, R. 2007. Pre-and post-tsunami coastal planning and land-use policies and issues in Indonesia.
Proceedings of the workshop on coastal area planning and management in Asian tsunami-affected
countries, Bangkok, Thailand, 27-29 September 2006.
Danone Fund for Nature. 2010. Achieving Carbon Offsets through Mangroves and Other Wetlands.
November 2009 Expert Workshop Meeting Report, ed. Nick Davidson. Danone Group/IUCN/ Ramsar
Convention Secretariat, Gland, Switzerland. 87pp
Dittmar, T., N. Hertkorn, G. Kattner, and R. J. Lara (2006), Mangroves, a major source of dissolved
organic carbon to the oceans, Global Biogeochem. Cycles, 20, GB1012, doi:10.1029/2005GB002570.
FAO, 2003. Status and trends in mangrove area extent worldwide. By Wilkie, M.L. and Fortuna, S.
Forest Resources Assessment Working Paper No. 63. Forest Resources Division. FAO, Rome.
http://www.fao.org/docrep/007/j1533e/j1533e00.HTM
Food and Agriculture Organization of the United Nations (FAO). 2006c. Coastal protection in the
aftermath of the Indian Ocean tsunami: What role for forests and trees? Proceedings of the regional
technical workshop, Khao Lak, Thailand, 28-31 August 2006. Available at
http://www.fao.org/forestry/coastalprotection@88833/en/
Food and Agriculture Organization of the United Nations (FAO). 2008a. Intact mangroves could have
reduced Nargis damage. Press release 8 May 2008. Available at
http://www.fao.org/newsroom/en/news/2008/1000839/index.html
Food and Agriculture Organization of the United Nations (FAO). 2010. Global forest resources
assessment 2010. Rome, FAO. Available at www.fao.org/forestry/fra2010).
Forbes, K. & Broadhead, J.S. 2007. The role of coastal forests in the mitigation of tsunami impacts.
Bangkok,FAO. Available at http://www.fao.org/forestry/media/14561/1/0/
Forest Science Institute of Viet Nam (FSIV). 2009. Viet Nam forestry outlook study. Bangkok, FAO
Regional Office for Asia and the Pacific.
Forest Trends 2011. Investing in Forest Carbon: Lessons from the First 20 Years. Forest Trends, The
Katoomba Group, Ecosystem Marketplace, and Bio-Logical Capital.
Hamilton, K., Sjardin, M., Marcello, T. & Xu, G. 2008. Forging a frontier: state of the voluntary
carbon markets 2008. Ecosystem Market Place & New Carbon Finance. Available at
http://www.ecosystemmarketplace.com/documents/cms_documents/2008_StateofVoluntaryCarbonMa
rket2.pdf
Hawkins, S., et al. 2010. Roots in the Water: Legal Frameworks for Mangrove PES in Vietnam.
Katoomba Group‘s Legal Initiative Country Study Series. Forest Trends: Washington, DC.
21
Kauffman, J.B., Heider, C., Cole, T.G. Dwire, K.A. and Donato, D.C. (in prep) Ecosystem carbon
stocks of Micronesian mangrove forests. In preparation for submission to WETLANDS.
Kristensen, E., Bouillon, S., Dittmar, T., Marchand, C., 2008. Organic carbon dynamics in mangrove
ecosystems: A review. Aquat. Bot. 89, 201–219.
Lekphet, S., Adsavakulchai, S., Towprayoon, S., Chidthaisong, and Nitisoravut, S. 2003. Methane
emission from mangrove area in Thailand. Proceedings of the 2nd. Regional Conference on Energy
Technology Towards a Clean Environment, February 12-14, Phuket, Thailand.
Lekphet, S., Nitisoravut, S. and Adsavakulchai, S. 2005. Estimating methane emissions from
mangrove area in Ranong Province, Thailand. Songklanakarin J. Sci. Technol. 27(1) : 153-16.
http://www.rdoapp.psu.ac.th/html/sjst/journal/27-1/15methane.pdf
Mangroves for the Future (MMF) 2008a. Policy Brief on Governance and Integrated. Coastal
Management. Indonesia.
Mangroves for the Future (MMF) 2008b. Policy Brief on Governance and Integrated. Coastal
Management. Sri Lanka.
Matsui, N,, Suekuni, J., Nogami, M., Havanond, S., and Salikui, P. 2010. Mangrove rehabilitation
dynamics and soil organic carbon changes as a result of full hydraulic restoration and regrading of a
previously intensively managed shrimp pond. Wetlands Ecol. Manage. 18:233-242.
Matsui N., and Yamatani, Y. (2000) Estimated total stocks of sediment carbon in relation to
stratigraphy underlying the mangrove forests of Sawi Bay. Phuket Mar Biol Cent Spec Publ 22:15–25
McNally, R., McEwin, A., Holland, T. (2011) The Potential for Mangrove Carbon Projects in Viet
Nam. SNV, Viet Nam.
Middleton, B. A., and K. L. McKee, Degradation of mangrove tissues and implications for peat
formation in Belizean island forests, J. Ecol., 89, 818–828, 2001.
Miyajima, T., Y. Tsuboi, Y. Tanaka, and I. Koike (2009), Export of inorganic carbon from two
Southeast Asian mangrove forests to adjacent estuaries as estimated by the stable isotope composition
of dissolved inorganic carbon, J. Geophys. Res., 114, G01024, doi:10.1029/2008JG000861.
Murdiyarso, D. and Adiningsih, E.S. 2007 Climate anomalies, Indonesian vegetation fires and
terrestrial carbon emissions. Mitigation and Adaptation Strategies for Global Change 12: 101–112.
Murdiyarso, D., Donato, D., Kauffman, J.B., Kurnianto, S., Stidham, M., Kanninen, M. (2009) Carbon
storage in mangrove and peatland ecosystems: A preliminary account from plots in Indonesia. CIFOR
Working Paper 48.
Murray, B.C., Pendleton, L. Jenkins, W.A., and Sifleet, S. 2011. Green Payments for Blue Carbon:
Economic Incentives for Protecting Threatened Coastal Habitats. Nicholas Institute for Environmental
Policy Solutions. Duke University.
Neeff, T. & Henders, S. 2007. Guidebook to markets and commercialization of forestry CDM projects.
CATIE. Available at
http://www.proyectoforma.com/Documentos/GuidebooktoMarketsandCommercializationofCDMfores
tryProjects.pdf
Okimoto Y., Nose, A., Ikeda, K., Agarie, S., Oshima, K., Tateda, Y., Ishii, T., Nhan, D.D. 2008. An
estimation of CO2 fixation capacity in mangrove forest using two methods of CO2 gas exchange and
growth curve analysis. Wetlands Ecol Manage 16:155–171.
Ong, J.E. (1993). Mangroves – a carbon source and sink. Chemosphere 27: 1097-1107.
Ong, J. E., Gong, W. K. & Clough, B. 1995. Structure and productivity of a 20 year -old stand of
Rhizophora apiculata mangrove forest. J . Biogeography 22: 417-424.
Raffensperger, L. 2007. Part IV: the role of deforestation in climate change. Available at
http://earthtrends.wri.org/updates/node/266
22
Ramaswamy, V., O. Boucher, J. Haigh, D. Hauglustaine, J. Haywood, G. Myhre, T. Nakajima, G. Y.
Shi, and S. Solomon. 2001. Radiative forcing of climate, in Climate Change 2001: The Scientific
Basis, Contribution of Working Group I to the Third Assessment Report of the Intergovernmental
Panel on Climate Change, edited by J. T. Houghton et al., chap. 6, pp. 349– 416, Cambridge Univ.
Press, New York.
RGC 2010b The Strategic Planning Framework for Fisheries: 2010 – 2019.
Robledo, C. & Blaser, J. 2008. Key issues on land use, land use change and forestry (LULUCF) with
an emphasis on developing country perspectives. UNDP. Available at:
http://www.undp.org/climatechange/docs/English/UNDP_LULUCF_final.pdf
Samaranayake, R.A.D.B. 2007. Pre-and post-tsunami coastal planning and land-use policies and issues
in Sri Lanka. Pre-and post-tsunami coastal planning and land-use policies and issues in Indonesia.
Proceedings of the workshop on coastal area planning and management in Asian tsunami-affected
countries, Bangkok, Thailand, 27-29 September 2006.
Spalding M, Kainuma, M and Collins, L. (2010) World atlas of mangroves. Earthscan, 336 pp.
Tateda, Y., Imamura, M., Ishi, T. 2007. Estimation of CO2 Sequestration Rate by Mangrove
Ecosystem Principal Research Results.
http://criepi.denken.or.jp/en/publications/annual/2005/05juten16.pdf
Wunder, S. 2007. The efficiency of payments for environmental services in tropical conservation.
Conservation Biology, 21(1): 48-58.
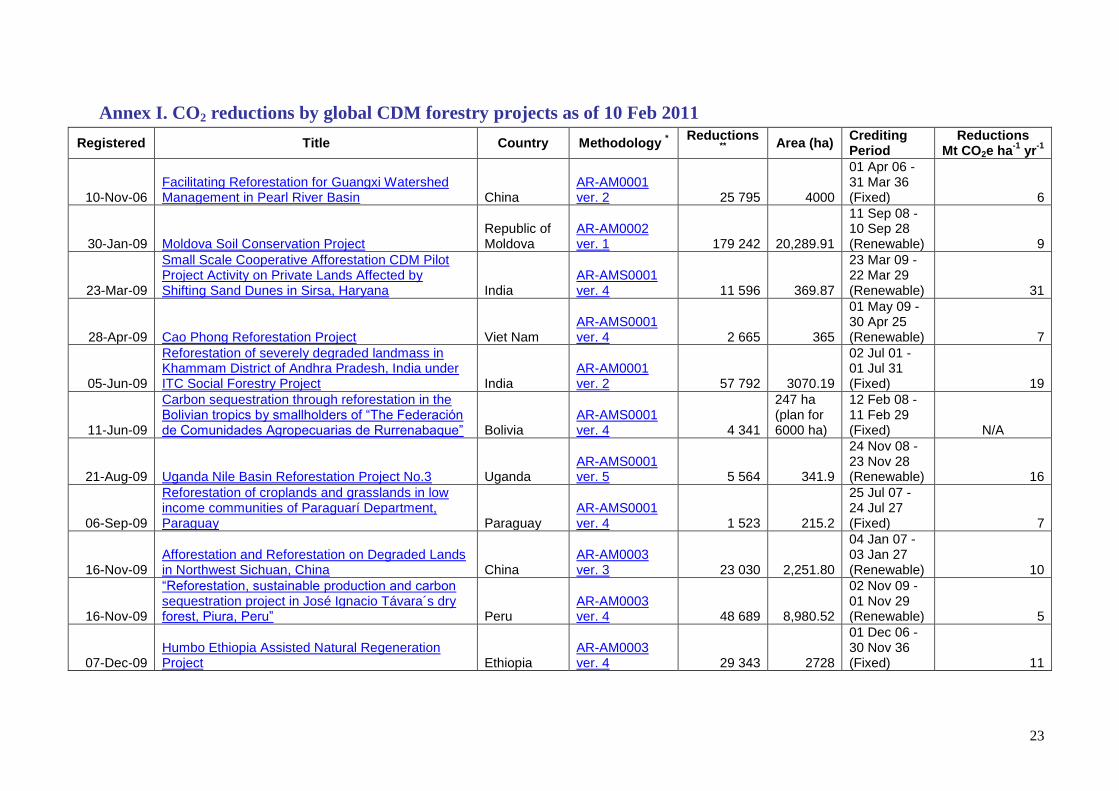
23
Annex I. CO2 reductions by global CDM forestry projects as of 10 Feb 2011
Registered Title Country Methodology *
Reductions **
Area (ha) Crediting Period
Reductions Mt CO2e ha
-1 yr
-1
10-Nov-06 Facilitating Reforestation for Guangxi Watershed Management in Pearl River Basin China
AR-AM0001 ver. 2 25 795 4000
01 Apr 06 - 31 Mar 36 (Fixed) 6
30-Jan-09 Moldova Soil Conservation Project Republic of Moldova
AR-AM0002 ver. 1 179 242 20,289.91
11 Sep 08 - 10 Sep 28 (Renewable) 9
23-Mar-09
Small Scale Cooperative Afforestation CDM Pilot Project Activity on Private Lands Affected by Shifting Sand Dunes in Sirsa, Haryana India
AR-AMS0001 ver. 4 11 596 369.87
23 Mar 09 - 22 Mar 29 (Renewable) 31
28-Apr-09 Cao Phong Reforestation Project Viet Nam AR-AMS0001 ver. 4 2 665 365
01 May 09 - 30 Apr 25 (Renewable) 7
05-Jun-09
Reforestation of severely degraded landmass in Khammam District of Andhra Pradesh, India under ITC Social Forestry Project India
AR-AM0001 ver. 2 57 792 3070.19
02 Jul 01 - 01 Jul 31 (Fixed) 19
11-Jun-09
Carbon sequestration through reforestation in the Bolivian tropics by smallholders of “The Federación de Comunidades Agropecuarias de Rurrenabaque” Bolivia
AR-AMS0001 ver. 4 4 341
247 ha (plan for 6000 ha)
12 Feb 08 - 11 Feb 29 (Fixed) N/A
21-Aug-09 Uganda Nile Basin Reforestation Project No.3 Uganda AR-AMS0001 ver. 5 5 564 341.9
24 Nov 08 - 23 Nov 28 (Renewable) 16
06-Sep-09
Reforestation of croplands and grasslands in low income communities of Paraguarí Department, Paraguay Paraguay
AR-AMS0001 ver. 4 1 523 215.2
25 Jul 07 - 24 Jul 27 (Fixed) 7
16-Nov-09 Afforestation and Reforestation on Degraded Lands in Northwest Sichuan, China China
AR-AM0003 ver. 3 23 030 2,251.80
04 Jan 07 - 03 Jan 27 (Renewable) 10
16-Nov-09
“Reforestation, sustainable production and carbon sequestration project in José Ignacio Távara´s dry forest, Piura, Peru” Peru
AR-AM0003 ver. 4 48 689 8,980.52
02 Nov 09 - 01 Nov 29 (Renewable) 5
07-Dec-09 Humbo Ethiopia Assisted Natural Regeneration Project Ethiopia
AR-AM0003 ver. 4 29 343 2728
01 Dec 06 - 30 Nov 36 (Fixed) 11
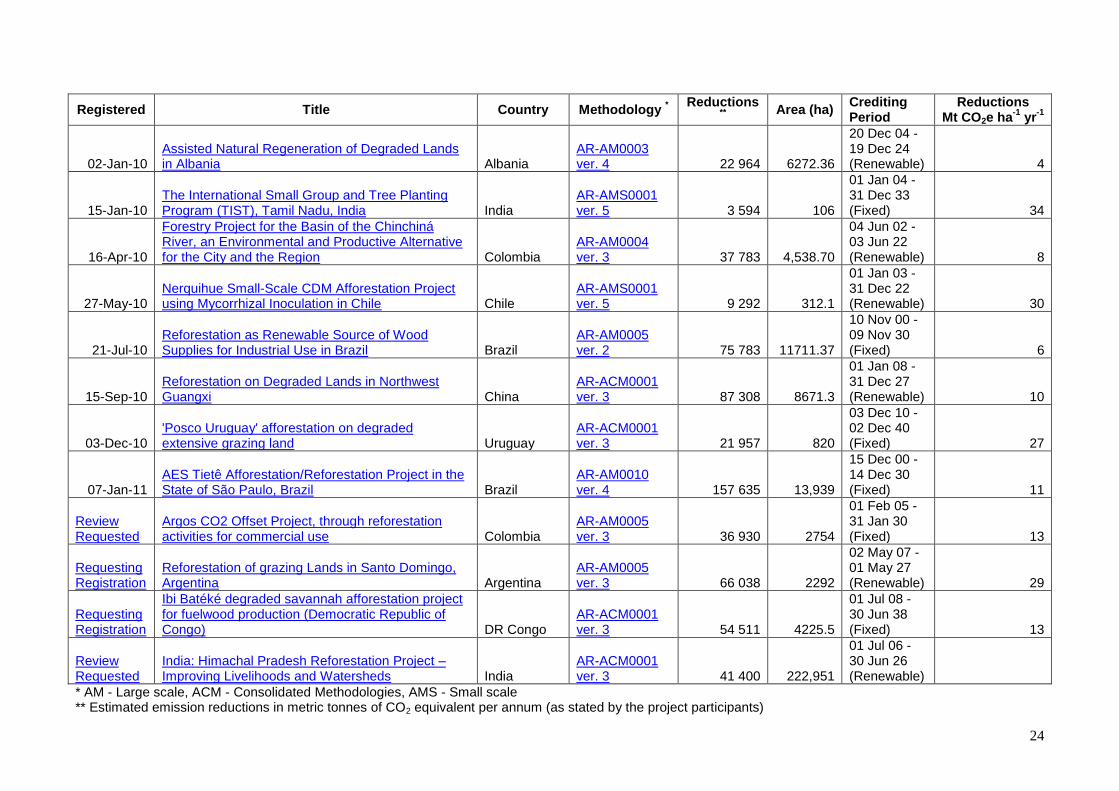
24
Registered Title Country Methodology *
Reductions **
Area (ha) Crediting Period
Reductions Mt CO2e ha
-1 yr
-1
02-Jan-10 Assisted Natural Regeneration of Degraded Lands in Albania Albania
AR-AM0003 ver. 4 22 964 6272.36
20 Dec 04 - 19 Dec 24 (Renewable) 4
15-Jan-10 The International Small Group and Tree Planting Program (TIST), Tamil Nadu, India India
AR-AMS0001 ver. 5 3 594 106
01 Jan 04 - 31 Dec 33 (Fixed) 34
16-Apr-10
Forestry Project for the Basin of the Chinchiná River, an Environmental and Productive Alternative for the City and the Region Colombia
AR-AM0004 ver. 3 37 783 4,538.70
04 Jun 02 - 03 Jun 22 (Renewable) 8
27-May-10 Nerquihue Small-Scale CDM Afforestation Project using Mycorrhizal Inoculation in Chile Chile
AR-AMS0001 ver. 5 9 292 312.1
01 Jan 03 - 31 Dec 22 (Renewable) 30
21-Jul-10 Reforestation as Renewable Source of Wood Supplies for Industrial Use in Brazil Brazil
AR-AM0005 ver. 2 75 783 11711.37
10 Nov 00 - 09 Nov 30 (Fixed) 6
15-Sep-10 Reforestation on Degraded Lands in Northwest Guangxi China
AR-ACM0001 ver. 3 87 308 8671.3
01 Jan 08 - 31 Dec 27 (Renewable) 10
03-Dec-10 'Posco Uruguay' afforestation on degraded extensive grazing land Uruguay
AR-ACM0001 ver. 3 21 957 820
03 Dec 10 - 02 Dec 40 (Fixed) 27
07-Jan-11 AES Tietê Afforestation/Reforestation Project in the State of São Paulo, Brazil Brazil
AR-AM0010 ver. 4 157 635 13,939
15 Dec 00 - 14 Dec 30 (Fixed) 11
Review Requested
Argos CO2 Offset Project, through reforestation activities for commercial use Colombia
AR-AM0005 ver. 3 36 930 2754
01 Feb 05 - 31 Jan 30 (Fixed) 13
Requesting Registration
Reforestation of grazing Lands in Santo Domingo, Argentina Argentina
AR-AM0005 ver. 3 66 038 2292
02 May 07 - 01 May 27 (Renewable) 29
Requesting Registration
Ibi Batéké degraded savannah afforestation project for fuelwood production (Democratic Republic of Congo) DR Congo
AR-ACM0001 ver. 3 54 511 4225.5
01 Jul 08 - 30 Jun 38 (Fixed) 13
Review Requested
India: Himachal Pradesh Reforestation Project – Improving Livelihoods and Watersheds India
AR-ACM0001 ver. 3 41 400 222,951
01 Jul 06 - 30 Jun 26 (Renewable)
* AM - Large scale, ACM - Consolidated Methodologies, AMS - Small scale ** Estimated emission reductions in metric tonnes of CO2 equivalent per annum (as stated by the project participants)
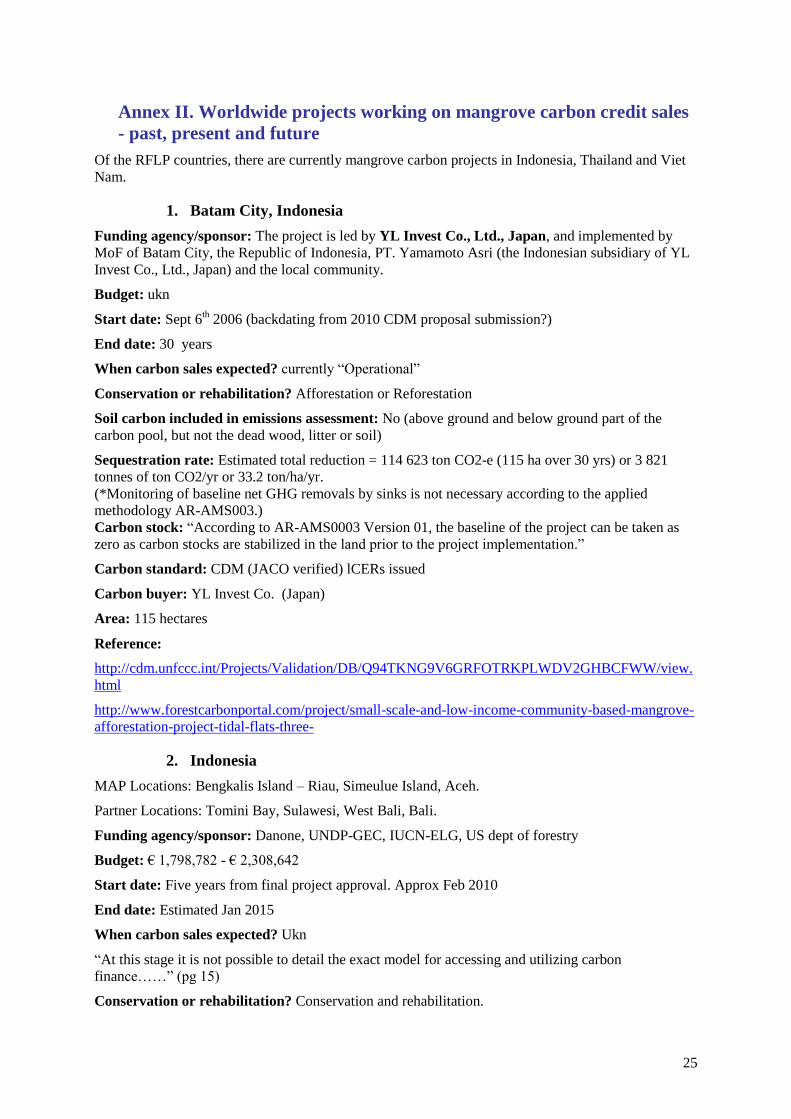
25
Annex II. Worldwide projects working on mangrove carbon credit sales
- past, present and future
Of the RFLP countries, there are currently mangrove carbon projects in Indonesia, Thailand and Viet
Nam.
1. Batam City, Indonesia
Funding agency/sponsor: The project is led by YL Invest Co., Ltd., Japan, and implemented by
MoF of Batam City, the Republic of Indonesia, PT. Yamamoto Asri (the Indonesian subsidiary of YL
Invest Co., Ltd., Japan) and the local community.
Budget: ukn
Start date: Sept 6th 2006 (backdating from 2010 CDM proposal submission?)
End date: 30 years
When carbon sales expected? currently ―Operational‖
Conservation or rehabilitation? Afforestation or Reforestation
Soil carbon included in emissions assessment: No (above ground and below ground part of the
carbon pool, but not the dead wood, litter or soil)
Sequestration rate: Estimated total reduction = 114 623 ton CO2-e (115 ha over 30 yrs) or 3 821
tonnes of ton CO2/yr or 33.2 ton/ha/yr.
(*Monitoring of baseline net GHG removals by sinks is not necessary according to the applied
methodology AR-AMS003.)
Carbon stock: ―According to AR-AMS0003 Version 01, the baseline of the project can be taken as
zero as carbon stocks are stabilized in the land prior to the project implementation.‖
Carbon standard: CDM (JACO verified) lCERs issued
Carbon buyer: YL Invest Co. (Japan)
Area: 115 hectares
Reference:
http://cdm.unfccc.int/Projects/Validation/DB/Q94TKNG9V6GRFOTRKPLWDV2GHBCFWW/view.
html
http://www.forestcarbonportal.com/project/small-scale-and-low-income-community-based-mangrove-
afforestation-project-tidal-flats-three-
2. Indonesia
MAP Locations: Bengkalis Island – Riau, Simeulue Island, Aceh.
Partner Locations: Tomini Bay, Sulawesi, West Bali, Bali.
Funding agency/sponsor: Danone, UNDP-GEC, IUCN-ELG, US dept of forestry
Budget: € 1,798,782 - € 2,308,642
Start date: Five years from final project approval. Approx Feb 2010
End date: Estimated Jan 2015
When carbon sales expected? Ukn
―At this stage it is not possible to detail the exact model for accessing and utilizing carbon
finance……‖ (pg 15)
Conservation or rehabilitation? Conservation and rehabilitation.
26
Soil carbon included in emissions assessment: yes
Sequestration rate: 2.4 ton-C ha-1 year-1 estimated for Indonesia.
Minimum of 500 ha and maximum of 1000 ha restored will result in 1000-2000 tons/CO2/yr for the
life of the certificate (25 yr avg)
Minimum of 1000 ha conserved (minimum carbon stock of 700,000 tons and maximum of 1,400,000
tonnes)
Maximum of 3000 ha conserved with minimum carbon stock of 2,100,000 tonnes and maximum total
carbon stock of 4,200,000 tonnes.
Carbon stock: 700 tonnes/ha degraded and 1,400 tonnes/ha rehabilitated
Carbon standard: VCS, with additional Climate Community and Biodiversity Alliance verification.
Carbon buyer: Danone? (―aim for REDD project‖ pg 15)
Area: 1500 to 15, 000 hectares +
Reference:
http://www.cbd.int/lifeweb/eoi/map%20concept%20paper%20for%20danone%20group.pdf
*Interesting info about restoration of Bali mangrove forest costing $60,000 a hectare. MAP-
Indonesia‘s average cost is $1000/ha. Pg 7
3. Weru River basin in Chanthaburi province, Thailand
Funding agency/sponsor: Ministry of Natural Resources and Environment, Greenhouse Gas
Management Organisation
Budget: ukn
Start date: (news article Nov 28, 2010) area earmarked, pilot project planned
End date: ukn
When carbon sales expected? ukn
Conservation or rehabilitation? conservation
Soil carbon included in emissions assessment: ukn
Sequestration rate: ―it is believed‖ one rai of forest can absorb 2.7 tonnes of carbon a year. This
equates to 16.875 tonnes carbon/ha/yr.
12 Euros per 0.4 acre on average according to enews article below. This equates to 74 Euros (~$101)
per hectare or 118 611 for the whole area.
Carbon stock: ukn
Carbon standard: CDM? ―Thailand has not signed up but is undertaking voluntary carbon exchange
in various fields, without the verification and price controls required under the UNFCCC‖
Carbon buyer: In Thailand, there is still no carbon market related to the selling and buying of carbon
credits, but there are OTC trades taking place, in which developers of CDM projects and countries
within the Annex I are trading credits through delegates, financial funds, and brokers.
Area: 10,000 rai (1600 ha)
Reference: http://www.tgo.or.th/english/index.php?option=com_content&task=section&id=6&Itemid=30
http://www.nationmultimedia.com/home/2009/07/29/national/Boost-for-Thai-carbon-credit-
30108570.html
http://www.bangkokpost.com/news/local/208461/carbon-trading-pilot-begins
27
http://enews.mcot.net/view.php?id=11043
4. Kien Giang, Mekong Delta, Phu Quoc Island, Vietnam
Funding agency/sponsor: Google Earth (implemented by: CartOng, and GTZ. REDD pilot)
Feasibility study funded by: GTZ (GIZ) and AusAID
Not much information. Project may have been discontinued.
Budget:
Start date: Feasibility study July – Nov 2009
End date:
When carbon sales expected?
Conservation or rehabilitation? Reforestation, REDD?
Soil carbon included in emissions assessment:
Sequestration rate:
Carbon stock:
Carbon standard:
Carbon buyer:
Area:
Reference:
http://www.gtz-mnr.org.vn/index.php?option=com_content&task=view&id=124&Itemid=9
http://www.ausaid.gov.au/vietnam/projects/kiengiang.cfm
(this one doesn‘t mention Carbon Credits but is in the same area with the same organisations so should
be the same project?)
5. Sine Saloum and Casamance deltas, Senegal
Funding agency/sponsor: Danone Fund for Nature (DFN, with IUCN and Ramsar). Implementation
by Oceanium.
The Ramsar Convention is using the project activities as a pilot to promote wetlands environmental
services in the framework of Climate Change mitigation.
Budget: ukn
Start date: Project activity started 25/02/2008
Proposal to CDM, Nov 10, 2010
End date: 30 years
When carbon sales expected? this year?
Conservation or rehabilitation? Reforestation, restoration
Soil carbon included in emissions assessment: No (above ground and below ground part of the
carbon pool, but not the dead wood, litter or soil)
Sequestration rate: The net anthropogenic GHG removals by sinks as a result of the proposed A/R
CDM project activity is anticipated to be around 67,850.90 tons of CO2 equivalent during the first
crediting period (between 2008 and 2037)
Annual average predicted: 2,262 tonnes of CO2e
Equivalent to 1.33 tonnes of CO2e/ha/yr
28
Carbon stock: Degraded wetlands, where changes in the carbon stocks in living biomass pool of
trees and non-tree vegetation are assumed to be zero in the absence of project activity.
Carbon standard: CDM (tCERs)
Carbon buyer: Danone
Area: 1700 ha (plant 10000 trees/ha, thin to ~600 trees/ha after 6 years)
Reference:
http://cdm.unfccc.int/Projects/Validation/DB/RBOVN64H2NX9E4NB9MSDZ9369YYKLZ/view.htm
l
*Methodology info:
―the first registered project worldwide using AR-AMS0003.‖
TARASM: (which considers all the equations of AR-ASM0003)
http://wbcarbonfinance.org/Router.cfm?Page=BioCF&FID=9708&ItemID=9708&ft=DocLib&Catalo
gID=44971
CDM:
http://cdm.unfccc.int/methodologies/DB/Y77PTS8P50VTJBHQ46A06GZ6EZSIVL/view.html
6. Gazi Bay, Kenya
Funding agency/sponsor: Aviva – will pay for initial fencing and planting, along with costs of
project validation and a contribution to coordinator post.
Volunteers from: Earthwatch Institute, Kenya Marine and Fisheries Research Institute [KMFRI] and
Edinburgh Napier, Edinburgh, and Bangor Universities in the UK, CAMARV
Budget: ukn
Start date: 2009
End date: 1 year
When carbon sales expected? June 2011
Conservation or rehabilitation? Restoration
Soil carbon included in emissions assessment: yes (in woody biomass and sediment)
Sequestration rate: 2023 tCO2 benefit per annum ($12,138 potential annual income from carbon
credits)
Carbon stock: no formal attempt has been made to estimate total carbon stocks but …
―This equates to approximately 155,000 t aboveground and 23,250 t belowground (178,250 t total) in
the Gazi area. In addition, mangroves sequester around 1.5 t C/ha/yr-1 in accretion of new sediment,
and approximately 5 t C/ha/yr-1 in new biomass (for a mature forest – rates are higher for young
forests and plantations). Hence the forest sequesters an additional ~4030 t C every year.‖
Carbon standard: VCM
Carbon buyer: Plan Vivo Charity
Area: 1730 acres (170 ha)
Reference: Kenya Marine and Fisheries Research Institute (KMFRI)
http://www.camarv.org/index.html
http://www.mediaglobal.org/article/2009-10-06/carbon-trading-hits-east-africa
http://www.planvivo.org/wp-content/uploads/gazi_pin_PlanVivo_Kenya.pdf
29
http://www.kmfri.co.ke/#
7. Republic of Panama
Funding agency/sponsor: funding requested from DFN (800,000 euros), Environmental Authority of
Panama (ANAM), and TNC
Budget: 1,200,000 euros
Start date: starting before June 2010
End date: 3 years (but overall project lifetime, 22 years)
When carbon sales expected? 1 year, 1.2 years, 2 years, 2.7 years and 4 years
Conservation or rehabilitation? Restoration (1400 ha) and conservation (600 ha)
Soil carbon included in emissions assessment: unk
Sequestration rate: In 22 years 1400 ha restoration will sequester 7.84 ton C/ha/yr or 241,360 t
Carbon emissions in total (885,791 t CO2) while 600 ha REDD will (presumably) avoid 16.0 ton
C/ha/yr or 211,140 t Carbon emissions in total (744,883.8 t CO2).
Carbon stock: unk
Carbon standard: CDM, Voluntary Carbon Standard (VCS) or Climate, Community and
Biodiversity Alliance (CCB Standard).
Carbon buyer: Carbon credits will be awarded to the landowners by the National Environmental
Authority through its carbon registry. (unk buyer)
Area: 2000 hectares
Reference: http://www.cbd.int/lifeweb/project.shtml?id=8f1a5a51-d2e7-48c1-b78c-eb1ec2a040ab
8. Wetland in Cuero and Salado Wildlife Refuge (pilot area) Honduras
Funding agency/sponsor: requested from Danone Fund for Nature (DFN). Implementation by: ICF,
FUCSA, PROLANSATE and FUCAGUA).
Budget: 50,000 Euros (total project preparation financing) 600,000 Euros (budget for project
execution. Total = 650,000 Euros
Start date: (proposal dated - Oct 2009)
End date: 3 years after start date
When carbon sales expected? ukn
Conservation or rehabilitation? Conservation and restoration
Soil carbon included in emissions assessment: Yes (outline of method included)
Sequestration rate: ukn
Carbon stock: ukn
Carbon standard: VCS, the gold standard, or the FGP Platinum standard.
Carbon buyer: (DFN?)
Area: 13 000 hectares
Reference: http://www.cbd.int/lifeweb/project.shtml?id=6353e3b0-3b37-411d-9d5c-ce2c439e2a60
30
9. Solomon Islands, Island of Ranonga in Western Province, Choiseul
Province, Malaita Province
Funding agency/sponsor: AusAID (implemented by WorldFish Center)
Budget: grant of: $321,000
Start date: 1 April 2009
End date: 31 March 2012
When carbon sales expected? ukn
Conservation or rehabilitation? Restoration and conservation
Soil carbon included in emissions assessment: ukn
Sequestration rate: ukn
Carbon stock: ukn
Carbon standard: Investigating voluntary markets and CDM
Carbon buyer: ukn
Area: ukn (small pilot area to provide blueprint for protecting 50,572 hectares nationwide.)
Reference:
www.worldfishcenter.org/resource_centre/WorldFish%20project%20brief-%201945.pdf
10. Fiji, Samoa, Solomon Islands, Tonga and Vanuatu,
Funding agency/sponsor: German Federal Ministry for the Environment, Nature Conservation and
Nuclear Safety (BMU) (implemented by: IUCN- Oceania)
Budget: $3.4 million (2.3 million euro)
Start date: Dec 2009 (received funding)
End date: end of 2013
When carbon sales expected?
Conservation or rehabilitation? Conserved and/or restored
Soil carbon included in emissions assessment:
Sequestration rate:
Carbon stock:
Carbon standard:
Carbon buyer:
Area:
Reference:
http://www.friendsofmangrove.org.my/newsmaster.cfm?&menuid=45&action=view&retrieveid=45
(no mention of carbon credits)
http://www.iucn.org/about/union/secretariat/offices/oceania/oro_programmes/oro_initiatives_pmi/oro_
mescal/ (mention of carbon credits)
http://www.iucn.org/about/union/secretariat/offices/oceania/oro_newsarchive/?5610/IUCN-aids-
Pacific-Islands-to-improve-on-mangrove-management (mention of REDD)