Embed Size (px)
Citation preview
1
ALMA MATER STUDIORUM – UNIVERSITY OF BOLOGNA
SCHOOL OF ENGINEERING AND ARCHITECTURE
Department of Industrial Engineering
Second-cycle Degree in Mechanical Engineering
MASTER DEGREE THESIS
in
Internal Combustion and Hybrid Engines M
Realization of a dual clutch transmission hydraulic and
thermal model for HIL applications.
Candidate
Advisor:
Gilè Cristiano Chiar.mo Prof. Nicolò Cavina
Co.Advisors
Prof. Davide Moro
Prof. Enrico Corti
Ing. Michele Caggiano
Ing. Enrico de Palma
Academic Year 2017/18
Session III

2
3
INDEX
ABSTRACT.................................................................................................................................... 4
INTRODUCTION ......................................................................................................................... 5
1.0 ELECTRIFIED TRANSMISSION AND DUAL CLUTCH MODE OF OPERATION ... 7
1.1 Dual clutch mode of operation ............................................................................................... 7
1.1 Hybrid vehicles drivetrain .............................................................................................. 10
1.2 Series drivetrains ............................................................................................................. 10
1.3 Parallel drivetrains .......................................................................................................... 11
1.4 Series/Parallel drivetrains............................................................................................... 11
1.5 Electrified dual clutch transmissions ............................................................................. 12
2.0 HARDWARE IN THE LOOP, TESTING AND VIRTUAL CALIBRATION…………….. 14
3.0 MIL AND TRANSMISSION HYDRAULIC CIRCUIT………………………………………………….20
4.0 TESTING AND VALIDATION…………………………………………………………………………………………30
4.1 Testing and validation of the hydraulic circuit model ....................................................... 30
4.2 Testing and validation of the thermal model ...................................................................... 35
CONCLUSION AND FUTURE WORKS ……………………………………………………………………………..41
BIBLIOGRAPHY…………………………………………………………………………………………………………………….43

4
ABSTRACT
Depleting oil resources and global warming has led to a continual search in the automotive
field to find a cost-effective solution to develop more and more fuel efficient vehicles. In the
last years the number of electric and hybrid vehicles have rapidly increase thanks to pollution
standards and their high efficiency. It is possible to define three main categories, based mainly
on the power of the electric motor and the capacity of the batteries. In "mild" hybrids, a small
unit takes the place of the alternator and starter motor, and is connected to the main engine
with a belt. When it slows down, it recharges a battery, while the energy flow is reversed, and
the current motor "helps" the thermal one. The "full" hybrids have instead more powerful
electric motors that are integrated with the rest of the vehicles : they are often part of the
transmission. The "plug-ins" are "full" equipped with much larger batteries, which allow a
range of tens of kilometers without using fuel; to be able to charge them to the maximum,
however, it is necessary to connect them to the electric network through a cable. Otherwise,
these cars behave like "full" hybrids: the accumulators are filled by the inertia of the vehicle
when it slows down.
As a result of this, new concepts called hybrid dual clutch transmission (HDCT) have been
developed. These new type of transmission are suitable for multiple hybridisation topologies,
as the e-machine can be connected to the transmission by different methods in order to obtain
a more efficient interaction of the internal combustion engine and the e-machine. Compared
to an automatic transmission based on planetary gearsets or to continuous variable
transmissions (CVT), further optimisation potentials can be achieved thanks to the flexible
hybridisation concept.
This thesis aims to realize a model to calculate the heat generated by an hybrid dual clutch
transmission in real-time without a great amount of computing power.
5
INTRODUCTION
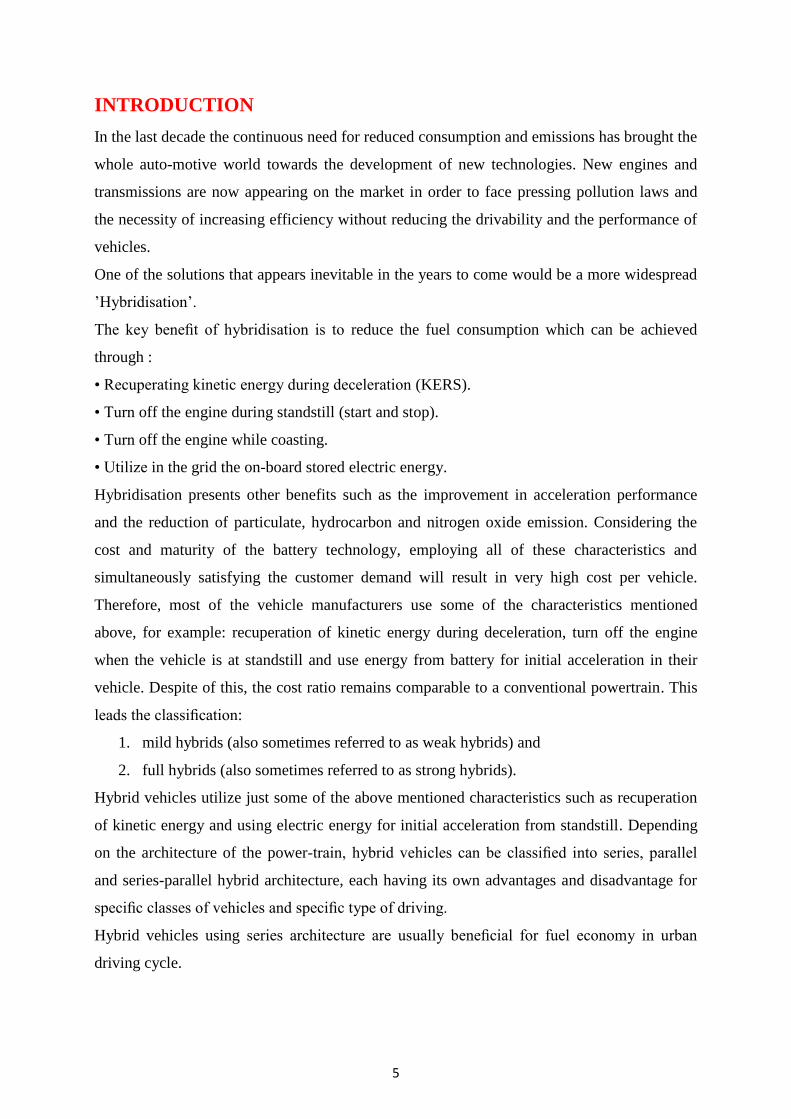
In the last decade the continuous need for reduced consumption and emissions has brought the
whole auto-motive world towards the development of new technologies. New engines and
transmissions are now appearing on the market in order to face pressing pollution laws and
the necessity of increasing efficiency without reducing the drivability and the performance of
vehicles.
One of the solutions that appears inevitable in the years to come would be a more widespread
’Hybridisation’.
The key benefit of hybridisation is to reduce the fuel consumption which can be achieved
through :
• Recuperating kinetic energy during deceleration (KERS).
• Turn off the engine during standstill (start and stop).
• Turn off the engine while coasting.
• Utilize in the grid the on-board stored electric energy.
Hybridisation presents other benefits such as the improvement in acceleration performance
and the reduction of particulate, hydrocarbon and nitrogen oxide emission. Considering the
cost and maturity of the battery technology, employing all of these characteristics and
simultaneously satisfying the customer demand will result in very high cost per vehicle.
Therefore, most of the vehicle manufacturers use some of the characteristics mentioned
above, for example: recuperation of kinetic energy during deceleration, turn off the engine
when the vehicle is at standstill and use energy from battery for initial acceleration in their
vehicle. Despite of this, the cost ratio remains comparable to a conventional powertrain. This
leads the classification:
1. mild hybrids (also sometimes referred to as weak hybrids) and
2. full hybrids (also sometimes referred to as strong hybrids).
Hybrid vehicles utilize just some of the above mentioned characteristics such as recuperation
of kinetic energy and using electric energy for initial acceleration from standstill. Depending
on the architecture of the power-train, hybrid vehicles can be classified into series, parallel
and series-parallel hybrid architecture, each having its own advantages and disadvantage for
specific classes of vehicles and specific type of driving.
Hybrid vehicles using series architecture are usually beneficial for fuel economy in urban
driving cycle.
6
Hybrid vehicles using parallel architecture have good performance and is more fuel efficient
than hybrid vehicles with series architecture.
Series-parallel hybrid architecture have good fuel economy but usually comes with increase in
number, for electric machine, and size of the engines. The continuous development in battery
technology and its reduced price permitted the development of plug-in hybrid electric vehicles
due to the possibility of charging the car through a cable which could be plugged in the
household outlet or industrial grid with very short time of charging.
7
1.0 ELECTRIFIED TRANSMISSION AND DUAL CLUTCH MODE
OF OPERATION
1.1 Dual clutch mode of operation
The transmission system is one of the most important and complex elements which operates
in a car and while the basic task is still the same, various types of transmission have been
developed. The dual clutch transmission (DCT) is, thanks to its flexibility, replacing other
systems which permits to be applied to high torque and high speed engines. The high gear
shift time and the high efficiency of the whole system makes it suitable for commercial and
sport car applications.
The dual clutch transmission, as the name suggests, is composed by two clutches: one for
even gears and the other for the odd ones. The two clutches are connected on one side to the
engine and on the other side to their own primary shaft. Thanks to this particular structure it is
possible to avoid the problem of the torque interruption.
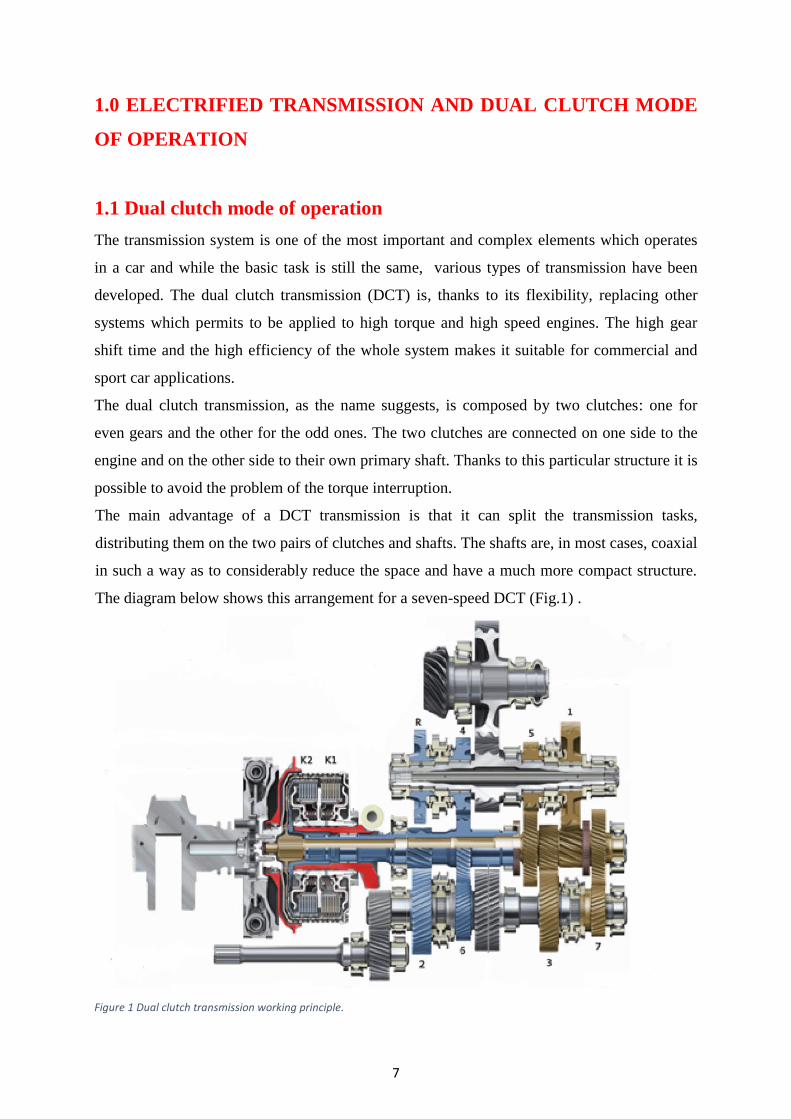
The main advantage of a DCT transmission is that it can split the transmission tasks,
distributing them on the two pairs of clutches and shafts. The shafts are, in most cases, coaxial
in such a way as to considerably reduce the space and have a much more compact structure.
The diagram below shows this arrangement for a seven-speed DCT (Fig.1) .
Figure 1 Dual clutch transmission working principle.
8
Notice that one clutch controls second, fourth, sixth and retro gears, while another,
independent clutch controls first, third, fifth and seventh gears. The use of two clutches and
two shafts allows, first of all, shorter shifting time than a traditional gearbox; in fact it works
like two gearboxes in parallel, the first in operation and the second one ready with the
following gear to be engaged.
In terms of performance, this means higher accelerations and a constant engine torque.
Another benefit, which regards the performance as well as the comfort, is provided by the
power shift that solves the torque interruption problem (typical of automated manual
transmissions). This is due to the quicker times of gear shifting, which also makes it possible
to improve the efficiency of the engine, which runs smoother and more constantly, with the
relevant advantage of a decrease in consumption and emissions. This type of transmission has
begun to spread only in recent years because of its greater complexity compared to other
types and therefore, consequently, its higher price. The process of shifting typically begins
with the required gearshift and, unlike a manual gearbox, this operation in a DCT takes place
while the engine is still running with the gear engaged.
Synchronization can be divided into five main phases : initial displacement, synchronisation
speed, unlocking of the ring, second displacement, hub indexing [1] .
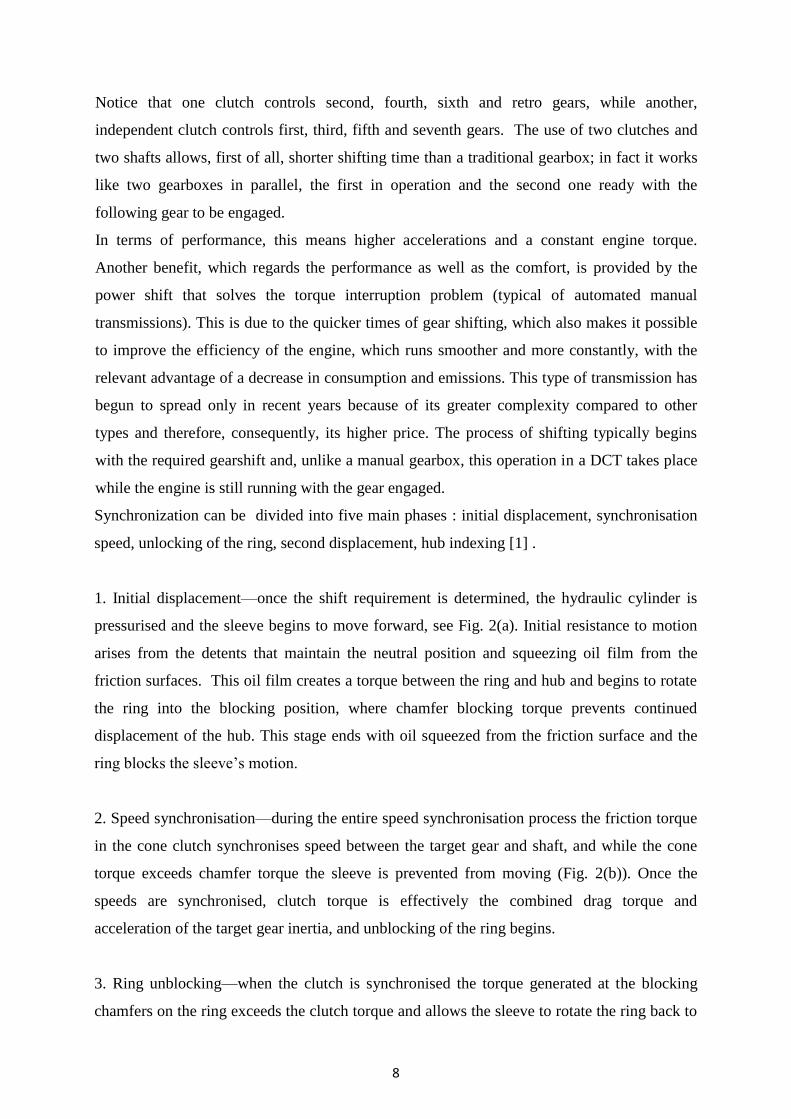
1. Initial displacement—once the shift requirement is determined, the hydraulic cylinder is
pressurised and the sleeve begins to move forward, see Fig. 2(a). Initial resistance to motion
arises from the detents that maintain the neutral position and squeezing oil film from the
friction surfaces. This oil film creates a torque between the ring and hub and begins to rotate
the ring into the blocking position, where chamfer blocking torque prevents continued
displacement of the hub. This stage ends with oil squeezed from the friction surface and the
ring blocks the sleeve’s motion.
2. Speed synchronisation—during the entire speed synchronisation process the friction torque
in the cone clutch synchronises speed between the target gear and shaft, and while the cone
torque exceeds chamfer torque the sleeve is prevented from moving (Fig. 2(b)). Once the
speeds are synchronised, clutch torque is effectively the combined drag torque and
acceleration of the target gear inertia, and unblocking of the ring begins.
3. Ring unblocking—when the clutch is synchronised the torque generated at the blocking
chamfers on the ring exceeds the clutch torque and allows the sleeve to rotate the ring back to
9
the neutral position as the sleeve again moves forward and continues its engagement. As
unblocking completes load is removed from the cone clutch.
4. Secondary displacement—during the secondary displacement the load on the cone clutch is
reduced. Thus, as the sleeve moves forward, and if drag on the mechanism is sufficient, it will
unlock the cone clutch and cause the regeneration of a relative slip between the target gear
and shaft.
5. Hub indexing—the final stage of synchronisation begins with contact between chamfers on
the ring and hub, Fig. 2(c) and ends with interlocked splines, Fig. 2(d). The torque generated
between these chamfers realigns the hub so that the chamfers slide over the sleeve,
completing engagement. Here, engagement is highly dependent on initial chamfer alignment,
an entirely random process, and any slip speed in the cone clutch.
Figure 2 Changes to chamfer alignments during the process of synchronisation. (a) Sleeve in neutral position; (b) ring in
blocking position; (c) sleeve and hub in indexing position and (d) sleeve interlocked with hub.
Synchronisation process is the core of a DCT transmission because in this phase begins the
preselection of the gear and the control of this phase is fundamental to have at the same time a
faster and smoother shift.
10
1.1 Hybrid vehicles drivetrain
Hybrid vehicles can be classified in three main categories depending on the layout. Hybrids
that use a series drivetrain only receive mechanical power from the electric motor, which is
run by either a battery or a gasoline-powered generator. In hybrids with parallel drivetrains,
the electric motor and internal combustion engine can provide mechanical power to the
wheels simultaneously. Series/parallel drivetrains enable the engine and electric motor to
provide power independently or in conjunction with one another [2] .
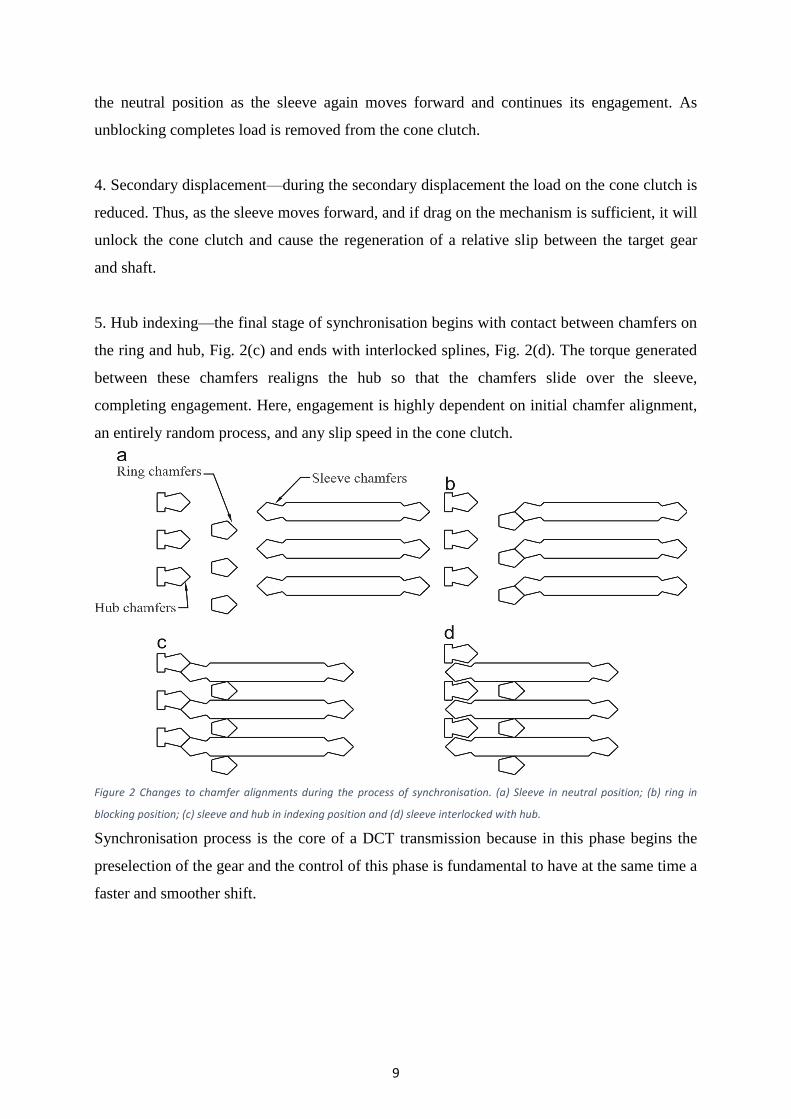
1.2 Series drivetrains
Series drivetrains are the simplest hybrid configuration. In a series hybrid, the electric motor
is the only mean to provide power to the wheels. The motor receives electric power from
either the battery pack or a generator run by a gasoline engine. A control unit determines how
much of the power comes from the battery or the engine/generator. Both the engine/generator
and the regenerative braking recharge the battery pack.
Series hybrids perform at their best during stop-and-go traffic, where gasoline and diesel
engines are inefficient. The vehicle’s control unit can opt to power the motor with the battery
pack only, saving the engine for situations where it’s more efficient.
Figure 3 Plant model af an hybrid vehicle with a series drivetrain.
The engine is typically smaller in a series drivetrain because it only has to meet certain power
demands; the battery pack is generally more powerful than the one in parallel hybrids in order
to provide the remaining power needs. This larger battery and motor, along with the
generator, add to the vehicle’s cost, making series hybrids more expensive than parallel
hybrids.
11
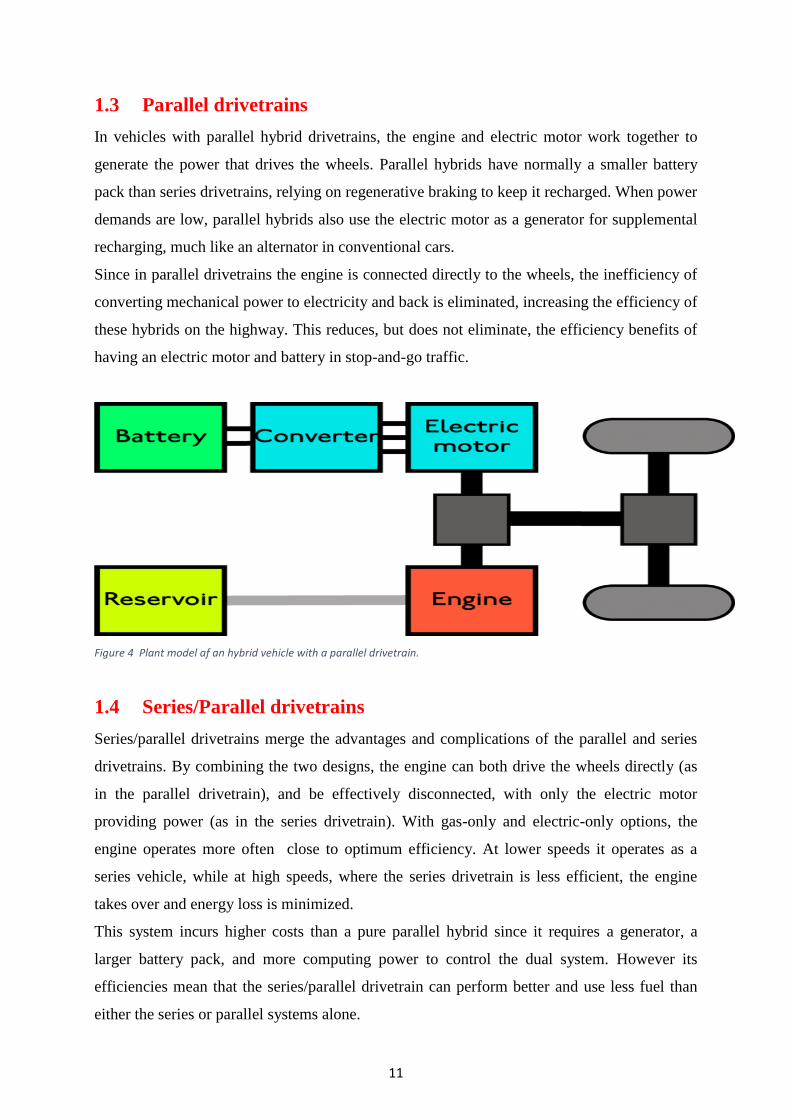
1.3 Parallel drivetrains
In vehicles with parallel hybrid drivetrains, the engine and electric motor work together to
generate the power that drives the wheels. Parallel hybrids have normally a smaller battery
pack than series drivetrains, relying on regenerative braking to keep it recharged. When power
demands are low, parallel hybrids also use the electric motor as a generator for supplemental
recharging, much like an alternator in conventional cars.
Since in parallel drivetrains the engine is connected directly to the wheels, the inefficiency of
converting mechanical power to electricity and back is eliminated, increasing the efficiency of
these hybrids on the highway. This reduces, but does not eliminate, the efficiency benefits of
having an electric motor and battery in stop-and-go traffic.
Figure 4 Plant model af an hybrid vehicle with a parallel drivetrain.
1.4 Series/Parallel drivetrains
Series/parallel drivetrains merge the advantages and complications of the parallel and series
drivetrains. By combining the two designs, the engine can both drive the wheels directly (as
in the parallel drivetrain), and be effectively disconnected, with only the electric motor
providing power (as in the series drivetrain). With gas-only and electric-only options, the
engine operates more often close to optimum efficiency. At lower speeds it operates as a
series vehicle, while at high speeds, where the series drivetrain is less efficient, the engine
takes over and energy loss is minimized.
This system incurs higher costs than a pure parallel hybrid since it requires a generator, a
larger battery pack, and more computing power to control the dual system. However its
efficiencies mean that the series/parallel drivetrain can perform better and use less fuel than
either the series or parallel systems alone.

12
Figure 5 Plant model of an hybrid vehicle with a series/parallel drivetrain.
1.5 Electrified dual clutch transmissions
Due to the arrangement of the components, a dual clutch transmission is more suitable for
hybrid vehicles with parallel drivetrains. The electric machine could operate as a generator or
a motor, depending on the necessity, and is connected to one of the two input shaft.
Figure 6 Plant model of an hybrid dual clutch transmission.
That configuration permits the electric machine to operate with the gears placed on the shaft
where it is connected. Thanks to this solution it is possible to have the same gearbox which
could be used simultaneously from the combustion engine and the electric machine improving
the possibility to use the best characteristics of each one (figure 6).
13
Considering a driving scenario where the vehicle is accelerating from standstill , at the
beginning it is possible to take advantage of the great amount of torque of the electric
machine, which however it is available till reduced velocities , and subsequently switch in
favour of the combustion engine [3]. Another advantage of an hybrid dual clutch is the
flexibility which permits to turn on the combustion engine using the electric machine or vice
versa to charge the battery during the utilization of combustion engine. All this possibilities
are selected and chosen by the numerous control units present on board in order to satisfy the
driver request and to improve driveability, performance and reduce the fuel consumption.

14
2.0 HARDWARE IN THE LOOP, TESTING AND VIRTUAL
CALIBRATION
Application of innovative methods in the development of control units, calibration and testing
is essential to successfully contend with the resulting complexity of control unit software.
These methods help to reach in shorter time a development state able to fulfil the emission
standards . In contrast to development and testing in road trials exclusively practiced in earlier
years, simulation in software development and in calibration has now attained an increasingly
dominant role. The type of simulation applied will depend on the particular step of
development.
The starting point for control units development is the customer’s specifications, made
available at the beginning of software development in the form of a catalogue of user
requirements.
The following step is function specification, which can be supported by model in the loop
simulation (Figure 7- 1). Model in the loop simulation takes place on a PC or workstation,
with simulation of both the specified functions as well as the vehicle itself. This step features
development of the functions as software models in graphically oriented programming
systems such as MATLAB /Simulink. The result is an electronic catalogue of specifications
that can be implemented.
The following step entails direct testing and optimization of the software models of the
functions, with the appropriate software and hardware tools: on a bypass computer in the
vehicle, or on a test bench (i.e., by rapid prototyping Figure 7-2). Model in the loop
simulation and rapid prototyping enable finding and elimination of specification errors in an
early phase. Software design and coding for the target system – i.e., implementation of the
functions in software capable of series production – are incorporated in the process steps of
program design, module design and coding. These process steps are ideally accompanied by
intensive static analyses, in the form of reviews.
The subsequent module test, required for verification of the module design, can be supported
by software in the loop simulation (SiL Figure 7-3). The software model already used in
model-in-the-loop simulation is replaced here by the software code and it is integrated into the
simulation. The integration test performed is intended to test the executable program in
interaction with the other modules and the hardware components used. During this phase, a
hardware in the loop simulator (HiL Figure 7-4) supports the engineers.
15
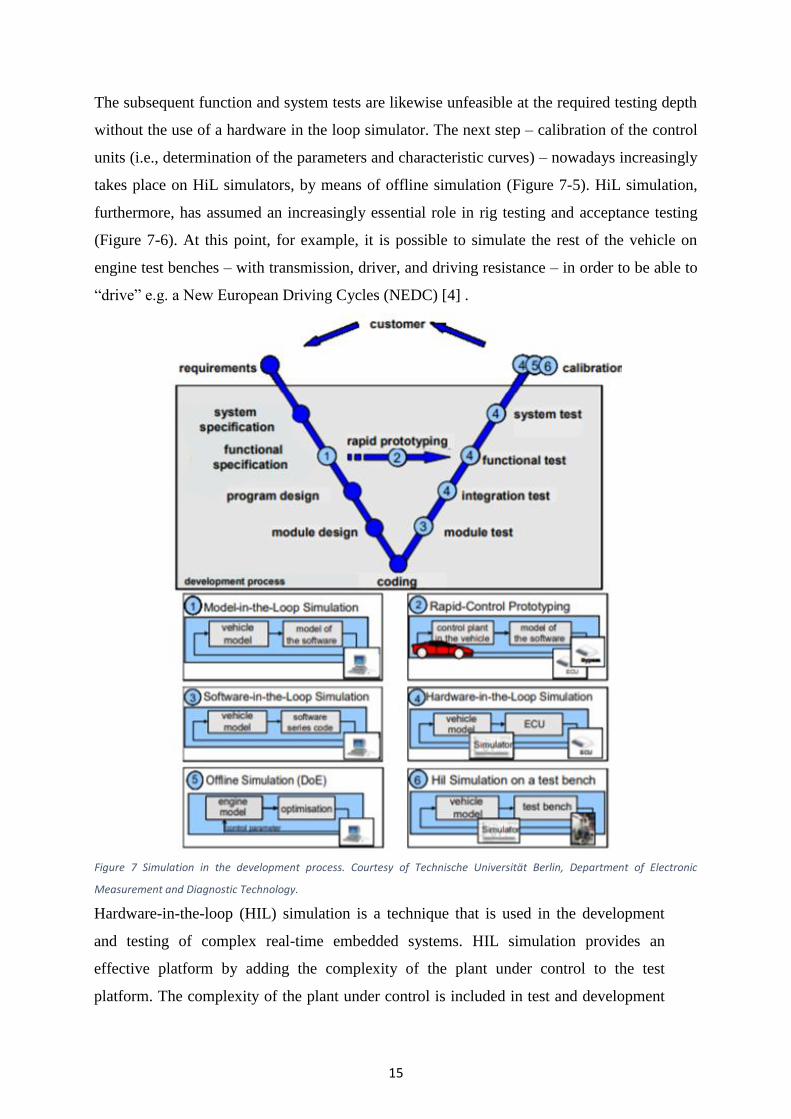
The subsequent function and system tests are likewise unfeasible at the required testing depth
without the use of a hardware in the loop simulator. The next step – calibration of the control
units (i.e., determination of the parameters and characteristic curves) – nowadays increasingly
takes place on HiL simulators, by means of offline simulation (Figure 7-5). HiL simulation,
furthermore, has assumed an increasingly essential role in rig testing and acceptance testing
(Figure 7-6). At this point, for example, it is possible to simulate the rest of the vehicle on
engine test benches – with transmission, driver, and driving resistance – in order to be able to
“drive” e.g. a New European Driving Cycles (NEDC) [4] .
Figure 7 Simulation in the development process. Courtesy of Technische Universität Berlin, Department of Electronic
Measurement and Diagnostic Technology.
Hardware-in-the-loop (HIL) simulation is a technique that is used in the development
and testing of complex real-time embedded systems. HIL simulation provides an
effective platform by adding the complexity of the plant under control to the test
platform. The complexity of the plant under control is included in test and development
16
by adding a mathematical representation of all related dynamic systems. These
mathematical representations are referred to as the “plant simulation”. The embedded
system to be tested interacts with this plant simulation. A HIL simulation must include
electrical emulation of sensors and actuators. These electrical emulations act as the
interface between the plant simulation and the embedded system under test. The value of
each electrically emulated sensor is controlled by the plant simulation and is read by the
embedded system under test (feedback). Likewise, the embedded system under test
implements its control algorithms by outputting actuator control signals. Changes in the
control signals result in changes to variable values in the plant simulation. In many
cases, the most effective way to develop an embedded system is to connect the
embedded system to the real plant. In other cases, HIL simulation is more efficient. The
test development efficiency depends on the following factors:
1. Cost
2. Duration
3. Safety
4. Feasibility
Logically the use of the HIL reduces drastically the cost of testing and this is due to the
possibility of operating all the tests without the real hardware part. The HIL also allows
to reduce the duration of the tests and consequently it reduces the time to market which
has become crucial for all the companies. It’s also not negligible the higher level of
safety correlated to the unnecessary utilization of the real components or real drive test.
Last but not least, the HIL has a much higher feasibility which explains why it is
becoming crucial in the automotive world as in a lot of other sectors.
A crucial part to correctly employ the HIL is to create a model which could run in real
time because, logically, it had to behave and stimulate the Transmission Control Unit
(TCU) as if it was in a real car and in real driving conditions. If the different parts of the
system need to be tested individually to make sure that they work as planned the HIL
may be very useful. For example HIL can be used to test a controller function with a
simulated process before the controller is applied to the real process. If the mathematical
model used in the simulator is an accurate representation of the real process, it is even
possible to tune the controller’s parameters (e.g. the PID parameters) using the simulator.
It is also very useful for training purposes, i.e., the process operator may learn how the
system works and operates by using the Hardware in the loop simulation. Another
benefit of Hardware in the loop is that testing can be done without damaging equipment
17
or endangering lives. For instance, potentially damaging conditions in an engine, such as
over-temperature, can be simulated to test the correct operation of Engine Control Unit
(ECU) which has to detect and report any malfunctioning. Another instance could be an
anti lock braking (ABS) simulation at extreme performance conditions. If simulated
through the HIL, the performance of the ABS system can be validated without risk to the
vehicle or operator. HIL should be an integrated part of the design and testing cycle. As
the complexity of the hardware being controlled increases, so does the complexity of the
embedded system, that is designed to control the hardware. Hardware in the loop (HIL)
simulation is a technique that is increasingly used in the development and testing of
complex real time embedded systems. The purpose of HIL simulation is to provide an
effective platform for developing and testing real time embedded systems, often in
closely linked to the development of the hardware. Software development no longer
needs to wait for a physical plant in order to write and test the code. HIL simulation
provides an effective platform which allows to increase the level of complexity of the
plant under control and, at the same time, it facilitates development and testing. The
complexity of the plant under control is included in testing and development by adding a
mathematical representation (model) of all related dynamic systems. These mathematical
representations are referred to as the “plant simulation.” HiL simulation generally
involves integration into the simulation loop of a number of real parts (actuators and
sensors) e.g. a throttle-valve actuator. Work in function and software development for
the power train is now increasingly moving toward generation of specifications in a
graphics oriented modelling language such as Simulink. As a result, an executable model
of the software is provided in a very early phase of the development process. Once this
software model is complemented by models of the actuator and the sensor systems, it is
then possible to simulate the entire system in MiL. If, in a later step of the development
process, this software model is replaced by the converted code (series code), the result is
known as software-in-the loop simulation. Generally the same models is attempted for
MiL, SiL, and HiL simulation. This solution, however, requires real time capable
simulation models.
18
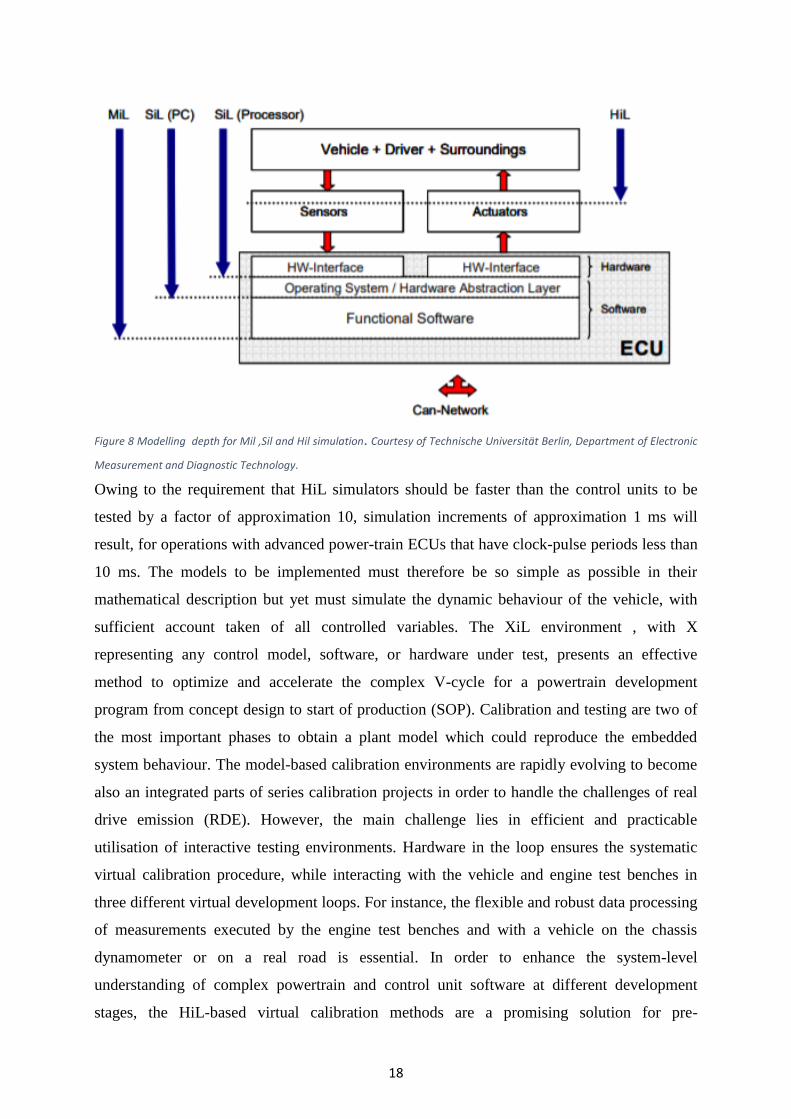
Figure 8 Modelling depth for Mil ,Sil and Hil simulation. Courtesy of Technische Universität Berlin, Department of Electronic
Measurement and Diagnostic Technology.
Owing to the requirement that HiL simulators should be faster than the control units to be
tested by a factor of approximation 10, simulation increments of approximation 1 ms will
result, for operations with advanced power-train ECUs that have clock-pulse periods less than
10 ms. The models to be implemented must therefore be so simple as possible in their
mathematical description but yet must simulate the dynamic behaviour of the vehicle, with
sufficient account taken of all controlled variables. The XiL environment , with X
representing any control model, software, or hardware under test, presents an effective
method to optimize and accelerate the complex V-cycle for a powertrain development
program from concept design to start of production (SOP). Calibration and testing are two of
the most important phases to obtain a plant model which could reproduce the embedded
system behaviour. The model-based calibration environments are rapidly evolving to become
also an integrated parts of series calibration projects in order to handle the challenges of real
drive emission (RDE). However, the main challenge lies in efficient and practicable
utilisation of interactive testing environments. Hardware in the loop ensures the systematic
virtual calibration procedure, while interacting with the vehicle and engine test benches in
three different virtual development loops. For instance, the flexible and robust data processing
of measurements executed by the engine test benches and with a vehicle on the chassis
dynamometer or on a real road is essential. In order to enhance the system-level
understanding of complex powertrain and control unit software at different development
stages, the HiL-based virtual calibration methods are a promising solution for pre-
19
parametrisation of control units functions and seamless integration of functional and
calibration updates. It helps to manage requirement changes, hardware changes, software
releases as well as complicated interactions of different control functions and to validate
vehicle derivatives. Another important benefit of the Hil- based virtual calibration is the
possibility to change all the calibration parameters during the virtual test in order to
understand how this parameters influenced the driveability and the model’s behaviour.
Furthermore the automation of the testing process permits to run the model without the
assiduously human control in order to earn time and to check only the final results of the
whole testing process. Consequently this allows to pass at the real drive test in a safer
condition, because the software, model or hardware have already been tested, increase the
percentage of success and as a results a not negligible money savings.
20
3.0 MIL AND TRANSMISSION HYDRAULIC CIRCUIT
Model in the loop (MIL) testing is a technique used to simulate the behaviour of a system or
sub-system in a way that this model can be used to test and verify that model. By using an
industry standard toolchain such as Simulink for model definition you can test and refine that
model within a desktop environment, allowing a complex system to be managed efficiently.
Once you have modelled your control system or environment (plant model), you can use
this powerful offline simulation environment to test your controller strategies. Once the
strategy is working well you can then take your model and build it into a pseudo-real-time
model to run on the host, or auto-code the model into embedded C code that can be run on
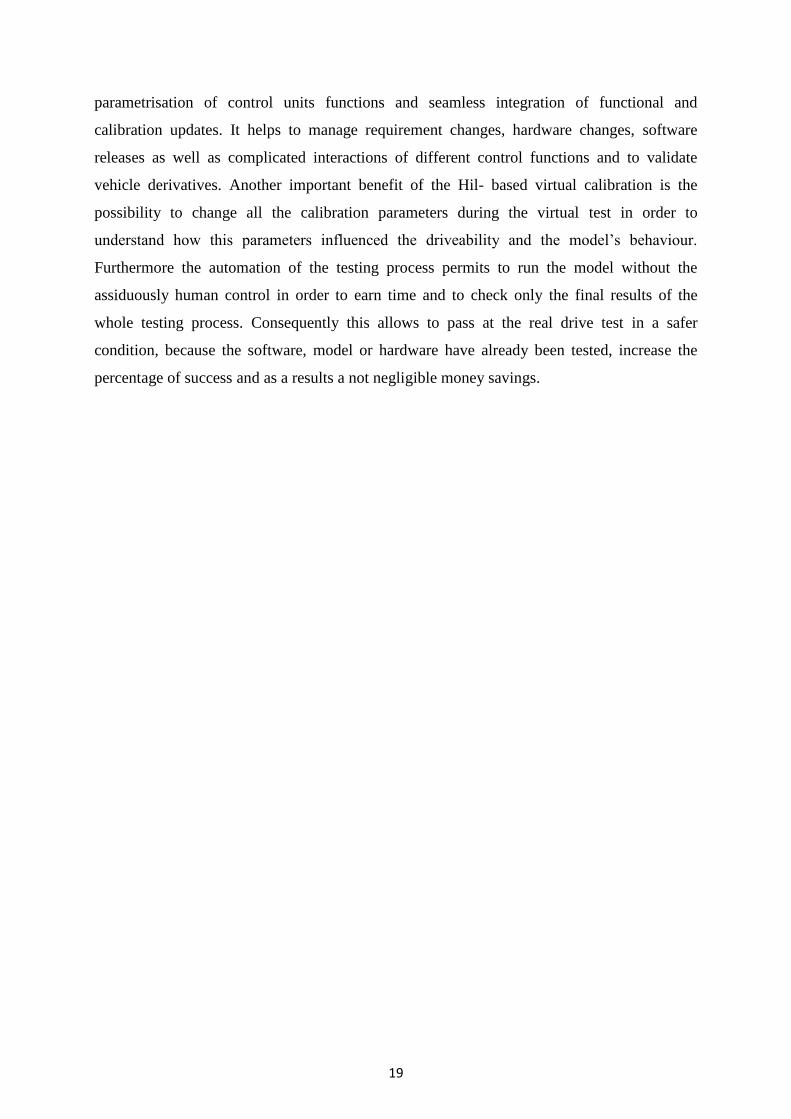
real time hardware. The model is composed of three macro subsystem connected each other
(figure 9) that are physical model, control model and scope block to visualize the simulation
result.
Figure 9 Plant model layout.
21
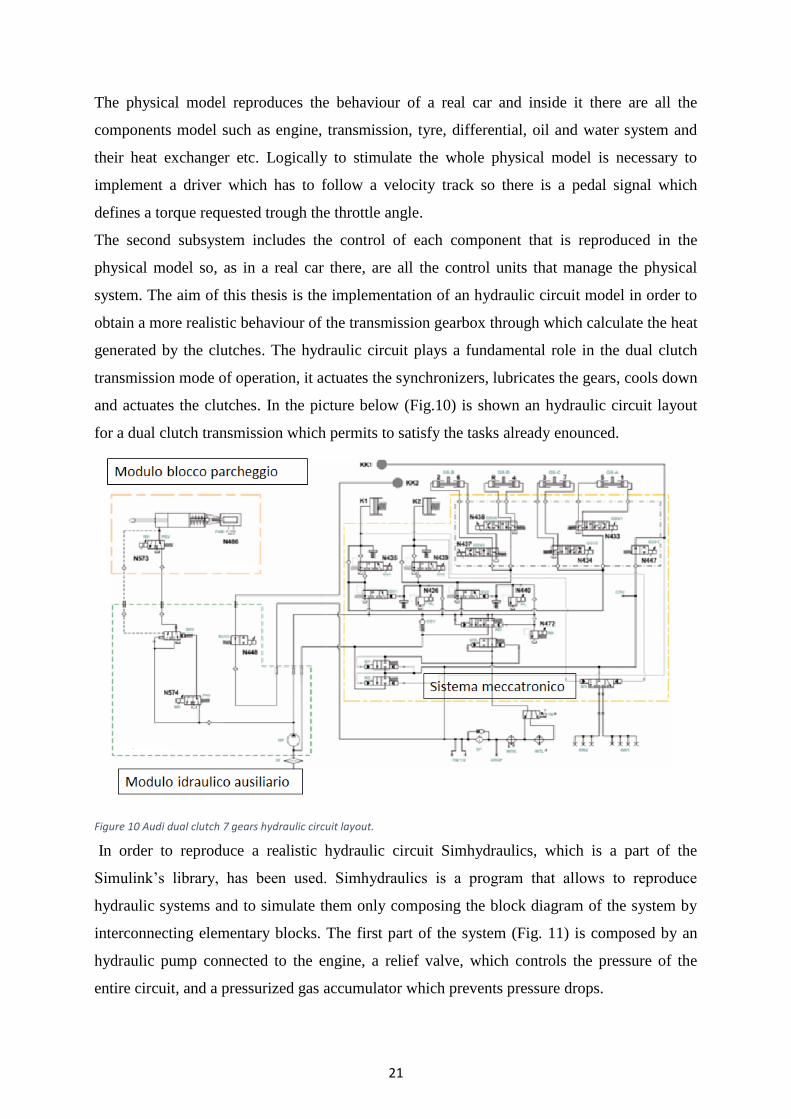
The physical model reproduces the behaviour of a real car and inside it there are all the
components model such as engine, transmission, tyre, differential, oil and water system and
their heat exchanger etc. Logically to stimulate the whole physical model is necessary to
implement a driver which has to follow a velocity track so there is a pedal signal which
defines a torque requested trough the throttle angle.
The second subsystem includes the control of each component that is reproduced in the
physical model so, as in a real car there, are all the control units that manage the physical
system. The aim of this thesis is the implementation of an hydraulic circuit model in order to
obtain a more realistic behaviour of the transmission gearbox through which calculate the heat
generated by the clutches. The hydraulic circuit plays a fundamental role in the dual clutch
transmission mode of operation, it actuates the synchronizers, lubricates the gears, cools down
and actuates the clutches. In the picture below (Fig.10) is shown an hydraulic circuit layout
for a dual clutch transmission which permits to satisfy the tasks already enounced.
Figure 10 Audi dual clutch 7 gears hydraulic circuit layout.
In order to reproduce a realistic hydraulic circuit Simhydraulics, which is a part of the
Simulink’s library, has been used. Simhydraulics is a program that allows to reproduce
hydraulic systems and to simulate them only composing the block diagram of the system by
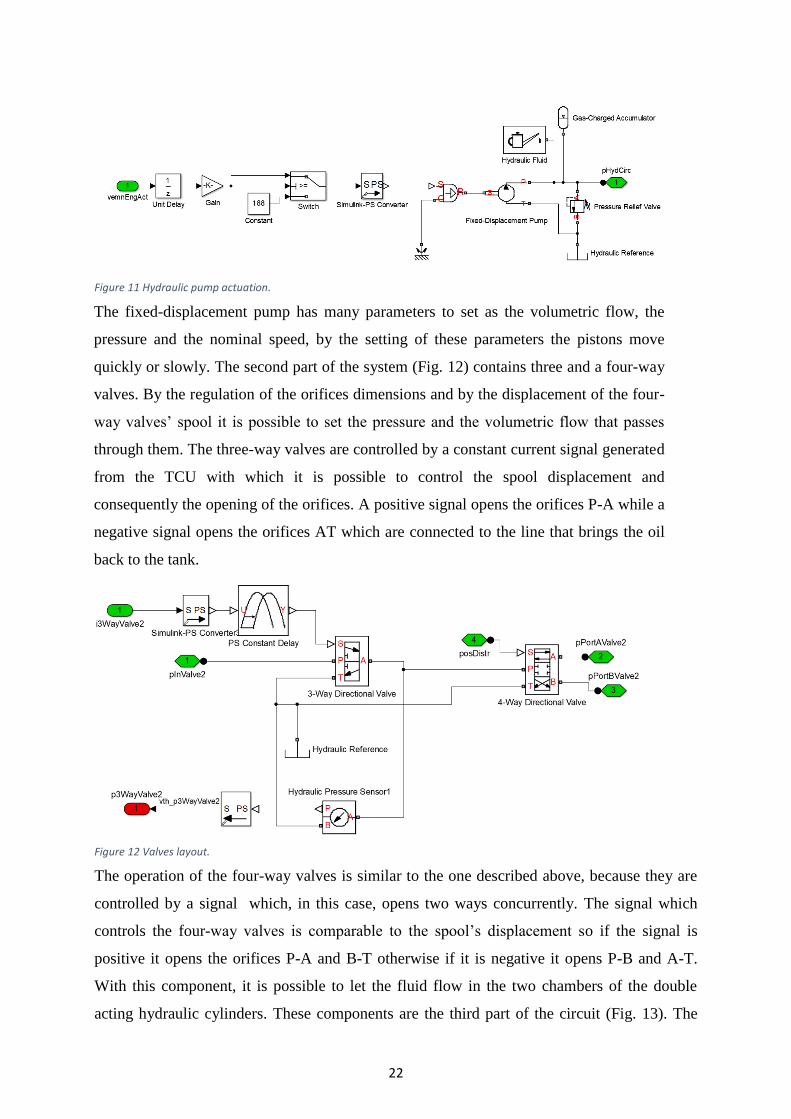
interconnecting elementary blocks. The first part of the system (Fig. 11) is composed by an
hydraulic pump connected to the engine, a relief valve, which controls the pressure of the
entire circuit, and a pressurized gas accumulator which prevents pressure drops.
22
Figure 11 Hydraulic pump actuation.
The fixed-displacement pump has many parameters to set as the volumetric flow, the
pressure and the nominal speed, by the setting of these parameters the pistons move
quickly or slowly. The second part of the system (Fig. 12) contains three and a four-way
valves. By the regulation of the orifices dimensions and by the displacement of the four-
way valves’ spool it is possible to set the pressure and the volumetric flow that passes
through them. The three-way valves are controlled by a constant current signal generated
from the TCU with which it is possible to control the spool displacement and
consequently the opening of the orifices. A positive signal opens the orifices P-A while a
negative signal opens the orifices AT which are connected to the line that brings the oil
back to the tank.
Figure 12 Valves layout.
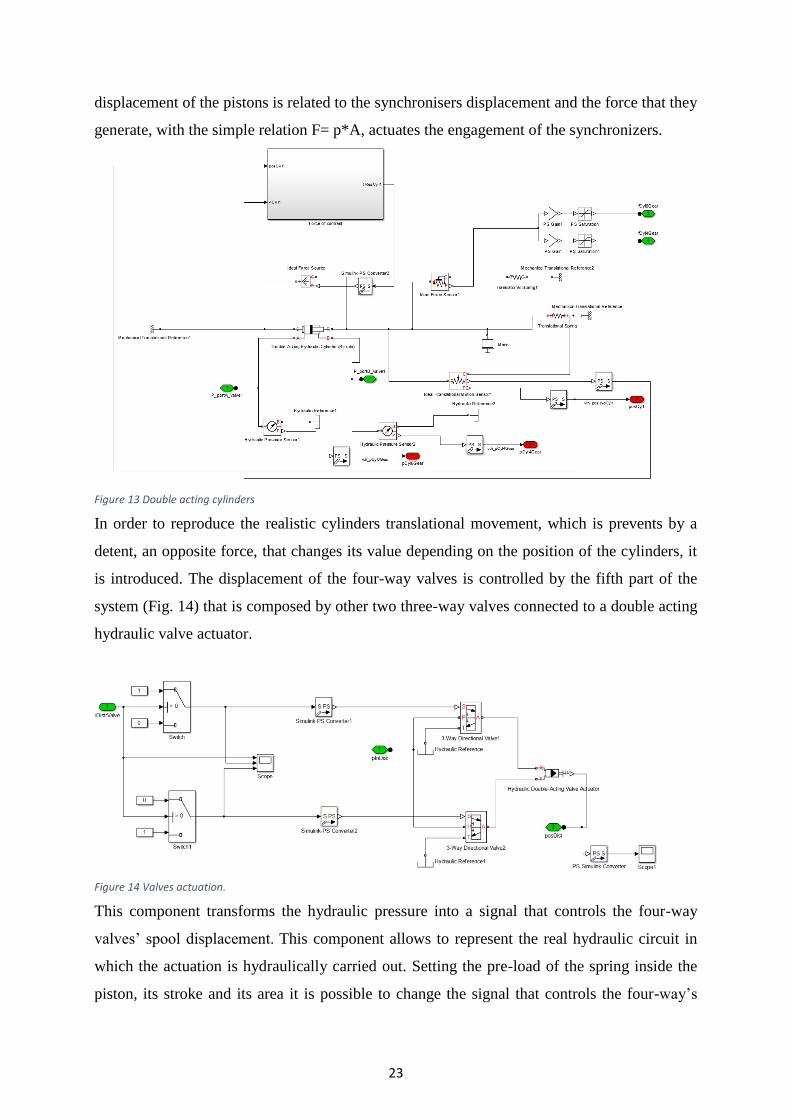
The operation of the four-way valves is similar to the one described above, because they are
controlled by a signal which, in this case, opens two ways concurrently. The signal which
controls the four-way valves is comparable to the spool’s displacement so if the signal is
positive it opens the orifices P-A and B-T otherwise if it is negative it opens P-B and A-T.
With this component, it is possible to let the fluid flow in the two chambers of the double
acting hydraulic cylinders. These components are the third part of the circuit (Fig. 13). The
23
displacement of the pistons is related to the synchronisers displacement and the force that they
generate, with the simple relation F= p*A, actuates the engagement of the synchronizers.
Figure 13 Double acting cylinders
In order to reproduce the realistic cylinders translational movement, which is prevents by a
detent, an opposite force, that changes its value depending on the position of the cylinders, it
is introduced. The displacement of the four-way valves is controlled by the fifth part of the
system (Fig. 14) that is composed by other two three-way valves connected to a double acting
hydraulic valve actuator.
Figure 14 Valves actuation.
This component transforms the hydraulic pressure into a signal that controls the four-way
valves’ spool displacement. This component allows to represent the real hydraulic circuit in
which the actuation is hydraulically carried out. Setting the pre-load of the spring inside the
piston, its stroke and its area it is possible to change the signal that controls the four-way’s

24
spool displacement in order to have a faster or a slower actuation. The circuit is also
composed by hydraulic pressure sensors which measure the pressure before and after the all
valves.
After the composition of the whole system, the implementation of a control using the Matlab
toolbox “Stateflow”, took place. Stateflow is an environment for modelling and simulating
logic based on state machines and flowcharts. Stateflow allows to combine graphical and
tabular representations, including state diagrams, flowcharts, state transition maps, and truth
tables, to describe how the system reacts to events, time-dependent conditions, and external
stimulus signals. The control strategy calculates, from the measures of the pistons’
displacement, the current to control the valves’ position. This control allows to move the
pistons forward and backward and consequently the synchronisers which engage the gears.
The most important pistons positions that must be controlled are the end-stop position and the
neutral one. The two phases that had to be implemented in the control are the engagement and
the disengagement, to bring back the pistons in the neutral position. From the circuit layout it
is clear that it is possible to move only two pistons at the same time. A part of the control
strategy is illustrated in figure 15.
Figure 15 Control of the valve’s current through which manage the Synchronizers translation.
In this model there are four double sided synchronizers and each of them can engage two
gears, one on the right and one on the left, and consequently the synchronizer displacement
can be controlled by the double acting cylinders. One of the most important operation to
25
model the pistons is the introduction of a mass and a spring which allows to simulate the
pistons’ displacement.
At the beginning, a damp is introduced to model the pistons but it does not permit to run the
model in real time which is the core of the project. Another fundamental sensor measures the
force that the piston generates and it makes possible to control the force exchanged between
the cone clutch and the hub ring. The problem of this sensor is that its output is proportional
to the spring stiffness value, so the introduction of a gain to amplify the signal becomes
necessary also because a too high stiffness of the spring caused a too slow displacement of the
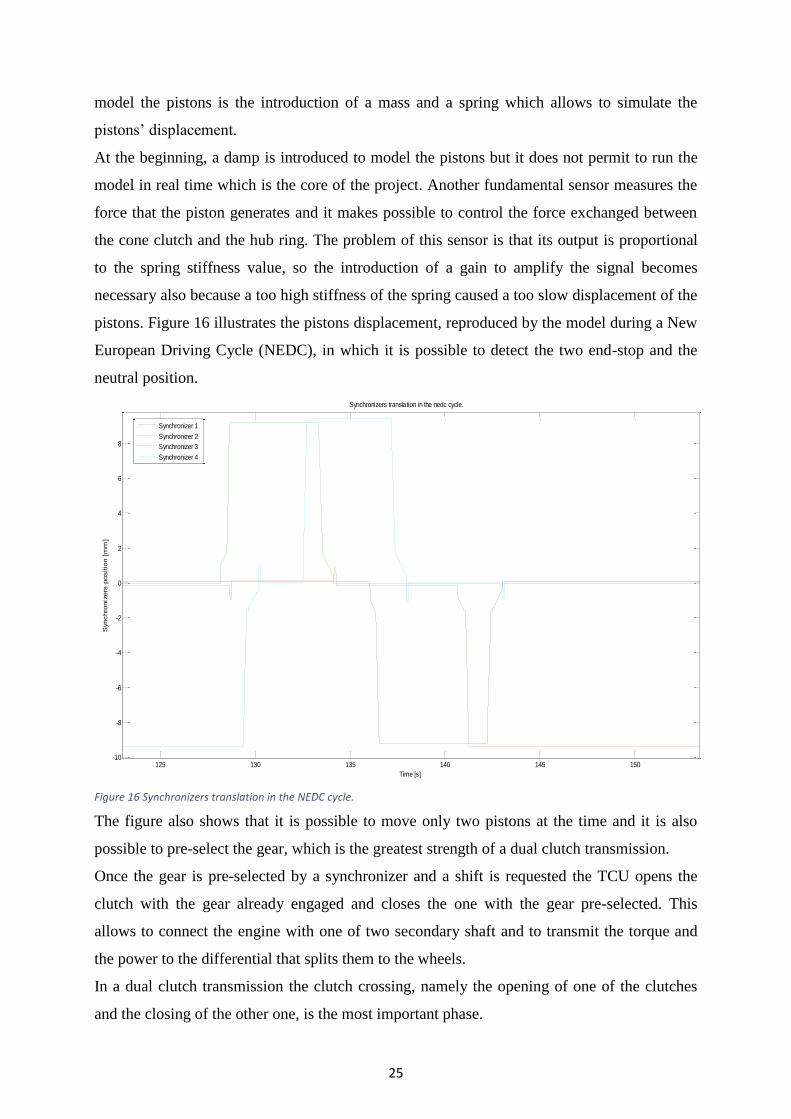
pistons. Figure 16 illustrates the pistons displacement, reproduced by the model during a New
European Driving Cycle (NEDC), in which it is possible to detect the two end-stop and the
neutral position.
Figure 16 Synchronizers translation in the NEDC cycle.
The figure also shows that it is possible to move only two pistons at the time and it is also
possible to pre-select the gear, which is the greatest strength of a dual clutch transmission.
Once the gear is pre-selected by a synchronizer and a shift is requested the TCU opens the
clutch with the gear already engaged and closes the one with the gear pre-selected. This
allows to connect the engine with one of two secondary shaft and to transmit the torque and
the power to the differential that splits them to the wheels.
In a dual clutch transmission the clutch crossing, namely the opening of one of the clutches
and the closing of the other one, is the most important phase.
125 130 135 140 145 150-10
-8
-6
-4
-2
0
2
4
6
8
Time [s]
Synchro
niz
ers
posit
ion [
mm
]
Synchronizers translation in the nedc cycle.
Synchronizer 1
Synchronizer 2
Synchronizer 3
Synchronizer 4
26
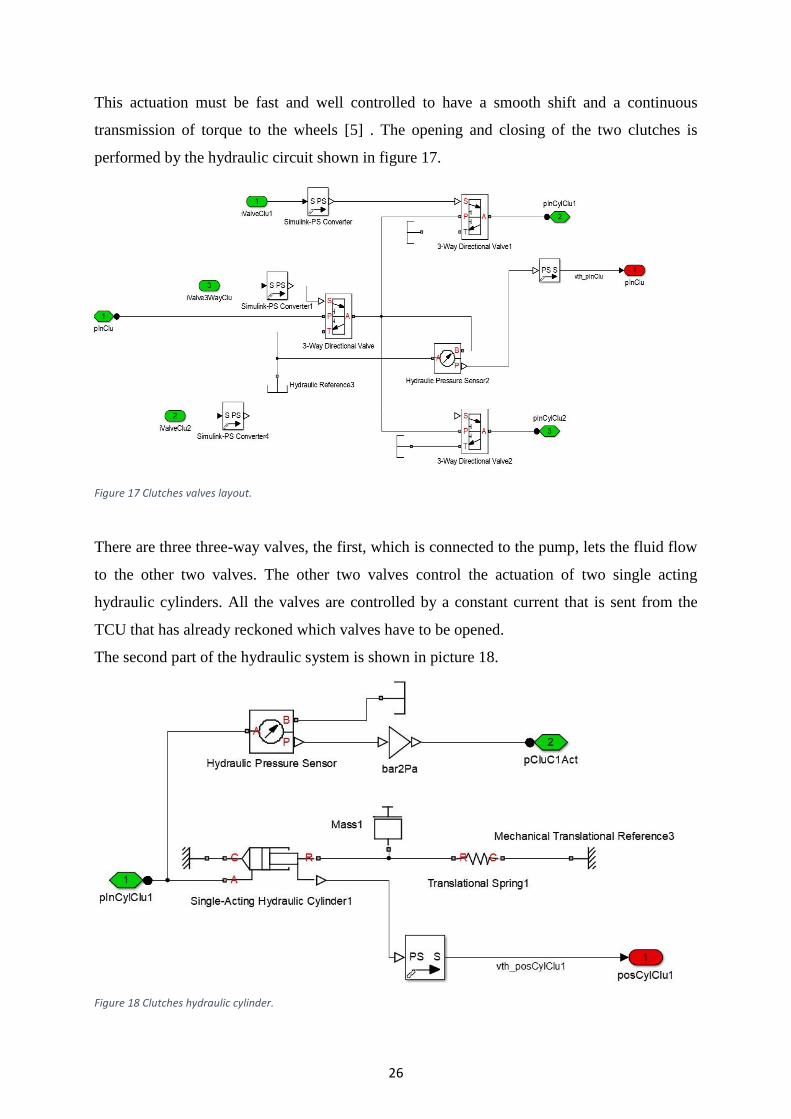
This actuation must be fast and well controlled to have a smooth shift and a continuous
transmission of torque to the wheels [5] . The opening and closing of the two clutches is
performed by the hydraulic circuit shown in figure 17.
Figure 17 Clutches valves layout.
There are three three-way valves, the first, which is connected to the pump, lets the fluid flow
to the other two valves. The other two valves control the actuation of two single acting
hydraulic cylinders. All the valves are controlled by a constant current that is sent from the
TCU that has already reckoned which valves have to be opened.
The second part of the hydraulic system is shown in picture 18.
Figure 18 Clutches hydraulic cylinder.
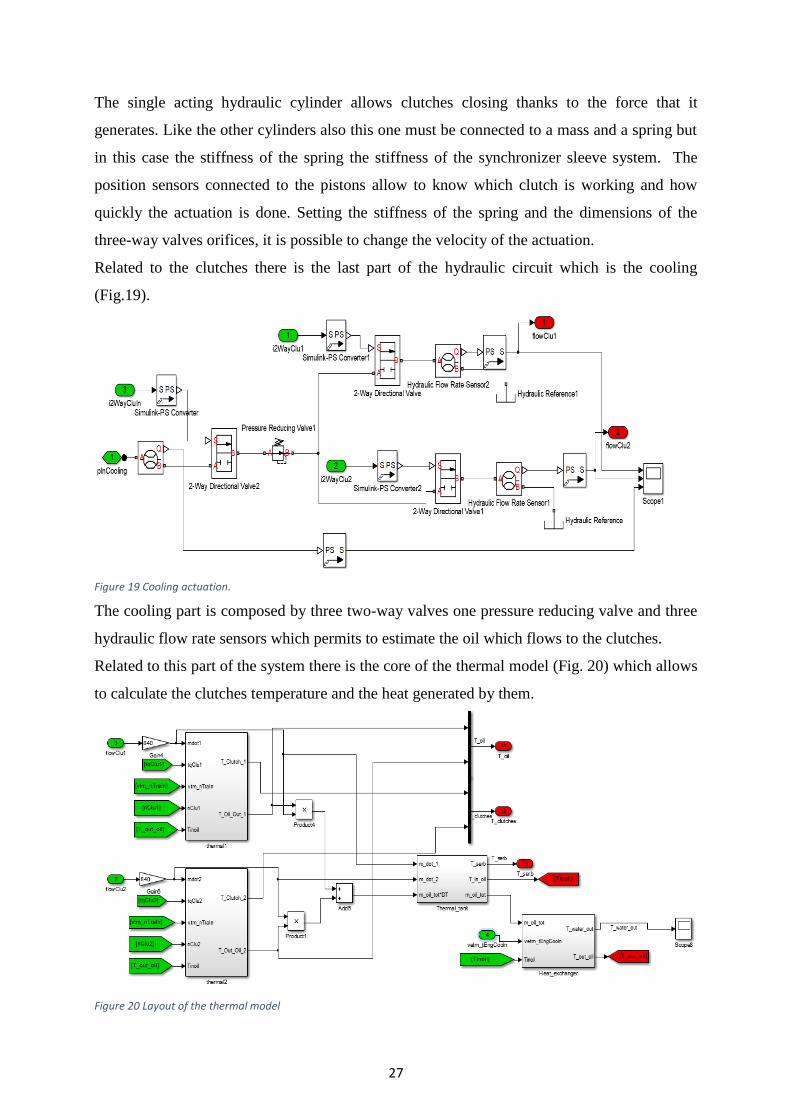
27
The single acting hydraulic cylinder allows clutches closing thanks to the force that it
generates. Like the other cylinders also this one must be connected to a mass and a spring but
in this case the stiffness of the spring the stiffness of the synchronizer sleeve system. The
position sensors connected to the pistons allow to know which clutch is working and how
quickly the actuation is done. Setting the stiffness of the spring and the dimensions of the
three-way valves orifices, it is possible to change the velocity of the actuation.
Related to the clutches there is the last part of the hydraulic circuit which is the cooling
(Fig.19).
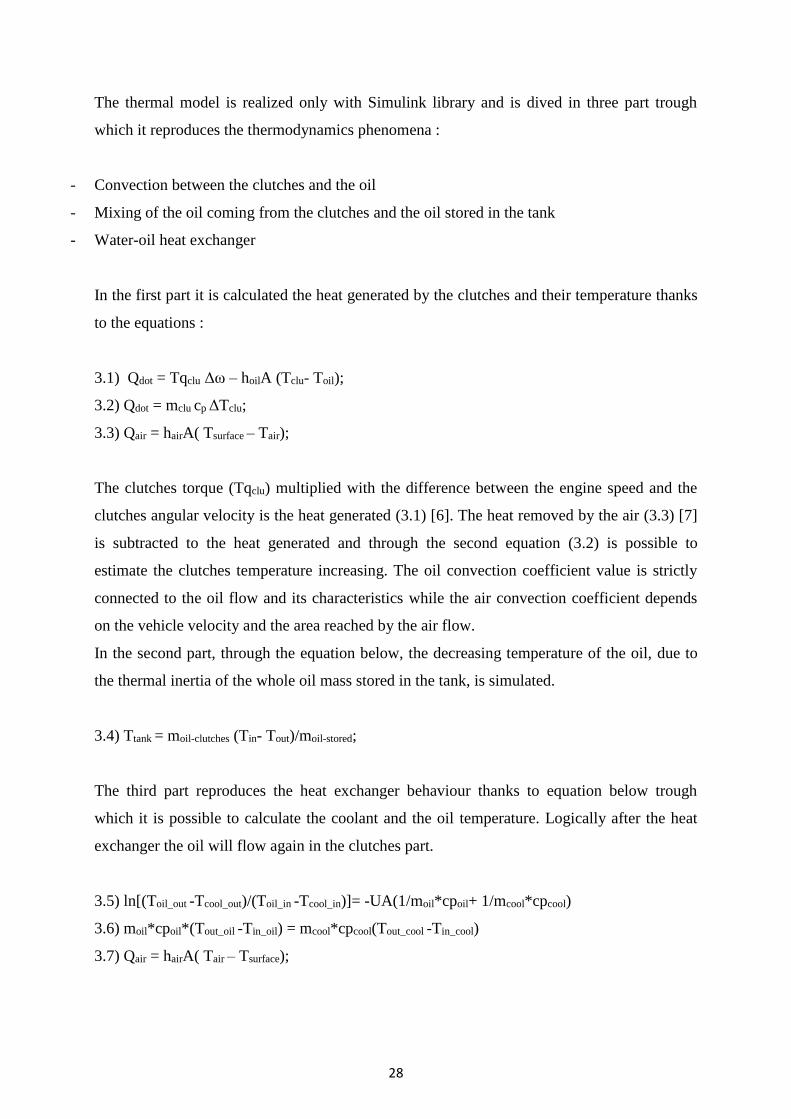
Figure 19 Cooling actuation.
The cooling part is composed by three two-way valves one pressure reducing valve and three
hydraulic flow rate sensors which permits to estimate the oil which flows to the clutches.
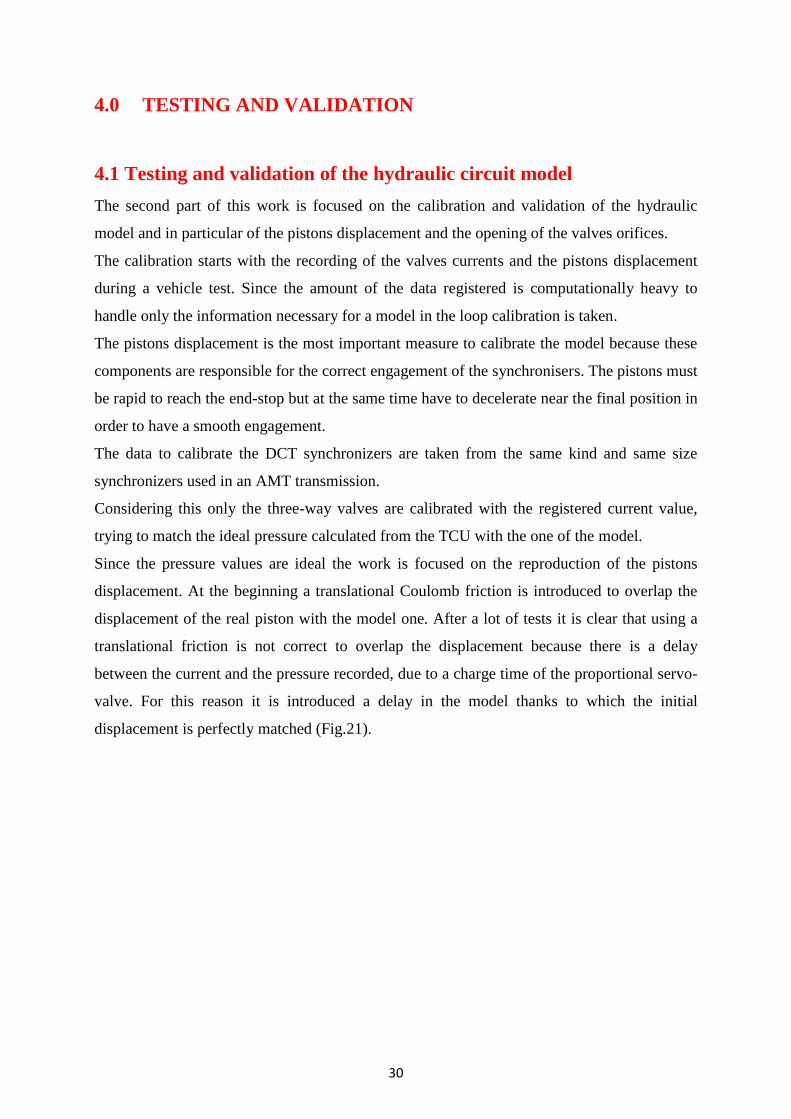
Related to this part of the system there is the core of the thermal model (Fig. 20) which allows
to calculate the clutches temperature and the heat generated by them.
Figure 20 Layout of the thermal model
28
The thermal model is realized only with Simulink library and is dived in three part trough
which it reproduces the thermodynamics phenomena :
- Convection between the clutches and the oil
- Mixing of the oil coming from the clutches and the oil stored in the tank
- Water-oil heat exchanger
In the first part it is calculated the heat generated by the clutches and their temperature thanks
to the equations :
3.1) Qdot = Tqclu Δω – hoilA (Tclu- Toil);
3.2) Qdot = mclu cp ΔTclu;
3.3) Qair = hairA( Tsurface – Tair);
The clutches torque (Tqclu) multiplied with the difference between the engine speed and the
clutches angular velocity is the heat generated (3.1) [6]. The heat removed by the air (3.3) [7]
is subtracted to the heat generated and through the second equation (3.2) is possible to
estimate the clutches temperature increasing. The oil convection coefficient value is strictly
connected to the oil flow and its characteristics while the air convection coefficient depends
on the vehicle velocity and the area reached by the air flow.
In the second part, through the equation below, the decreasing temperature of the oil, due to
the thermal inertia of the whole oil mass stored in the tank, is simulated.
3.4) Ttank = moil-clutches (Tin- Tout)/moil-stored;
The third part reproduces the heat exchanger behaviour thanks to equation below trough
which it is possible to calculate the coolant and the oil temperature. Logically after the heat
exchanger the oil will flow again in the clutches part.
3.5) ln[(Toil_out -Tcool_out)/(Toil_in -Tcool_in)]= -UA(1/moil*cpoil+ 1/mcool*cpcool)
3.6) moil*cpoil*(Tout_oil -Tin_oil) = mcool*cpcool(Tout_cool -Tin_cool)
3.7) Qair = hairA( Tair – Tsurface);

29
In order to avoid temperature oscillation the average logarithm temperature is used (3.5) [9].
The global heat exchange coefficient U is strictly related to the heat exchanger area and to the
oil and water flow. A great part of the heat is logically exported by the water but also in this
part the convection of the air (3.7) plays a fundamental role to obtain realistic values.
30
4.0 TESTING AND VALIDATION
4.1 Testing and validation of the hydraulic circuit model
The second part of this work is focused on the calibration and validation of the hydraulic
model and in particular of the pistons displacement and the opening of the valves orifices.
The calibration starts with the recording of the valves currents and the pistons displacement
during a vehicle test. Since the amount of the data registered is computationally heavy to
handle only the information necessary for a model in the loop calibration is taken.
The pistons displacement is the most important measure to calibrate the model because these
components are responsible for the correct engagement of the synchronisers. The pistons must
be rapid to reach the end-stop but at the same time have to decelerate near the final position in
order to have a smooth engagement.
The data to calibrate the DCT synchronizers are taken from the same kind and same size
synchronizers used in an AMT transmission.
Considering this only the three-way valves are calibrated with the registered current value,
trying to match the ideal pressure calculated from the TCU with the one of the model.
Since the pressure values are ideal the work is focused on the reproduction of the pistons
displacement. At the beginning a translational Coulomb friction is introduced to overlap the
displacement of the real piston with the model one. After a lot of tests it is clear that using a
translational friction is not correct to overlap the displacement because there is a delay
between the current and the pressure recorded, due to a charge time of the proportional servo-
valve. For this reason it is introduced a delay in the model thanks to which the initial
displacement is perfectly matched (Fig.21).
31
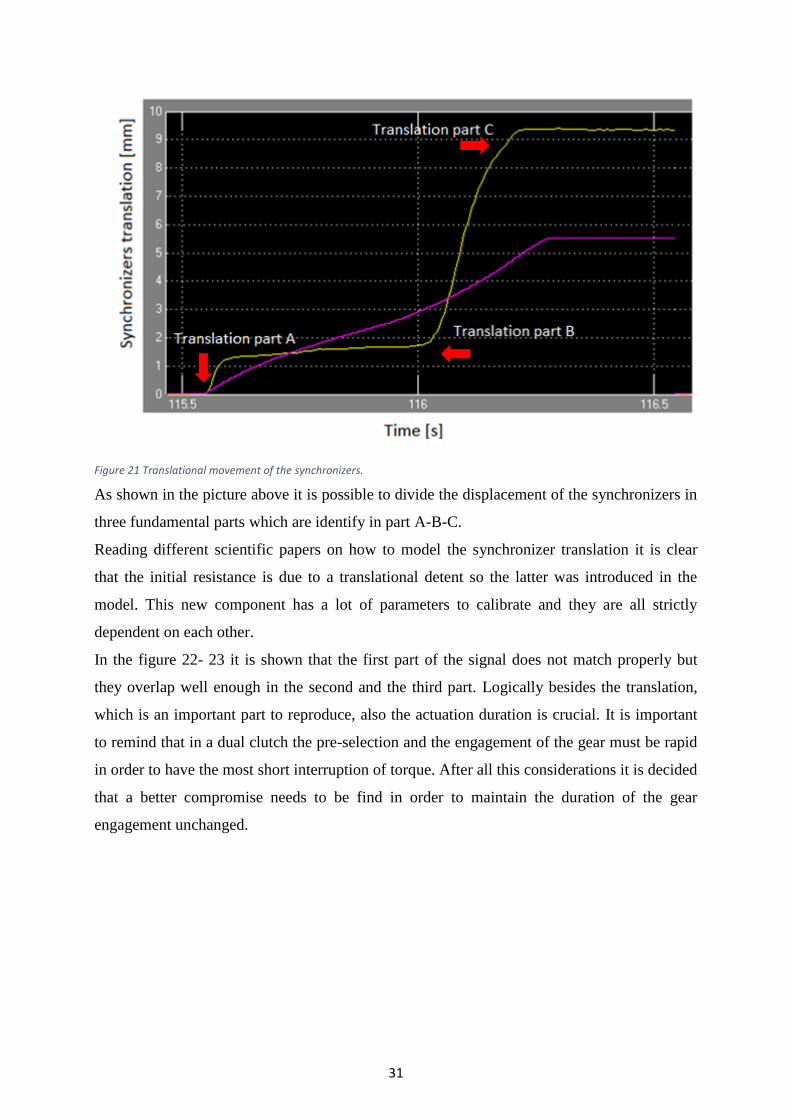
Figure 21 Translational movement of the synchronizers.
As shown in the picture above it is possible to divide the displacement of the synchronizers in
three fundamental parts which are identify in part A-B-C.
Reading different scientific papers on how to model the synchronizer translation it is clear
that the initial resistance is due to a translational detent so the latter was introduced in the
model. This new component has a lot of parameters to calibrate and they are all strictly
dependent on each other.
In the figure 22- 23 it is shown that the first part of the signal does not match properly but
they overlap well enough in the second and the third part. Logically besides the translation,
which is an important part to reproduce, also the actuation duration is crucial. It is important
to remind that in a dual clutch the pre-selection and the engagement of the gear must be rapid
in order to have the most short interruption of torque. After all this considerations it is decided
that a better compromise needs to be find in order to maintain the duration of the gear
engagement unchanged.

32
Figure 22
Figure 23
33
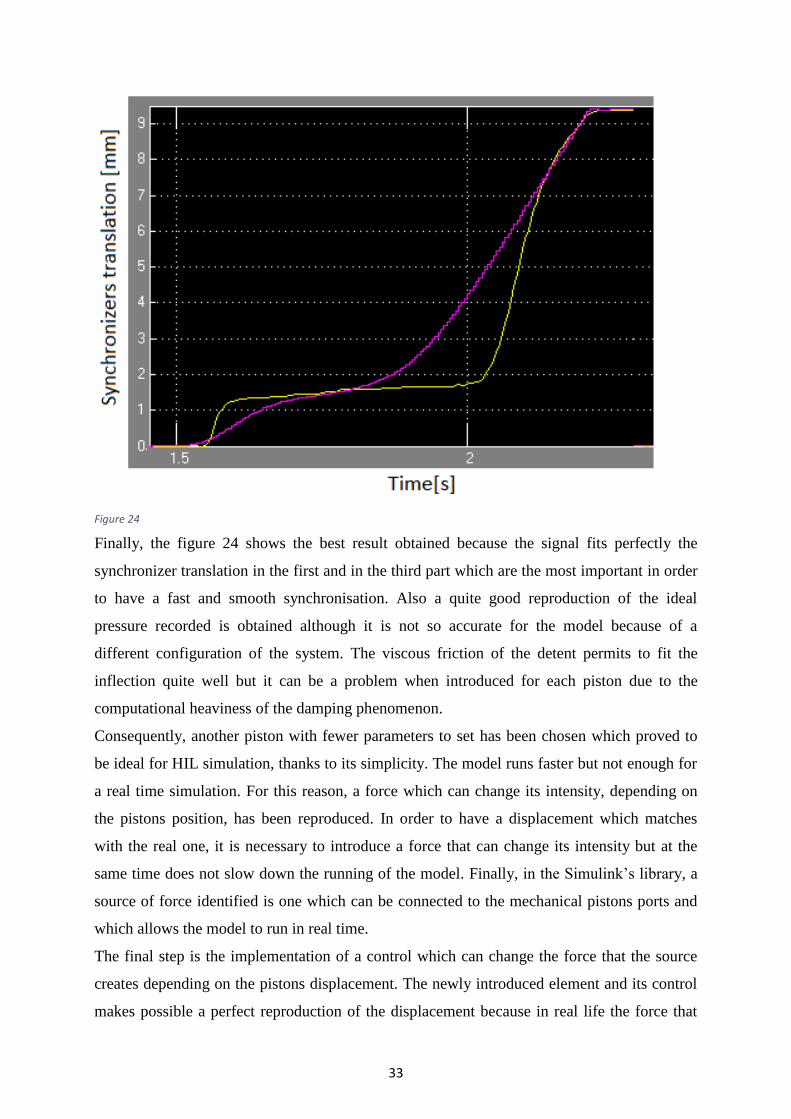
Figure 24
Finally, the figure 24 shows the best result obtained because the signal fits perfectly the
synchronizer translation in the first and in the third part which are the most important in order
to have a fast and smooth synchronisation. Also a quite good reproduction of the ideal
pressure recorded is obtained although it is not so accurate for the model because of a
different configuration of the system. The viscous friction of the detent permits to fit the
inflection quite well but it can be a problem when introduced for each piston due to the
computational heaviness of the damping phenomenon.
Consequently, another piston with fewer parameters to set has been chosen which proved to
be ideal for HIL simulation, thanks to its simplicity. The model runs faster but not enough for
a real time simulation. For this reason, a force which can change its intensity, depending on
the pistons position, has been reproduced. In order to have a displacement which matches
with the real one, it is necessary to introduce a force that can change its intensity but at the
same time does not slow down the running of the model. Finally, in the Simulink’s library, a
source of force identified is one which can be connected to the mechanical pistons ports and
which allows the model to run in real time.
The final step is the implementation of a control which can change the force that the source
creates depending on the pistons displacement. The newly introduced element and its control
makes possible a perfect reproduction of the displacement because in real life the force that
34
contrasts the shift raises with the raising of the position. The first force to be implemented in
the control is the friction which works if the velocity of the pistons is lower than a specific
value, calibrated with some tests. The second force to be reproduced is the detent’s one and,
in order to calibrate it, the values already used in the old detent are introduced. The third force
is due to the slip which acts during the synchronisation and which increases its intensity
proportionally to the shift. Logically when the piston has reached the target position the force
goes to zero and it can remain in equilibrium since the pressure raises in the other chamber.
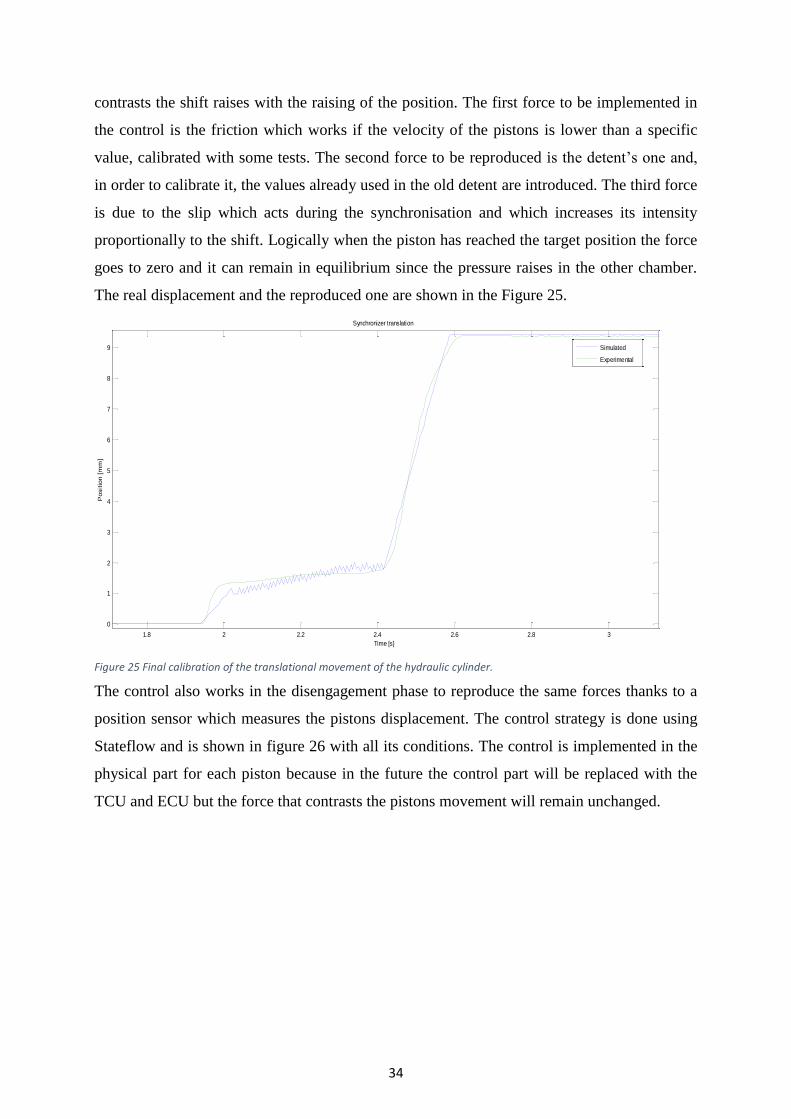
The real displacement and the reproduced one are shown in the Figure 25.
Figure 25 Final calibration of the translational movement of the hydraulic cylinder.
The control also works in the disengagement phase to reproduce the same forces thanks to a
position sensor which measures the pistons displacement. The control strategy is done using
Stateflow and is shown in figure 26 with all its conditions. The control is implemented in the
physical part for each piston because in the future the control part will be replaced with the
TCU and ECU but the force that contrasts the pistons movement will remain unchanged.
1.8 2 2.2 2.4 2.6 2.8 3
0
1
2
3
4
5
6
7
8
9
Time [s]
Posit
ion [
mm
]
Synchronizer translation
Simulated
Experimental
35
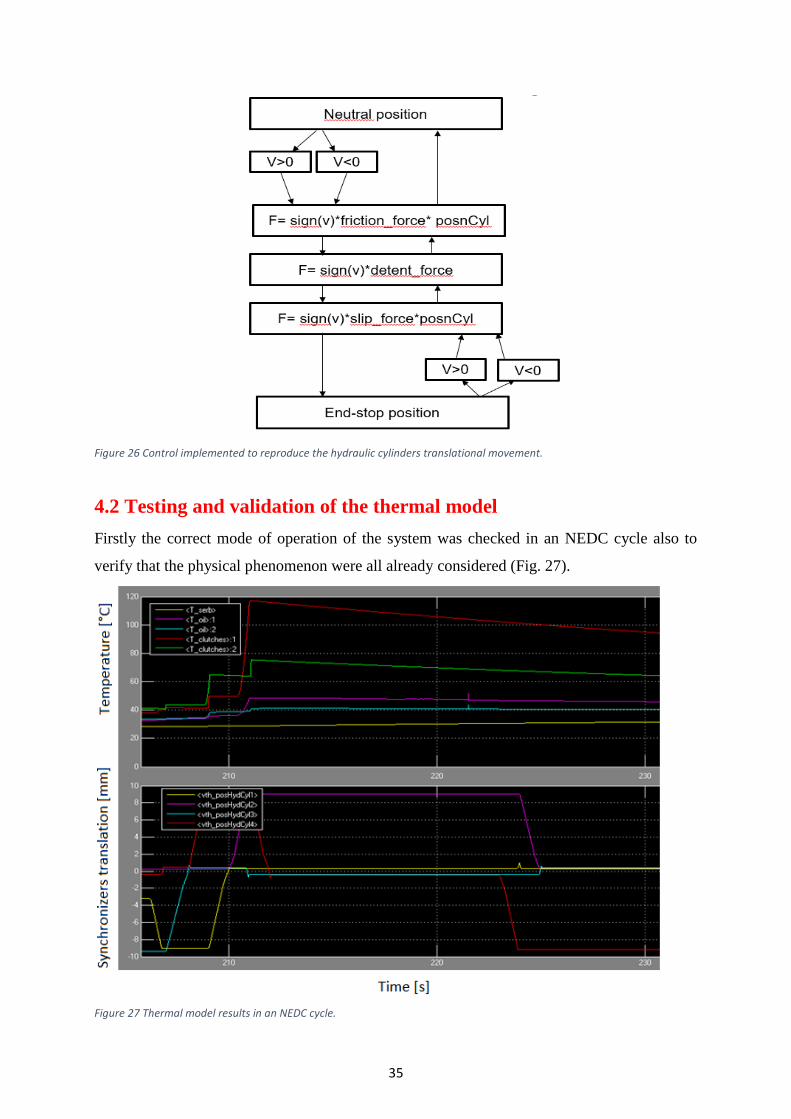
Figure 26 Control implemented to reproduce the hydraulic cylinders translational movement.
4.2 Testing and validation of the thermal model
Firstly the correct mode of operation of the system was checked in an NEDC cycle also to
verify that the physical phenomenon were all already considered (Fig. 27).
Figure 27 Thermal model results in an NEDC cycle.
36
As expected the clutches temperature increases during the gear engagement and subsequently
decreases thanks to the oil convection. The tank temperature increases slowly due to the high
amount of oil stored in it. Subsequently to better calibrate and validate the model it is decided
to perform a series of test at Nardò technical center.
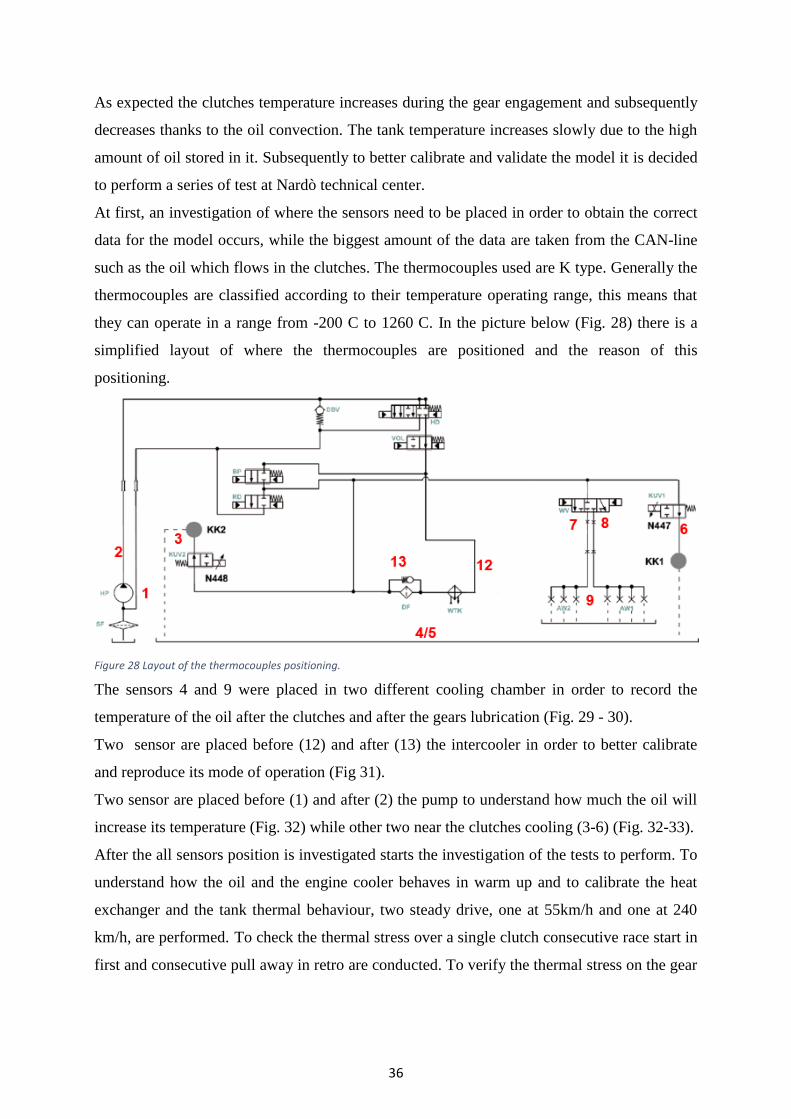
At first, an investigation of where the sensors need to be placed in order to obtain the correct
data for the model occurs, while the biggest amount of the data are taken from the CAN-line
such as the oil which flows in the clutches. The thermocouples used are K type. Generally the
thermocouples are classified according to their temperature operating range, this means that
they can operate in a range from -200 C to 1260 C. In the picture below (Fig. 28) there is a
simplified layout of where the thermocouples are positioned and the reason of this
positioning.
Figure 28 Layout of the thermocouples positioning.
The sensors 4 and 9 were placed in two different cooling chamber in order to record the
temperature of the oil after the clutches and after the gears lubrication (Fig. 29 - 30).
Two sensor are placed before (12) and after (13) the intercooler in order to better calibrate
and reproduce its mode of operation (Fig 31).
Two sensor are placed before (1) and after (2) the pump to understand how much the oil will
increase its temperature (Fig. 32) while other two near the clutches cooling (3-6) (Fig. 32-33).
After the all sensors position is investigated starts the investigation of the tests to perform. To
understand how the oil and the engine cooler behaves in warm up and to calibrate the heat
exchanger and the tank thermal behaviour, two steady drive, one at 55km/h and one at 240
km/h, are performed. To check the thermal stress over a single clutch consecutive race start in
first and consecutive pull away in retro are conducted. To verify the thermal stress on the gear
37
engagement lines 4 lap in race mode of the Nardò handling track are executed. After all the
data are collected and analysed the thermal model calibration begins.
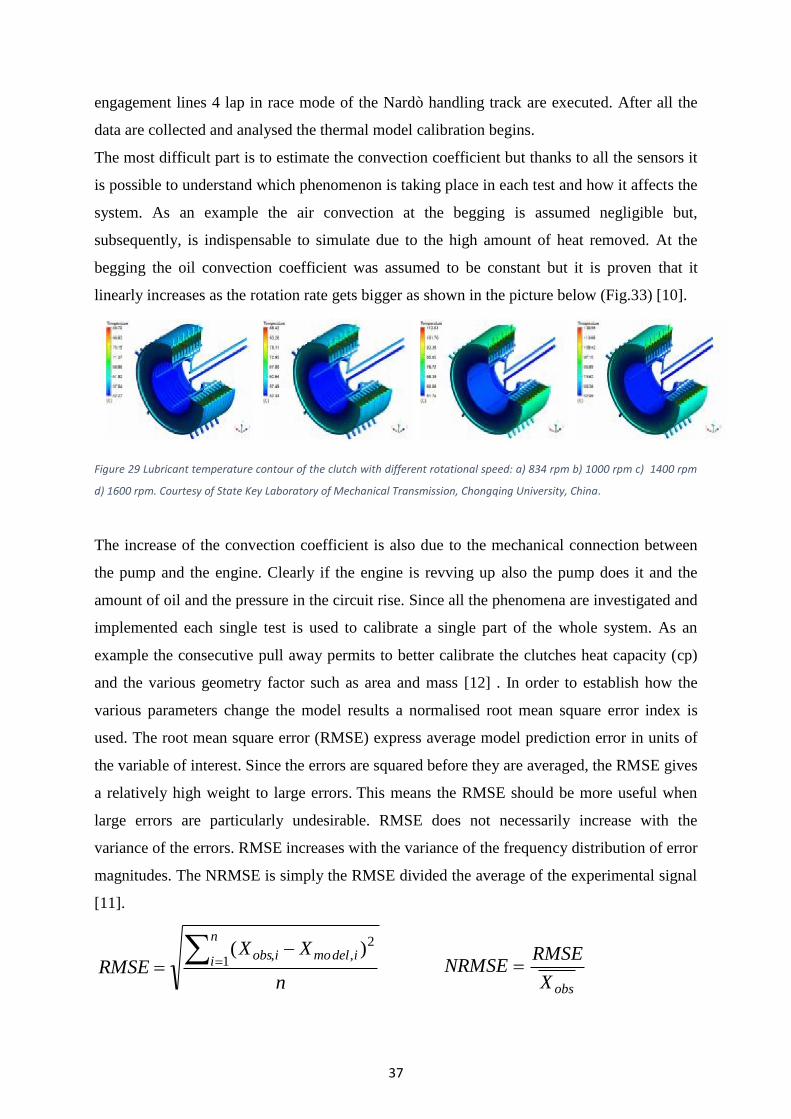
The most difficult part is to estimate the convection coefficient but thanks to all the sensors it
is possible to understand which phenomenon is taking place in each test and how it affects the
system. As an example the air convection at the begging is assumed negligible but,
subsequently, is indispensable to simulate due to the high amount of heat removed. At the
begging the oil convection coefficient was assumed to be constant but it is proven that it
linearly increases as the rotation rate gets bigger as shown in the picture below (Fig.33) [10].
Figure 29 Lubricant temperature contour of the clutch with different rotational speed: a) 834 rpm b) 1000 rpm c) 1400 rpm
d) 1600 rpm. Courtesy of State Key Laboratory of Mechanical Transmission, Chongqing University, China.
The increase of the convection coefficient is also due to the mechanical connection between
the pump and the engine. Clearly if the engine is revving up also the pump does it and the
amount of oil and the pressure in the circuit rise. Since all the phenomena are investigated and
implemented each single test is used to calibrate a single part of the whole system. As an
example the consecutive pull away permits to better calibrate the clutches heat capacity (cp)
and the various geometry factor such as area and mass [12] . In order to establish how the
various parameters change the model results a normalised root mean square error index is
used. The root mean square error (RMSE) express average model prediction error in units of
the variable of interest. Since the errors are squared before they are averaged, the RMSE gives
a relatively high weight to large errors. This means the RMSE should be more useful when
large errors are particularly undesirable. RMSE does not necessarily increase with the
variance of the errors. RMSE increases with the variance of the frequency distribution of error
magnitudes. The NRMSE is simply the RMSE divided the average of the experimental signal
[11].
n
XXRMSE
n
i idelmoiobs =−
= 1
2,, )(
obsX
RMSENRMSE =
38
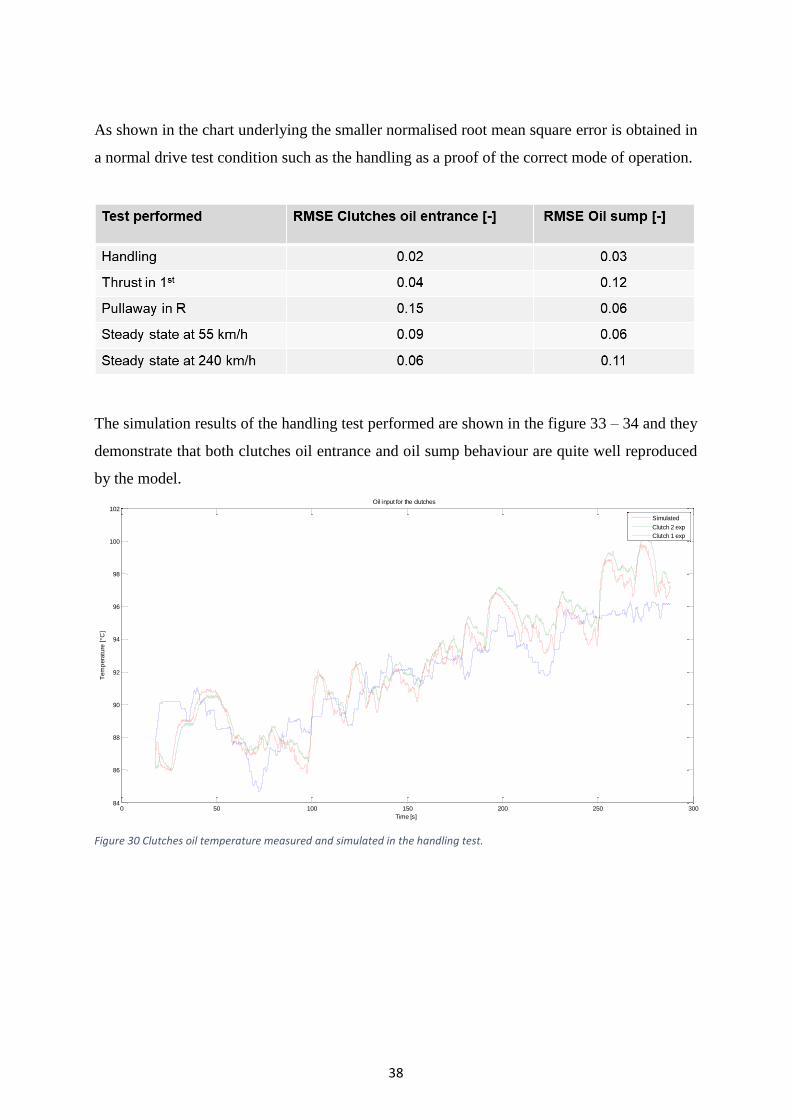
As shown in the chart underlying the smaller normalised root mean square error is obtained in
a normal drive test condition such as the handling as a proof of the correct mode of operation.
The simulation results of the handling test performed are shown in the figure 33 – 34 and they
demonstrate that both clutches oil entrance and oil sump behaviour are quite well reproduced
by the model.
Figure 30 Clutches oil temperature measured and simulated in the handling test.
0 50 100 150 200 250 30084
86
88
90
92
94
96
98
100
102
Time [s]
Tem
pera
ture
[°C
]
Oil input for the clutches
Simulated
Clutch 2 exp
Clutch 1 exp
39
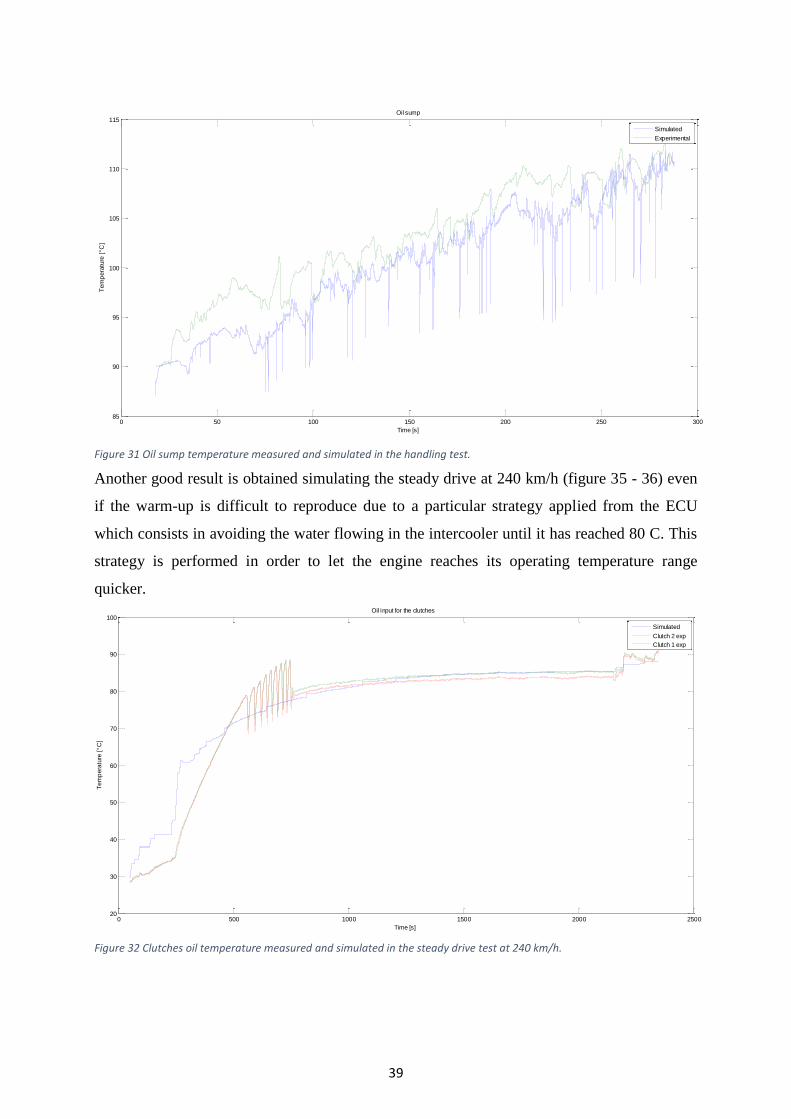
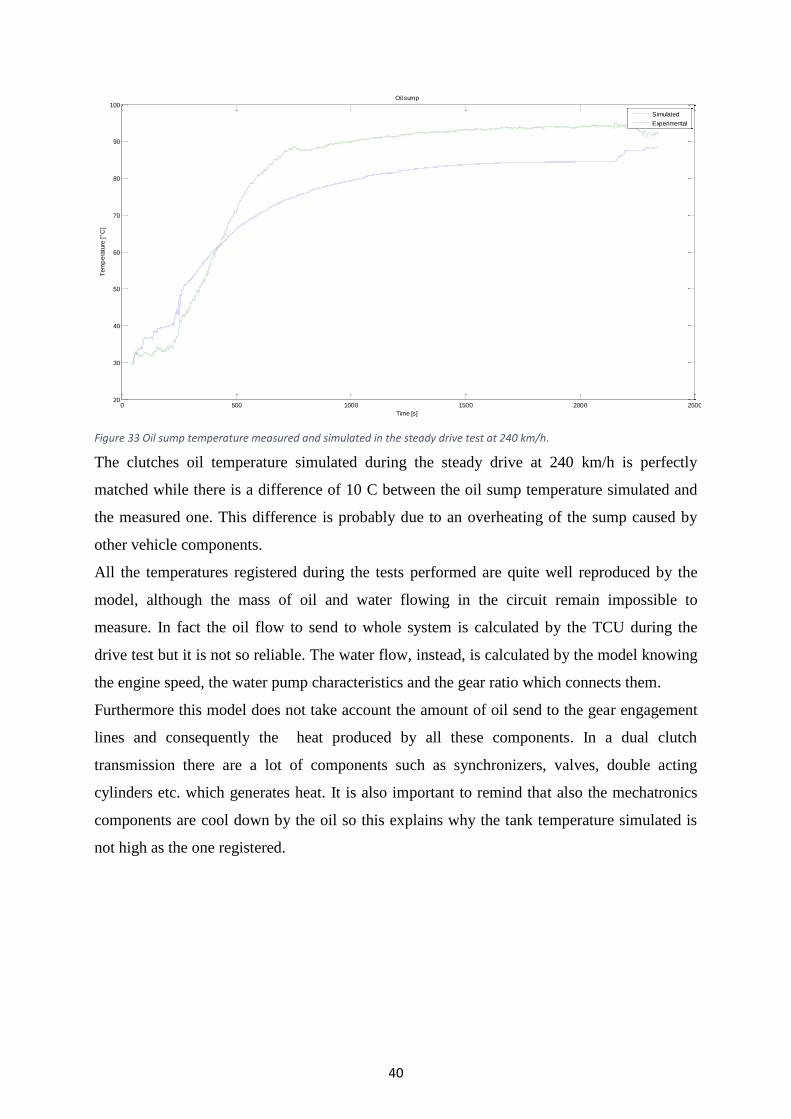
Figure 31 Oil sump temperature measured and simulated in the handling test.
Another good result is obtained simulating the steady drive at 240 km/h (figure 35 - 36) even
if the warm-up is difficult to reproduce due to a particular strategy applied from the ECU
which consists in avoiding the water flowing in the intercooler until it has reached 80 C. This
strategy is performed in order to let the engine reaches its operating temperature range
quicker.
Figure 32 Clutches oil temperature measured and simulated in the steady drive test at 240 km/h.
0 50 100 150 200 250 30085
90
95
100
105
110
115
Time [s]
Tem
pera
ture
[°C
]
Oil sump
Simulated
Experimental
0 500 1000 1500 2000 250020
30
40
50
60
70
80
90
100
Time [s]
Tem
pera
ture
[°C
]
Oil input for the clutches
Simulated
Clutch 2 exp
Clutch 1 exp
40
Figure 33 Oil sump temperature measured and simulated in the steady drive test at 240 km/h.
The clutches oil temperature simulated during the steady drive at 240 km/h is perfectly
matched while there is a difference of 10 C between the oil sump temperature simulated and
the measured one. This difference is probably due to an overheating of the sump caused by
other vehicle components.
All the temperatures registered during the tests performed are quite well reproduced by the
model, although the mass of oil and water flowing in the circuit remain impossible to
measure. In fact the oil flow to send to whole system is calculated by the TCU during the
drive test but it is not so reliable. The water flow, instead, is calculated by the model knowing
the engine speed, the water pump characteristics and the gear ratio which connects them.
Furthermore this model does not take account the amount of oil send to the gear engagement
lines and consequently the heat produced by all these components. In a dual clutch
transmission there are a lot of components such as synchronizers, valves, double acting
cylinders etc. which generates heat. It is also important to remind that also the mechatronics
components are cool down by the oil so this explains why the tank temperature simulated is
not high as the one registered.
0 500 1000 1500 2000 250020
30
40
50
60
70
80
90
100
Time [s]
Tem
pera
ture
[°C
]Oil sump
Simulated
Experimental
41
CONCLUSIONS AND FUTURE WORKS
In this master thesis an hydraulic circuit and a thermal model for a dual clutch transmission
has been developed using Simscape and Simulink in order to reproduce the behaviour of a
real transmission and understand how much stress and heat influence the clutches and all the
various components.
The transmission controller has the task to chose the correct gear based on the vehicle
velocity and on the engine speed, send the request to the actuators and preselect and
subsequently engage the target gear. As in a real transmission the gear selection keeps 0,250 s
(in fast shift) to finish and the model has to reproduce every phases of this complex process.
The model is kept as simple as possible due to the necessity of be suitable for hardware in the
loop applications, namely be able to run in real time with step time of 1 ms. The model shall
be able to take as input the TCU signal and reproduce all the operations of a real system in
order to test, in safety and without the whole hardware system, the correct mode of operation
of the control unit.
Furthermore, thanks to the thermal model is possible to establish how much heat is produced
during the clutches closing and the stress their are subjected. The temperature rises in a wet
multi-plate clutch during engagement and disengagement is very crucial because it is one of
the parameters which have a direct influence on the clutch life. The slipping of the clutch
happens during engagement and disengagement where the friction material on the plates will
undergo a change of state from solid to semi-solid state and the friction material properties
start to deteriorate. This inconvenience could also cause the change of the clutches torque
capacity which is an essential characteristic on which based the transmission control in order
to satisfy the torque requested from the driver.
Logically the heat produced is related to the power losses and a compromise is needed
between the efficiency and the durability of the clutches linings.
Thermal behaviour study can contribute to the design of future transmission prototypes and
calculating its reliability avoiding unnecessary failures. It could help accelerating products
development speed and save money.
In the future would be interesting introduce a friction model for the clutches addicted to the
oil temperature in order to establish the changing of the torque capacity. Thanks to the
thermal model will be possible calculate the oil and the clutches temperature through which
change the friction coefficient. Logically the clutches torque capability will change both due

42
to the change of the friction coefficient and due to thermal dilatations of the clutches thrust
bearing.
43
Bibliogrpahy
[1] Paul D. Walker, Nong Zhang. Engagement and control of synchroniser in dual clutch
transmission. Elsevier Journal, Mechanical System and Signal Processing.
[2] Alexandre Ravey. Design and control strategy of powertrain in hybrid electric
vehicles. Université de Technologie de Belfort-Montbeliard, 2012.
[3] Karthik Upendra. Dual Clutch Transmission for Plug-in hybrid electric vehicle
Comparative analysis with Toyota hybrid system. Department of Signal and systems
Chalmers University of Technology Goteborg, Sweden 2014.
[4] Gühmann Clemens. Model-Based Testing of Automotive Electronic Control Units.
Technische Universität Berlin, Department of Electronic Measurement and Diagnostic
Technology.
[5] Abhishek Dutta, Clara M. Ionescu, Bart Wyns, Robin De Keyser, Julian Stoev,
Gregory Pinte, Wim Symens. Switched Predictive Control Design for Optimal Wet-
clutch Engagement. Dept. of Electrical Energy, Systems and Automation, Ghent
University, Belgium.
[6] Rahul R, Pugazhenthi R, Eugene Jesu Antony A, Viswanath B and Asst Prof. Arul
Selvan. Mathematical Modelling of Temperature Rise in Clutch and Design, Analysis
and Fabrication of Cooling System for Clutch. Department of Automobile Engineering,
Anna University, Madras Institute of Technology Campus, India.
[7] Xingxing Zhou, Paul Walker, Nong Zhang, Bo Zhu, Jiageng Ruan. Simulation of
Thermal behavior of a Two-speed Dual Clutch Transmssion. School of Electrical,
Mechanical and Mechatronic Systems Faculty of Engineering and Information
Technology (FEIT)The University of Technology, Sydney (UTS), State Key Laboratory
of Advanced Design and Manufacturing for Vehicle Design, Hunan University,
Changsha, China BAIC Motor Electric Vehicle Co LtdBAIC Motor Electric Vehicle Co
Ltd, Beijing, China.
44
[9] Yunus A. çengel. Termodinamica e trasmissione del calore. Edizione italiana a cura
di Ettore Cirillo.
[10] Tengjiao Lin, Qing Wang, Quancheng Peng and Yan Xie. Heat-fluid Coupling
Simulation of Wet Friction Clutch. State Key Laboratory of Mechanical Transmission,
Chongqing University, China.
[11] CTEC. Universidade federal de Alagoas Centro de Tecnologia.
[12] Oday I. ABDULLAH1, Josef SCHLATTMANN. Thermal behaviour of friction
clutch disc based on uniform pressure and uniform wear assumptions. System
Technologies and Mechanical Design Methodology, Hamburg University of
Technology, Hamburg 21073, Germany.