Embed Size (px)
Citation preview
Sectoral Withdrawals, Water-efficient Agriculture, and Institutional Mechanisms
Reallocating Water for India’s Growth
Vaibhav Chaturvedi, Kangkanika Neog, Sujata Basu, Arunabha Ghosh, Sumit K. Gautam, and Ishita Jalan
Report December 2020
Centre forEnergy Finance

Reallocating Water for India’s Growth: Sectoral Withdrawals, Water-efficient Agriculture, and Institutional Mechanisms
Image: iStock
Growing industrial production requires a reliable and sustained water supply. With the Make in India programme, water needs for manufacturing will rise, and without water, growth could be constrained.
CEEW ReportDecember 2020
ceew.in
Centre forEnergy Finance
Sectoral Withdrawals, Water-efficient Agriculture, and Institutional Mechanisms
Reallocating Water for India’s Growth
Vaibhav Chaturvedi, Kangkanika Neog, Sujata Basu, Arunabha Ghosh, Sumit K. Gautam, and Ishita Jalan

Reallocating Water for India’s Growth: Sectoral Withdrawals, Water-efficient Agriculture, and Institutional Mechanisms
Copyright © 2020 Council on Energy, Environment and Water (CEEW).
Open access. Some rights reserved. This study is licensed under the Creative Commons Attribution-
Noncommercial 4.0. International (CC BY-NC 4.0) license. To view the full license, visit: www.
creativecommons.org/licenses/ by-nc/4.0/legalcode.
Suggested citation: Chaturvedi, Vaibhav, Kangkanika Neog, Sujata Basu, Arunabha Ghosh, Sumit K. Gautam, and Ishita
Jalan. 2020. Reallocating Water for India’s Growth: Sectoral Withdrawals, Water-efficient Agriculture, and
Institutional Mechanisms. New Delhi: Council on Energy, Environment and Water.
Disclaimer: The views expressed in this report are those of the authors and do not necessarily reflect the views and
policies of the Council on Energy, Environment and Water.
Cover image: iStock.
Peer reviewers: Rahul Sen, Director, R. S. Development Solutions and Research Services Pvt Ltd; Dr S. K. Sarkar, Senior
Director, Natural Resource & Climate, The Energy and Resources Institute, and Abinash Mohanty,
Programme Lead, CEEW.
Publication team: Alina Sen (CEEW), The Clean Copy, Twig Designs, and Friends Digital.
Organisation: The Council on Energy, Environment and Water (ceew.in) is one of Asia’s leading not-for-profit policy
research institutions. The Council uses data, integrated analysis, and strategic outreach to explain and
change the use, reuse, and misuse of resources. It prides itself on the independence of its high-quality
research, develops partnerships with public and private institutions and engages with the wider public.
In 2020, CEEW once again featured across nine categories in the 2019 Global Go To Think Tank Index
Report. It has also been consistently ranked among the world’s top climate change think tanks. Follow us
on Twitter @CEEWIndia for the latest updates.
Council on Energy, Environment and Water Sanskrit Bhawan, A-10 Qutab Institutional Area, Aruna Asaf Ali Marg, New Delhi - 110067, India
About CEEW
The Council on Energy, Environment and Water (CEEW) is one of Asia’s leading not-for-profit policy research institutions. The Council uses data, integrated analysis, and strategic outreach to explain — and change — the use, reuse, and misuse of resources. The Council addresses pressing global challenges through an integrated and internationally focused approach. It prides itself on the independence of its high-quality research, develops partnerships with public and private institutions, and engages with the wider public.
The Council’s illustrious Board comprises Mr Jamshyd Godrej (Chairperson), Mr Tarun Das, Dr Anil Kakodkar, Mr S. Ramadorai, Mr Montek Singh Ahluwalia, Dr Naushad Forbes, Ambassador Nengcha Lhouvum Mukhopadhaya, and Dr Janmejaya Sinha. The 100 plus executive team is led by Dr Arunabha Ghosh. CEEW is certified as a Great Place To Work®.
In 2020, CEEW once again featured extensively across nine categories in the 2019 Global Go To Think Tank Index Report, including being ranked as South Asia’s top think tank (15th globally) in our category for the seventh year in a row. CEEW has also been ranked as South Asia’s top energy and resource policy think tank for the second year running. It has consistently featured among the world’s best managed and independent think tanks, and twice among the world’s 20 best climate think tanks. In ten years of operations, The Council has engaged in 278 research projects, published 212 peer-reviewed books, policy reports and papers, created 100+ new databases or improved access to data, advised governments around the world nearly 700 times, promoted bilateral and multilateral initiatives on 80+ occasions, and organised 350+ seminars and conferences. In July 2019, Minister Dharmendra Pradhan and Dr Fatih Birol (IEA) launched the CEEW Centre for Energy Finance. In August 2020, Powering Livelihoods — a CEEW and Villgro initiative for rural start-ups — was launched by Minister Mr Piyush Goyal, Dr Rajiv Kumar (NITI Aayog), and H.E. Ms Damilola Ogunbiyi (SEforAll). The Council’s major contributions include: The 584-page National Water Resources Framework Study for India’s 12th Five Year Plan; the first independent evaluation of the National Solar Mission; India’s first report on global governance, submitted to the National Security Adviser; irrigation reform for Bihar; the birth of the Clean Energy Access Network; work for the PMO on accelerated targets for renewables, power sector reforms, environmental clearances, Swachh Bharat; pathbreaking work for the Paris Agreement, the HFC deal, the aviation emissions agreement, and international climate technology cooperation; the concept and strategy for the International Solar Alliance (ISA); the Common Risk Mitigation Mechanism (CRMM); critical minerals for Make in India; modelling uncertainties across 200+ scenarios for India’s low-carbon pathways; India’s largest multidimensional energy access survey (ACCESS); climate geoengineering governance; circular economy of water and waste; and the flagship event, Energy Horizons. It recently published Jobs, Growth and Sustainability: A New Social Contract for India’s Recovery.
The Council’s current initiatives include: A go-to-market programme for decentralised renewable energy-powered livelihood appliances; examining country-wide residential energy consumption patterns; raising consumer engagement on power issues; piloting business models for solar rooftop adoption; developing a renewable energy project performance dashboard; green hydrogen for industry decarbonisation; state-level modelling for energy and climate policy; reallocating water for faster economic growth; creating a democratic demand for clean air; raising consumer awareness on sustainable cooling; and supporting India’s electric vehicle and battery ambitions. It also analyses the energy transition in emerging economies, including Indonesia, South Africa, Sri Lanka and Viet Nam.
The Council has a footprint in 21 Indian states, working extensively with state governments and grassroots NGOs. It is supporting power sector reforms in Uttar Pradesh and Tamil Nadu, scaling up solar-powered irrigation in Chhattisgarh, supporting climate action plans in Gujarat and Madhya Pradesh, evaluating community-based natural farming in Andhra Pradesh, examining crop residue burning in Punjab, and promoting solar rooftops in Delhi and Bihar.

Reallocating Water for India’s Growth: Sectoral Withdrawals, Water-efficient Agriculture, and Institutional Mechanisms
Acknowledgments
The authors of this study would like to thank everyone whose inputs helped shape the various aspects of this study over the last year.
We are grateful to Dr Tushaar Shah, International Water Management Institute (IWMI), India, for his critical inputs during the study. We would also like to express our gratitude to Dr Amarjit Dhingra (Irrigation water sector expert), Dr Alok Kumar Sikka (IWMI, India), Dr Martin Burton (Independent consultant) and Dr A. K. Padhee (International Crops Research Institute for the Semi-Arid Tropics, India) for their constructive feedback during the stakeholder consultation.
We are also thankful to Rahul Sen (R. S. Development Solutions Research Services Pvt Ltd), Dr S. K. Sarkar (The Energy and Resources Institute), and Abinash Mohanty (CEEW) for their valuable comments during the external and internal peer reviews. Special thanks to Abhishek Jain (CEEW) for his valuable insights on the study. We would also like to thank Karishma, former intern, who made helpful contributions to this work. Special thanks to Surabhi Singh, Research Analyst at CEEW, who provided various inputs to the study and helped the publication team in the design process.
Finally, our sincere gratitude and thanks to all our colleagues at The Council for guiding and supporting us throughout the study.

Reallocating Water for India’s Growth: Sectoral Withdrawals, Water-efficient Agriculture, and Institutional Mechanisms

Dr Vaibhav Chaturvedi [email protected]
Vaibhav Chaturvedi, a Research Fellow at CEEW, leads The Council’s Low-Carbon Pathways focus-area research. He studies Indian and global climate change mitigation policy issues through the integrated assessment modelling framework of the Global Change Assessment Model (GCAM). Vaibhav has a PhD in Economics from the Indian Institute of Management, Ahmedabad and a master’s in Forest Management from the Indian Institute of Forest Management, Bhopal.
Kangkanika Neog [email protected]
Kangkanika is a researcher working on water policy. As a Programme Associate at CEEW, she focuses on their work on water. In her five years of work experience, she worked on the circular economy for wastewater, urban water, irrigation management and the energy–water nexus. She holds a master’s degree in Environmental Studies and Resource Management from the TERI School of Advanced Studies.
Dr Sujata Basu [email protected]
Dr Sujata Basu is an economist currently working as a Consultant in IQVIA, IMS Health. She has experience conducting data envelopment, time series, and panel data regression analysis. She has also taught courses on time series and micro- and macro-economics at Jawaharlal Nehru University (JNU) and TERI School of Advanced Studies. Sujata holds a PhD in Economics from JNU and a master’s in Economics from the Indian Statistical Institute.
The authors
“The field data–driven research reveals that there is a significant difference between the irrigation water-use productivity of an average farmer and the benchmark farmer for most crops. Harnessing this potential and reallocating water to other uses is imperative to ensure that the Indian economy generates jobs, achieves high growth, and puts sustainability in practice.”
“This study presents vital insights by estimating the cost of inaction, which can lead to water becoming a constraint to manufacturing.”
“In India, better and more efficient agricultural input management would help save water that could subsequently support growth in manufacturing, ensure water access for all, and improve water productivity. It is critical we develop a more nuanced understanding of policies and interventions that could correctly and fairly incentivise farmers to adopt practices for better input management and water-use efficiency.”

Reallocating Water for India’s Growth: Sectoral Withdrawals, Water-efficient Agriculture, and Institutional Mechanisms
Dr Arunabha Ghosh [email protected]
Dr Arunabha Ghosh is a public policy professional, adviser, author, columnist, and institution builder. As the founder-CEO of the Council on Energy, Environment and Water, since 2010, he has led CEEW to the top ranks as one of Asia’s leading policy research institutions (seven years in a row). He is, most recently, lead author of Jobs, Growth and Sustainability: A New Social Contract for India’s Recovery.
Dr Sumit K. Gautam [email protected]
Dr Sumit K. Gautam is a water and wastewater researcher with 14 years of experience. He has contributed to several research/consultancy projects (~ 20) as Lead Investigator and/or Senior Researcher and has published ~ 25 articles in peer-reviewed journals. He was the recipient of the Young Scientist Project by Department of Science and Technology (Government of India) and Endeavor Research Fellowship, Australian Government.
Ishita Jalan [email protected]
Ishita is currently pursuing her master’s degree in Environmental Engineering at the Technical University of Munich, specialising in Water Resource Management and Groundwater and Hydrogeology. She previously worked as a Research Analyst at CEEW. Her research interests include water management for adaptation and ecosystem services to increase climate resilience.
“Debates on water in India have thus far focussed on alternative governance models. Now we have a document that establishes how inefficiency in water use in agriculture impacts the economy as a whole. The debate must bring in more voices and lend more urgency to the centrality of water use for India’s development prospects.”
“Unlocking water from the Indian agriculture sector will have co-benefits such as improving farmer incomes and fueling the growth of other economic sectors.”
“The study identifies a significant potential for water savings in agriculture. As the next step, participation from users would be integral for demand-side management of water.”

Author contributions
Vaibhav Chaturvedi: Leading the execution of the project; providing inputs at every stage; co-authoring all chapters; and reviewing and editing the manuscript.
Kangkanika Neog: Execution of the project; conducting the literature review; data cleaning, processing and analysing; providing inputs at every stage; co-authoring all chapters; and reviewing and editing the entire manuscript.
Sujata Basu: Undertaking the stochastic frontier analysis for the study; providing inputs on interpreting the findings.
Arunabha Ghosh: Setting the narrative; providing inputs at every stage.
Sumit K. Gautam: Executing the project in its initial stages; providing methodological inputs.
Ishita Jalan: Conducting the literature review; data cleaning, processing, and analysing.

Reallocating Water for India’s Growth: Sectoral Withdrawals, Water-efficient Agriculture, and Institutional Mechanisms
Contents
Image: Unsplash
Executive summary
4. Results
4.1 Sectoral water withdrawals in the BAU scenario 4.2 Water productivity in agriculture: understanding the potential for reallocation 4.3 Deriving more value from water (alternative scenarios)
3.1 Estimating water withdrawn for irrigation, domestic, and industrial use for the BAU scenario 3.2 Estimating agriculture water productivity 3.3 Framework for reallocation in India 3.4 Data sources 3.5 Limitations of the study
3. Methodology and data sources
2. Background and motivation: the importance of enhancing irrigation water productivity
1. Introduction 1
5
9
21
10
21
16
27
18
29
1819
i
Annexures
References
5. Enabling factors for successful water reallocation and strategies for enhancing irrigation water productivity
5.1 Enabling factors for successful water reallocation 5.2 Strategies for enhancing irrigation water use productivity
6. Discussion: key issues related to water management and productivity
6.1 What drives inefficient and unproductive water use behaviour?6.2 The political economy of irrigation water use in India6.3 ICT and innovation in communication strategies for better water management6.4 Solar-powered irrigation systems6.5 Agricultural water management under a climate change scenario6.6 Prioritising reallocated water for environmental needs
7. Key insights and recommendations
45
35
57
61
71
45
4847
35
50
41
5254
Reallocating Water for India’s Growth: Sectoral Withdrawals, Water-efficient Agriculture, and Institutional Mechanisms
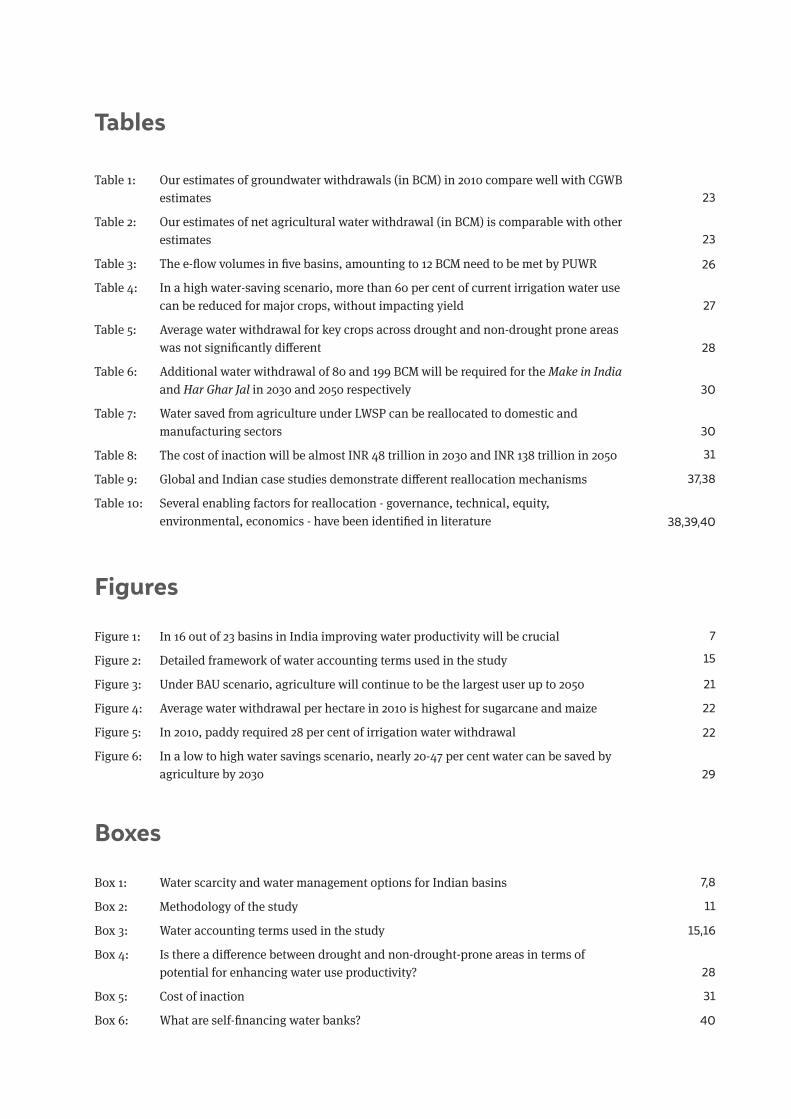
Tables
Table 1: Our estimates of groundwater withdrawals (in BCM) in 2010 compare well with CGWB estimates
Table 2: Our estimates of net agricultural water withdrawal (in BCM) is comparable with other estimates
Table 3: The e-flow volumes in five basins, amounting to 12 BCM need to be met by PUWR
Table 4: In a high water-saving scenario, more than 60 per cent of current irrigation water use can be reduced for major crops, without impacting yield
Table 5: Average water withdrawal for key crops across drought and non-drought prone areas was not significantly different
Table 6: Additional water withdrawal of 80 and 199 BCM will be required for the Make in India and Har Ghar Jal in 2030 and 2050 respectively
Table 7: Water saved from agriculture under LWSP can be reallocated to domestic and manufacturing sectors
Table 8: The cost of inaction will be almost INR 48 trillion in 2030 and INR 138 trillion in 2050
Table 9: Global and Indian case studies demonstrate different reallocation mechanisms
Table 10: Several enabling factors for reallocation - governance, technical, equity, environmental, economics - have been identified in literature
Figures
Figure 1: In 16 out of 23 basins in India improving water productivity will be crucial
Figure 2: Detailed framework of water accounting terms used in the study
Figure 3: Under BAU scenario, agriculture will continue to be the largest user up to 2050
Figure 4: Average water withdrawal per hectare in 2010 is highest for sugarcane and maize
Figure 5: In 2010, paddy required 28 per cent of irrigation water withdrawal
Figure 6: In a low to high water savings scenario, nearly 20-47 per cent water can be saved by agriculture by 2030
Boxes
Box 1: Water scarcity and water management options for Indian basins
Box 2: Methodology of the study
Box 3: Water accounting terms used in the study
Box 4: Is there a difference between drought and non-drought-prone areas in terms of potential for enhancing water use productivity?
Box 5: Cost of inaction
Box 6: What are self-financing water banks?
23
23
26
27
28
30
30
31
37,38
38,39,40
7
7,8
21
15,16
28
31
40
15
11
22
22
29
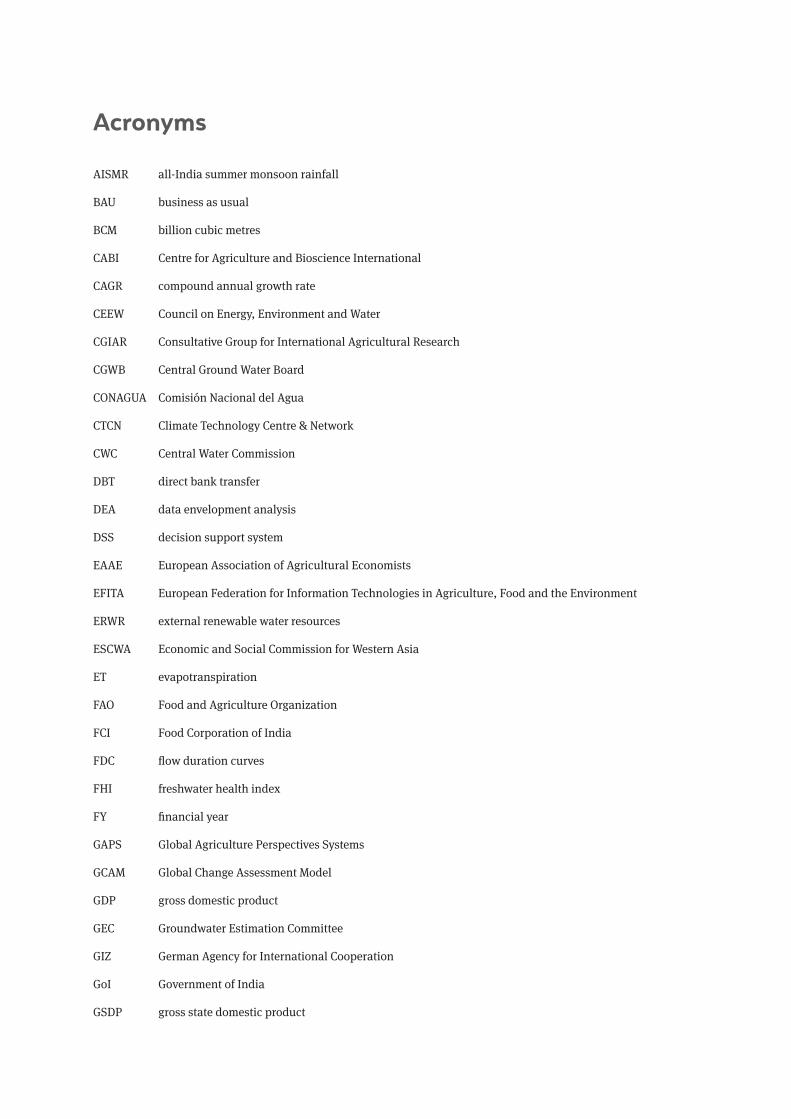
Acronyms
AISMR all-India summer monsoon rainfall
BAU business as usual
BCM billion cubic metres
CABI Centre for Agriculture and Bioscience International
CAGR compound annual growth rate
CEEW Council on Energy, Environment and Water
CGIAR Consultative Group for International Agricultural Research
CGWB Central Ground Water Board
CONAGUA Comisión Nacional del Agua
CTCN Climate Technology Centre & Network
CWC Central Water Commission
DBT direct bank transfer
DEA data envelopment analysis
DSS decision support system
EAAE European Association of Agricultural Economists
EFITA European Federation for Information Technologies in Agriculture, Food and the Environment
ERWR external renewable water resources
ESCWA Economic and Social Commission for Western Asia
ET evapotranspiration
FAO Food and Agriculture Organization
FCI Food Corporation of India
FDC flow duration curves
FHI freshwater health index
FY financial year
GAPS Global Agriculture Perspectives Systems
GCAM Global Change Assessment Model
GDP gross domestic product
GEC Groundwater Estimation Committee
GIZ German Agency for International Cooperation
GoI Government of India
GSDP gross state domestic product
Reallocating Water for India’s Growth: Sectoral Withdrawals, Water-efficient Agriculture, and Institutional Mechanisms
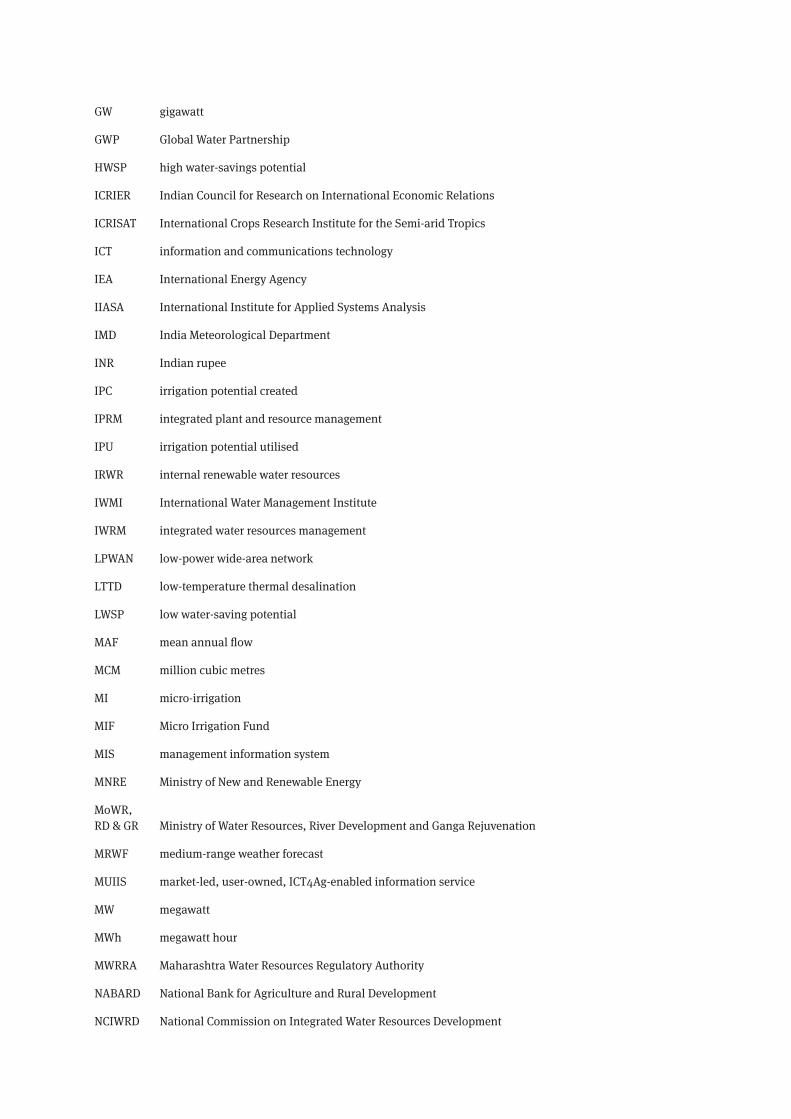
GW gigawatt
GWP Global Water Partnership
HWSP high water-savings potential
ICRIER Indian Council for Research on International Economic Relations
ICRISAT International Crops Research Institute for the Semi-arid Tropics
ICT information and communications technology
IEA International Energy Agency
IIASA International Institute for Applied Systems Analysis
IMD India Meteorological Department
INR Indian rupee
IPC irrigation potential created
IPRM integrated plant and resource management
IPU irrigation potential utilised
IRWR internal renewable water resources
IWMI International Water Management Institute
IWRM integrated water resources management
LPWAN low-power wide-area network
LTTD low-temperature thermal desalination
LWSP low water-saving potential
MAF mean annual flow
MCM million cubic metres
MI micro-irrigation
MIF Micro Irrigation Fund
MIS management information system
MNRE Ministry of New and Renewable Energy
MoWR, RD & GR Ministry of Water Resources, River Development and Ganga Rejuvenation
MRWF medium-range weather forecast
MUIIS market-led, user-owned, ICT4Ag-enabled information service
MW megawatt
MWh megawatt hour
MWRRA Maharashtra Water Resources Regulatory Authority
NABARD National Bank for Agriculture and Rural Development
NCIWRD National Commission on Integrated Water Resources Development
NIE National Institute of Epidemiology
NRLP National River Linking Project
NRW non-revenue water
PANI Provision of Advisory for Necessary Irrigation
PDMC per drop more crop
PM-KUSUM Pradhan Mantri Kisan Urja Suraksha evem Utthaan Mahabhiyan
PMKSY Pradhan Mantri Krishi Sinchayee Yojana
PSPCL Punjab State Power Corporation Limited
PUWR potentially utilisable water resources
RMD raw materials division
SCS Soil Conservation Service
SDG sustainable development goals
SFA Stochastic frontier analysis
SLB service-level benchmarking
SMS short message service
SPIS solar-powered irrigation systems
TERI The Energy and Resources Institute
TFP total factor productivity
TISS Tata Institute of Social Sciences
TPS thermal power station
TRWR total renewable water resources
UN United Nations
UNESCO United Nations Educational, Scientific and Cultural Organization
USA United States of America
USD United States Dollar
USDA United States Department of Agriculture
VDC Village Development Committee
VDSA Village Dynamics in South Asia
WFR West-flowing rivers
WSN wireless sensors network
WUA Water User Association
WUE water use efficiency
UNDP United Nations Development Programme

Reallocating Water for India’s Growth: Sectoral Withdrawals, Water-efficient Agriculture, and Institutional Mechanisms
Image: iStock
Under the Har Ghar Jal (Water for all) programme, India plans to provide 100 per cent piped water supply connections to rural households by 2024. Currently only 30 per cent of rural households have piped water supply.
Water is a critical resource for social and economic growth. In the coming years, to realise greater economic growth, India will require a multitude of resources, of which water is
vital. Yet, India’s economy, and the country’s agriculture sector in particular, is highly water-intensive, and substantial water resources are locked up in less productive growth. India uses two to three times more water to produce a unit of a major food crop in comparison to China, Brazil, and the US. In parallel, the demand for water in other sectors is rapidly escalating, leading to increasing conflicts across regions in India. Growing industrial production requires a reliable and sustained water supply, without which growth will be constrained. Given increased water demand and growing shortages, India will need to reallocate water away from water-intensive sectors to those with higher water productivity to support future economic growth.
Globally, countries are using water reallocation as a response to water shortages. While there are many possible demand- and supply-side responses to the impending water crisis, enhancing irrigation water-use productivity is key and should be prioritised for two reasons. First, if irrigation water productivity is not improved, non-agriculture sectors will face water shortages in most parts of India, except for the water-abundant eastern states. Second, enhancing irrigation water productivity is a more cost-effective strategy for managing water as compared to many other interventions, particularly the provision of large surface water reservoirs and water distribution structures. To better understand the potential for water reallocation to support India’s rapidly growing economy and meet future demands for water (including the provision of piped water connections for all rural households under the Har Ghar Jal programme and the additional water required to boost manufacturing through the Make in India programme), our study focusses on the following research objectives: (i) to quantify the magnitude of water that could be potentially reallocated from irrigation to other sectors in India without compromising on agricultural output; and (ii) to recommend a pathway for a reallocation strategy for India. We also attempt to provide high level preliminary estimate of the economic costs of inaction if the current pattern of water allocation across sectors continues.
The overarching paradigm used in this study is that of allocative efficiency. To understand and achieve a higher allocative efficiency of water use in the Indian economy, we used the stochastic frontier analysis (SFA) model to examine water productivity in irrigation (including surface water, groundwater, and rainfall) for eight crop categories for India. The SFA model of estimating inefficiency is an economic model rather than a biophysical one. In this
i
Executive summary
The overarching paradigm used in this study is that of allocative efficiency
Reallocating Water for India’s Growth: Sectoral Withdrawals, Water-efficient Agriculture, and Institutional Mechanisms
approach, we benchmark the irrigation water-use productivities of different farmers against the best farmer for each crop and region based on actual irrigation water-use data from a field survey. We chose three representative states to cover different agro-ecological zones as well as to ensure that we have a good representation of key crops. Based on our analysis of crops across three states, we derive crop-specific minimum and maximum values for water savings to estimate the range of possible water productivity improvement for the given crop. We use this range to estimate a low water-saving and a high water-saving scenario for the Indian agricultural sector, which allows us to estimate how much water can potentially be reallocated. We then provide high level estimates of the cost of inaction, which captures the extent to which inefficient irrigation water use will become a constraint to the growth of other sectors, namely the manufacturing and domestic use sectors. We estimate the total value addition from water use assuming the successful implementation of the Make in India and Har Ghar Jal policies for 2030 and 2050 and estimate the cost of inaction if these targets are not met due to the inadequate availability of water.
We find that total water withdrawal in the business-as-usual (BAU) scenario is expected to increase from 949 billion cubic metres (BCM) in 2010 to 1,058 BCM in 2050. Water withdrawal for agriculture is estimated to grow slowly, while for manufacturing and domestic use, it is expected to grow rapidly. Still, agriculture is expected to constitute a lion’s share of India’s total water withdrawal across the next 30 years, its share increasing from 77 per cent in 2010 to 81 per cent in 2050. Water withdrawal related to thermal power cooling is expected to decrease significantly between 2010 and 2030 due to a Government of India regulation limiting water use in inland thermal power plants. On the other hand, water supply is quite evidently strained. Though India has 1,123 BCM of utilisable water, its surface water has not been beneficially developed. Of the 690 BCM of surface water available, India’s reservoir capacity is only 258 BCM. Given its ease of access and decentralised nature, groundwater continues to be the sought-after option for all sectors. However, indiscriminate irrigation withdrawals are resulting in rapidly declining levels of groundwater.
We find that there is significant potential to enhance water productivity across crops without compromising on output, although there may be significant differences across states for a given crop. For example, for paddy, there is potential to reduce water consumption per hectare by 25 per cent in Maharashtra, but the potential is even higher – 73 per cent – in Andhra Pradesh. This implies that in the latter state, the average representative farmer is using significantly more water than the most water-efficient (benchmark) paddy farmer in the state. Interestingly, we find that there is no significant difference in the potential for enhancing water productivity in drought- and non-drought-prone areas for the crops for which adequate data were available. For most crops, except for cotton in Maharashtra, average water consumed per hectare in drought-prone areas is lesser, but not significantly, as compared to the water used for the same crop in non-drought-prone areas.
We find that in 2030, compared with the BAU irrigation net water withdrawals, 160 BCM can be saved and reallocated according to conservative estimates, while the higher end of the saving potential could be 389 BCM. Similarly, in 2050, India can potentially save and reallocate between 166 BCM and as much as 403 BCM. This implies a potential saving of 20 to 47 per cent in India’s agricultural water withdrawals in 2030 as well as 2050. We find our high-level estimate of the cost of inaction, explained as the economic impact of failing to enhance irrigation water productivity and reallocate water to other sectors, to be almost
ii
There is significant potential to enhance water productivity across crops withoutcompromising on output
INR 48 trillion (USD 869 billion1) in 2030 and INR 138 trillion (USD 2,520 billion) in 2050. A large part of this cost could be attributed to the value-add that would have potentially been lost due to the non-achievement of an aggressive increase in manufacturing due to water constraints. The value-added per unit of water is very high for manufacturing compared to other sectors. Our cost of inaction estimates do not account for the general equilibrium economic impacts of interventions in one sector on the other economic sectors. Given the magnitude of our preliminary estimates, we suggest that a detailed and sophisticated analysis of the economic impacts of water reallocation across sectors be undertaken.
We discuss three key alternative institutional mechanisms for reallocating water based on past experiences – administrative allocation, formal and informal market-based allocation, and collective negotiation. In addition, we highlight the enabling factors for a successful reallocation regime across the governance, technical, equity, environmental, and economic dimensions.
Overall, we derive the following insights from our analysis:
i. There is significant potential to enhance irrigation water productivity, even if an average representative farmer adopts the practices undertaken by the most water-efficient farmer in the area;
ii. The pressure on India’s groundwater resources can be reduced significantly by enhancing irrigation water productivity;
iii. Ultimate irrigation potential can be achieved by enhancing irrigation water productivity;
iv. Sectoral water reallocation is imperative to achieve the goals of Make in India and Har Ghar Jal;
v. Introducing institutional mechanisms for enhancing irrigation water productivity and water reallocation needs to be made a priority to address potential water constraints in non-agricultural sectors;
vi. The implications of water pricing policies, water markets, input price subsidies, and minimum support prices need to be analysed to devise effective policies for facilitating irrigation water productivity and sectoral water reallocation.
Our study recommends the following as the next set of actions that should be undertaken for achieving the larger goals of reallocation:
• Choose a state where the competition for water resources poses a significant challenge and that is ready to experiment with an alternative reallocation regime.
• Undertake behavioural experiments and economic analyses to better understand what policies and interventions can impact irrigation water productivity in the chosen state.
• Devise a state-specific reallocation strategy based on existing institutions, enabling environments, and participatory stakeholder engagement.
• Implement the strategy on a pilot basis in a sub-basin and create a monitoring and evaluation plan to learn from the implementation process.
1. 2011–12 prices
iiiExecutive summary
The pressure on India’s groundwater resources can be reduced significantly by enhancing irrigation water productivity

Reallocating Water for India’s Growth: Sectoral Withdrawals, Water-efficient Agriculture, and Institutional Mechanisms
Image: iStock
Environmental flows are emerging as a major instrument for sustaining and/or rehabilitating the ecosystem functions and services of rivers worldwide.
Water resources are intricately linked to the prosperity of India. Achieving the country’s economic and sustainable development goals depends, among other factors, on the
availability of adequate, good quality water (United Nations in India 2020). Even though India seemingly has enough water resources, water shortages abound. While India receives an average annual rainfall of around 1,105 mm, there are vast spatial and temporal variations in its distribution. The country receives more than 80 per cent of its rainfall between June and September. Its unequal spatial distribution in both supply and demand is evidenced by the fact that while the Brahmaputra and Barak basins have a per capita water availability of 11,782 m3/ capita, the figure drops to 1,039 m3/capita for the Ganga basin (Central Water Commission 2019; Kim et al. 2018). India’s per capita water availability in 2010 was 1,545 m3, and therefore under moderate water shortage2 (Ministry of Water Resources 2012; Kummu et al. 2016). It is also crucial to note the inter-annual variability of rainfall in India. According to the Indian Institute of Tropical Meteorology’s assessment of all-India summer monsoon rainfall (AISMR; June–September) anomalies during 1871–2017, India had 19 major flood years and 26 major drought years in the period. In India, on average, 1,999 BCM of water are generated annually through the hydrological cycle (Central Water Commission 2019a). Of this, the water that can be utilised beneficially, called potential utilisable water resources (PUWR), is 1,123 BCM. The rest of the water cannot be utilised due to limitations posed by physiography, topography, inter-state issues, and the state of technology (for details of these water accounting terms, see Box 3).
Of this, 690 BCM is constituted by surface water and 433 BCM by groundwater (Ministry of Water Resources 1999). There is also a significant difference between the surface water availability and the surface reservoir capacity; the latter is substantially lower than the former. The live storage capacity of dams in India is around 258 BCM, which is only 13 per cent of the average annual flow (Central Water Commission 2019). To add to the complexity, reservoirs are also unequally distributed within India; 70 per cent of India’s reservoir capacity is concentrated in six states – Andhra Pradesh, Gujarat, Karnataka, Maharashtra, Madhya Pradesh, and Odisha (Central Water Commission 2020). Almost 70 per cent of groundwater blocks assessed by the CGWB are reported to be safe in these states (Central Ground Water Board 2017). On the other hand, states like Delhi, Haryana, Punjab, and Rajasthan, which account for only 5 per cent of India’s reservoir storage capacity, have less than 20 per cent of the safe groundwater blocks. While the relationship between groundwater use and surface water storage is influenced by other factors like inter-state transfers, the level of economic activities, etc., generally, states with inadequate surface reservoir capacity were seen to face significant pressures on their groundwater resources.
1. Introduction
2. Water shortage refers to the impact of low water availability per person.
Achieving the country’seconomic and sustainable development goals depends, among other factors, on the availability of adequate, good quality water
1

Reallocating Water for India’s Growth: Sectoral Withdrawals, Water-efficient Agriculture, and Institutional Mechanisms2
Water contamination is also an increasing concern due to large-scale, unplanned urbanisation and the discharge of untreated effluents by industries. Sixty-two per cent of the municipal sewage generated is left untreated. Similarly, only 62 per cent of industrial effluents is treated in India (Ministry of Environment, Forests and Climate Change 2019). As a result, surface water bodies have a diminished capacity to perform their ecological function due to several reasons including the over-abstraction of both surface and groundwater, leading to reduced river flows in the lean season and the large-scale release of sewage and effluents. In the case of groundwater, both geogenic and increasing anthropogenic contamination plague its quality. In India, groundwater in 45 and 21 per cent of districts is contaminated with naturally occurring geogenic contaminants like fluoride and arsenic, respectively, affecting 66.62 million people from 19 states (Ministry of Water Resources, River Development and Ganga Rejuvenation 2018; Ghosh 2017). Additionally, anthropogenic contamination of groundwater due to industrial discharges, landfills, and diffused sources of pollution like fertilisers and pesticides from agricultural fields is common (Central Ground Water Board 2017). The intensification of these challenges, along with climate change, is poised to alter water supplies and intensify floods and drought in the future. The recent growth pattern of the Indian economy, coupled with its high population growth and rapid urbanisation, is predicted to cause an increase in water demand. As per a recent NITI Aayog report, water scarcity is likely to worsen as India’s water demand will be twice the available supply by 2030. This might result in a 6 per cent loss in India’s GDP (NITI Aayog 2019).
Agriculture is the sector with the largest water footprint in India, accounting for almost 80 per cent of total water withdrawals. It has one of the lowest water productivities in the world for major crops in terms of the amount of biomass produced per unit of water depleted in crop production (Kumar et al. 2009). One of the main reasons for this is low water-use efficiency (Kumar et al. 2009). Currently, water-use efficiency in Indian agriculture is classified to be one of the poorest in the world. An FAO report monitoring water use efficiency across 127 countries found that the average water-use efficiency is a little over USD 15/m3 worldwide, with significant differences among countries and regions. India has one of the lowest water-use efficiencies of only USD 1.9/m3, ranking among the lowest 20 countries (Food and Agriculture Organisation of the United Nations 2018).
Demand from other sectors is also rapidly growing, leading to increasing conflicts across regions in India. With increasing water demand in various sectors, India is witnessing a rise in competition for water, at times even taking the form of protests and conflicts. One example of sectoral water conflicts is the protests concerning the allocation of the water from the Hirakud Dam in Odisha, India. In November 2007, around 40,000 farmers dependent on water from the dam protested the gradual increase in water use by industries, which led to a decrease in the water available for irrigating their fields. This protest was a peak event and had been preceded by several similar protests. Following this, the Government of Odisha promised that industries will only be provided with surplus water and irrigation water allocation will not be compromised. While the agitation is currently dormant, any shortage in irrigation water may trigger protests again. What is most interesting about this episode is the fact that Odisha is known to be one of the few water-abundant states in India.
Similar examples of water shortages impacting non-agricultural sectors are common. Thermal power stations such as Farakka thermal power station (TPS) in West Bengal, Raichur
Water-use efficiency in Indian agriculture is classified to be one of the poorest in the world
TPS in Karnataka, and Parli and Chandrapur TPS in Maharashtra faced shutdowns due to water shortages. Such instances have direct implications for the economy and livelihoods. A survey-based study in 2018 among businesses in the Delhi–Mumbai Industrial Corridor cited water shortage as one of the major roadblocks for achieving the goals of the ambitious Make in India programme, which aims to boost the share of manufacturing in GDP from the current 16 per cent to 25 per cent by 2024 (PHD Chamber of Commerce 2018). India, under the Har Ghar Jal (tap water to every household) programme, is currently also planning to provide 100 per cent piped water supply connections to rural households by 2024 (from the current 30 per cent coverage), which too would require a substantial amount of water.
Overall, the implication is clear – if India wants to sustain its current growth levels or achieve a higher level of per capita GDP, it needs to reduce the water intensity of its economy, make water available for other sectors, and avoid impending water shortages and associated conflicts.
Globally, water reallocation to enhance water productivity is increasingly being adopted as a response to water shortages (Briscoe and Malik 2007; Meinzen-Dick and Ringler 2006; Molle and Berkoff 2009). Essentially, this is the process of redirecting water allocation from a highly inefficient (both resource-wise and economically) sector, like agriculture, to a moderately efficient sector like domestic or industrial use. With growing awareness of the need to ensure the sustainability of water resources, environmental needs (e-flows3) can also be met through reallocation. Water reallocation projects need to ensure optimal distribution of water by the appropriate authorities to meet the needs of society while maintaining environmental sustainability, economic efficiency, and equity in distribution. Optimality could be defined by alternative metrics and objectives like maximising water-use efficiency, maximising economic returns from water use, or maximising the water available to support ecosystem services.
To better understand water reallocation’s potential to support India’s rapidly growing economy or its goal of providing piped water connections for all, our study focuses on the following research objectives:
• To quantify the magnitude of irrigation water that can be saved and potentially reallocated to other sectors without compromising agricultural output;
• To recommend a pathway for a reallocation strategy for India.
This research also attempts to provide high level preliminary estimate of the economic costs of inaction if the current pattern of water allocation across sectors continues.
This research aims to explore whether water reallocation is a critical policy solution, especially since water productivity is closely linked to India’s economic development goals. We undertake an economic approach, as opposed to analysing water efficiency through biophysical models. The overarching paradigm used in this study is that of allocative efficiency, i.e., water should be allocated to sectors where it has maximum productivity while ensuring that no other sector(s) is adversely hit in any way due to water reallocation. The methodology used in this study for water withdrawal estimations therefore also aims to reflect true ground conditions. Thus, our aim for this research is to identify reallocation potential that is financially and technically feasible.
3. E-flows describes the quantity, timing, and quality of freshwater flows and the levels necessary to sustain aquatic ecosystems which, in turn, support human cultures, economies, sustainable livelihoods, and well-being.
Globally, water reallocation to enhance water productivity is increasingly being adopted as a response to water shortages
3Introduction

Reallocating Water for India’s Growth: Sectoral Withdrawals, Water-efficient Agriculture, and Institutional Mechanisms4
Image: iStock
To manage our freshwater resources sustainably, improved irrigation service delivery, monitoring and maintenance of storage reservoirs are crucial.
5
To achieve water security, “coordinated development and management of water, land and related resources, in order to maximise the resultant economic and social welfare in an
equitable manner without compromising the sustainability of vital ecosystems” is essential, as recommended by the Integrated Water Resources Management (IWRM) framework (Global Water Partnership 2011, par. 1). Supply-side and demand-side measures are the means to achieve this (Katz 2016; Jønch-Clausen and Fugl 2001; 2030 Water Resources Group 2009). Countries’ water management regimes usually deploy a mix of supply and demand measures that are complementary and whose impacts are additive. While supply-side interventions focus on developing new resources, increasing storage, diverting water to increase supply, using technology to make water potable, and reducing service delivery losses, demand-side management largely involves reducing consumption patterns in any water demand sector and increasing the productivity of existing water use. While developing countries may choose to undertake supply-side interventions to manage their water needs, more developed economies are shifting their focus to demand management. Moreover, countries that have fully tapped their renewable water resources or have “closed basins” tend to concentrate on demand management more extensively (The Australian Water Partnership 2017). But overall, the emphasis on the type of intervention changes across time in many countries. In India, there is potential to use supply-side interventions to fill the gap between storage (258 BCM) and surface water availability (690 BCM) (Planning Commission 2012) as well as to improve water-use efficiency through demand-side measures. In this section, we focus on why demand-side management and reallocation of the water saved is a more suitable option for India.
While there are many possible demand- and supply-side responses to the impending water crisis, enhancing irrigation water productivity is key and should be prioritised for two reasons. First, a study by Amarasinghe et al. (2004) concludes that without improvements in irrigation water productivity, water availability for the non-agriculture sectors will deplete in most parts of India, barring the water-abundant eastern states. The study classified the Indian basins into five categories based on the degree of water scarcity and food sufficiency. It found that 16 out of 23 basins in India, home to 88 per cent of the country’s population, are under physical or economic water stress4. The study recommended some supply- and demand-side water management interventions for each category. The most feasible option for most Indian basins was increasing water productivity. The study highlighted that for three basins (Indus, West-flowing rivers 1, and Sabarmati) on which 13 per cent of India’s population depends, reallocating water from agriculture to other sectors is not just an option, but is imperative. For 13 other basins (including the Ganga, Godavari, Krishna, and Cauvery basins), on which
2. Background and motivation: the importance of enhancing irrigation water productivity
Without irrigation water productivity, water availability for non-agriculture sectors will deplete in most parts of India
4. Physical water scarcity occurs when there is not enough water to meet all demands. Economic water scarcity is caused by a lack of investment in water or a lack of human capacity to satisfy the demand for water, even in places where water is abundant.
Reallocating Water for India’s Growth: Sectoral Withdrawals, Water-efficient Agriculture, and Institutional Mechanisms6
75 per cent of India’s population depends, increasing water productivity is essential, given the costs of supply-side solutions and the underlying economic scarcity in these basins. Therefore, for these 16, improving water productivity is crucial either by reallocating water to other sectors (in physically water-scarce basins) or by reallocating water to grow more non-grain crops (in economically water-scarce basins) (Amarasinghe et al. 2004). The details of this analysis are given in Box 1. This inter-sectoral transfer of water must be accompanied by appropriate incentives for water users across sectors as well as institutional and regulatory restructuring.
Second, enhancing irrigation water productivity is a more cost-effective strategy (2030 Water Resources Group 2009; Richter 2014) than the provision of large surface water reservoirs and water distribution structures. It has been demonstrated that reducing demand is usually three to ten times less expensive than enhancing water supply (Richter 2014). A report by the 2030 Water Resources Group and McKinsey (2009) estimated that to implement optimal solutions to close 100 per cent of the demand–supply gap, India would require a capital investment of approximately USD 50 billion per annum to finance integrated supply and productivity solutions, which is only a quarter of the approximately USD 200 billion per year that would be required for solutions that solely expand water supply. The cost curve for India given in this report demonstrates that a cost-effective solution would focus primarily on improving the water productivity of agriculture. Some interventions like no-till farming, reduced over-irrigation, irrigated drainage, etc. present a net financial gain, making them lucrative options (2030 Water Resources Group 2009). Demand management is also likely to help tackle immediate and short-term issues such as drought adaptation (Katz 2016). A study by Briscoe and Malik (2007), which compared the costs and supply potential of existing and proposed schemes, found that the reallocation option was economically sound and sustainable even from the supply perspective. In Chennai, the costs of reallocating irrigation water from sources such as the Chembarambakkam lake and Araniar–Kosasthaliayar aquifers were only a minute fraction of the alternatives such as transfer of Cauvery water through the far-off Veeranam lake, seawater desalinisation, and treating wastewater. In the past, Chennai has relied on the reallocation option periodically to tide over serious water shortage (Briscoe 1997).
In the past, India has made significant investments to the tune of USD 500 billion to deliver water for irrigation through supply-side interventions like the construction of large-scale water reservoirs and networks of canals (World Bank 2011). However, these resources are not being utilised to their maximum capacity due to poor service delivery. Irrigation in India relies more on groundwater than surface water given the decentralised availability and low capital requirements of groundwater irrigation and the unreliability of surface water supply. To sustainably manage water resources, improved irrigation service delivery and maintenance of storage reservoirs is crucial. Eliminating the existing inefficiencies will require improvements in all fronts – better public funding, management of funds, and cost recovery through user charges.
Reducing water demand is usually three to ten times less expensive than enhancing water supply
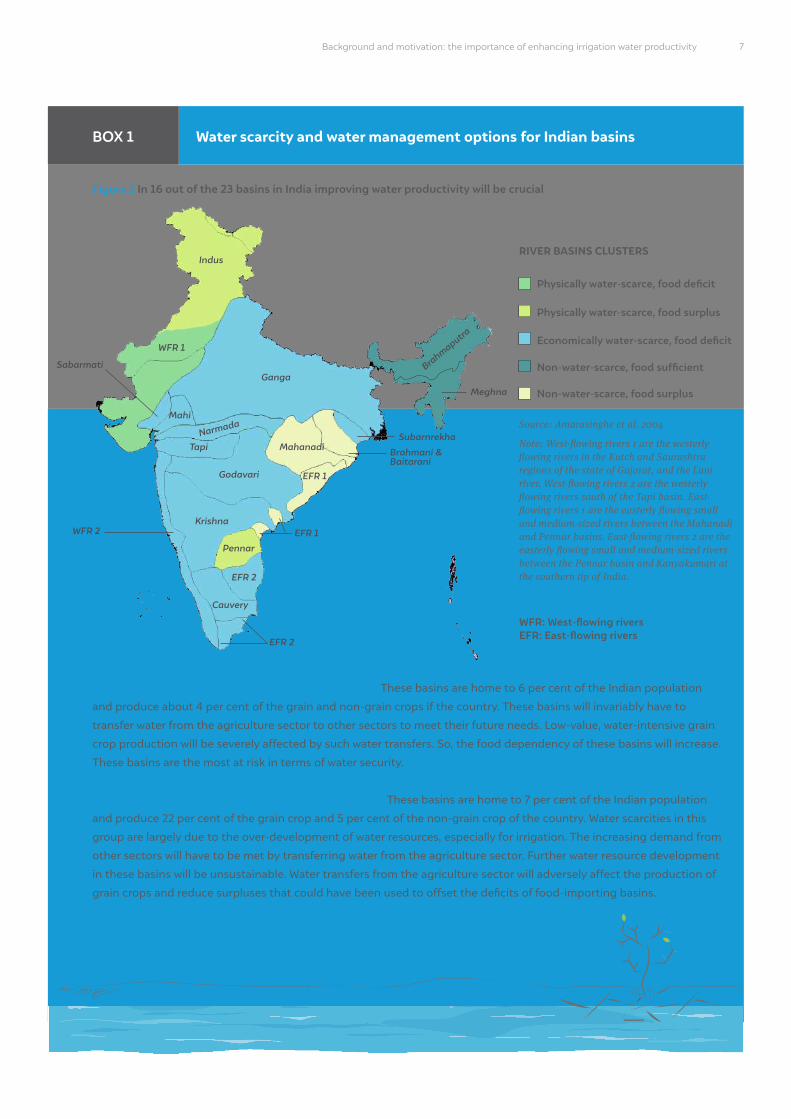
Cluster 1 basins (physically water-scarce, food deficit): These basins are home to 6 per cent of the Indian population
and produce about 4 per cent of the grain and non-grain crops if the country. These basins will invariably have to
transfer water from the agriculture sector to other sectors to meet their future needs. Low-value, water-intensive grain
crop production will be severely affected by such water transfers. So, the food dependency of these basins will increase.
These basins are the most at risk in terms of water security.
Cluster 2 basins (physically water-scarce, food surplus): These basins are home to 7 per cent of the Indian population
and produce 22 per cent of the grain crop and 5 per cent of the non-grain crop of the country. Water scarcities in this
group are largely due to the over-development of water resources, especially for irrigation. The increasing demand from
other sectors will have to be met by transferring water from the agriculture sector. Further water resource development
in these basins will be unsustainable. Water transfers from the agriculture sector will adversely affect the production of
grain crops and reduce surpluses that could have been used to offset the deficits of food-importing basins.
Figure 1 In 16 out of the 23 basins in India improving water productivity will be crucial
Source: Amarasinghe et al. 2004
Note: West-flowing rivers 1 are the westerly flowing rivers in the Kutch and Saurashtra regions of the state of Gujarat, and the Luni river. West-flowing rivers 2 are the westerly flowing rivers south of the Tapi basin. East-flowing rivers 1 are the easterly flowing small and medium-sized rivers between the Mahanadi and Pennar basins. East-flowing rivers 2 are the easterly flowing small and medium-sized rivers between the Pennar basin and Kanyakumari at the southern tip of India.
7 Background and motivation: the importance of enhancing irrigation water productivity
Physically water-scarce, food deficit
WFR: West-flowing riversEFR: East-flowing rivers
Physically water-scarce, food surplus
Economically water-scarce, food deficit
Non-water-scarce, food sufficient
Non-water-scarce, food surplus
RIVER BASINS CLUSTERSIndus
WFR 1
EFR 2
EFR 2
Cauvery
Mahanadi
EFR 1
EFR 1
GangaMeghna
Subarnrekha
Brahmani & Baitarani
Brahmaputra
Mahi
WFR 2Krishna
Pennar
Godavari
TapiNarmada
Sabarmati
Water scarcity and water management options for Indian basinsBOX 1
Reallocating Water for India’s Growth: Sectoral Withdrawals, Water-efficient Agriculture, and Institutional Mechanisms
Cluster 3 basins (economically water-scarce, food deficit): Eleven basins in this group are home to 75 per cent
of the Indian population but produce only 62 per cent of the grain crop and 72 per cent of the non-grain crop of
the country. Most basins in this group will either have to substantially increase their water-related investments or
increase food imports. Among the other options, increasing water productivity by reallocating water to non-grain
crops could help increase water productivity and eliminate food deficit.
Cluster 4 basins (non-water-scarce, food sufficient): These basins are home to only 5 per cent of the Indian
population and contribute only 4 and 6 per cent, respectively, of the grain and non-grain crop production. The low
degree of development of these basins indicates that a significant portion of the potentially utilisable water resources
(both surface water and groundwater) remains untapped and could perhaps be used to increase crop production.
Cluster 5 basins (non-water-scarce, food surplus): These basins host 7 per cent of the Indian population and
contribute 8 per cent and 13 per cent of the grain and non-grain crop production of the country, respectively. The
water resources of basins in this group could be further tapped to increase food production.
Overall, it was seen that except for basin clusters 4 and 5, all the other basins could benefit substantially from
increasing water productivity. These basins host 88 per cent of India’s population. Cluster 3 basins that have the
potential to implement supply-side interventions will have to do so at a cost, while the basins in clusters 1 and 2 have
no option but to improve water productivity (Amarasinghe et al. 2004).
Enhancing water productivity, therefore, is a critical starting point for devising strategies to reallocate water at the sectoral level in India. Despite significant headroom between storage and surface water potential, supply augmentation is too expensive and no longer an option in basins that are home to 88 per cent of India’s population. Since almost 80 per cent of India’s total water withdrawal comes from agriculture and allied sectors, optimising the water demand and supply in agriculture would have significant impacts on the overall health of water resources in India. Water productivity improvement and management have immense scope, and the subsequent reallocation to other sectors can have a meaningful impact on the way India uses its water. All in all, reallocation is a key strategy that India needs to focus on to address its impending water challenges.
8
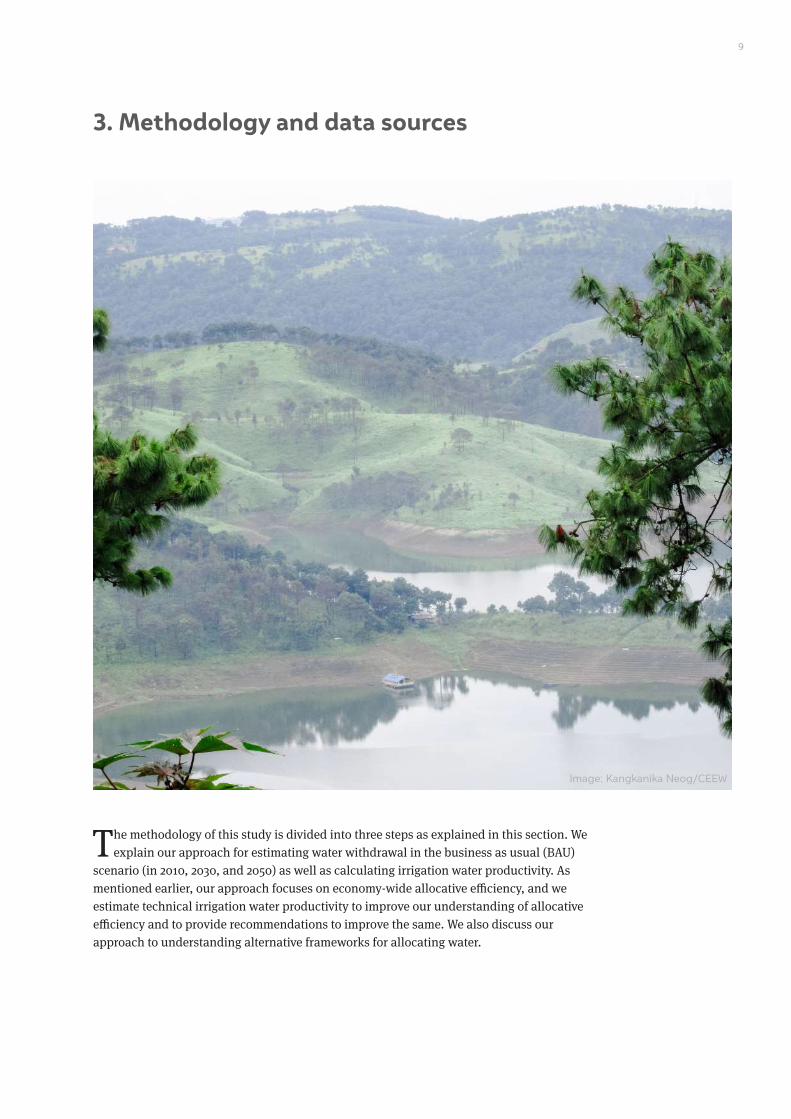
3. Methodology and data sources
The methodology of this study is divided into three steps as explained in this section. We explain our approach for estimating water withdrawal in the business as usual (BAU)
scenario (in 2010, 2030, and 2050) as well as calculating irrigation water productivity. As mentioned earlier, our approach focuses on economy-wide allocative efficiency, and we estimate technical irrigation water productivity to improve our understanding of allocative efficiency and to provide recommendations to improve the same. We also discuss our approach to understanding alternative frameworks for allocating water.
Image: Kangkanika Neog/CEEW
9
Reallocating Water for India’s Growth: Sectoral Withdrawals, Water-efficient Agriculture, and Institutional Mechanisms10
3.1 Estimating water withdrawn for irrigation, domestic, and industrial use for the BAU scenario3.1.1 Estimating net water withdrawn for irrigationTo analyse the potential for reallocating water from agriculture, it is necessary to understand the actual quantum of water being used for agriculture.
Several studies have assessed water withdrawals for agriculture (Ministry of Water Resources 1999; Amarasinghe et al. 2007). However, primary estimates of water withdrawal are unavailable for India as a whole; therefore, most of these studies depend on secondary methods and estimations. These studies mostly estimate crop water withdrawals using estimates of water consumption or potential evapotranspiration, divided by irrigation project efficiencies. The methodological differences lie in the assumptions used and the scale at which estimations are carried out.
The alternate methodology implemented in this study for estimating agriculture water withdrawal is bottom-up. It is based on the Government of India’s Cost of Cultivation dataset (Directorate of Economics and Statistics, 2008-14), which we use throughout the report for consistency. Our study uses data from 2008 to 2014 for 20 major cereal and non-cereal crops from Uttar Pradesh, Maharashtra, and Andhra Pradesh. Using this dataset, we derive crop-wise data on agricultural water withdrawals, as explained in detail below. Information on the amount of water used for growing each crop in our sample dataset is critical for estimating water productivity. The Cost of Cultivation dataset, however, does not give this information. It only provides information on the number of pumping hours for groundwater pumps as reported by sampled farmers. Based on this information, and a set of other assumptions, we estimate the water withdrawal per crop per hectare for each sample farmer for proceeding with the stochastic frontier analysis (SFA), as explained in Section 3.2.
Primary estimates of water withdrawal are unavailable for India for a whole

Irrigation
• We estimated groundwater irrigation using plot-level “pumping hours” from Government of India’s Cost of
Cultivation dataset.
• For surface water irrigation, we applied an average ratio of surface to groundwater as derived from “type of
irrigation source” data from the District Agriculture Contingency Plans.
• For rainfall, we used data from IMD. We also derived the return flow component. Net water withdrawan for
irrigation (surface water, ground water and rainfall) represents water applied to field minus return flows.
• For net water withdrawals in 2030 and 2050, we used agriculture area data from FAO GAPs study.
Domestic and industrial
• Domestic water withdrawal was derived using data on total population, per day water withdrawal and
physical losses in water distribution system. For projections, we used modelled estimates for population
growth in 2030 and 2050. We also applied projected numbers for per capita water withdrawal and losses.
• Industrial water withdrawal was estimated using information on industrial production and the specific
water withdrawals for major industries. For projections, we used modelled estimates for industrial growth in
2030 and 2050.
• We used the stochastic frontier analysis (SFA) to examine water use efficiency in irrigation. For the SFA, the
dependent variable was the water productivity of the selected crops and a set of variables that can help
identify the factors responsible for inefficiencies that have been considered as independent variables.
• We ran the SFA model and estimated average water use efficiency for a given crop in a given state. We then
derived crop-specific ranges for the extent to which water use efficiency can be improved for the given crop.
• A literature review of guidelines, mechanisms, regulations, and arrangements were undertaken to understand
effective water resource utilisation and allocation.
• Case studies, wherein strategies for effective water resource utilisation and allocation have been
demonstrated, or cases which analysed future improvements in water resources reallocation, were reviewed.
11Methodology and data sources
Estimating water withdrawn for irrigation, domestic, and industrial use for the BAU scenario
Estimating agriculture water productivity
Framework for reallocation in India
BOX 2 Methodology of the study
Reallocating Water for India’s Growth: Sectoral Withdrawals, Water-efficient Agriculture, and Institutional Mechanisms12
We use the average district-level information for our modelling analysis, derived from the detailed plot-level information. The details of these variables are mentioned in section 3.4. on data sources. For example, for sugarcane in Maharashtra, we derive the average values per hectare in a district for all the variables (crop productivity, labour use, fertiliser use, water use, etc.) that go in our SFA model. We do a district-level analysis as it facilitates some specific analyses like on drought-prone versus non-drought-prone districts, but more importantly, it addresses some data-specific challenges that impede an analysis at the plot level. For example, data on how much surface water is applied is not available at the plot level, whereas we can estimate this information using ratio of groundwater to surface water data available at the district level. In essence, our district-level data is for a representative average farmer at the district level rather than of a farmer at a plot or village level.
For this study, we define water use as essentially “net water withdrawal” for irrigation, which includes the water that is applied to the fields but excludes water that goes back into the hydrological system, like return flows due to percolation, surface drainage, and conveyance losses. Here, we assume that the water from return flows like percolation and conveyance loss goes back into the system and is not a loss but contributes to recharge by becoming a part of the utilisable water. These return flows are also an essential part of the hydrological cycle. For similar reasons, we use effective rainfall in our calculations. Net water withdrawal for irrigation in m3 = water applied in the field – return flows due to percolation (from all three sources) in m3 (1)
Amarasinghe et al. (2007) improve upon methodologies for assessments of water withdrawals by including average monthly rainfall, local level evapotranspiration, crop coefficients for different stages of crop growth, and various inefficiencies. This, therefore, takes into account water available from rainfall as well as man-made irrigation sources. Similarly, we also include rainfall in our estimate. We estimate “net water withdrawal”5 for agriculture from all sources – surface water, groundwater, and rainfall.
Water applied in m3 = groundwater irrigation + surface water irrigation + rainfall (in m3) (2)
To estimate groundwater irrigation, we use plot-level data on “pumping hours for irrigation for both own and hired machines” from the Cost of Cultivation dataset (details in next section, details of the dataset in Section 3.4) and multiply it with average water discharge of a pump in that district.
Groundwater irrigation m3 = weighted average of water discharge of the corresponding district of each type of well in m3 /hr* pumping hours (3)
We average the information to the district level to use in the SFA model, as explained in the next section.
As the dataset reports “pumping hours”, it was easier to calculate groundwater application. However, for surface water irrigation, we used an average ratio of surface to groundwater as derived from “type of irrigation source” data from the District Agriculture Contingency Plans
Return flows like percolation and conveyance loss goes back into the system and is not a loss
5. See Box 3 and water accounting framework used in Amarasinghe et al. (2007) for further clarifications.
(detailed methodology in Annexure 4). This information is presented at the district level, which is apt for our analysis (Department of Agriculture, Cooperation and Farmers’ Welfare 2019).
For rainfall input for irrigation, we use effective rainfall as this is the rainfall ultimately used for crop irrigation requirements. Rainfall may be separated into several components: runoff, infiltration, interception (rainfall that is caught on the plant surfaces), and evapotranspiration (ET). The effective rainfall for field crops is the portion of rainfall that is directly and/or indirectly useful for crop production at the site where it falls (Dastane 1974). It is essentially that part of the rainfall that is effectively used by the crop after rainfall losses due to surface runoff and deep percolation have been accounted for. Using district-wise monthly rainfall data from 2008 to 2014 in each district (India Meteorological Department, 2020), the effective rainfall (using USDA Soil Conservation Service [USDA SCS] method) during respective cropping seasons was estimated. This method is widely used in large-scale agriculture-related studies, where field estimations are not possible due to data constraints (Sharma et al. 2018; Chapagain and Hoekstra 2011). For each crop, only the relevant cropping season is taken to estimate the total rainfall for that crop.
Return flows from the field after irrigation were captured to understand the volume of water that does not percolate into the ground or surface water body either through surface or sub-surface drainage. Estimates for return flows as recommended by the Government of India’s Groundwater Estimation Committee (GEC) reports have been used in this study (Central Ground Water Board 2015). However, it is unclear to us whether this includes elements of return flows that return to surface water through surface drainage. Based on our assessment of literature on return flows, the percentages suggested by GEC are similar to the results from field studies where surface water returns are explicitly included. As per our understanding, our estimates include both surface and sub-surface return flows. We have ensured that there is no double-counting of return flows or any other component in our estimates. These numbers, along with district-wise data on the percentage of wells in each range of depth (Central Ground Water Board 2019) and their corresponding rate of percolation, were used to determine return flows. This data was then merged with the Cost of Cultivation data to derive the return flow component of the irrigation water from groundwater and surface water. More details on surface and groundwater application, return flows and rainfall input are discussed in Annexures 4, 5 and 6.
This exercise was undertaken for three states and eight crop categories, as explained in Annexures 2 and 3. We also ran the models separately for drought and non-drought districts. The details of district bifurcation are given in Annexure 7. After estimating the net water withdrawal per hectare for each crop in each state, we calibrated the results for total groundwater use for irrigation for each state with data reported by Central Ground Water Board (CGWB) on the same. We also compared our agriculture withdrawal estimates with existing estimates. Since our analysis is at the national level, we also used the average water use per hectare for each crop multiplied by gross cropped area (in hectares) to estimate the net water withdrawal for agriculture in India. For projections upto 2050, we used data on the growth in agricultural area under different crops from the Food and Agriculture Organisation Global Agriculture Perspectives Systems (FAO GAPS)6 study (Food and Agriculture Organisation of the United Nations 2016) .
This exercise was undertaken for three states and eight crop categories
6. The FAO Global Perspectives study, to bridge the knowledge gap regarding the future of food and agriculture, generates quantitative evidence to show that we can achieve more with less and produce safe and nutritious food for all, while containing the expansion of agricultural sectors and limiting the use of natural resources.
13Methodology and data sources
Reallocating Water for India’s Growth: Sectoral Withdrawals, Water-efficient Agriculture, and Institutional Mechanisms14
3.1.2 Estimation of domestic and industrial water withdrawalTo understand water withdrawal for domestic and industrial sectors, the sector-specific per unit water withdrawal and size of the sector is required. The methodology used in this study is explained below.
Based on population data from Census 2011 and per capita water requirements standards (135 lpcd for urban and 55 lpcd for rural) (Central Public Health and Environmental Engineering Organisation 1999), and accounting for supply-side inefficiencies, the water withdrawal from the domestic sector is estimated. For projections, we assumed that per capita water requirements will gradually increase from the current 135 norm lpcd to 200 lpcd in 2050 in urban areas and from 55 lpcd to 150 lpcd in rural areas adopted from the National Commission on Integrated Water Resources Development (NCIWRD) projections (Ministry of Water Resources 1999). However, in this report, we have taken a conservative estimate for water demand per capita for urban domestic use, as NCIWRD assumptions were too high and assumed greater parity between urban and rural. For our report, we limit the urban per capita water demand to 200 lpcd while the NCIWRD projections suggested 220 lpcd. We also assumed that India will see some changes in its rural to urban demography in the coming decades.
Supply-side inefficiencies for domestic water are currently very high with non-revenue water.7 According to recent a service-level benchmarking (SLB) exercise by the Ministry of Urban Development (MoUD) in around 1,400 urban areas in India in 2010, non-revenue water is 33 per cent (Ministry of Urban Development 2012). Out of this, physical loss, which is assumed to be 70 per cent of the total non-revenue water, is used as an inefficiency measure for domestic water withdrawal (Wyatt 2010). In the absence of dependable assumptions for rural domestic, we use the same values as urban. For projections of non-revenue water, we assumed 20 per cent for 2050, which is also the service-level benchmark (Ministry of Urban Development 2009). For details of assumptions, see Annexure 8. We also assume that service sector water demand is covered under the municipal water demand, which largely consists of the demand for daily intake of water and food, sanitation, and other needs like cleaning, watering plants, etc.
Domestic water withdrawal (both urban and rural) in a year in m3 =(total population * total per capital per day water withdrawal * 365 days)+physical losses (4)
Industrial water withdrawal was estimated using information on industrial production and the specific water withdrawals from literature. For simplicity, we categorise the types of industries into three clusters – thermal power plants8 (cluster 1); iron and steel, paper and pulp, and cement (cluster 2); and other manufacturing (cluster 3). The case of the thermal power plants is analysed separately as until a few years back this industry was known to be a water guzzler as it used once-through cooling technology. Recently, the Government of India (GoI) has notified all thermal power plants to shift to less water-intensive cooling towers (Ministry of Environment, Forest and Climate Change 2015). We assume that by 2030, this policy will be successfully implemented, thereby minimising the water use in this industry.
Supply-side inefficiencies for domestic water are currently very high with non-revenue water
7. Non-revenue water is the water that is pumped and then lost or unaccounted for.
8. Our water withdrawal accounting is based on the production sectors. An alternative to this is to account for water in the consumption sectors. For example, we account for water used in the power production sector. In consumption based accounting, water used in power production would be allocated to the sectors in which power is used, i.e. agriculture, industry, and residential/commercial sectors.
Water accounting terms used in the study
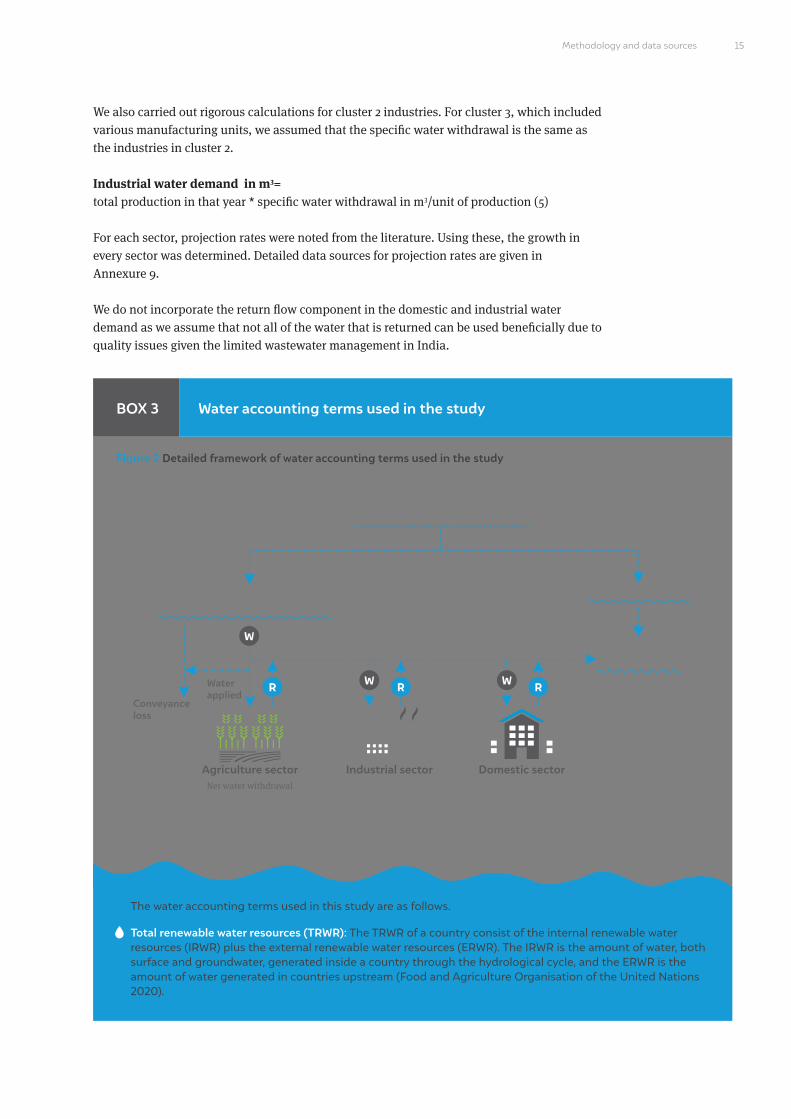
Figure 2 Detailed framework of water accounting terms used in the study
15Methodology and data sources
We also carried out rigorous calculations for cluster 2 industries. For cluster 3, which included various manufacturing units, we assumed that the specific water withdrawal is the same as the industries in cluster 2.
Industrial water demand in m3= total production in that year * specific water withdrawal in m3/unit of production (5)
For each sector, projection rates were noted from the literature. Using these, the growth in every sector was determined. Detailed data sources for projection rates are given in Annexure 9.
We do not incorporate the return flow component in the domestic and industrial water demand as we assume that not all of the water that is returned can be used beneficially due to quality issues given the limited wastewater management in India.
The water accounting terms used in this study are as follows.
Total renewable water resources (TRWR): The TRWR of a country consist of the internal renewable water resources (IRWR) plus the external renewable water resources (ERWR). The IRWR is the amount of water, both surface and groundwater, generated inside a country through the hydrological cycle, and the ERWR is the amount of water generated in countries upstream (Food and Agriculture Organisation of the United Nations 2020).
Source: Authors’ analysis
Note: W – water withdrawal, R – return flows, Water applied = water withdrawals – conveyance loss, Net water withdrawals = water withdrawal – (conveyance loss + return flow)
Total Renewable Water Resources (TRWR) (Surface Water and Groundwater)
Potentially Utilisable Surface Water and Groundwater Resources (PUWR)
Unutilisable TRWR
Flows to environment
Agriculture sector Industrial sector Domestic sectorNet water withdrawal
Conveyance loss
Water applied
W
W WR R R
BOX 3
Reallocating Water for India’s Growth: Sectoral Withdrawals, Water-efficient Agriculture, and Institutional Mechanisms
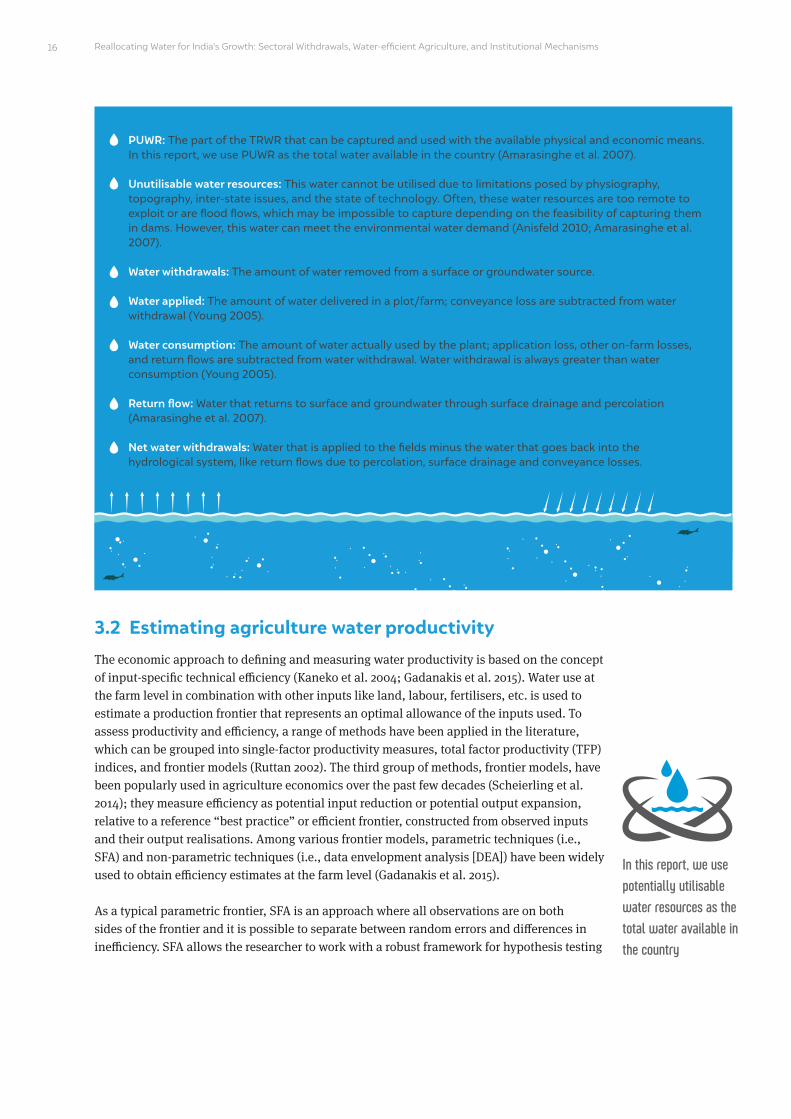
PUWR: The part of the TRWR that can be captured and used with the available physical and economic means. In this report, we use PUWR as the total water available in the country (Amarasinghe et al. 2007).
Unutilisable water resources: This water cannot be utilised due to limitations posed by physiography, topography, inter-state issues, and the state of technology. Often, these water resources are too remote to exploit or are flood flows, which may be impossible to capture depending on the feasibility of capturing them in dams. However, this water can meet the environmental water demand (Anisfeld 2010; Amarasinghe et al. 2007).
Water withdrawals: The amount of water removed from a surface or groundwater source.
Water applied: The amount of water delivered in a plot/farm; conveyance loss are subtracted from water withdrawal (Young 2005).
Water consumption: The amount of water actually used by the plant; application loss, other on-farm losses, and return flows are subtracted from water withdrawal. Water withdrawal is always greater than water consumption (Young 2005).
Return flow: Water that returns to surface and groundwater through surface drainage and percolation (Amarasinghe et al. 2007).
Net water withdrawals: Water that is applied to the fields minus the water that goes back into the hydrological system, like return flows due to percolation, surface drainage and conveyance losses.
16
3.2 Estimating agriculture water productivityThe economic approach to defining and measuring water productivity is based on the concept of input-specific technical efficiency (Kaneko et al. 2004; Gadanakis et al. 2015). Water use at the farm level in combination with other inputs like land, labour, fertilisers, etc. is used to estimate a production frontier that represents an optimal allowance of the inputs used. To assess productivity and efficiency, a range of methods have been applied in the literature, which can be grouped into single-factor productivity measures, total factor productivity (TFP) indices, and frontier models (Ruttan 2002). The third group of methods, frontier models, have been popularly used in agriculture economics over the past few decades (Scheierling et al. 2014); they measure efficiency as potential input reduction or potential output expansion, relative to a reference “best practice” or efficient frontier, constructed from observed inputs and their output realisations. Among various frontier models, parametric techniques (i.e., SFA) and non-parametric techniques (i.e., data envelopment analysis [DEA]) have been widely used to obtain efficiency estimates at the farm level (Gadanakis et al. 2015).
As a typical parametric frontier, SFA is an approach where all observations are on both sides of the frontier and it is possible to separate between random errors and differences in inefficiency. SFA allows the researcher to work with a robust framework for hypothesis testing
In this report, we use potentially utilisable water resources as the total water available in the country
17Methodology and data sources
SFA more suitable than the deterministic models due to its ability to allow the separation of random “noise” from deviations arising from technical inefficiency
and the construction of confidence intervals (Walud and White 2000). The SFA approach was developed by Aigner and colleagues and has been widely used in the fields of energy and environmental efficiency evaluation (Aigner, Lovell and Schmidt 1977; Zheng, Zhang and Xing 2018). It is used for the specification and estimation of a parametric production function, which is representative of the best available technology (Chavas, Chambers and Pope 2010).
However, the SFA technique requires prior assumptions about the functional form of the frontier technology and the distribution of the technical inefficiency term, making the results sensitive to the parametric form chosen. Due to the flexibility of DEA in this regard, it is the preferred method over SFA for analysing technical and specific input (water use) efficiency. Despite its strengths, DEA does not take statistical noise into consideration, which may make the results very sensitive to data quality and even result in biased efficiency estimates. Besides, DEA cannot analyse the influencing factors of technical efficiency directly, so researchers have to adopt two-step methods to study water efficiency and its determinants. Other disadvantages of DEA are that it is deterministic and sensitive to measurement errors (Gadanakis et al. 2015).
It is interesting to note that several studies have compared both methodologies and have shown that results from both methods are highly correlated (Speelman et al. 2007; Alene and Zeller 2005; Walud and White 2000). Irrigation studies like Ekanayake and Jayasuriya (1987) use both methods to distinguish between rice farms, depending on their location at the “head” or “tail” of a major irrigation canal in the Mahaweli Development Project in Sri Lanka. They found SFA more suitable than the deterministic models due to its ability to allow the separation of random “noise” from deviations arising from technical inefficiency (Ekanayake and Jayasuriya 1987).
3.2.1 Stochastic frontier analysis (SFA)In this study, we used the SFA model to examine water-use efficiency in irrigation (including surface water, groundwater, and rainfall) given its suitability in irrigation studies. Our analysis estimate water-use efficiency at the national level. However, it is methodologically incorrect to pool in data for all regions together for a given crop under analysis as then it would mean that one is comparing the water-use efficiency of farmers across agro-ecological zones, which is not a logical approach. Thus, though we have data for all Indian states, running the model for each state separately and analysing the data for each Indian state is resource-intensive. Hence, we chose three representative states to cover different agro-ecological zones as well as to ensure that we have a good representation of crops. The detailed approach taken in choosing the states and the eight crop categories that we have studied is explained in Annexures 2 and 3.
Once we chose the states and the crops, we ran the SFA model and estimated average water-use efficiency for a given crop in a given state. We then derived crop-specific ranges for the extent to which water-use efficiency can be improved for the given crop. Since the calculations were carried out for farmers within the same state, inter-state comparisons are not feasible in this study. We use this range to estimate a low water-saving and a high water-saving scenario for the agricultural sector at the national level, which gives us information on how much water could be reallocated.
Reallocating Water for India’s Growth: Sectoral Withdrawals, Water-efficient Agriculture, and Institutional Mechanisms18
For the SFA, the dependent variable was the water productivity of the selected crops and a set of variables that can help identify the factors responsible for inefficiencies that have been considered as independent variables (Elnour and Abbas 2014; Hidayah et al. 2013; Scheierling et al. 2014).
Water productivity in kg/m3 (WPit) = f (labour hours, animal labour hours, machine hours, seed in kg, fertiliser in kg, temperature in 0C) (6)Where, exp (-uit) and 0 ≤ uit< ∞; i= 1,2,….,n and t= 1,2,…T.
We define the frontier production function for water productivity as the minimum feasible water used by the average representative farmer in a district for the study period and with the given level of inputs and technology. If the average representative farmer of a district is inefficient in water use as compared to that of another district, the actual water productivity (WPit) is less than the potential water productivity f(.). Therefore, we can treat the ratio of actual water productivity and potential water productivity f(.) as a measure of the district-level water-use efficiency (WUE) (Elnour and Abbas 2014; Scheierling et al. 2014).
The quantum of water being wasted can be estimated by using the following function:
Quantum of water being wasted (WS) = (1-existing WUE) *Water use (7)
We also derive the percentage decrease in water saving that is potentially possible on an average per hectare for given inputs. This is used further to estimate the total water savings.
3.3 Framework for reallocation in IndiaA literature review of guidelines, mechanisms, regulations, and arrangements was undertaken to understand effective water resource utilisation and allocation. Case studies, wherein strategies for effective water resource utilisation and allocation have been demonstrated, or cases which were evaluated to analyse future improvements in water resources reallocation, were reviewed. Through this exercise, we developed a framework for water reallocation in India.
3.4 Data sourcesFor analysing water productivity in agriculture, the study uses data from the Cost of Cultivation dataset collected by the central and state governments and collated by Directorate of Economics and Statistics, Department of Agriculture, Cooperation and Farmers Welfare, Ministry of Agriculture and Farmers Welfare, Government of India (Directorate of Economics and Statistics, 2007; Central Statistical Organisation, 2008). This study uses data for 2008–2014 for Uttar Pradesh, Maharashtra, and Andhra Pradesh for 20 major cereal and non-cereal crops. Details regarding the selection of states and the categorisation of crops are explained in Annexures 2 and 3.
The Cost of Cultivation dataset (Directorate of Economics and Statistics, 2008-14) records data at the plot level, mapped against a zone code, tehsil code, and district name. The data
For the SFA, the dependent variable was the water productivity of the selected crops
19Methodology and data sources
was later aggregated at the district level. The relevant data points are irrigation pumping hours, gross agricultural production, the value of agricultural production in INR, labour hours, animal labour hours, machine hours, seed in kg, fertiliser in kg, irrigation machine hours, labour cost in INR, animal labour cost in INR, machine cost in INR, seed cost in INR, fertiliser cost in INR, irrigation machine cost in INR, insecticides cost in INR. The data also reports pumping hours for irrigation, which we use to derive irrigation water applied in field. Details of this assessment are given in Annexure 4.
The precipitation data and temperature data are from the India Meteorological Department (IMD) (India Meteorological Department 2020b).
We used the year 2010 as our baseline and calculated the net water withdrawn for the three sectors. Using data on average water withdrawal per crop from the three states, we calculate the net water withdrawn for agriculture in India. The results and analysis from these states were later applied to estimate national-level numbers.
3.5 Limitations of the studyOur study is based on a detailed bottom-up estimation of potential savings in water withdrawal based on actual farmer-level data in conjunction with appropriate assumptions as required. This is an economic approach as opposed to an agronomic approach, which is usually employed for estimating water withdrawal. The national estimates for agricultural water withdrawal are based on state-related averages. While data was available for all states, estimating potential savings separately for all states is resource-intensive.
At this point, the reader should be aware of the uncertainties in the data and processes used in this report. Broadly speaking, the uncertainties for our analysis relate to three different aspects: data, statistical estimation, and policy impacts. As data were used from three representative states, we calibrate our results with existing estimates at the state level as well as the national level to ensure that our state and national level estimates are comparable to existing estimates. This study analyses farmer-level water use and crop production data (aggregated at the district level) from the three states to give a sense of the variations in average representative farmer behaviour for India and the potential ranges for water savings. Regarding the SFA technique, it is important to note that the process requires prior assumptions about the functional form of the frontier technology and the distribution of the technical inefficiency term, making the results sensitive to the parametric form chosen. Our study uses a functional form that has been used in prior studies on irrigation water use using SFA technique.
Moreover, our estimates only indicate the savings on net water withdrawal, which excludes return flows as our report focuses on exploring the potential for water savings. Therefore, the numbers should be seen as indicative of how much water can be potentially saved overall. In practice, one could save water by either reducing the water applied to the field or by reducing return flows. Thus, interventions for water savings that aim to reduce only return flows are not captured in our analysis.
For analysing water productivity in agriculture, the study uses data from the Cost of Cultivation dataset
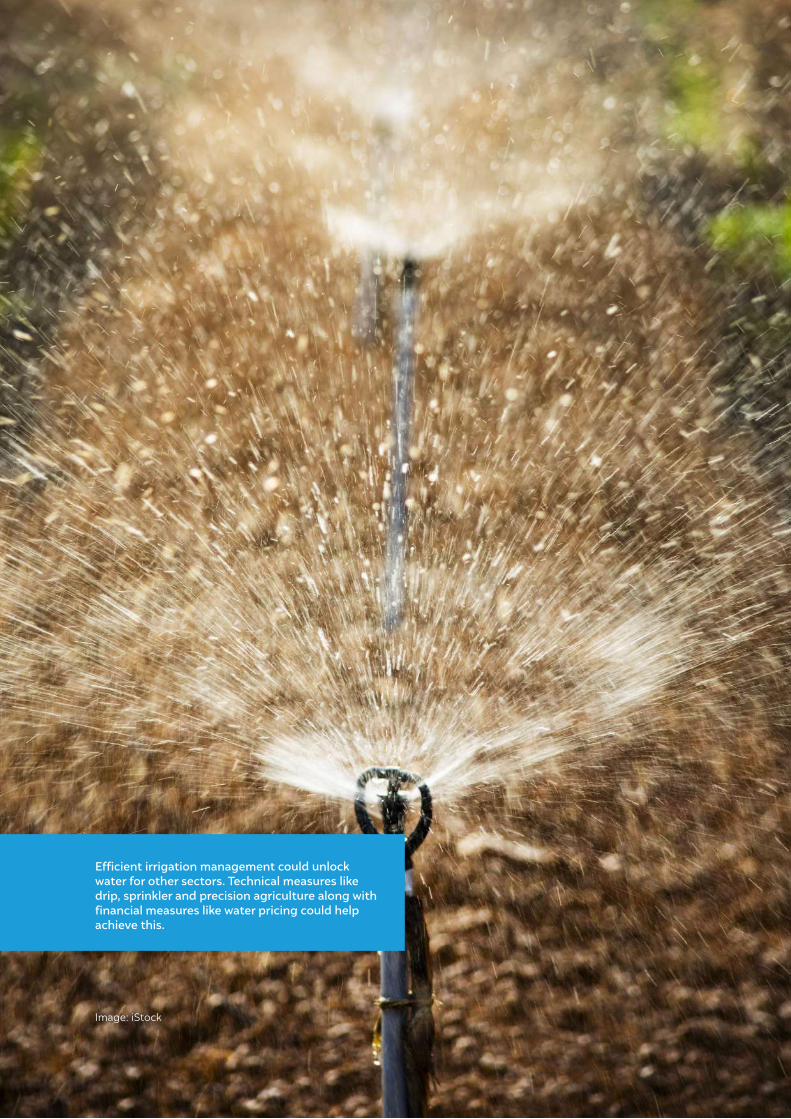
Reallocating Water for India’s Growth: Sectoral Withdrawals, Water-efficient Agriculture, and Institutional Mechanisms4
Image: iStock
Efficient irrigation management could unlock water for other sectors. Technical measures like drip, sprinkler and precision agriculture along with financial measures like water pricing could help achieve this.
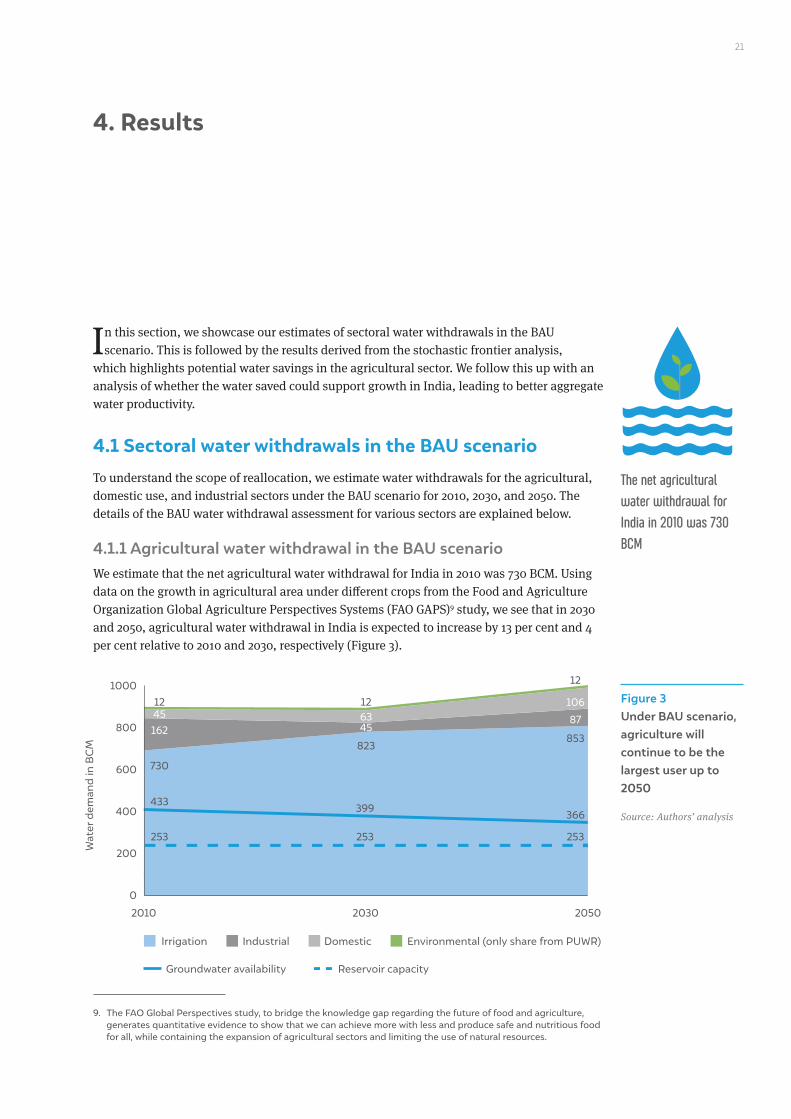
21
In this section, we showcase our estimates of sectoral water withdrawals in the BAU scenario. This is followed by the results derived from the stochastic frontier analysis,
which highlights potential water savings in the agricultural sector. We follow this up with an analysis of whether the water saved could support growth in India, leading to better aggregate water productivity.
4.1 Sectoral water withdrawals in the BAU scenarioTo understand the scope of reallocation, we estimate water withdrawals for the agricultural, domestic use, and industrial sectors under the BAU scenario for 2010, 2030, and 2050. The details of the BAU water withdrawal assessment for various sectors are explained below.
4.1.1 Agricultural water withdrawal in the BAU scenarioWe estimate that the net agricultural water withdrawal for India in 2010 was 730 BCM. Using data on the growth in agricultural area under different crops from the Food and Agriculture Organization Global Agriculture Perspectives Systems (FAO GAPS)9 study, we see that in 2030 and 2050, agricultural water withdrawal in India is expected to increase by 13 per cent and 4 per cent relative to 2010 and 2030, respectively (Figure 3).
4. Results
The net agricultural water withdrawal for India in 2010 was 730 BCM
9. The FAO Global Perspectives study, to bridge the knowledge gap regarding the future of food and agriculture, generates quantitative evidence to show that we can achieve more with less and produce safe and nutritious food for all, while containing the expansion of agricultural sectors and limiting the use of natural resources.
Figure 3 Under BAU scenario, agriculture will continue to be the largest user up to 2050
Source: Authors’ analysis
Irrigation Industrial Domestic Environmental (only share from PUWR)
0
200
2010
730
433399
366
253 253 253
823853
12 12
12
162 45
10645 63 87
2030 2050
400
600
800
1000
Wat
er d
eman
d in
BC
M
Groundwater availability Reservoir capacity
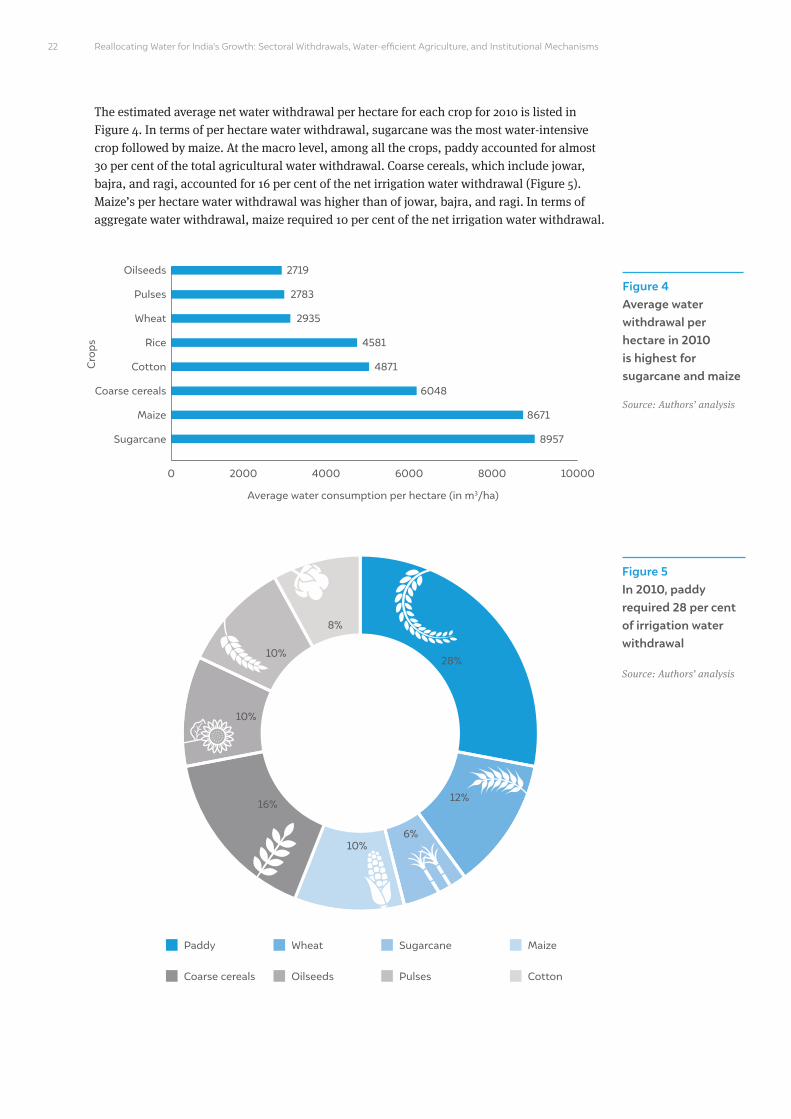
Reallocating Water for India’s Growth: Sectoral Withdrawals, Water-efficient Agriculture, and Institutional Mechanisms
The estimated average net water withdrawal per hectare for each crop for 2010 is listed in Figure 4. In terms of per hectare water withdrawal, sugarcane was the most water-intensive crop followed by maize. At the macro level, among all the crops, paddy accounted for almost 30 per cent of the total agricultural water withdrawal. Coarse cereals, which include jowar, bajra, and ragi, accounted for 16 per cent of the net irrigation water withdrawal (Figure 5). Maize’s per hectare water withdrawal was higher than of jowar, bajra, and ragi. In terms of aggregate water withdrawal, maize required 10 per cent of the net irrigation water withdrawal.
Figure 4 Average water withdrawal per hectare in 2010 is highest for sugarcane and maize
Source: Authors’ analysis
Figure 5 In 2010, paddy required 28 per cent of irrigation water withdrawal
Source: Authors’ analysis
Oilseeds
Pulses
Wheat
Rice
Cotton
Coarse cereals
Maize
Sugarcane
Average water consumption per hectare (in m3/ha)
Cro
ps
0 100008000
8957
8671
6048
4871
4581
2935
2783
2719
600040002000
Paddy Wheat Sugarcane Maize
Coarse cereals Oilseeds Pulses Cotton
28%
12%
6%10%
10%
10%
8%
16%
22
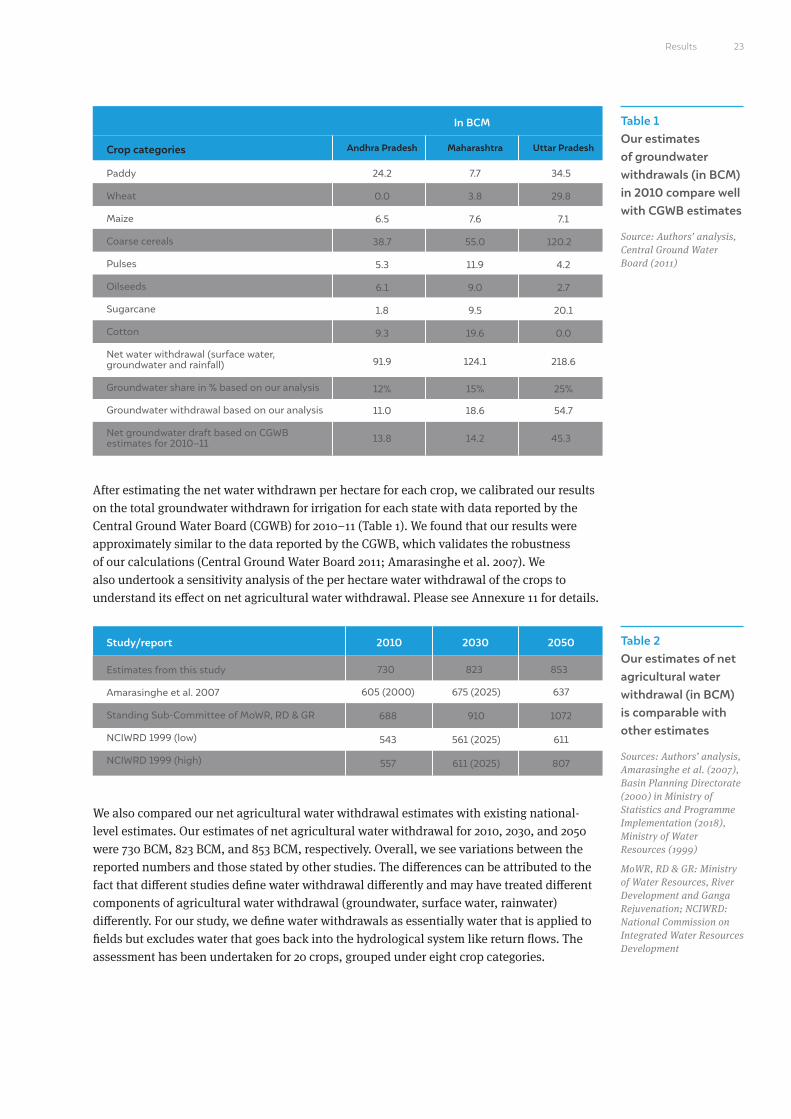
Table 1 Our estimates of groundwater withdrawals (in BCM) in 2010 compare well with CGWB estimates
Source: Authors’ analysis, Central Ground Water Board (2011)
Table 2 Our estimates of net agricultural water withdrawal (in BCM) is comparable with other estimates
Sources: Authors’ analysis, Amarasinghe et al. (2007), Basin Planning Directorate (2000) in Ministry of Statistics and Programme Implementation (2018), Ministry of Water Resources (1999)
MoWR, RD & GR: Ministry of Water Resources, River Development and Ganga Rejuvenation; NCIWRD: National Commission on Integrated Water Resources Development
Maharashtra Uttar PradeshCrop categories
In BCM
2010 2030 2050Study/report
Paddy
Wheat
Maize
Coarse cereals
Pulses
Oilseeds
Sugarcane
Cotton
Net water withdrawal (surface water, groundwater and rainfall)
Groundwater share in % based on our analysis
Groundwater withdrawal based on our analysis
Net groundwater draft based on CGWB estimates for 2010–11
Estimates from this study
Amarasinghe et al. 2007
Standing Sub-Committee of MoWR, RD & GR
NCIWRD 1999 (low)
NCIWRD 1999 (high)
24.2
730 823 853
605 (2000) 675 (2025) 637
688 910 1072
543 561 (2025) 611
557 611 (2025) 807
0.0
6.5
38.7
5.3
6.1
1.8
9.3
91.9
12%
11.0
13.8
7.7
3.8 29.8
7.6 7.1
55.0 120.2
11.9 4.2
9.0 2.7
9.5 20.1
19.6 0.0
124.1 218.6
15% 25%
18.6 54.7
14.2 45.3
34.5
Andhra Pradesh
After estimating the net water withdrawn per hectare for each crop, we calibrated our results on the total groundwater withdrawn for irrigation for each state with data reported by the Central Ground Water Board (CGWB) for 2010–11 (Table 1). We found that our results were approximately similar to the data reported by the CGWB, which validates the robustness of our calculations (Central Ground Water Board 2011; Amarasinghe et al. 2007). We also undertook a sensitivity analysis of the per hectare water withdrawal of the crops to understand its effect on net agricultural water withdrawal. Please see Annexure 11 for details.
We also compared our net agricultural water withdrawal estimates with existing national-level estimates. Our estimates of net agricultural water withdrawal for 2010, 2030, and 2050 were 730 BCM, 823 BCM, and 853 BCM, respectively. Overall, we see variations between the reported numbers and those stated by other studies. The differences can be attributed to the fact that different studies define water withdrawal differently and may have treated different components of agricultural water withdrawal (groundwater, surface water, rainwater) differently. For our study, we define water withdrawals as essentially water that is applied to fields but excludes water that goes back into the hydrological system like return flows. The assessment has been undertaken for 20 crops, grouped under eight crop categories.
23Results
Reallocating Water for India’s Growth: Sectoral Withdrawals, Water-efficient Agriculture, and Institutional Mechanisms
Amarasinghe et al. (2007) estimate irrigation water demand at 605 BCM, 675 BCM, and 637 BCM for 2000, 2025, and 2050 (Amarasinghe et al. 2007). In their irrigation water demand model for 11 crops, they detail which months of the year each crop is grown and the length of the growth period. They further estimate the water requirement for the growth period of each crop using effective rainfall, potential evapotranspiration (ETp), and crop coefficients. The seasonal irrigation water demand is estimated based on crop water requirements, the extent of the groundwater-irrigated area in the basins, and the project irrigation efficiencies of surface water and groundwater irrigation. While the water demand component is similar to our withdrawal estimates, unlike our study, Amarasinghe et al. (2007) envisages an improvement in irrigation efficiencies, along with significant water transfers to other sectors in their BAU scenario as we approach 2050.
Two other studies – the Standing Sub-Committee of MoWR, RD & GR (2000) and the National Commission for Integrated Water Resources Development (NCIWRD) (1999) – also provide projections for irrigation water withdrawals in India. According to their estimates, India’s agricultural water withdrawals were 688 BCM in 2010, which will increase to 910 BCM and 1,072 BCM in 2030 and 2050, respectively (Ministry of Statistics and Programme Implementation 2018; Basin Planning Directorate 2000). The NCIWRD report (1999) had assessed the water requirement for irrigation under two scenarios, as mentioned in Table 2 (Ministry of Water Resources 1999).
Overall, to our knowledge, our report presents more recent estimates for water withdrawals in India which are based on historical farmer-level data, as opposed to projections in all the other three studies. Moreover, the other studies use an agronomic approach, i.e., they estimate the consumption of water and multiply that with an efficiency loss factor to estimate withdrawals. Ours is an alternative approach based on a bottom-up estimation of water use.
To conclude, our estimates compare well with the state-level groundwater withdrawal estimates by CGWB as well with existing national-level estimates that verify their dependability.
4.1.2 Domestic water withdrawal under the BAU scenarioWe estimate domestic water withdrawal at 45 BCM, which is projected to increase by 40 per cent from 2010 to 2030 and by 68 per cent from 2030 to 2050. At this point, we also note that domestic water withdrawal is not equal to the municipal water supply. According to the Census 2011, only 70.6 per cent of urban households and 30.8 per cent of rural households receive piped water supply in their premises. That said, while the municipal water supply does not cater to all households, we assume that the remaining households meet their water demand either from public sources or by drawing groundwater.
We also undertook a sensitivity analysis, based on the assumptions from NCIWRD, on the urban domestic per capita water demand to see its effect on domestic water withdrawal. We deduce that this assumption has a marginal effect on domestic water withdrawal. Details are presented in Annexure 11.
Only 70.6% of urban households and 30.8% of rural households receive piped water supply in their premises
24
4.1.3 Industrial water withdrawal under the BAU scenarioAs per our estimates, industrial water withdrawal (including thermal power plants) will reduce from 162 BCM in 2010 to 45 BCM in 2030 and increase to 87 BCM in 2050 (see Annexure 9). We estimate a 70 per cent reduction in water use between 2010 and 2030 due to the Government of India (GoI) notification that requires “all thermal power plants with once-through cooling shall install cooling towers and additionally achieve specific water consumption up to maximum of 3.5m3 /MWh”. Between 2030 and 2050, we expect a significant increase in industrial water withdrawals driven by an increase in manufacturing.We also undertook a sensitivity analysis to understand the effect of our water withdrawal assumptions related to cluster 3 industries on industrial water withdrawal. We deduced that this assumption has no significant effect on industrial water withdrawal. Details are presented in Annexure 11.
4.1.4 Environmental water demand under the BAU scenarioOne of the major criteria in determining environmental water demand is estimating environmental flows (e-flows), or the water required to maintain both spatial and temporal patterns of river flow. Flow variability can affect the structural and functional diversity of rivers and their floodplains, which, in turn, influence the species diversity of the river. (Smakhtin and Anputhas 2006). Ideally, environmental flow assessments should be conducted on a monthly basis, with importance given to maintaining minimum flows during lean months. Hydrological methods used to determine environmental flows represent this demand as a percentage of the mean annual flow (MAF) or estimate it using flow duration curves (FDC) (Jain 2012). Environmental flow requirements in volumes for a particular basin could be represented by the mean annual sum of estimated e-flows that could be allocated for environmental purposes.
One of the first scientific assessments to determine e-flows volume was by Amarasinghe et al. (2004). This estimate was based on the global study conducted by Smakhtin et al. (2004) and was calculated separately for major river basins/drainage regions in India (Smakhtin, Revenga and Döll 2004). The estimate turned out to be about 476 BCM, which constitutes approximately 25 per cent of the total renewable water resources in the country (Amarasinghe et al. 2004). For macro-level demand estimations and projections and for the purpose of allocation, calculating the annual environmental water demand10 as a volume is sufficient.
Amarasinghe et al. (2004) suggest that e-flows can be met by unutilisable water flows instead of depending on PUWR for environmental needs. If the unutilisable river runoff is not adequate, then part of the PUWR has to be kept in rivers to meet the e-flow requirement. According to assessments by Amarasinghe et al. (2004), in most Indian drainage basins, the unutilisable portion of surface runoff is more than sufficient to meet the estimated e-flows volume. The e-flows volume of only a few basins – such as the Pennar basin, the basin of westerly flowing rivers in Kutch and Saurashtra and the Luni river, the Cauvery basin, and the basin of easterly flowing rivers between Pennar and Kanyakumari, Tapi river – exceed the unutilisable runoff (see Table 3) (Amarasinghe et al. 2004).
10. Environmental water flow demand is different from water withdrawals across sectors. However, it is an important component of the overall water requirement in the economy. We hence treat the environmental flow requirement as the withdrawal required for maintaining environmental and ecosystem services and add this to sectoral water withdrawals for a complete assessment of India’s water withdrawals.
In most Indian drainage basins, the unutilisable portion of surface runoff is more than sufficient to meet the estimated e-flows volume
25Results
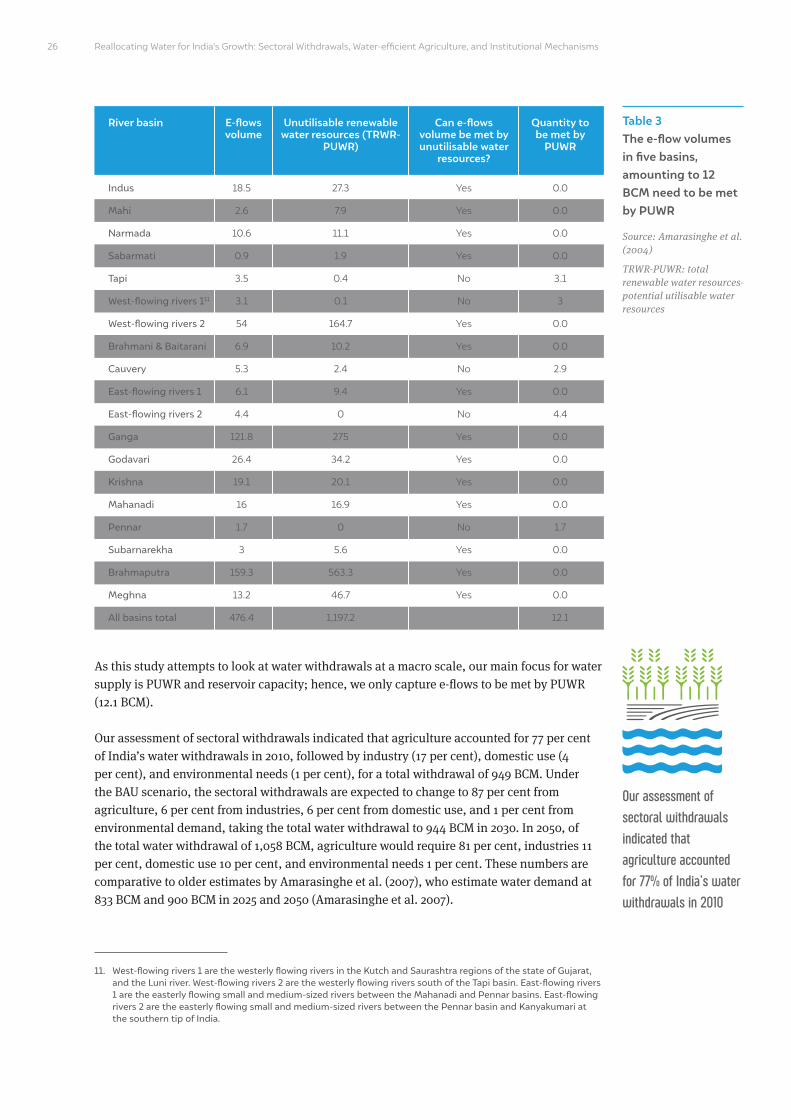
Reallocating Water for India’s Growth: Sectoral Withdrawals, Water-efficient Agriculture, and Institutional Mechanisms
As this study attempts to look at water withdrawals at a macro scale, our main focus for water supply is PUWR and reservoir capacity; hence, we only capture e-flows to be met by PUWR (12.1 BCM).
Our assessment of sectoral withdrawals indicated that agriculture accounted for 77 per cent of India’s water withdrawals in 2010, followed by industry (17 per cent), domestic use (4 per cent), and environmental needs (1 per cent), for a total withdrawal of 949 BCM. Under the BAU scenario, the sectoral withdrawals are expected to change to 87 per cent from agriculture, 6 per cent from industries, 6 per cent from domestic use, and 1 per cent from environmental demand, taking the total water withdrawal to 944 BCM in 2030. In 2050, of the total water withdrawal of 1,058 BCM, agriculture would require 81 per cent, industries 11 per cent, domestic use 10 per cent, and environmental needs 1 per cent. These numbers are comparative to older estimates by Amarasinghe et al. (2007), who estimate water demand at 833 BCM and 900 BCM in 2025 and 2050 (Amarasinghe et al. 2007).
Table 3 The e-flow volumes in five basins, amounting to 12 BCM need to be met by PUWR
Source: Amarasinghe et al. (2004)
TRWR-PUWR: total renewable water resources-potential utilisable water resources
River basin E-flows volume
Quantity to be met by
PUWR
Can e-flows volume be met by unutilisable water
resources?
Unutilisable renewable water resources (TRWR-
PUWR)
Indus
Mahi
Narmada
Sabarmati
Tapi
West-flowing rivers 111
West-flowing rivers 2
Brahmani & Baitarani
Cauvery
East-flowing rivers 1
East-flowing rivers 2
Ganga
Godavari
Krishna
Mahanadi
Pennar
Subarnarekha
Brahmaputra
Meghna
All basins total
18.5
2.6
10.6
0.9
3.5
3.1
54
6.9
5.3
6.1
4.4
121.8
26.4
19.1
16
1.7
3
159.3
13.2
476.4
27.3
7.9
11.1
1.9
0.4
0.1
164.7
10.2
2.4
9.4
0
275
34.2
20.1
16.9
0
5.6
563.3
46.7
1,197.2
Yes
Yes
Yes
Yes
No
No
Yes
Yes
No
Yes
No
Yes
Yes
Yes
Yes
No
Yes
Yes
Yes
0.0
0.0
0.0
0.0
3.1
3
0.0
0.0
2.9
0.0
4.4
0.0
0.0
0.0
0.0
1.7
0.0
0.0
0.0
12.1
11. West-flowing rivers 1 are the westerly flowing rivers in the Kutch and Saurashtra regions of the state of Gujarat, and the Luni river. West-flowing rivers 2 are the westerly flowing rivers south of the Tapi basin. East-flowing rivers 1 are the easterly flowing small and medium-sized rivers between the Mahanadi and Pennar basins. East-flowing rivers 2 are the easterly flowing small and medium-sized rivers between the Pennar basin and Kanyakumari at the southern tip of India.
Our assessment of sectoral withdrawals indicated that agriculture accounted for 77% of India’s water withdrawals in 2010
26
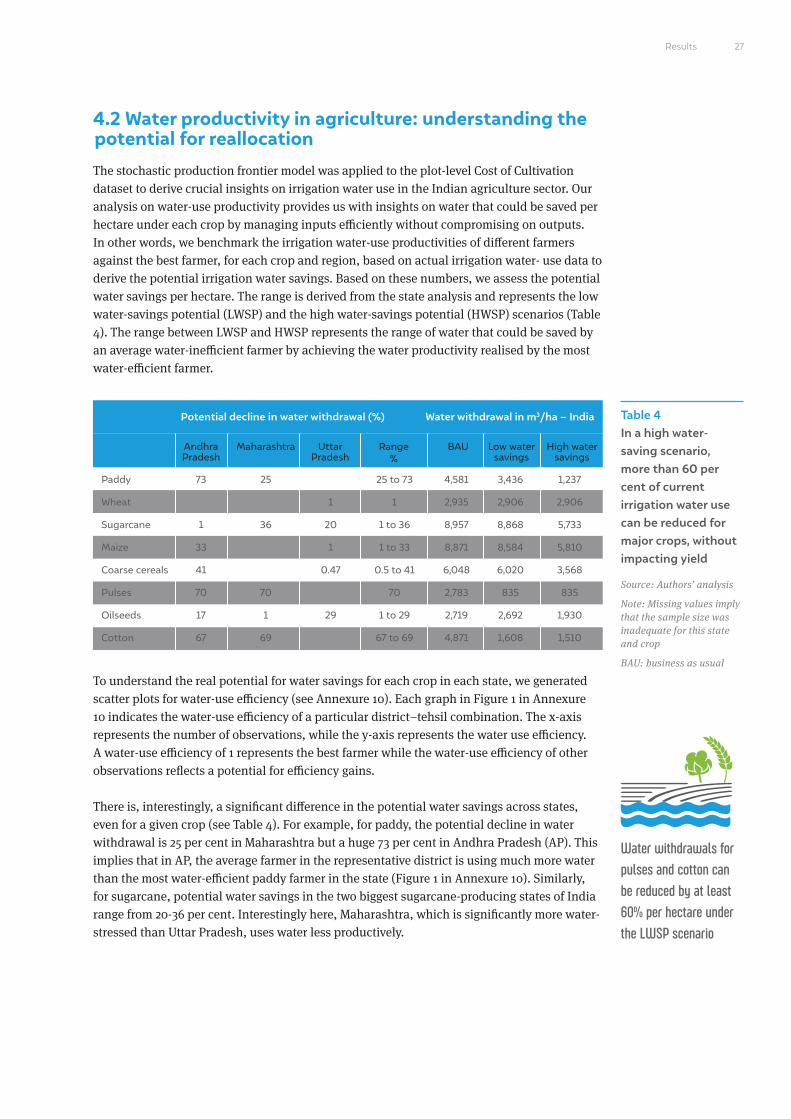
4.2 Water productivity in agriculture: understanding the potential for reallocationThe stochastic production frontier model was applied to the plot-level Cost of Cultivation dataset to derive crucial insights on irrigation water use in the Indian agriculture sector. Our analysis on water-use productivity provides us with insights on water that could be saved per hectare under each crop by managing inputs efficiently without compromising on outputs. In other words, we benchmark the irrigation water-use productivities of different farmers against the best farmer, for each crop and region, based on actual irrigation water- use data to derive the potential irrigation water savings. Based on these numbers, we assess the potential water savings per hectare. The range is derived from the state analysis and represents the low water-savings potential (LWSP) and the high water-savings potential (HWSP) scenarios (Table 4). The range between LWSP and HWSP represents the range of water that could be saved by an average water-inefficient farmer by achieving the water productivity realised by the most water-efficient farmer.
To understand the real potential for water savings for each crop in each state, we generated scatter plots for water-use efficiency (see Annexure 10). Each graph in Figure 1 in Annexure 10 indicates the water-use efficiency of a particular district–tehsil combination. The x-axis represents the number of observations, while the y-axis represents the water use efficiency. A water-use efficiency of 1 represents the best farmer while the water-use efficiency of other observations reflects a potential for efficiency gains.
There is, interestingly, a significant difference in the potential water savings across states, even for a given crop (see Table 4). For example, for paddy, the potential decline in water withdrawal is 25 per cent in Maharashtra but a huge 73 per cent in Andhra Pradesh (AP). This implies that in AP, the average farmer in the representative district is using much more water than the most water-efficient paddy farmer in the state (Figure 1 in Annexure 10). Similarly, for sugarcane, potential water savings in the two biggest sugarcane-producing states of India range from 20-36 per cent. Interestingly here, Maharashtra, which is significantly more water-stressed than Uttar Pradesh, uses water less productively.
Table 4 In a high water-saving scenario, more than 60 per cent of current irrigation water use can be reduced for major crops, without impacting yield
Source: Authors’ analysis
Note: Missing values imply that the sample size was inadequate for this state and crop
BAU: business as usual
Potential decline in water withdrawal (%)
Andhra Pradesh
Maharashtra Uttar Pradesh
Low water savings
High water savings
Range%
BAU
Water withdrawal in m3/ha – India
Paddy
Wheat
Sugarcane
Maize
Coarse cereals
Pulses
Oilseeds
Cotton
73
1
33
41
70
17
67
25
36
70
1
69
1
20
1
0.47
29
25 to 73
1
1 to 36
1 to 33
0.5 to 41
70
1 to 29
67 to 69
4,581
2,935
8,957
8,871
6,048
2,783
2,719
4,871
3,436
2,906
8,868
8,584
6,020
835
2,692
1,608
1,237
2,906
5,733
5,810
3,568
835
1,930
1,510
Water withdrawals for pulses and cotton can be reduced by at least 60% per hectare under the LWSP scenario
27Results
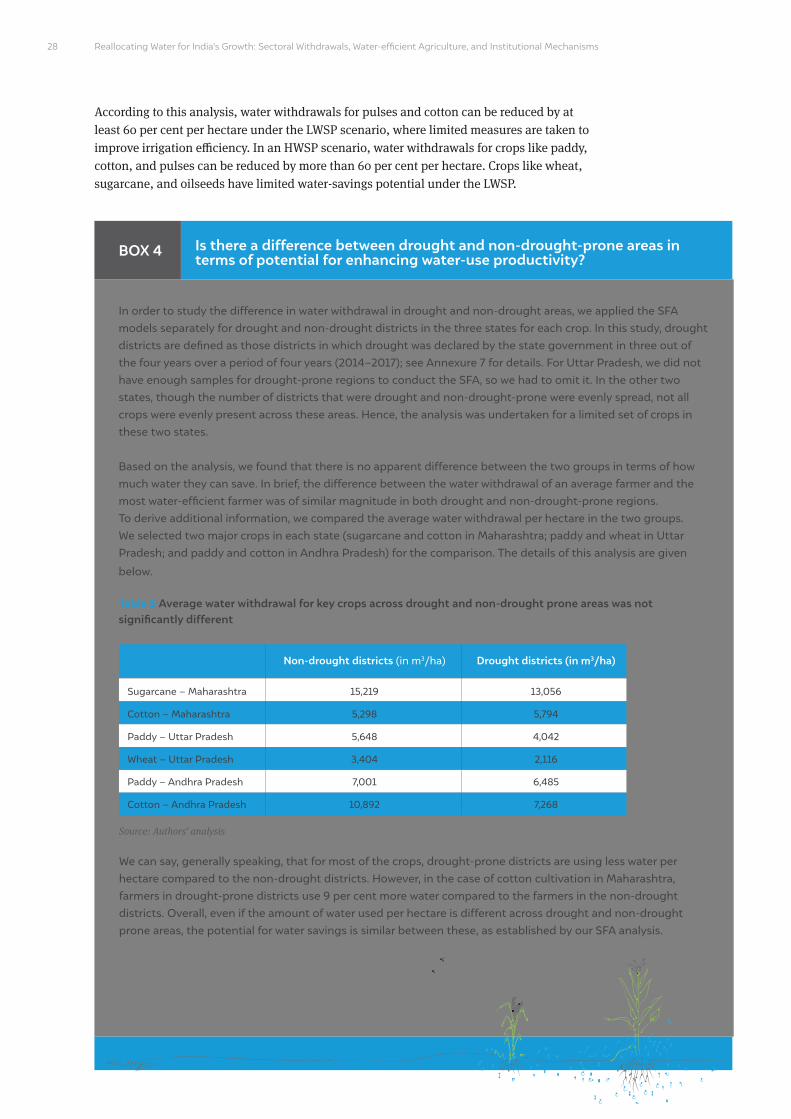
Reallocating Water for India’s Growth: Sectoral Withdrawals, Water-efficient Agriculture, and Institutional Mechanisms
In order to study the difference in water withdrawal in drought and non-drought areas, we applied the SFA models separately for drought and non-drought districts in the three states for each crop. In this study, drought districts are defined as those districts in which drought was declared by the state government in three out of the four years over a period of four years (2014–2017); see Annexure 7 for details. For Uttar Pradesh, we did not have enough samples for drought-prone regions to conduct the SFA, so we had to omit it. In the other two states, though the number of districts that were drought and non-drought-prone were evenly spread, not all crops were evenly present across these areas. Hence, the analysis was undertaken for a limited set of crops in these two states.
Based on the analysis, we found that there is no apparent difference between the two groups in terms of how much water they can save. In brief, the difference between the water withdrawal of an average farmer and the most water-efficient farmer was of similar magnitude in both drought and non-drought-prone regions. To derive additional information, we compared the average water withdrawal per hectare in the two groups. We selected two major crops in each state (sugarcane and cotton in Maharashtra; paddy and wheat in Uttar Pradesh; and paddy and cotton in Andhra Pradesh) for the comparison. The details of this analysis are given
below.
Table 5 Average water withdrawal for key crops across drought and non-drought prone areas was not significantly different
Is there a difference between drought and non-drought-prone areas in terms of potential for enhancing water-use productivity?
We can say, generally speaking, that for most of the crops, drought-prone districts are using less water per hectare compared to the non-drought districts. However, in the case of cotton cultivation in Maharashtra, farmers in drought-prone districts use 9 per cent more water compared to the farmers in the non-drought districts. Overall, even if the amount of water used per hectare is different across drought and non-drought prone areas, the potential for water savings is similar between these, as established by our SFA analysis.
Non-drought districts (in m3/ha) Drought districts (in m3/ha)
Sugarcane – Maharashtra
Cotton – Maharashtra
Paddy – Uttar Pradesh
Wheat – Uttar Pradesh
Paddy – Andhra Pradesh
Cotton – Andhra Pradesh
15,219
5,298
5,648
3,404
7,001
10,892
13,056
5,794
4,042
2,116
6,485
7,268
Source: Authors’ analysis
28
According to this analysis, water withdrawals for pulses and cotton can be reduced by at least 60 per cent per hectare under the LWSP scenario, where limited measures are taken to improve irrigation efficiency. In an HWSP scenario, water withdrawals for crops like paddy, cotton, and pulses can be reduced by more than 60 per cent per hectare. Crops like wheat, sugarcane, and oilseeds have limited water-savings potential under the LWSP.
BOX 4

Further analysis shows that there is scope to reduce irrigation water withdrawal substantially in the coming decades. Compared with the water withdrawal in the 2030 BAU scenario (Figure 6), 160 BCM can be saved and reallocated under LWSP. More robust measures to improve water use productivity could potentially save 389 BCM. Similarly, compared with the BAU water withdrawal in 2050, India can save 166 BCM through minimum water productivity improvement measures. Under the HWSP, 403 BCM can be saved and reallocated by 2050.
4.3 Deriving more value from water (alternative scenarios)
In this section, we analyse the demand for reallocated water under different policy scenarios.
4.3.1 Make in India (high manufacturing) scenario We also estimate how water withdrawals will be affected by the Make in India programme, which aims to boost manufacturing in India so that it contributes 25 per cent to India’s GDP. A 2018 study stated that businesses perceived water shortages as one of the major bottlenecks to industrial growth, especially in the context of this policy (PHD Chamber of Commerce 2018). To study water withdrawals under this scenario, we use the same growth rate as in the period from 2010 to 2020. In the absence of literature on Make in India projection rates from 2020 to 2030 and from 2030 to 2050, we assume that there will be accelerated growth compared to BAU (see Table A9 in Annexure 9). Given this assumption, manufacturing sector would require 53 BCM and 129 BCM in 2030 and 2050. Water withdrawal by the industrial sector is estimated to be 58 BCM and 138 BCM in the same years, including thermal power generation–related water requirements.
4.3.2 Har Ghar Jal (Water for All) scenario
Under the Har Ghar Jal (Water for All) scheme (2019), the GoI intends to provide tap water to every rural household by 2024. We also explored the additional water withdrawal required if India were to connect all rural households to piped water supply. As mentioned earlier, municipal water supply coverage in rural areas was around 30 per
Compared with the water withdrawal in the 2030 BAU scenario, 160 BCM can be saved and reallocated under LWSP
Figure 6 In a low to high water savings scenario, nearly 20-47 per cent water can be saved by agriculture by 2030
Source: Authors’ analysis
0
200
2010
730823 853
450
687
434
663
2030 2050
400
600
800
1000
Wat
er D
eman
d in
BC
M
Irrigation use - BAU Irrigation use - HWSP Irrigation use - LWSP
29Results
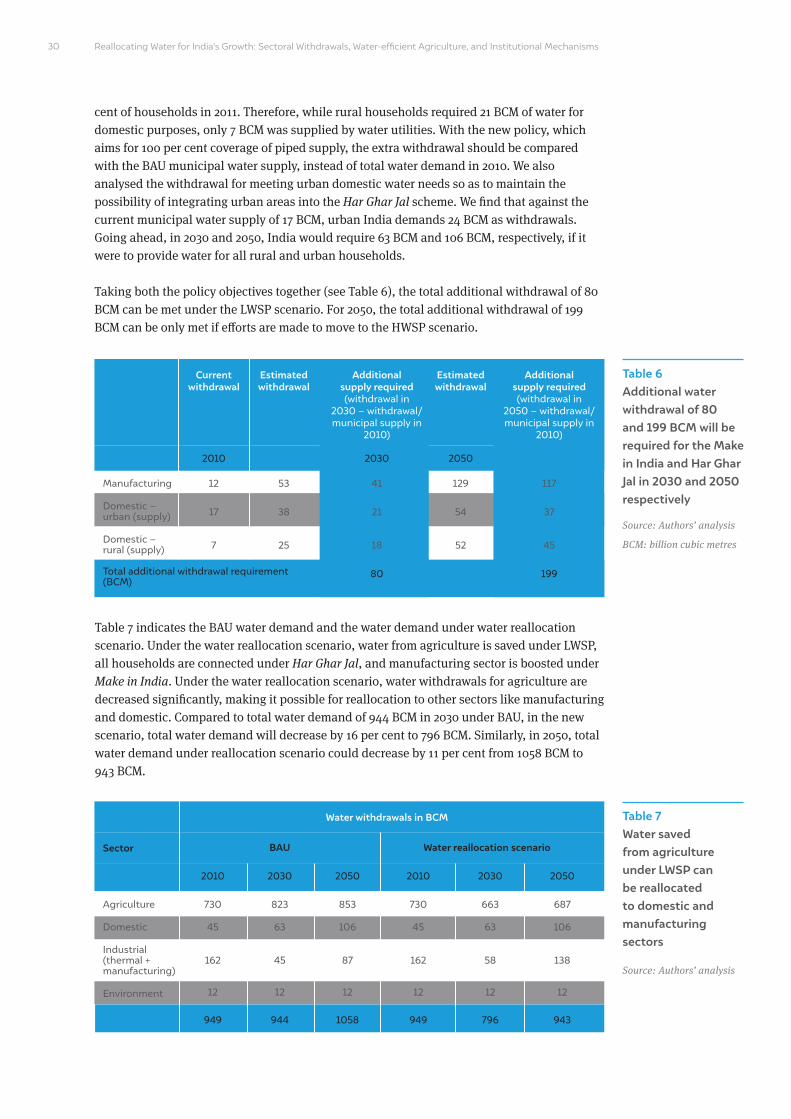
Reallocating Water for India’s Growth: Sectoral Withdrawals, Water-efficient Agriculture, and Institutional Mechanisms
Table 7 indicates the BAU water demand and the water demand under water reallocation scenario. Under the water reallocation scenario, water from agriculture is saved under LWSP, all households are connected under Har Ghar Jal, and manufacturing sector is boosted under Make in India. Under the water reallocation scenario, water withdrawals for agriculture are decreased significantly, making it possible for reallocation to other sectors like manufacturing and domestic. Compared to total water demand of 944 BCM in 2030 under BAU, in the new scenario, total water demand will decrease by 16 per cent to 796 BCM. Similarly, in 2050, total water demand under reallocation scenario could decrease by 11 per cent from 1058 BCM to 943 BCM.
Table 6 Additional water withdrawal of 80 and 199 BCM will be required for the Make in India and Har Ghar Jal in 2030 and 2050 respectively
Source: Authors’ analysis
BCM: billion cubic metres
Table 7 Water saved from agriculture under LWSP can be reallocated to domestic and manufacturing sectors
Source: Authors’ analysis
Current withdrawal
Sector
Estimated withdrawal
Estimated withdrawal
Water withdrawals in BCM
Water reallocation scenarioBAU
2010
2010
949
2010
949
2030
2030
944
2030
796
80 199
2050
2050
1058
2050
943
Manufacturing
Domestic – urban (supply)
Domestic – rural (supply)
Agriculture
Domestic
Industrial (thermal + manufacturing)
Environment
Total additional withdrawal requirement (BCM)
12
17
7
730
45
162
12
823
63
45
12
853
106
87
12
730
45
162
12
663
63
58
12
687
106
138
12
53
38
25
129
54
52
30
cent of households in 2011. Therefore, while rural households required 21 BCM of water for domestic purposes, only 7 BCM was supplied by water utilities. With the new policy, which aims for 100 per cent coverage of piped supply, the extra withdrawal should be compared with the BAU municipal water supply, instead of total water demand in 2010. We also analysed the withdrawal for meeting urban domestic water needs so as to maintain the possibility of integrating urban areas into the Har Ghar Jal scheme. We find that against the current municipal water supply of 17 BCM, urban India demands 24 BCM as withdrawals. Going ahead, in 2030 and 2050, India would require 63 BCM and 106 BCM, respectively, if it were to provide water for all rural and urban households.
Taking both the policy objectives together (see Table 6), the total additional withdrawal of 80 BCM can be met under the LWSP scenario. For 2050, the total additional withdrawal of 199 BCM can be only met if efforts are made to move to the HWSP scenario.
Additional supply required (withdrawal in
2030 – withdrawal/municipal supply in
2010)
Additional supply required (withdrawal in
2050 – withdrawal/municipal supply in
2010)
117
37
45
41
21
18

We estimated the total value of water used in the reference scenario – BAU 2010 (which assumes that water demand is being sustainably met) and then the water reallocation policy scenario (including the Make in India and Har Ghar Jal scenarios) for 2030 and 2050. This implicitly assumes that any increase in water withdrawal after 2010, across sectors, will be water-constrained, hence leading to the unsustainable use of water with either economic or environmental costs. The difference in the macro-economic value of water between the water reallocation policy scenario and the reference scenario, for 2030 and 2050, gives a high level estimate of the cost of inaction if water is not saved in the agricultural sector and reallocated to the other sectors. This approach aims at presenting preliminary estimates of the cost of inaction. Our cost of inaction estimates do not account for the general equilibrium economic impacts of interventions in one sector on the other economic sectors that use water. Given the magnitude of our preliminary estimates, we suggest a detailed and sophisticated analysis of the economic impacts of water reallocation across sectors.
Table 8 The cost of inaction will be almost INR 48 trillion in 2030 and INR 138 trillion in 2050
Cost of inaction
We find that the cost of inaction will be almost INR 48 trillion (or USD 869 billion, 2011–12 prices) in 2030 and INR 138 trillion (or USD 2,520 billion) in 2050 (see Table 8). A large part of this cost could be attributed to the value-add that would be potentially lost due to the non-achievement of the aggressive increase in the manufacturing sector based solely due to water constraints. The value added per unit of water is very high for the manufacturing sector as compared to other sectors. Conflicts between industrial and agricultural stakeholders are becoming increasingly evident. Our study highlights that if the potential for the more productive use of water is not harnessed, there would be a significant loss in the potential value added by India’s manufacturing sector. Alternatively, if the water withdrawal requirements of the manufacturing sector are met without provisioning for more water, the environmental impact would be substantial. At this point, it is worth noting that this cost of inaction is not the same as the benefits of action. The assumption made here is that the benefits of action will be higher than the costs of inaction.
Produc-tivity (in INR/m3)
Water withdrawal (in BCM)
Reference scenario
Reference scenario
Water reallocation
scenario – 2030
Water reallocation
scenario – 2030
2030
Water reallocation
scenario – 2050
Cost of Inaction (in billion INR, 2011–12 prices)
Cost of Inaction (in billion USD, 2011–12 prices)
47,815
869
1,38,623
2,520
Water reallocation
scenario – 2050
2050
Demand sector
Aggregated value of water (in billion INR, 2011–12 prices)
22.5
1175
22.5
22.5
730
12
24
464
1,223
663
53
63
476
1,251
687
129
106
476
1,398
1,6425
14,100
540
10,440
41,505
14,918
62,275
1,418
10,710
89,320
15,458
151,575
2,385
10,710
1,80,128
Note: USD to INR exchange rate has been taken as 55 INR/USD for 2011–12
Source: Authors’ analysis
BCM: billion cubic metres
31Results
BOX 5
Agriculture
Manufacturing
Domestic supply
Environmental
Total
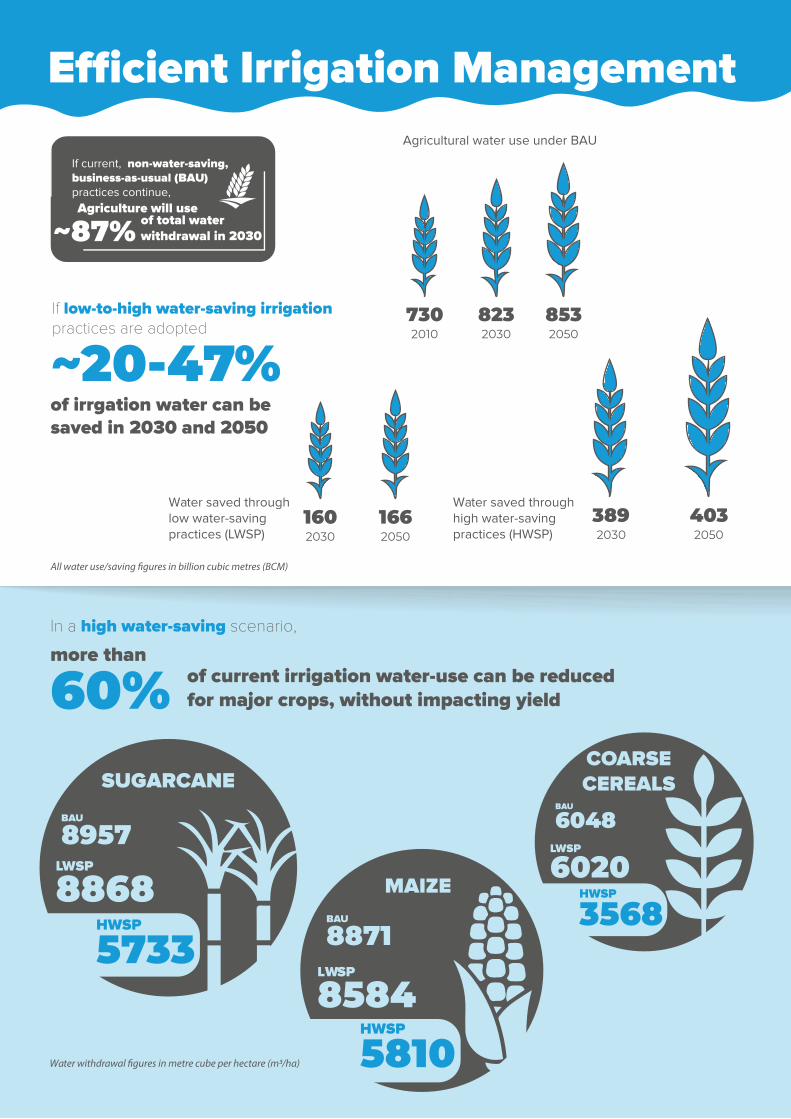
Reallocating Water for India’s Growth: Sectoral Withdrawals, Water-efficient Agriculture, and Institutional Mechanisms
Agriculture will use
~87% of total water withdrawal in 2030
of irrgation water can be saved in 2030 and 2050
~20-47%If low-to-high water-saving irrigationpractices are adopted
Agricultural water use under BAU
Water saved through low water-saving practices (LWSP)
Water saved through high water-saving practices (HWSP)
In a high water-saving scenario,
SUGARCANE
8957BAU
8868LWSP
5733HWSP
6048BAU
6020LWSP
3568HWSP
COARSECEREALS
60%more than
of current irrigation water-use can be reduced for major crops, without impacting yield
MAIZE
8871BAU
8584LWSP
5810HWSP
1602030
1662050
3892030
4032050
730 823 8532010 2030 2050
Water withdrawal res in metre cube per hectare (m /ha)
All wat res in billion cubic metres (BCM)
If current, non-water-saving, business-as-usual (BAU) practices continue,
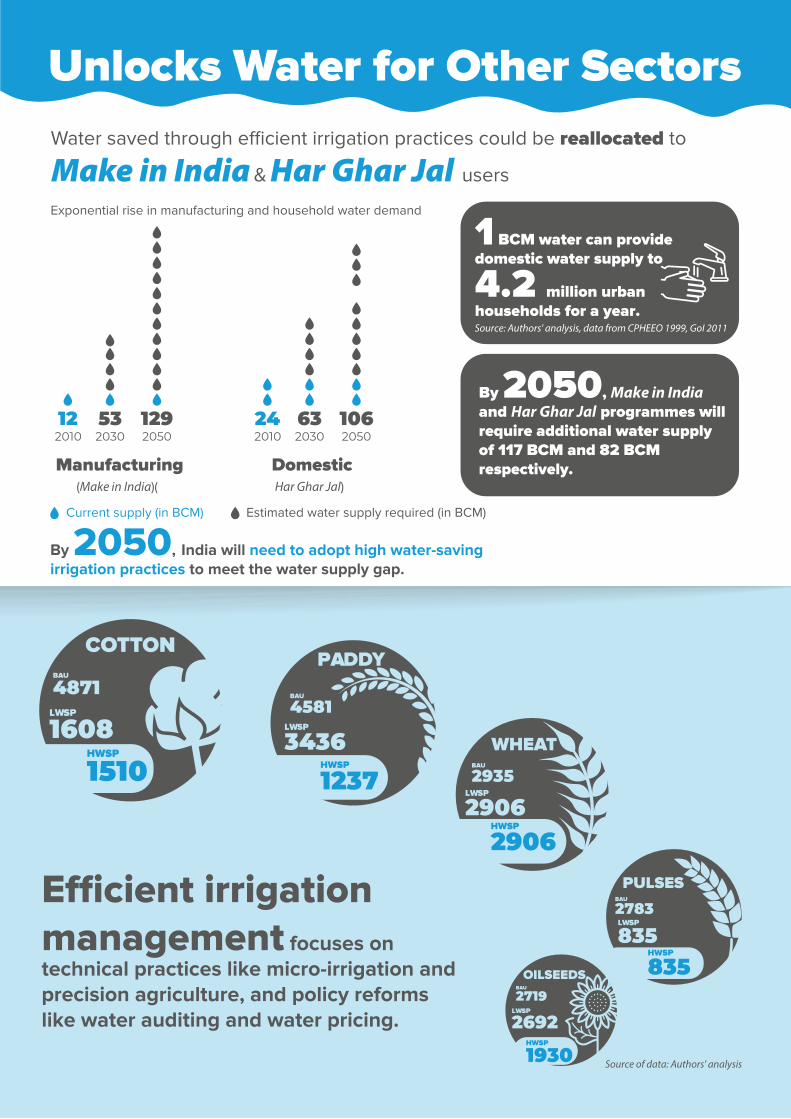
reallocated to
Manufacturing
Exponential rise in manufacturing and household water demand
(Make in India)( Har Ghar Jal)
Unlocks Water for Other Sectors
management focuses on technical practices like micro-irrigation and precision agriculture, and policy reforms like water auditing and water pricing.
4871BAU
1608LWSP
1510HWSP
COTTON
4581BAU
3436LWSP
1237HWSP
PADDY
WHEAT
2935BAU
2906LWSP
2906HWSP
2783BAU
835LWSP
835HWSP
PULSES
2719BAU
2692LWSP
OILSEEDS
1930HWSP
Source of data: Authors' analysis
Current supply (in BCM)
& users
12
By 2050, India will need to adopt high water-saving irrigation practices to meet the water supply gap.
2010532030
1292050
Domestic
242010
632030
1062050
Estimated water supply required (in BCM)
By 2050, Make in India and Har Ghar Jal programmes will require additional water supply of 117 BCM and 82 BCM respectively.
1 BCM water can provide domestic water supply to
4.2 million urban households for a year. Source: Authors' analysis, data from CPHEEO 1999, GoI 2011
Reallocating Water for India’s Growth: Sectoral Withdrawals, Water-efficient Agriculture, and Institutional Mechanisms
Image: iStock
Optimising the price of water is a crucial step in improving water-use efficiency and rewarding conservation. Under-pricing water can have detrimental effects on the availability of resources for the management of irrigation systems.
35
5. Enabling factors for successful water reallocation and strategies for enhancing irrigation water productivity
Water reallocation is the transfer of rights between users who have been allocated a certain amount of water (through formal water-use rights or entitlements, or informal
arrangements) after it has been determined that the initial allocation is physically impossible or socioeconomically unfavourable. In many river basins around the world, it is no longer possible to meet increasing demand by constructing new infrastructure (CTCN 2019). This is either because all of the runoff in a basin is already being utilised (“closed” basins) or because there are no suitable sites for the construction of new infrastructure. Briscoe and Malik (2007) note that due to the physical scarcity of water, already apparent in a number of basins, India needs to make far-reaching changes in water resource allocation and water-use efficiency. This is particularly applicable to irrigation water demand, which accounts for a dominant share in the total water use (Speed et al. 2013; Briscoe and Malik 2007).
Making better economic use of water implies an emphasis on its productivity and the realisation of benefits such as the economic welfare that can be derived from alternate uses like industrial and domestic use and ecological benefits through reallocation to the environment. Alternatively, misallocation is held to be a manifestation of poor water management and can result in economic inefficiency. The costs of inaction are clear – especially with growing acknowledgment of the costs of inaction on the environment. What is often neglected is the social and economic costs of poor implementation of water reallocation plans. Reallocation should not be seen as the singular solution to the problem of resource security. Reallocation plans must be holistic – they must take into consideration equity distribution and economics (United Nations 2003; Molle and Berkoff 2009).
5.1 Enabling factors for successful water reallocationVarious forms of mechanisms for reallocating water have been identified in the literature. One such form is temporary and permanent transfers. Temporary transfers of water typically occur during a drought, whereas permanent transfers occur when a source of water already tapped by several users is diverted to the benefit of another water demand sector. The choice of an appropriate mechanism depends on several ground conditions, including scale and local dynamics. Meinzen-Dick and Ringler (2006) categorised three forms of formal water reallocation: administrative reallocation, collective negotiations, and market-based reallocation (Meinzen-Dick and Ringler 2006). Other informal means of reallocation can sometimes be found in practice, including the use of force, surreptitiousness, or illegal means to reallocate water to other purposes. Below we briefly discuss the formal mechanisms of water reallocation, which are based on implementation.
Misallocation is held to be a manifestation of poor water management and can result in economic inefficiency
Reallocating Water for India’s Growth: Sectoral Withdrawals, Water-efficient Agriculture, and Institutional Mechanisms36
Administrative reallocation: This type of reallocation is typically used for reallocating water from large water bodies such as rivers, lakes, reservoirs, and large irrigation systems. It is assumed that water is public property and, therefore, the state justifies its right to regulate and reallocate water for the benefit of the wider public. These are often mandatory (non-voluntary) measures taken by a centralised public or quasi-public entity. In such type of reallocation, the impacts on smaller, less powerful users are often ignored. Indirect compensation may be given, but the prior rights of users are rarely recognised. The multiplicity of stakeholders with different agendas makes this type of reallocation mechanism fairly complex (Meinzen-Dick and Ringler 2006; Marston and Cai 2016; Wurbs 2013).
Quite often, the fee structure of administrative allocation does not incentivise farmers to use water judiciously, as the fees charged are often bulk charges or a flat tariff. In such a scenario, a simplistic solution such as increasing water rates can even have the perverse effect of increasing water consumption, as people feel that they are entitled to more water because they are paying more (Qtaishat 2013; Meinzen-Dick and Ringler 2006).
Market-based reallocation: In this type of reallocation, water is either sold directly to buyers for non-agricultural uses or land is leased or sold to individuals or factories. They can then either abstract the groundwater beneath the land or use the share of water allotted to the land through irrigation systems. The use of formal and informal market mechanisms is prevalent, as this system presupposes recognition of private water rights and entitlements. Market transfers directly compensate those who engage in the transfers, but they generally do not take into account the water claims of others who may be affected, unless there is specific state regulation (Meinzen-Dick and Ringler 2006).
The water rights and entitlements may not be based on ownership rights, as they can be equally effective just as usufructuary rights. Apart from social and political acceptability, this mechanism also requires basic technical and design conditions to deliver water on a volumetric basis (World Bank 1998).
The state of Maharashtra in India established a water rights and entitlements regime covering both surface and groundwater in 2005 – the Maharashtra Water Resources Regulatory Authority Act. While establishing individual and transferable rights is a long-term goal, the act adopts a politically and administratively pragmatic intermediate strategy – establishing bulk water entitlements for entities such as water user associations and urban and rural water supply agencies and industries. Such water rights can be transferred, sold, and bartered either in full or in part. Water entitlements also entail other correlated activities such as payments, efficient use, and quality maintenance. Provisions have also been made for resolving conflicts and grievances at both the local and regional levels (Government of Maharashtra 2005).
A recent study by Gutiérrez-Martín et al. (2020) introduces a market-based allocation mechanism called self-financed water banks, which are proposed to operate in a monopsony-monopoly setting, where they can use their market power to recover water for environmental purposes and work with a balanced budget (expenditure on purchases will equal revenues from sales). More details on self-financed water banks can be found in Box 6 (Gutiérrez-Martín, Gómez-Limón and Montilla-López 2020).
Negotiation-based approaches expand the range of options, for example, by seeking “win-win” solutions
The choice of an appropriate mechanism depends on several ground conditions, including scale and local dynamics
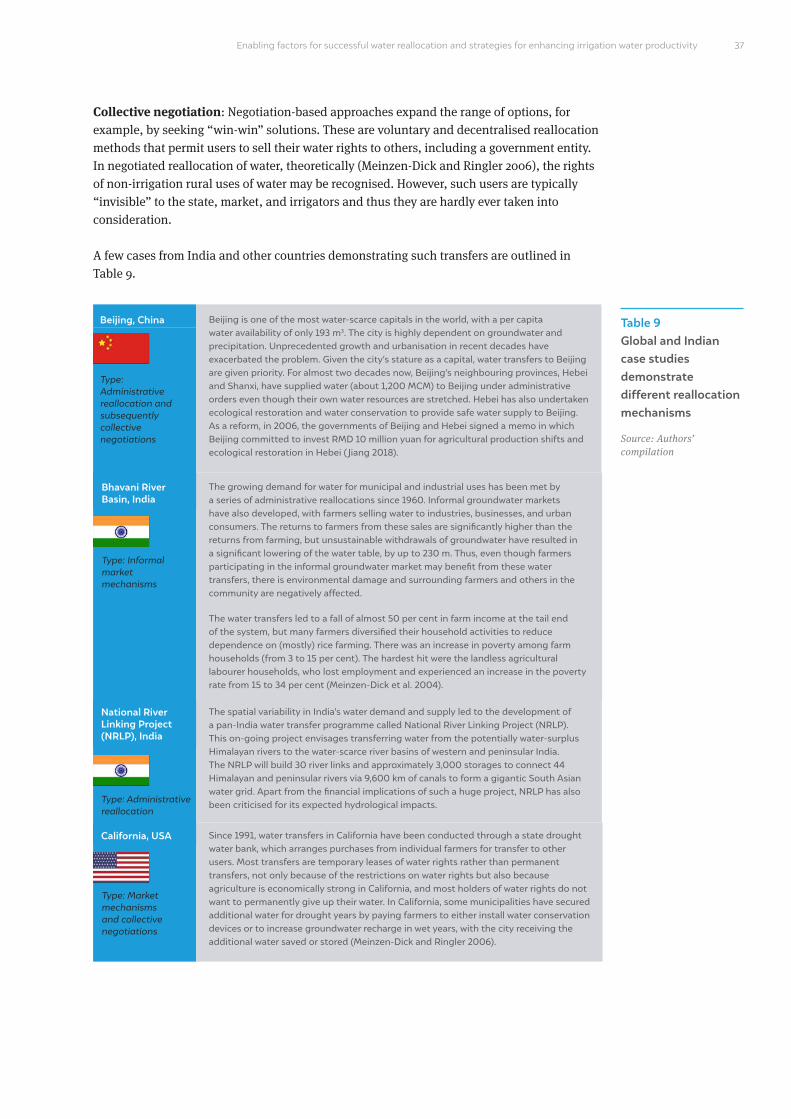
37Enabling factors for successful water reallocation and strategies for enhancing irrigation water productivity
Collective negotiation: Negotiation-based approaches expand the range of options, for example, by seeking “win-win” solutions. These are voluntary and decentralised reallocation methods that permit users to sell their water rights to others, including a government entity. In negotiated reallocation of water, theoretically (Meinzen-Dick and Ringler 2006), the rights of non-irrigation rural uses of water may be recognised. However, such users are typically “invisible” to the state, market, and irrigators and thus they are hardly ever taken into consideration.
A few cases from India and other countries demonstrating such transfers are outlined in Table 9.
Table 9 Global and Indian case studies demonstrate different reallocation mechanisms
Source: Authors’ compilation
Type: Administrative reallocation and subsequently collective negotiations
Beijing, China
Type: Informal market mechanisms
Bhavani River Basin, India
Beijing is one of the most water-scarce capitals in the world, with a per capita water availability of only 193 m3. The city is highly dependent on groundwater and precipitation. Unprecedented growth and urbanisation in recent decades have exacerbated the problem. Given the city’s stature as a capital, water transfers to Beijing are given priority. For almost two decades now, Beijing’s neighbouring provinces, Hebei and Shanxi, have supplied water (about 1,200 MCM) to Beijing under administrative orders even though their own water resources are stretched. Hebei has also undertaken ecological restoration and water conservation to provide safe water supply to Beijing. As a reform, in 2006, the governments of Beijing and Hebei signed a memo in which Beijing committed to invest RMD 10 million yuan for agricultural production shifts and ecological restoration in Hebei ( Jiang 2018).
The growing demand for water for municipal and industrial uses has been met by a series of administrative reallocations since 1960. Informal groundwater markets have also developed, with farmers selling water to industries, businesses, and urban consumers. The returns to farmers from these sales are significantly higher than the returns from farming, but unsustainable withdrawals of groundwater have resulted in a significant lowering of the water table, by up to 230 m. Thus, even though farmers participating in the informal groundwater market may benefit from these water transfers, there is environmental damage and surrounding farmers and others in the community are negatively affected.
The water transfers led to a fall of almost 50 per cent in farm income at the tail end of the system, but many farmers diversified their household activities to reduce dependence on (mostly) rice farming. There was an increase in poverty among farm households (from 3 to 15 per cent). The hardest hit were the landless agricultural labourer households, who lost employment and experienced an increase in the poverty rate from 15 to 34 per cent (Meinzen-Dick et al. 2004).
Type: Administrative reallocation
National River Linking Project (NRLP), India
The spatial variability in India’s water demand and supply led to the development of a pan-India water transfer programme called National River Linking Project (NRLP). This on-going project envisages transferring water from the potentially water-surplus Himalayan rivers to the water-scarce river basins of western and peninsular India. The NRLP will build 30 river links and approximately 3,000 storages to connect 44 Himalayan and peninsular rivers via 9,600 km of canals to form a gigantic South Asian water grid. Apart from the financial implications of such a huge project, NRLP has also been criticised for its expected hydrological impacts.
Type: Market mechanisms and collective negotiations
California, USA Since 1991, water transfers in California have been conducted through a state drought water bank, which arranges purchases from individual farmers for transfer to other users. Most transfers are temporary leases of water rights rather than permanent transfers, not only because of the restrictions on water rights but also because agriculture is economically strong in California, and most holders of water rights do not want to permanently give up their water. In California, some municipalities have secured additional water for drought years by paying farmers to either install water conservation devices or to increase groundwater recharge in wet years, with the city receiving the additional water saved or stored (Meinzen-Dick and Ringler 2006).
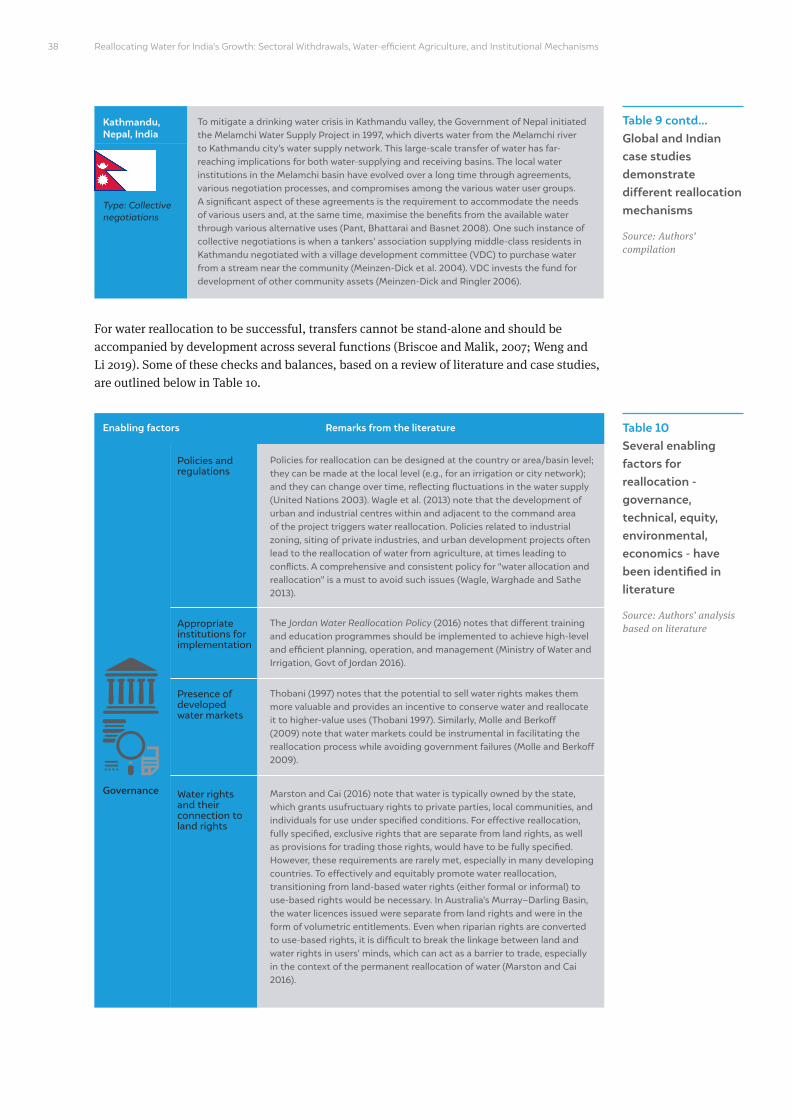
Reallocating Water for India’s Growth: Sectoral Withdrawals, Water-efficient Agriculture, and Institutional Mechanisms38
Table 9 contd... Global and Indian case studies demonstrate different reallocation mechanisms
Source: Authors’ compilation
Type: Collective negotiations
To mitigate a drinking water crisis in Kathmandu valley, the Government of Nepal initiated the Melamchi Water Supply Project in 1997, which diverts water from the Melamchi river to Kathmandu city’s water supply network. This large-scale transfer of water has far-reaching implications for both water-supplying and receiving basins. The local water institutions in the Melamchi basin have evolved over a long time through agreements, various negotiation processes, and compromises among the various water user groups. A significant aspect of these agreements is the requirement to accommodate the needs of various users and, at the same time, maximise the benefits from the available water through various alternative uses (Pant, Bhattarai and Basnet 2008). One such instance of collective negotiations is when a tankers’ association supplying middle-class residents in Kathmandu negotiated with a village development committee (VDC) to purchase water from a stream near the community (Meinzen-Dick et al. 2004). VDC invests the fund for development of other community assets (Meinzen-Dick and Ringler 2006).
For water reallocation to be successful, transfers cannot be stand-alone and should be accompanied by development across several functions (Briscoe and Malik, 2007; Weng and Li 2019). Some of these checks and balances, based on a review of literature and case studies, are outlined below in Table 10.
Table 10 Several enabling factors for reallocation - governance, technical, equity, environmental, economics - have been identified in literature
Source: Authors’ analysis based on literature
Enabling factors Remarks from the literature
Policies and regulations
Appropriate institutions for implementation
Presence of developed water markets
Policies for reallocation can be designed at the country or area/basin level; they can be made at the local level (e.g., for an irrigation or city network); and they can change over time, reflecting fluctuations in the water supply (United Nations 2003). Wagle et al. (2013) note that the development of urban and industrial centres within and adjacent to the command area of the project triggers water reallocation. Policies related to industrial zoning, siting of private industries, and urban development projects often lead to the reallocation of water from agriculture, at times leading to conflicts. A comprehensive and consistent policy for “water allocation and reallocation” is a must to avoid such issues (Wagle, Warghade and Sathe 2013).
The Jordan Water Reallocation Policy (2016) notes that different training and education programmes should be implemented to achieve high-level and efficient planning, operation, and management (Ministry of Water and Irrigation, Govt of Jordan 2016).
Thobani (1997) notes that the potential to sell water rights makes them more valuable and provides an incentive to conserve water and reallocate it to higher-value uses (Thobani 1997). Similarly, Molle and Berkoff (2009) note that water markets could be instrumental in facilitating the reallocation process while avoiding government failures (Molle and Berkoff 2009).
Water rights and their connection to land rights
Marston and Cai (2016) note that water is typically owned by the state, which grants usufructuary rights to private parties, local communities, and individuals for use under specified conditions. For effective reallocation, fully specified, exclusive rights that are separate from land rights, as well as provisions for trading those rights, would have to be fully specified. However, these requirements are rarely met, especially in many developing countries. To effectively and equitably promote water reallocation, transitioning from land-based water rights (either formal or informal) to use-based rights would be necessary. In Australia’s Murray–Darling Basin, the water licences issued were separate from land rights and were in the form of volumetric entitlements. Even when riparian rights are converted to use-based rights, it is difficult to break the linkage between land and water rights in users’ minds, which can act as a barrier to trade, especially in the context of the permanent reallocation of water (Marston and Cai 2016).
Governance
Kathmandu, Nepal, India

39Enabling factors for successful water reallocation and strategies for enhancing irrigation water productivity
Table 10 contd... Several enabling factors for reallocation - governance, technical, equity, environmental, economics - have been identified in literature
Source: Authors’ analysis based on literature
Enabling factors Remarks from the literature
Enforcement, monitoring, and evaluation
Hydrological and economic assessment of water resources
Improving irrigation water-use efficiency and productivity
Availability of infrastructure for water transfer
Complete stakeholder assessment
Protection of tail-end farmers
Both the Jordanian law and Maharashtra Water Resources Regulatory Authority (MWRRA) emphasise the need to monitor water use as per entitlements post reallocation. The use of modern technologies for data collection, validation, analysis, modelling, sharing, and dissemination should be encouraged in these processes (Government of Maharashtra 2005; Ministry of Water and Irrigation, Govt of Jordan 2016).
Reallocation processes need to be designed and assessed in a systemic regional and local context. Aguilar-Barajas and Garrick further note that water reallocation is part of a water system and cannot be assessed without recognising and understanding the connections between reallocation projects and other water sources (Aguilar-Barajas and Garrick 2019). Therefore, reallocation processes should be supported by detailed hydrological and economic assessments. This could be looked at as a benchmarking exercise that focusses on efficiency levels across different sectors (agricultural, industrial, urban) and considers the likely impacts of any curtailments (Speed et al. 2013).
Since agriculture uses the largest share of water among all sectors, that too, quite inefficiently, improvements in efficiency could potentially free up large amounts of water. Sections 6.1 and 6.3 discuss this in detail.
Several pieces of literature note that the water-allocation policies of any given country or area/basin are strongly influenced by the adequacy of the infrastructure (United Nations 2003).
Schwartz and Schouten (2007) note that pursuing only the economic logic for reallocation is likely to be detrimental to equity, while unchecked, centralised, and obscure decision-making, in turn, may favour costly options that only benefit a few stakeholders (Schwartz and Schouten 2007). The need for gender-mainstreaming decision-making in water management has also been highlighted in the Integrated Water Resources Management (IWRM) framework (Global Water Partnership 2011).
Wagle, Warghade and Sathe (2013) note several negative impacts of reallocation on tail-end farmers. Tail-end farmers are the most affected by perpetual reallocation and seasonal reallocation as they are least prioritised in the irrigation system. They are also most likely to suffer during reallocation due to loss of irrigation potential because of the curtailment of canals or reduction in water allocation to agriculture after reallocation. Therefore, tail-end farmers require special protection so that they do not lose out during a reallocation process (Wagle, Warghade and Sathe 2013).
Technical
Transparency Wagle et al. (2013) further identified the lack of transparency because of unilateral decision-making as a major detriment to equity in Maharashtra’s (India) reallocation process. Therefore, conscious stakeholder/public participation should be institutionalised during reallocation processes (Wagle, Warghade and Sathe 2013).
Equity
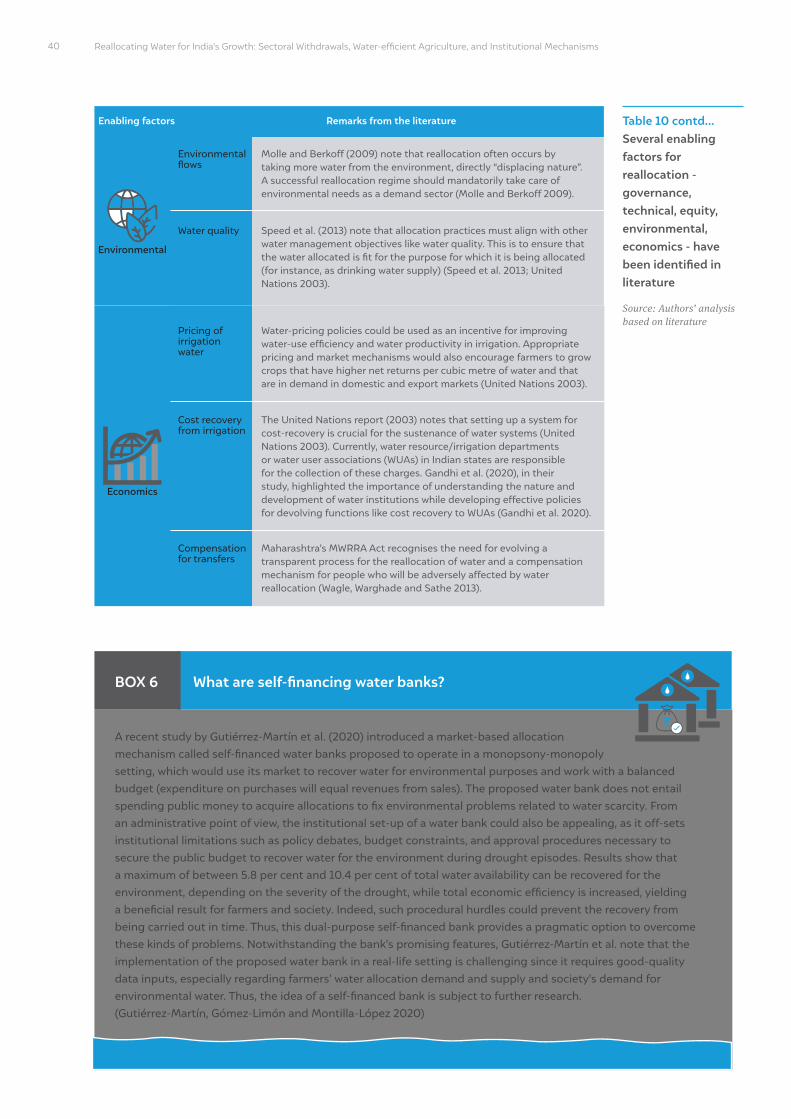
Reallocating Water for India’s Growth: Sectoral Withdrawals, Water-efficient Agriculture, and Institutional Mechanisms40
Table 10 contd... Several enabling factors for reallocation - governance, technical, equity, environmental, economics - have been identified in literature
Source: Authors’ analysis based on literature
Enabling factors Remarks from the literature
Pricing of irrigation water
Cost recovery from irrigation
Compensation for transfers
Environmental flows
Water quality
Water-pricing policies could be used as an incentive for improving water-use efficiency and water productivity in irrigation. Appropriate pricing and market mechanisms would also encourage farmers to grow crops that have higher net returns per cubic metre of water and that are in demand in domestic and export markets (United Nations 2003).
The United Nations report (2003) notes that setting up a system for cost-recovery is crucial for the sustenance of water systems (United Nations 2003). Currently, water resource/irrigation departments or water user associations (WUAs) in Indian states are responsible for the collection of these charges. Gandhi et al. (2020), in their study, highlighted the importance of understanding the nature and development of water institutions while developing effective policies for devolving functions like cost recovery to WUAs (Gandhi et al. 2020).
Maharashtra’s MWRRA Act recognises the need for evolving a transparent process for the reallocation of water and a compensation mechanism for people who will be adversely affected by water reallocation (Wagle, Warghade and Sathe 2013).
Molle and Berkoff (2009) note that reallocation often occurs by taking more water from the environment, directly “displacing nature”. A successful reallocation regime should mandatorily take care of environmental needs as a demand sector (Molle and Berkoff 2009).
Speed et al. (2013) note that allocation practices must align with other water management objectives like water quality. This is to ensure that the water allocated is fit for the purpose for which it is being allocated (for instance, as drinking water supply) (Speed et al. 2013; United Nations 2003).
Environmental
Economics
BOX 6
A recent study by Gutiérrez-Martín et al. (2020) introduced a market-based allocation mechanism called self-financed water banks proposed to operate in a monopsony-monopoly setting, which would use its market to recover water for environmental purposes and work with a balanced budget (expenditure on purchases will equal revenues from sales). The proposed water bank does not entail spending public money to acquire allocations to fix environmental problems related to water scarcity. From an administrative point of view, the institutional set-up of a water bank could also be appealing, as it off-sets institutional limitations such as policy debates, budget constraints, and approval procedures necessary to secure the public budget to recover water for the environment during drought episodes. Results show that a maximum of between 5.8 per cent and 10.4 per cent of total water availability can be recovered for the environment, depending on the severity of the drought, while total economic efficiency is increased, yielding a beneficial result for farmers and society. Indeed, such procedural hurdles could prevent the recovery from being carried out in time. Thus, this dual-purpose self-financed bank provides a pragmatic option to overcome these kinds of problems. Notwithstanding the bank’s promising features, Gutiérrez-Martín et al. note that the implementation of the proposed water bank in a real-life setting is challenging since it requires good-quality data inputs, especially regarding farmers’ water allocation demand and supply and society’s demand for environmental water. Thus, the idea of a self-financed bank is subject to further research.(Gutiérrez-Martín, Gómez-Limón and Montilla-López 2020)
What are self-financing water banks?
In the literature we reviewed, there is no consensus on whether administrative reallocation, market-based reallocation, or collective negotiation is preferable, while some also suggest a combination of two or all mechanisms. Overall, there was general agreement that water reallocation is very context-specific and decisions on the procedure should be on a case-to-case basis. As discussed earlier, efficiency, equity, and environmental justice are paramount for successful reallocation. Inter-sectoral links such as groundwater extraction and electricity supply should also to be considered, and interventions must be accompanied by water-use efficiency improvements.
5.2 Strategies for enhancing irrigation water-use productivityThe reallocation of water requires substantial water productivity improvements before transfers are even made. There is growing recognition of the criticality of water-use efficiency and productivity in agriculture in India. In fact, the latest Economic Survey (2018–19) stressed the need to shift focus from “land productivity” to “irrigation water productivity”, emphasising the need to improve water-use efficiency (Ministry of Agriculture & Farmers’ Welfare 2019). Currently, both the GoI and state governments allocate a significant portion of their annual budgets toward irrigation. The GoI’s support to irrigation is channelled through the Pradhan Mantri Krishi Sinchayee Yojana (PMKSY), an umbrella scheme for irrigation coverage, farm productivity, and better utilisation of resources in the country. PMKSY was formulated with the vision of extending the coverage of irrigation through Har Khet Ko Pani (Water to every farm) and improving water-use efficiency through Per Drop More Crop (PMKSY-PDMC) in a focussed manner with an end-to-end solution for source creation, distribution, management, field application, and extension activities. The scheme was approved with an outlay of INR 50,000 crore for a period of five years (2015-16 to 2019-20), with the ratio of centre and state share as 60:40 and 90:10 for the North-Eastern and Himalayan states (Ministry of Agriculture & Farmers’ Welfare 2017).
Some technical, financial, and policy strategies for enhancing irrigation water productivity are discussed below.
5.2.1 Technical strategiesMicro-irrigation
Micro-irrigation (MI) is one of the integral components of the PMKSY, focussed on maximising water-use efficiency at the field level and ensuring “Per Drop More Crop”. To provide a boost to MI, Union Budget 2017–18 also announced the setting up of a dedicated Micro Irrigation Fund (MIF) to be instituted within the National Bank for Agriculture and Rural Development (NABARD), with an initial corpus of INR 5,000 crore to help states to mobilise additional resources to expand the coverage of MI. The scheme also focuses on states in the Indo-Gangetic plain and the Eastern and North-Eastern regions, which have low coverage of MI. Farmers in states with high MI coverage are offered an additional (top-up) subsidy by these states, in addition to the subsidy available under the scheme (Ministry of Agriculture & Farmers’ Welfare 2018). However, it is important to note that since MI requires pressure for water delivery through delivery lines, it requires pumps and, therefore, energy, regardless of whether the source of water is surface or groundwater. Widespread power outages and unscheduled interruptions across rural and urban India hinder the efficiency of these systems (Harsha 2017).
Water reallocation is very context-specific and decisions on the procedure should be on a case-to-case basis
41Enabling factors for successful water reallocation and strategies for enhancing irrigation water productivity
Reallocating Water for India’s Growth: Sectoral Withdrawals, Water-efficient Agriculture, and Institutional Mechanisms
Precision agriculture
Precision agriculture is another technique used to improve water-use efficiency, which relies on information technology to integrate all farming procedures, from analysing soil moisture, weather forecasting, and checking seed quality, to predicting the optimal time of harvesting (Soma et al. 2019). While the adoption of precision agriculture is expected to lead to efficient water use, issues such as high cost and lack of technical expertise, knowledge and technology hinders wide-spread adoption (Mungarwal and Mehta 2019).
5.2.2 Financial strategiesPricing of water
Another crucial step in improving water-use efficiency and rewarding conservation is optimising the pricing of water (Central Water Commission 2017; Shen and Reddy 2016). Under-pricing water can have detrimental effects on the availability of resources for the management of irrigation systems (Narayanamoorthy 2018). Irrigation water pricing in India is combined and collected along with land tax or revenue. The difference in land taxes between dry and irrigated areas is the irrigation water charge. The 2012 National Water Policy directs all state governments to establish a water tariff system and fix criteria for water charges, keeping in mind that these charges should reflect the full cost of administration and O&M of the projects while taking into account cross-subsidies (Government of India 2012). But since water is a state subject, there is no uniform policy or set of principles for determining the price of water from canal systems. In spite of recommendations to revise tariffs every five years, a majority of states in India still retain their pre-2005 tariffs, while also continuing to charge on a non-volumetric method. A study by Bell et al. in 2016 proved that increased water-use fees were shown to raise overall agricultural production as well as improve the distribution of wealth among farms across systems with a range of irrigation structural characteristics (Bell, Ward and Shah 2016). Consequently, system maintenance improves the conveyance of water resources further down watercourses. However, to justify higher prices, increasing the reliability of irrigation is central, which may require the investment of funds.
Moreover, it was seen that where farmers pay per cubic meter of water, they use it more efficiently; in Spain, for example, groundwater irrigators apply less water than surface water irrigators and achieve higher returns for their output per unit of water applied (Garrido, Martınez-Santos and Llamas 2005; Shah 2014). In West Bengal, research found that electricity metering resulted in a significant reduction in hours pumped during the summer season and that the resulting 33 per cent decrease in water use did not affect the crop yield of summer paddy or cropping patterns (Meenakshi et al. 2013). Similarly, another study among banana farmers in Ecuador showed that the existing fixed costs policy for water did not reduce water consumption. In contrast, water blocks and volumetric pricing impacted the behaviour of farmers towards reduced consumption (Franco-Crespo and Viñas 2017). Some studies also explore the impact of quantitative control (through water quotas) for areas with water scarcity in order to alleviate water shortage. One study found that compared with price control, quantitative control measures can save an equal volume of water with a lower cost, making it a more cost-effective way of reducing water use in agriculture. They also found that the amount of compensation required to cover the total income loss is lesser for the quantitative control than for the price control measure. As the transferred water volume is considered a quantitative control measure, the farmers’ income losses, including their opportunity cost,
It was seen that where farmers pay per cubic meter of water, they use it more efficiently
42
Another crucial step in improving water-use efficiency and rewarding conservation is optimising the pricing of water
can be compensated for by the industries that receive the transferred water (Shi et al. 2014). Another method, which charges irrigators on the basis of time of delivery (pay per hour) especially in areas without sophisticated monitoring, is also interesting to note. However, this is only effective when water flow is reasonably constant (Tsur et al. 2004).
5.2.3 Policy reforms and strategiesIt is important to note that technical and financial strategies alone cannot improve irrigation performance. A few case studies related to irrigation reforms are mentioned below.In Maharashtra, before 2000, the irrigation sector faced many serious problems, such as low utilisation of created potential, low water-use efficiency, and slow growth in the coverage area, thereby threatening the sustainability of the irrigation sector. The policymakers were of the opinion that increasing water rates might help solve the problems that the irrigation sector was seeing.
Unfortunately, a singular reform of increasing water rates did not work out. According to data from the Water Resources Department, Government of Maharashtra, cost recovery increased from 30 per cent in 1998–99 to over 119 per cent in 2004–05, but it declined to 27 per cent in 2013–14 according to Central Water Commission (CWC) data.
Thereafter, since 2000-01, the state initiated a series of reforms to improve overall irrigation services. The Water Regulatory Authority was established in 2005 to bring transparency to the functioning of the irrigation sector. Water auditing was mandated to improve overall irrigation efficiency in the state and to reduce unaccounted-for water. Water pricing was revised on a regular basis to reflect true cost, increase revenue, and fully recover O&M costs. Various measures were initiated to improve the overall supervision of the irrigation system and to increase the rate of recovery of water charges since 2001. A special drive was also undertaken to recover arrears from non-irrigation users every year. Efforts were made to minimise O&M costs. The Government of Maharashtra also made a policy decision to hand over the management of irrigation systems to WUAs in July 2001. The Maharashtra Management of Irrigation System by Farmers Act was also enacted in 2005 to provide legal status to participatory irrigation management.
Initiation of water auditing in the state substantially increased water-use efficiency in canal irrigation, from 96 ha/MCM12 in 2000–01 to 118 ha/MCM in 2005–06. Since water use had to be accounted for in each system under water auditing, there was tremendous pressure on system managers to report the area under irrigation precisely, which was not done earlier. The case of Maharashtra’s irrigation reforms clearly proved that all-round reforms are important to bring about a change in the irrigation sector (Narayanamoorthy 2018).
Similarly, in Madhya Pradesh, the gap between irrigation potential created and utilised was bridged between 2009–10 and 2015–16. This was possible through an emphasis on pre-irrigation maintenance, rehabilitation of old irrigation assets, improved management, target setting, continuous measurement and monitoring of system performance through conventional, as well as web-based tools, along with accelerated completion of on-going projects. The reforms also focussed on adequate and timely budget flows for carrying out maintenance and repair work. The annual maintenance expenditure gradually increased
43Facilitating water reallocation: enabling factors for successful water reallocation and strategies for enhancing irrigation water productivity
Water auditing was mandated to improve overall irrigation efficiency in the state and to reduce unaccounted-for water
12. MCM – million cubic metres

Reallocating Water for India’s Growth: Sectoral Withdrawals, Water-efficient Agriculture, and Institutional Mechanisms44
from INR 112/ha in 2009–10 to INR 820/ha in 2015–16, indicating a consistent focus on maintenance (Julaniya et al. 2016).
In 2018, the Punjab State Power Corporation Limited (PSPCL) launched a pilot scheme called Paani Bachao Paisa Kamao (earn money by saving water) in the districts of Jalandhar, Fatehgarh Sahib, and Hoshiarpur, to check the depletion of groundwater. The scheme was designed to be voluntary, at no cost to farmers. Apart from the free installation of electricity metres, the incentives the scheme offered included a direct bank transfer (DBT)-based pay-out of INR 4 per unit of electricity saved, which is calculated on the basis of a pre-decided quota for each user. The scheme also offered no extra charges for crossing the electricity unit limit.

In this section, we discuss some issues that are pertinent to India’s irrigation sector, irrigation water-use productivity, and reallocation, and present some perspectives from the
literature on them. We attempt to understand what factors drive inefficient use and which policy and financial reforms can tackle this. We also focus on technology and communication strategies that could potentially help future irrigation reforms. In addition, we explore the connections between climate change and agricultural water management, and the need to prioritise environmental water needs.
6.1 What drives inefficient and unproductive water-use behaviour?
There are several reasons for the increasing misuse or overuse of water resources in Indian agriculture. Power subsidies for agriculture and unregulated use of groundwater have resulted in the over-extraction of groundwater. Electricity supply for irrigation is rarely metered and has a flat tariff, which has resulted in its overuse. The absence of marginal pricing for supplied water has created perverse incentives for farmers to overuse it. Briscoe and Malik (2007) also note that the persistence of the “incentive gap” or the “efficiency gap” – the gap between the real economic value of water and the value accorded by users to
45
6. Discussion: key issues related to water management and productivity
Image: iStock
Electricity supply for irrigation is rarely metered and has a flat tariff, which has resulted in its overuse
Reallocating Water for India’s Growth: Sectoral Withdrawals, Water-efficient Agriculture, and Institutional Mechanisms46
water – is a major threat to efficient water use in irrigated agriculture. The incentive gap indicates not just the lack of economic pricing, but also the absence of the institutional settings needed for volumetric allocation of water, along with the proper working of the organisations responsible for their enforcement and cost recovery (Briscoe and Malik 2007). Even though minimum support prices (MSPs) have been announced for 23 crops, only wheat and rice have effective price support in place, creating highly skewed incentive structures in favour of wheat and paddy – both water-intensive crops that are heavily dependent on groundwater for their growth.13
The effect of such skewed policy messages is apparent in the state of Punjab, where, to produce 1 kg of rice, the average farmer uses more than double the amount of water used by a paddy farmer from West Bengal (Commission for Agricultural Costs and Prices 2015). Punjab receives only 40 per cent of the monsoon rainfall that West Bengal, Bihar, or Odisha receive, and just over 25 per cent of Assam’s seasonal average. Yet, its farmers grow paddy, mainly by drawing groundwater during the summer months, when evaporation rates are high. (Fishman, Devineni and Raman 2015; Badiani, Jessoe and Plant 2012; Kim et al. 2018; High Level Committee on Reorienting the Role and Restructuring of Food Corporation of India 2015; Central Water Commission 2014).
A 2014 study by the Asian Development Bank highlighted some key factors that influence the water-use efficiency of major and medium irrigation schemes, especially concerning conveyance (Burton and Dhingra 2014).
1. Irrigation departments focus on building new projects instead of maintaining existing ones.
2. Schemes are designed for protective, rather than productive irrigation, resulting in schemes where water scarcity is built in from the outset. While this may be possible in theory, by imposing deficit irrigation on farmers, it aggravates the competition for water between farmers.
3. Political interference affects water allocation decision-making.
4. No water accounting is carried out.
5. There is inadequate measurement of water delivery, and little or no assessment of scheme performance (except for Maharashtra with its benchmarking programme).
6. Poor communication and liaison with the customer – the farmers.
7. Head-end farmers cultivate water-intensive crops, thus depriving tail-end farmers of water.
8. Supplies do not match the actual cropping pattern and lack scientific scheduling.
9. Irrigation and canal operation schedules fail to allow for rainfall.
Overall, the drivers of inefficient and unproductive water use are varied and complex. Irrigation reforms for judicious water use would require an analysis of existing policy conditions in particular areas. In the next sections, we dive into some issues concerning political economy and look at the environment of irrigation reforms and finance.
13. A price support may be either a subsidy or a price control with the intended effect of keeping the market price of a good higher than the competitive equilibrium level. An effective price support policy safeguards the interests of farmers.
Irrigation departments focus on building new projects instead of maintaining existing ones
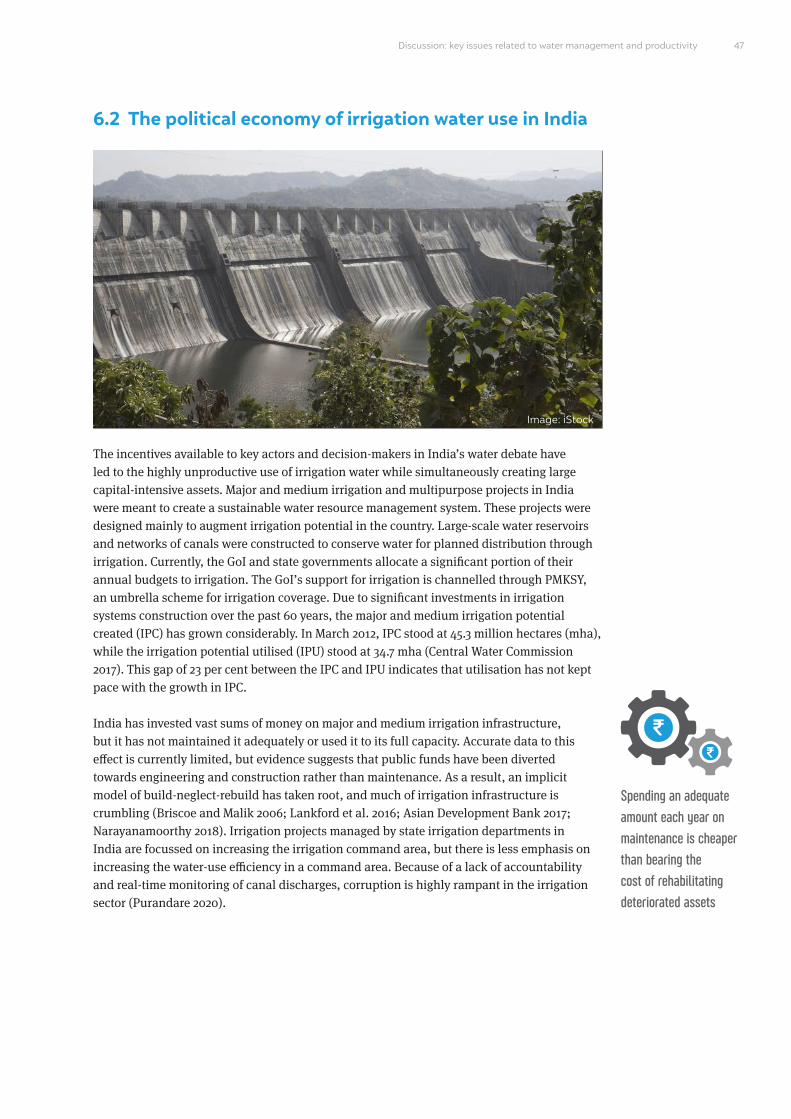
47Discussion: key issues related to water management and productivity
6.2 The political economy of irrigation water use in India
The incentives available to key actors and decision-makers in India’s water debate have led to the highly unproductive use of irrigation water while simultaneously creating large capital-intensive assets. Major and medium irrigation and multipurpose projects in India were meant to create a sustainable water resource management system. These projects were designed mainly to augment irrigation potential in the country. Large-scale water reservoirs and networks of canals were constructed to conserve water for planned distribution through irrigation. Currently, the GoI and state governments allocate a significant portion of their annual budgets to irrigation. The GoI’s support for irrigation is channelled through PMKSY, an umbrella scheme for irrigation coverage. Due to significant investments in irrigation systems construction over the past 60 years, the major and medium irrigation potential created (IPC) has grown considerably. In March 2012, IPC stood at 45.3 million hectares (mha), while the irrigation potential utilised (IPU) stood at 34.7 mha (Central Water Commission 2017). This gap of 23 per cent between the IPC and IPU indicates that utilisation has not kept pace with the growth in IPC.
India has invested vast sums of money on major and medium irrigation infrastructure, but it has not maintained it adequately or used it to its full capacity. Accurate data to this effect is currently limited, but evidence suggests that public funds have been diverted towards engineering and construction rather than maintenance. As a result, an implicit model of build-neglect-rebuild has taken root, and much of irrigation infrastructure is crumbling (Briscoe and Malik 2006; Lankford et al. 2016; Asian Development Bank 2017; Narayanamoorthy 2018). Irrigation projects managed by state irrigation departments in India are focussed on increasing the irrigation command area, but there is less emphasis on increasing the water-use efficiency in a command area. Because of a lack of accountability and real-time monitoring of canal discharges, corruption is highly rampant in the irrigation sector (Purandare 2020).
Spending an adequate amount each year on maintenance is cheaper than bearing the cost of rehabilitating deteriorated assets
Image: iStock
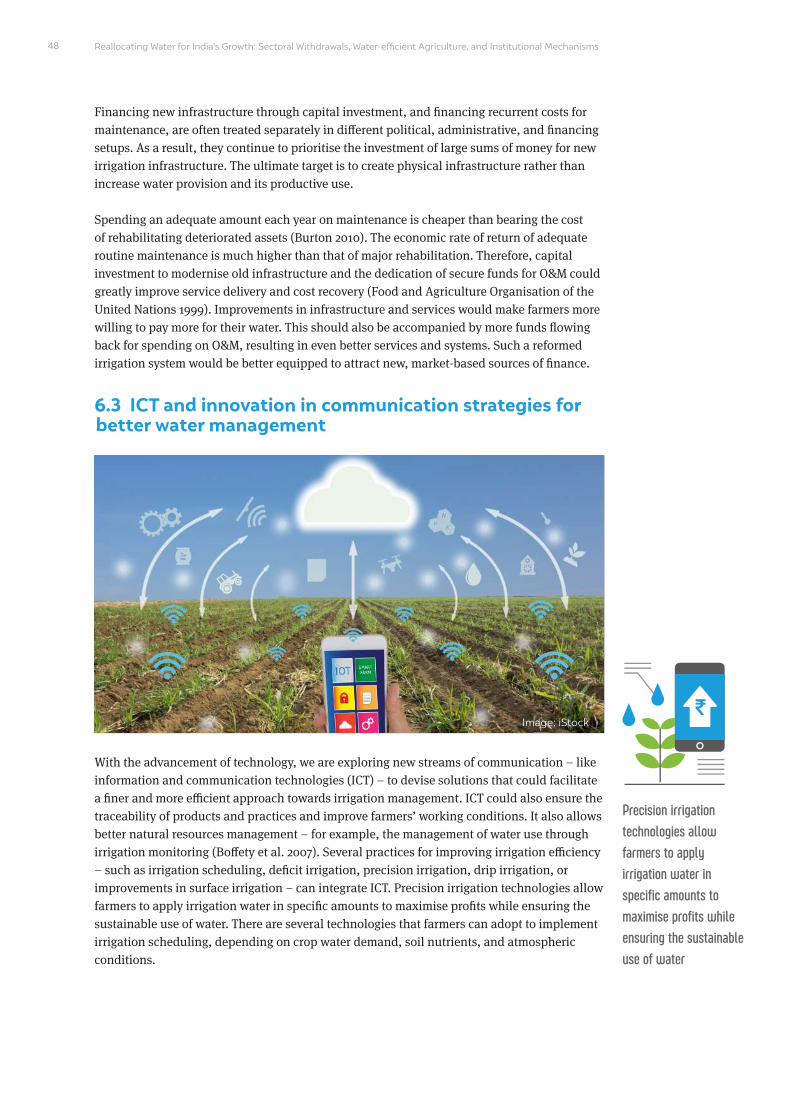
Reallocating Water for India’s Growth: Sectoral Withdrawals, Water-efficient Agriculture, and Institutional Mechanisms48
Financing new infrastructure through capital investment, and financing recurrent costs for maintenance, are often treated separately in different political, administrative, and financing setups. As a result, they continue to prioritise the investment of large sums of money for new irrigation infrastructure. The ultimate target is to create physical infrastructure rather than increase water provision and its productive use.
Spending an adequate amount each year on maintenance is cheaper than bearing the cost of rehabilitating deteriorated assets (Burton 2010). The economic rate of return of adequate routine maintenance is much higher than that of major rehabilitation. Therefore, capital investment to modernise old infrastructure and the dedication of secure funds for O&M could greatly improve service delivery and cost recovery (Food and Agriculture Organisation of the United Nations 1999). Improvements in infrastructure and services would make farmers more willing to pay more for their water. This should also be accompanied by more funds flowing back for spending on O&M, resulting in even better services and systems. Such a reformed irrigation system would be better equipped to attract new, market-based sources of finance.
6.3 ICT and innovation in communication strategies for better water management
With the advancement of technology, we are exploring new streams of communication – like information and communication technologies (ICT) – to devise solutions that could facilitate a finer and more efficient approach towards irrigation management. ICT could also ensure the traceability of products and practices and improve farmers’ working conditions. It also allows better natural resources management – for example, the management of water use through irrigation monitoring (Boffety et al. 2007). Several practices for improving irrigation efficiency – such as irrigation scheduling, deficit irrigation, precision irrigation, drip irrigation, or improvements in surface irrigation – can integrate ICT. Precision irrigation technologies allow farmers to apply irrigation water in specific amounts to maximise profits while ensuring the sustainable use of water. There are several technologies that farmers can adopt to implement irrigation scheduling, depending on crop water demand, soil nutrients, and atmospheric conditions.
Precision irrigation technologies allow farmers to apply irrigation water in specific amounts to maximise profits while ensuring the sustainable use of water
Image: iStock
Remotely sensed data obtained through drones with thermal sensors or satellite imagery, in conjunction with ground measurements, can lead us to an improved understanding of crop and water dynamics in a region
49Discussion: key issues related to water management and productivity
Both remote-sensing-based and wireless sensor network-based technologies (WSN) offer popular solutions for irrigation activities. Remote-sensing based irrigation scheduling uses weather information, soil moisture, evapotranspiration, and other ancillary inputs to model crop development and irrigation demand. Mexico’s national water agency, CONAGUA, utilises this remote-sensing information to understand the dynamics of water-use efficiencies and crop yields in agricultural fields. This enables them to monitor water consumption and crop sowing patterns in accordance with water allocations and sowing permits issued to farmers (Serrat Capdevila and Herrmann 2019). In a recent study, researchers at Consultative Group for International Agricultural Research (CGIAR) compared a satellite-based soil moisture index with a standardised precipitation index obtained from ground observations in the states of Karnataka and Maharashtra. They found that during drought, the soil moisture index better represented agricultural drought than the precipitation index, as the former correlated better with reduced crop yields in irrigated farms (Modanesi et al. 2020).
WSN-based technologies are deployed for on-ground monitoring of agro-hydro-meteorological variables, such as soil moisture, soil nutrients, weather, evaporation, and water level. Soil moisture data helps maintain the soil water between limits; a threshold value (drier value) indicates when to start an irrigation event, and an upper limit (wetter value) indicates the end of an irrigation event (Gallardo 2003). By measuring soil water content down the soil profile at different locations, we can improve water-use efficiency. It may not be economically viable to do this manually, but it is possible to do it cheaply if we use soil moisture sensors in combination with WSN technology (Won-Ho Nam 2017).
Remotely sensed data obtained through drones with thermal sensors or satellite imagery, in conjunction with ground measurements, can lead us to an improved understanding of crop and water dynamics in a region. Moreover, communication strategies like irrigation advisories can provide crop water demand and rainfall predictions, customised to the needs of a farmer or irrigation management agency to maximise water-use efficiencies (Vuolo et al. 2015). In Uganda, a market-led, user-owned, ICT4Ag14 -enabled information service (MUIIS) project provided timely, accurate, and actionable weather reports and agronomic tips to 3,50,000 smallholder farmers cultivating maize, soybean, and sesame from 2015 to 2018 (ASIGMA 2019). In India, the Provision of Advisory for Necessary Irrigation (PANI) provides irrigation advisories to smallholder farmers in rural Kanpur by downscaling coarser remote-sensing-data-based models using field-specific ground data. Data was transmitted through a low-power wide-area network (LPWAN) gateway to a central database, where it was assimilated with remote-sensing data. This whole sensor network, which is powered by batteries and solar power, is completely off the grid.
In India, the Central Water Commission (CWC) recommends irrigation scheduling to improve water-use efficiency in the irrigation sector (Central Water Commission 2014). Though they recommend scientifically robust measures – like scheduling irrigation based on soil–water–plant interactions; adopting efficient water-scheduling policies and operating rules; and modifying irrigation schedules based on medium-range weather forecasts (MRWF) through management information systems (MIS) and decision support systems (DSS) – they are yet to implement these measures at the ground level. The India Meteorological Department (IMD) already provides a free SMS service called NowCast to provide localised alerts on extreme weather conditions to farmers registered under the M-Kisan portal of the Ministry
14. Use of ICTs in agricultural programmes is called ICT4Ag.
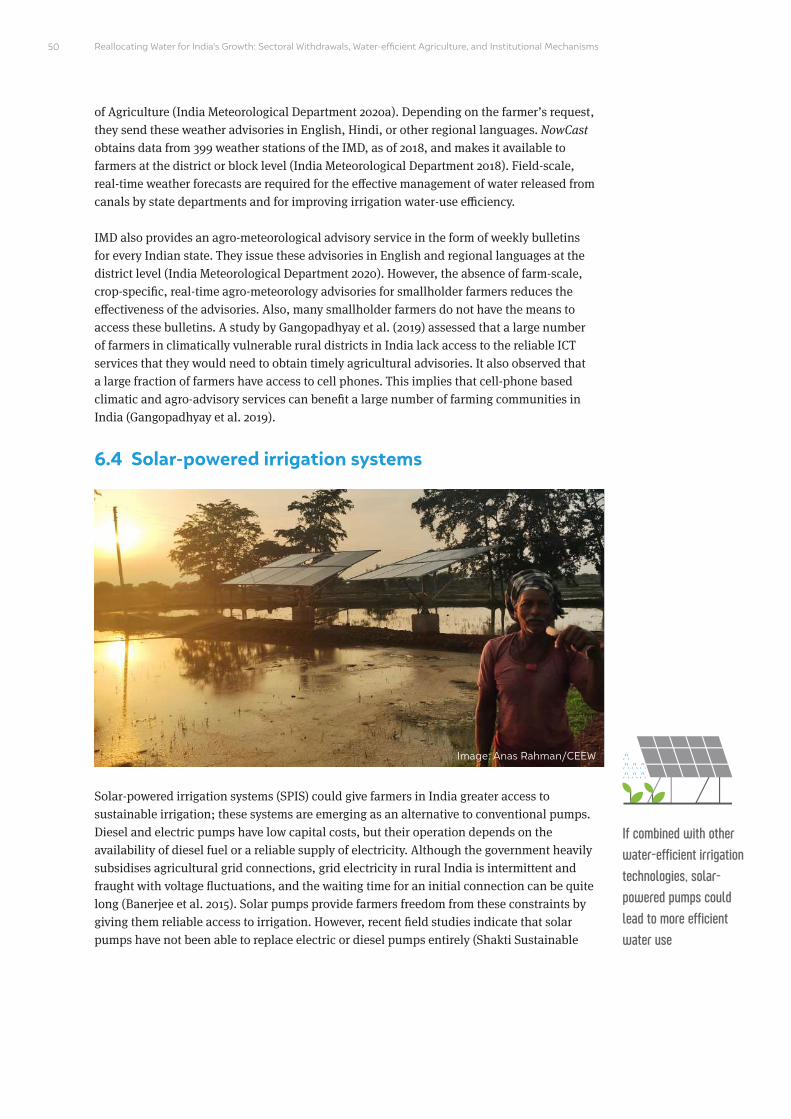
Reallocating Water for India’s Growth: Sectoral Withdrawals, Water-efficient Agriculture, and Institutional Mechanisms50
of Agriculture (India Meteorological Department 2020a). Depending on the farmer’s request, they send these weather advisories in English, Hindi, or other regional languages. NowCast obtains data from 399 weather stations of the IMD, as of 2018, and makes it available to farmers at the district or block level (India Meteorological Department 2018). Field-scale, real-time weather forecasts are required for the effective management of water released from canals by state departments and for improving irrigation water-use efficiency.
IMD also provides an agro-meteorological advisory service in the form of weekly bulletins for every Indian state. They issue these advisories in English and regional languages at the district level (India Meteorological Department 2020). However, the absence of farm-scale, crop-specific, real-time agro-meteorology advisories for smallholder farmers reduces the effectiveness of the advisories. Also, many smallholder farmers do not have the means to access these bulletins. A study by Gangopadhyay et al. (2019) assessed that a large number of farmers in climatically vulnerable rural districts in India lack access to the reliable ICT services that they would need to obtain timely agricultural advisories. It also observed that a large fraction of farmers have access to cell phones. This implies that cell-phone based climatic and agro-advisory services can benefit a large number of farming communities in India (Gangopadhyay et al. 2019).
6.4 Solar-powered irrigation systems
Solar-powered irrigation systems (SPIS) could give farmers in India greater access to sustainable irrigation; these systems are emerging as an alternative to conventional pumps. Diesel and electric pumps have low capital costs, but their operation depends on the availability of diesel fuel or a reliable supply of electricity. Although the government heavily subsidises agricultural grid connections, grid electricity in rural India is intermittent and fraught with voltage fluctuations, and the waiting time for an initial connection can be quite long (Banerjee et al. 2015). Solar pumps provide farmers freedom from these constraints by giving them reliable access to irrigation. However, recent field studies indicate that solar pumps have not been able to replace electric or diesel pumps entirely (Shakti Sustainable
If combined with other water-efficient irrigation technologies, solar-powered pumps could lead to more efficient water use
Image: Anas Rahman/CEEW
Energy Foundation 2018). For a few days in a year, farmers complement other pumps with solar pumps. If we look at the economics, the capital costs of solar pumps are high, but on a lifetime cost basis, solar pumps may offer savings for farmers due to their low operating expenses.
The government launched the Pradhan Mantri Kisan Urja Suraksha evam Utthaan Mahabhiyan (PM-KUSUM) scheme in March 2019 to support the installation of off-grid solar pumps in rural areas. The scheme consists of three components – Component-A: setting up 10,000 MW of decentralised, grid-connected solar or other renewable energy power plant on barren/fallow land; Component-B: installing 17.50 lakh standalone solar agriculture pumps; and Component-C: solarising 10 lakh grid-connected agriculture pumps. With all three components combined, the scheme aims to add a solar capacity of 25,750 MW by 2022. For FY 2019–20, the government set a target of 1,000 MW under Component-A; 1.75 lakh standalone solar pumps under Component-B; and solarisation of one lakh grid-connected agricultural pumps under Component-C. It has installed around 74,846 solar-powered pumps in the country since FY 2018–19 (Ministry of New and Renewable Energy 2019).
Scaling up SPIS can provide multiple benefits. It has the potential to increase agricultural productivity and income due to improved access to water. If combined with drip irrigation or other water-efficient irrigation technologies, it could lead to even more efficient water use. It could also lead to income diversification, considering its multiple uses of energy (for example, feed in to the grid, lighting, cooling) and water (for example, livestock watering, domestic uses). Reducing dependence on diesel fuel and electricity provides farmers relief from volatile fuel prices and reduces the pressure on power distribution companies to supply heavily subsidised electricity (Hartung and Pluschke 2018). One of the major limitations of SPIS systems is the risk of groundwater over-abstraction, which could lead to the depletion and degradation of groundwater resources. Given that the marginal cost of water is zero after installation, the incentive to save water is absent. We can solve this by developing smart subsidy schemes whereby farmers can sell electricity to the grid (Colback 2015). Moreover, it is crucial that we adopt a suitable institutional framework to manage groundwater abstraction in order to offset some of the risks related to groundwater overexploitation. Additionally, while we can support solar pump irrigation systems deployment at scale, we should also adopt adequate water conservation measures, particularly in areas with constrained groundwater resources. This could entail linking financial support and incentives for solar pumps to the adoption of efficient irrigation practices and groundwater management (Agarwal and Jain 2018).
CEEW’s analysis on solar pumps recommends that individually owned solar pump deployment should focus on farmers currently deprived of grid connections. It is also crucial to consider the pattern of borewell ownership while we frame policies to support solar pumps, otherwise, this policy support could remain significantly skewed towards medium and large farmers. In order to appraise SPIS loan applications, financiers need to estimate the additional income that will accrue to the farmer from the proposed investment. But this process is challenging due to the uncertainties related to farming practices, water availability, and crop prices. Financing SPIS on a large scale would require measures that assist the investment appraisal process. These could entail the development of investment evaluation tools along with databases to provide updated information on parameters such as
While solar panels can provide reliable energy access, sustainable access to and use of water resources is a precursor to expanding irrigation access
51Discussion: key issues related to water management and productivity
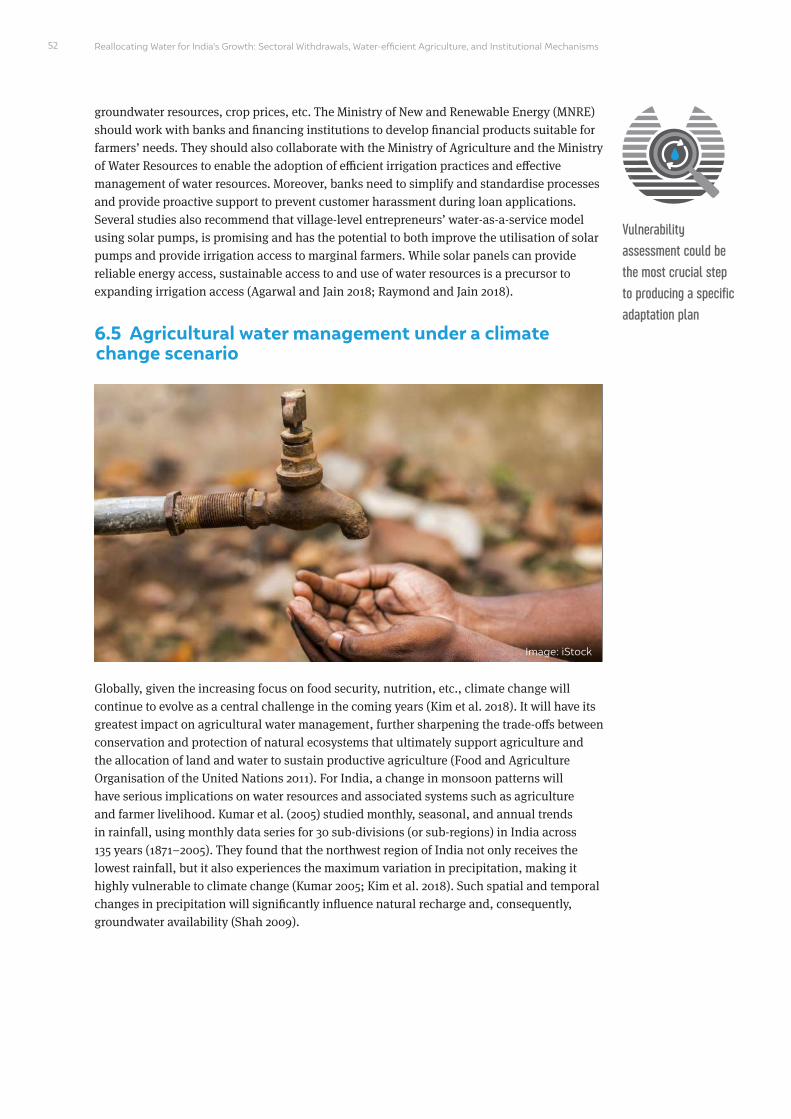
Reallocating Water for India’s Growth: Sectoral Withdrawals, Water-efficient Agriculture, and Institutional Mechanisms52
groundwater resources, crop prices, etc. The Ministry of New and Renewable Energy (MNRE) should work with banks and financing institutions to develop financial products suitable for farmers’ needs. They should also collaborate with the Ministry of Agriculture and the Ministry of Water Resources to enable the adoption of efficient irrigation practices and effective management of water resources. Moreover, banks need to simplify and standardise processes and provide proactive support to prevent customer harassment during loan applications. Several studies also recommend that village-level entrepreneurs’ water-as-a-service model using solar pumps, is promising and has the potential to both improve the utilisation of solar pumps and provide irrigation access to marginal farmers. While solar panels can provide reliable energy access, sustainable access to and use of water resources is a precursor to expanding irrigation access (Agarwal and Jain 2018; Raymond and Jain 2018).
6.5 Agricultural water management under a climate change scenario
Globally, given the increasing focus on food security, nutrition, etc., climate change will continue to evolve as a central challenge in the coming years (Kim et al. 2018). It will have its greatest impact on agricultural water management, further sharpening the trade-offs between conservation and protection of natural ecosystems that ultimately support agriculture and the allocation of land and water to sustain productive agriculture (Food and Agriculture Organisation of the United Nations 2011). For India, a change in monsoon patterns will have serious implications on water resources and associated systems such as agriculture and farmer livelihood. Kumar et al. (2005) studied monthly, seasonal, and annual trends in rainfall, using monthly data series for 30 sub-divisions (or sub-regions) in India across 135 years (1871–2005). They found that the northwest region of India not only receives the lowest rainfall, but it also experiences the maximum variation in precipitation, making it highly vulnerable to climate change (Kumar 2005; Kim et al. 2018). Such spatial and temporal changes in precipitation will significantly influence natural recharge and, consequently, groundwater availability (Shah 2009).
Vulnerability assessment could be the most crucial step to producing a specific adaptation plan
Image: iStock
53Discussion: key issues related to water management and productivity
In fact, at the local level, climate variability has significant impacts on crop area and crop production, especially in periods of drought or flood. However, since the 1970s, with increasing technical or market-related development in the irrigation sector, the impacts of climate variability were evened out to a great extent (Food and Agriculture Organisation of the United Nations 2011). Now, with growing uncertainty in climate events, researchers continue to study the interactions between agriculture and climate change.
The relationship between crop water-use efficiency and its response to climate change is one such area of ongoing research. Several studies show that climate change will increase crop water use. A China-based study of projections for the periods 2041–2070 and 2071–2099 showed that as a result of the study area becoming warmer and wetter, both reference and calculated crop evapotranspiration would increase by 4 per cent to 7 per cent (Zhou et al. 2017). A study in two areas of Tanzania projected that crop water requirements increased by 3.8 per cent in the 1920s and that it would increase by 7.1 per cent in the 2050s (Rotich and Mulungu 2017). Another Indian analysis of three crops – paddy, wheat, and berseem fodder – showed that with decreasing rainwater availability and increasing temperatures, a delay in sowing dates in future scenarios will cause an increase in crop water requirements (Kaushika, Arora and Hari Prasad 2019).
Researchers are also studying policies focussed on adaptation and mitigation. Vulnerability assessment could be the most crucial step to producing a specific adaptation plan. Sugam et al. (2016) recommend some essential policy reforms to make the agricultural system more resilient: revive traditional water bodies; include agroforestry options in watershed management; use wild varieties of crops that are resistant to extreme events; implement innovative and impactful communication strategies; form co-operatives at the village level to increase resilience; and study traditional cropping systems closely, as they have survived extreme events for years (Sugam, Choudhury, and Hartl 2016; Kim et al. 2018). Informed policy responses for adaptive strategies around climate change and agriculture require better modelling of impacts. Yet, climate change will have far-reaching effects on water management in agriculture, even if our adaptive capacity is relatively strong. Improving investments and our technical and socio-economic understanding of climate change-related adaptation and mitigation will be crucial in the coming years (Food and Agriculture Organisation of the United Nations 2011).
Detailed assessment of environmental flows and related implementation strategies at appropriate scales are imperative going ahead

Reallocating Water for India’s Growth: Sectoral Withdrawals, Water-efficient Agriculture, and Institutional Mechanisms
6.6 Prioritising reallocated water for environmental needs
Due to increasing population growth, the demand for water in the domestic, agricultural, and industrial sectors are increasing – but this comes at the expense of maintaining a minimum environmental demand. Environmental flows provide the means for integrated river flow management to meet the needs of people, agriculture, industry, energy, and ecosystems within the limits of available supply and under a changing climate. Environmental flows is a practical tool to manage allocation in the water–energy–food nexus (International Union for Conservation of Nature n.d.). It describes the quantity, timing, and quality of freshwater flows and the levels necessary to sustain aquatic ecosystems which, in turn, support human cultures, economies, sustainable livelihoods, and well-being. Iyer (2005) notes that “flows are needed for maintaining the river regime, making it possible for the river to purify itself, sustaining aquatic life and vegetation, recharging groundwater, supporting livelihoods, facilitating navigation, preserving estuarine conditions, preventing the incursion of salinity, and enabling the river to play its role in the cultural and spiritual lives of the people” (Iyer 2005).
Freshwater resources, for example, are over-exploited, and aquatic ecosystems are thereby degraded in many regions (Vörösmarty et al. 2010). Environmental flows, especially in recent decades, are emerging as a major instrument for sustaining and/or rehabilitating the ecosystem functions and services of rivers worldwide (Gopal 2016). Alternatively, modifications to ecosystems and water withdrawals can alter the flow regime and water quality, and thereby affect the delivery of ecosystem services to beneficiaries. In basins where there are competing water needs, trade-offs become apparent and may necessitate an adjustment to governance mechanisms that can trigger changes in markets (Freshwater Health Index 2017).
Securing environmental flows for the restoration of currently compromised river ecosystems would entail a substantial reduction in irrigated food production, which is the largest
Image: iStock
54
Environmental flows is a practical tool to manage allocation in the water–energy–food nexus
global freshwater user, accounting for more than 70 per cent of human water withdrawals (Siebert and Döll. 2010). The study of a catchment in California by Graham et al. finds that there are inherent trade-offs between environmental flows and agricultural water security, with the more restrictive environmental policies associated with the greatest impacts to water users (2013). Conflicts between environmental and human water needs were greatest in upper catchments, where flow protections caused the greatest reduction in water storage. Regardless of policy restrictions, the potential for conflict between environmental flow protections and water security was evident in dry years. The study concludes that strategies were particularly urgent for drought-year water management to ensure adequate environmental flows while equitably reducing human water allocations. Similarly, Kaushal et al. study management approaches like the promotion of irrigation water-use efficiency and institutional reforms for the restoration of environmental flows in a stretch of the Ganga and include various management options. While the institution of water efficiency improvements in economic use through technical advancements, with some of the “saved” water set aside for the environment, might be desirable for the Ganga, it would fail without the required social, technical, and institutional support (Kaushal et al. 2019). The reallocation of water saved from irrigation could be a beneficial strategic solution to maintain overall ecosystem services. However, detailed assessment of environmental flows and related implementation strategies at appropriate scales are imperative going ahead.
55Discussion: key issues related to water management and productivity
The reallocation of water saved from irrigation could be a beneficial strategic solution to maintain overall ecosystem services
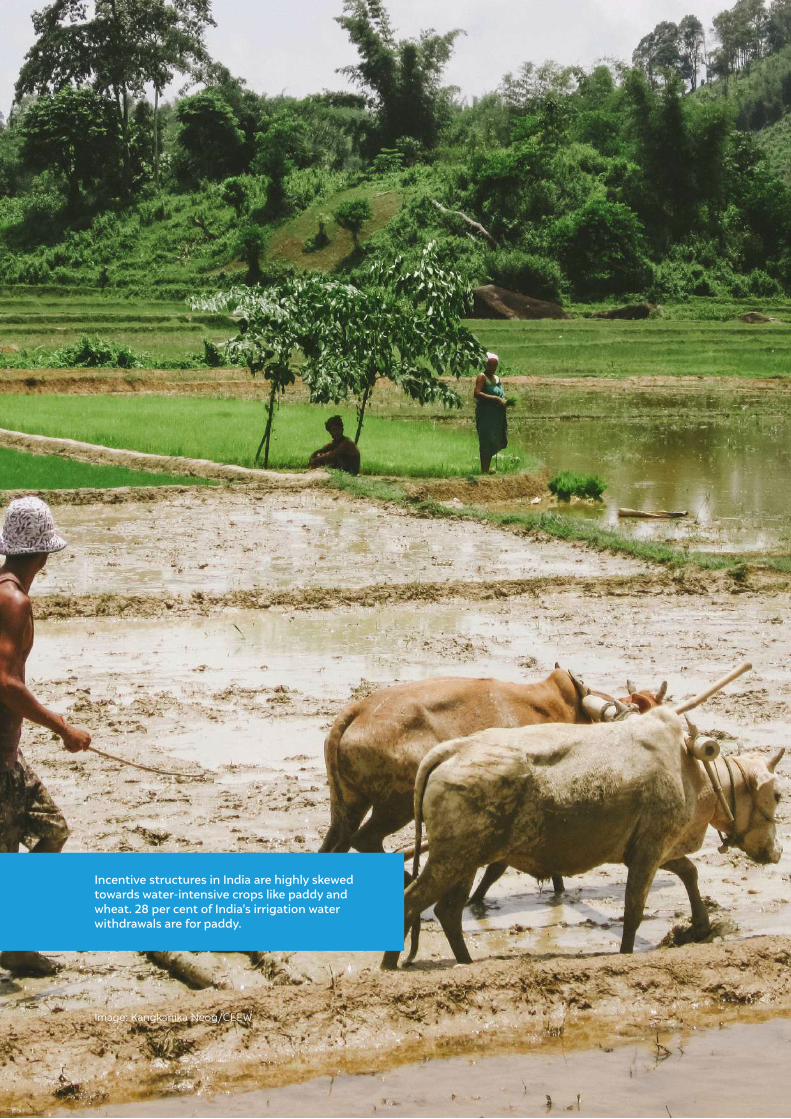
Reallocating Water for India’s Growth: Sectoral Withdrawals, Water-efficient Agriculture, and Institutional Mechanisms52
Image: Kangkanika Neog/CEEW
Incentive structures in India are highly skewed towards water-intensive crops like paddy and wheat. 28 per cent of India’s irrigation water withdrawals are for paddy.
Our study focuses on the key issue of estimating water productivity in agriculture and the potential for reallocating water to other sectors. Broadly speaking, we know and
accept that irrigation water productivity in India has significant scope for improvement. Our contribution is to empirically estimate this based on an extensive dataset and provide a sense of the magnitude of irrigation water-use inefficiency and the potential to reallocate water. As we have mentioned earlier, using data from three representative states, this study analyses farmer-level water use and crop production data to give a sense of the variation in average representative farmer behaviour for India and the potential ranges for water savings. We also estimate the cost of inaction, or how water becomes a constraint when achieving the goals of key policies related to manufacturing and the provision of water to all households in India. Along with the numbers, our study presents some critical insights for policymakers as well as areas for future research. We presented them here:
1. There is significant potential to enhance irrigation water productivity, even if an average farmer, driven by appropriate policy measures, adopts the practices undertaken by the most water-efficient farmer
Our study assesses information based on the Cost of Cultivation dataset and undertakes analyses comparing water withdrawal in practice across different farmers for a given crop and state. We find that in most cases, there is a significant difference between the most water-efficient farmer and the average farmer, even within the same region. This is an interesting finding, and points to the fact that even sharing best practices among the farmers of a given region, driven by appropriate policy measures, could have a significant effect on enhancing irrigation water productivity. This inference is strictly based on the assumption that for a given region and crop, the incentive structure and macro-economic environment under which farmers operate is fairly similar, and that some farmers are using water much more efficiently in combination with other inputs, and are therefore able to derive higher crop yields. The best—or theoretically most ideal – water-use efficiency comes from crop and site-specific crop models, which is even higher as compared to the best representative farmer in our dataset. To summarise, farmers operating in a given area have plenty to share and learn when it comes to enhancing irrigation water-use efficiency. The Cost of Cultivation dataset only gives information on the quantity of agricultural inputs along with their costs. It does not hold any underlying information on background variables like wealth, education, age, etc. Due to the absence of this information, we have not been able to draw any conclusion related to the underlying factors or practices of the best versus average farmers (where water-use efficiency is concerned).
7. Key insights and recommendations
Sharing best practices among farmers of a given region could significantly enhance irrigation water productivity
57
Reallocating Water for India’s Growth: Sectoral Withdrawals, Water-efficient Agriculture, and Institutional Mechanisms58
2. Pressure on India’s groundwater resources can be significantly reduced by enhancing irrigation water productivity
Currently, India irrigates only 25 per cent of its net irrigated area; major and medium canals make up its surface water (Ministry of Agriculture and Farmers’ Welfare 2018a). This dependence on groundwater is also reflected in our reservoir capacity of only 258 BCM, 70 per cent of which is concentrated in only six states. Owing to its decentralised nature and subsequent ease of accessibility, groundwater has the largest share in India’s irrigation system. In the last four decades, starting around the late 1970s, the relative contribution of canal irrigation has steadily declined over time, while the volume of groundwater extracted through tube-wells has significantly increased, thereby increasing the area under groundwater irrigation. Technological innovations have made pumping equipment cheap and affordable. Energy subsidies have made groundwater pumping a far more attractive option for farmers than the oft-unreliable public irrigation systems. Increased water withdrawal across sectors, as we have highlighted in our BAU scenario, will undoubtedly increase the pressure on India’s groundwater resources. We can reduce this pressure by either significantly augmenting surface water storage capacity or by enhancing irrigation water productivity. As surface water storage has been largely stagnant for the past few decades owing to several reasons, the only option left to us is to significantly enhance water productivity.
3. Enhancing irrigation water productivity can help achieve India’s ultimate irrigation potential
Currently, India’s irrigation potential is 93 million hectares, of which 80 million hectares is utilised. The ultimate irrigation potential for India is 139 million hectares, including major, medium, and minor schemes and groundwater exploitation. In the low water-savings scenario, where water is reallocated for agriculture, India can create an additional irrigation potential of 30 million hectares – thereby projecting India towards its ultimate irrigation potential if we decide to allocate the savings to irrigation expansion. Working towards high water-savings scenario will aid in achieving ultimate irrigation potential. This is the figure at the national level. For a deeper understanding, we need to understand the situation at the basin level and examine the potential to reallocate water within the basin. As we mentioned earlier, additional surface water provision could be very expensive and even unsuccessful.
4. Sectoral water reallocation is imperative to achieve the goals of Make in India and Har Ghar Jal
The Government of India has recently launched the Har Ghar Jal programme to ensure piped water supply to all rural households by 2024 under the Jal Jeevan Mission. Currently, only 30.8 per cent of rural households are connected to piped water supply within their premises. Therefore, the 2010 rural water supply was 7 BCM. To achieve Har Ghar Jal, the government would require an additional 18 BCM to meet its demand for 2030 and 45 BCM for 2050. Another major focus area for the Indian government has been the growth of the manufacturing sector. A 2017 study stated that businesses consider water shortages one of the main bottlenecks to industrial growth, especially in the context of the Make in India policy. Our analysis of an accelerated manufacturing growth scenario for India suggests that India will require an additional 41 BCM and 117 BCM in the years 2030 and 2050. Both these sectors, with their steady growth, are bound to create increasing competition at the local level. By reallocating local irrigation water from local reservoirs to villages and facilitating
Pressure on India’s groundwater resources can be significantly reduced by enhancing irrigation water productivity
59Key insights and recommendations
groundwater in blocks that are safe to exploit, India could potentially realise this goal not just for rural households, but also those in urban and peri-urban areas.
5. Designing institutional mechanisms that enhance irrigation water productivity and water reallocation should be a priority in order to address the potential water constraints on non-agricultural sectors
We can harness the potential of water productivity and water reallocation only through appropriately designed institutional mechanisms. We need these strong mechanisms to convert savings from efficiency improvements into reallocations away from agriculture. Any institution needs to follow some key principles such as equity and transparency. However, the larger point in the context of our study is that institutions need to understand the criticality of enhancing water productivity; they should be able to devise and implement measures for the achievement of this objective and ensure that water will be reallocated for alternative uses while adhering to these key principles. Existing institutions and policies have failed to deliver on the objective of enhanced water productivity. Appropriate and dedicated institutional mechanisms are necessary for us to address the goals of enhancing irrigation water productivity and sectorally reallocating water. Institutional mechanisms to achieve this can be administrative, market-based, or collectively negotiated, or a combination of two or more of these approaches. States should analyse the feasibility of developing formal markets for water by integrating experiences from the state of Maharashtra, which has already attempted to do so. A strong regulator that defines and governs sectoral water allocation and entitlements could prove instrumental in this endeavour.
6. Implications of water pricing policies, water markets, input price subsidies, and MSPs should be analysed to devise effective policies to facilitate irrigation water productivity and sectoral water reallocation
Along with appropriate institutions to devise water reallocation rules and manage the process, effective policies are also critical for this transition. There are various factors that impact groundwater-use efficiency. These include water pricing policies, input prices subsidies like fertiliser subsidies, various types of water markets, and a minimum support price regime; all of these factors are critical if we are to understand the way farmers make their cropping and irrigation decisions. We must study and understand the individual and combined impacts of these factors to reshape policies that could impact irrigation water productivity.
The key learning from this study is that there is potential for reallocating water from agriculture to other uses, provided there are supporting mechanisms for farmers to improve their irrigation efficiency. Furthermore, the feasibility of such procedures can only be studied comprehensively at the local scale. Overall, it is clear that India has the potential to realise its development goals while also using its water resources more judiciously. Reallocation of water could be the end goal of interventions in agriculture that aim to improve water productivity.
We need strong mechanisms to convert water savings from irrigation efficiency into reallocations to other sectors

Reallocating Water for India’s Growth: Sectoral Withdrawals, Water-efficient Agriculture, and Institutional Mechanisms60
Here are our key recommendations for achieving this ultimate goal:
● Choose a state where the competition for water resources poses a significant challenge, and which is ready to experiment with an alternative reallocation regime: Our study establishes that there is significant potential for enhancing water productivity in India. As a starting point, compare different states on some key criteria (per capita water availability, economic structure, water use across sectors, expected growth across sectors, etc.) to choose a suitable state, where the competition for water resources poses a significant challenge, and which is open to experimenting with a reallocation regime for sectoral water reallocation. For example, a water-abundant state might not be ideal for piloting the reallocation initiative. The chosen state could be the focus of a pilot experiment. Additionally, a state that already has advanced water auditing and budgeting mechanisms for agriculture could be a good option.
● Undertake behavioural experiments and economic analysis to better understand what policies and interventions can impact irrigation water productivity in the chosen state: While our study clearly gives some critical, high-level insights, it is imperative to undertake a detailed study that seeks to understand the impact of water pricing and other economic policies on water productivity. This could also take the form of behavioural experiments that provide evidence for more informed interventions that could act as pilot projects.
● Devise state-specific reallocation strategies based on existing institutions, enabling participatory stakeholder engagement: In the context of India, administrative reallocation, market-based reallocation, and collective negotiations are the only possible strategies that the government could take up. Each state, however, would prefer a mechanism that best fits its unique needs, though some dimensions of institutional mechanisms could be similar across states. For instance, market-based reallocation is possible in the state of Maharashtra, as it has developed water markets enabled by the MWRRA (Maharashtra Water Resources Regulatory Authority) Act 2005. We must devise a state-specific reallocation strategy based on analyses and deep engagements with the state government and stakeholder bodies.
● Implement the strategy on a pilot basis in a sub-basin and create a monitoring and evaluation plan to learn from the implementation process: The final task would be to create a working pilot at the state level. The initial steps should ideally focus on a crop that has a significant water footprint in the state. Create strong mechanisms right in the beginning to generate detailed information and learnings from the pilot initiative. A monitoring and evaluation plan is going to be critical to successfully scale up a robust water allocation regime to other parts of the country.
We must devise a state-specific reallocation strategy based on analyses and deep engagements with the state government and stakeholder bodies
61
2030 Water Resources Group. 2009. Charting Our Water Future: Economic Frameworks to Inform Decision-making. Washington DC: 2030 Water Resources Group. https://www.2030wrg.org/charting-our-water-future-economic-frameworks-inform-decision-making/.
Agarwal, Shalu, and Abhishek Jain. 2018. Financing Solar for Irrigation in India: Risks, Challenges and Solutions. New Delhi: Council on Energy Environment and Water.
Aguilar-Barajas, Ismael, and Dustin E. Garrick. 2019. “Water Reallocation, Benefit Sharing, and Compensation in Northeastern Mexico: A Retrospective Assessment of El Cuchillo Dam.” Water Security 8. https://doi.org/10.1016/j.wasec.2019.100036.
Aigner, D., C. Lovell, and P. Schmidt. 1977. “Formulation and Estimation of Stochastic Frontier Production Function Models.” Journal of Econometrics 6 (1): 21–37. https://doi.org/10.1016/0304-4076(77)90052-5.
Alberts, J H. 1998. Public Tubewell Irrigation in Uttar Pradesh, India: A Case Study of the Indo-Dutch Tubewell Project. Wageningen: International Institute for Land Reclamation and Improvement IILRI.
Alene, A. D., and M, Zeller. 2005. “Technology Adoption and Farmer Efficiency in Multiple Crops Production in Eastern Ethiopia: A Comparison of Parametric and Non-Parametric and Distance Functions.” Agricultural Economics Review 6: 5–17.
Amarasinghe, Upali A., Bharat R. Sharma, Noel Aloysius, Christopher Scott, Vladimir Smakhtin, and Charlotte de Fraiture. 2004. Spatial Variation in Water Supply and Demand across River Basins of India. IWMI Research Report 83. Colombo: International Water Management Institute. https://doi.org/10.22004/ag.econ.52966.
Amarasinghe, Upali A., Tushaar Shah, H. Turral, and B. K. Anand. 2007. India’s Water Future to 2025–2050: Business-as-Usual Scenario and Deviations. IWMI Research Report 123, Colombo, Sri Lanka: International Water Management Institute.
Anisfeld, Shimon C. 2010. Water Resources. Washington DC: Island Press.
Asian Development Bank. 2017. Financing Asian Irrigation: Choices Before Us. Manila: Asian Development Bank.
ASIGMA, Uganda. 2019. “The Case of MUIIS Uganda.” In Digitalisation for Agriculture, 24–44. Uganda: CTA.
Badiani, R., K. K. Jessoe, and S. Plant. 2012. “Development and the Environment: The Implications of Agricultural Electricity Subsidies in India.” Journal of Environmental Development 21(2): 244-262. https://doi.org/10.1177/1070496512442507.
Banerjee, Sudeshna Ghosh, Douglas French Barnes, Kristin Mayer, Hussain A. Samad, and Bipulendu Narayan Singh. 2015. Power for All: Electricity Access Challenge in India. Washington DC: World Bank Group.
Basin Planning Directorate. 2000. Assessment of Availability & requirement of Water for Diverse uses-2000. XI Plan Document; Report of the Standing Committee, New Delhi: Central Water Commission.
Bell, Andrew Reid, Patrick S. Ward, and M. Azeem Ali Shah. 2016. “Increased Water Charges Improve Efficiency and Equity in an Irrigation System.” Ecology and Society 21 (3)23. http://dx.doi.org/10.5751/ES-08642-210323.
Boffety, Daniel, Jean-Pierre Chanet, Géraldine André, and Frédéric Vigier. 2007. “Information and Communication Technologies for Irrigation Management.” 6 EFITA/WCCA Congress 2007. Glasgow.
References

Reallocating Water for India’s Growth: Sectoral Withdrawals, Water-efficient Agriculture, and Institutional Mechanisms
Briscoe, John. 1997. Water Resources Supply and Management Issues in Madras. World Bank Note, Revised Version, Washington D C: World Bank.
Briscoe, John, and R. P. S. Malik. 2006. India’s Water Economy: Bracing for a Turbulent Future. New Delhi: World Bank.
Briscoe, John, and R. P. S. Malik. 2007. Handbook of Water Resources in India — Development, Management and Strategies. New Delhi: Oxford University Press, India.
Burton, M. A. 2010. Irrigation Management: Principles and Practices. Wallingford, United Kingdom: Centre for Agriculture and Bioscience International (CABI).
Central Ground Water Board. 2011. Ground Water Year Book — India 2010–11. Faridabad: Central Ground Water Board.
Central Ground Water Board 2013. Dynamic Ground Water Resources of India. Accessed June 20, 2019. Faridabad: Central Ground Water Board.
Central Ground Water Board 2015. Report of the Ground Water Resource Estimation Committee. New Delhi: Ministry of Water Resources, River Development & Ganga Rejuvenation, Government of India.
Central Ground Water Board 2017. Dynamic Ground Water Resources of India. Accessed June 20, 2019. Faridabad: Central Ground Water Board.
Central Ground Water Board 2019. “Groundwater Year Books of States.” Ministry of Jal Shakti. Accessed May 28, 2019. http://cgwb.gov.in/GW-Year-Book-State.html.
Central Public Health and Environmental Engineering Organisation. 1999. Manual on Water Supply and Treatment. Manual, Ministry of Housing and Urban Affairs, Government of India, New Delhi: CPHEEO. Accessed May 20, 2020. http://cpheeo.gov.in/cms/manual-on-water-supply-and-treatment.php.
Central Statistical Organisation. 2008. Manual on Cost of Cultivation Surveys. Manual, New Delhi : Ministry of Statistics and Programme Implementation, Government of India. Accessed January 20, 2019. http://mospi.nic.in/sites/default/files/publication_reports/manual_cost_cultivation_surveys_23july08_0.pdf.
Central Water Commission. 2014. Guidelines for Improving Water Use Efficiency in Irrigation, Domestic and Industrial Sectors. Accessed June 20, 2019. New Delhi: Central Water Commission. http://mowr.gov.in/sites/default/files/Guidelines_for_improving_water_use_efficiency_1.pdf.
Central Water Commission 2017. Pricing of Water in the Public System in India. Accessed May 10, 2020. New Delhi: Central Water Commission. http://www.indiaenvironmentportal.org.in/files/file/Pricing%20of%20Water%20in%20Public%20System%20in%20India%202017.pdf.
Central Water Commission 2019. Live Storage Status of 120 Reservoirs in India. Weekly, Accessed June 20, 2019. New Delhi: Central Water Commission. http://www.cwc.gov.in/reservoir-storage.
Central Water Commission 2019a. Reassessment of water availability in basins using space inputs. New Delhi: Central Water Commission. Accessed May 5, 2020. http://old.cwc.gov.in/main/downloads/ReassessmentMainReport.pdf.
Central Water Commission 2020. “Updation of Live Storage Capacity.” New Delhi: Central Water Commission. Accessed May 5, 2020. http://cwc.gov.in/updation-live-storage-capacity.
Chapagain, A. K., and A. Y. Hoekstra. 2011. “The Blue, Green and Grey Water Footprint of Rice from Production and Consumption Perspectives.” Ecological Economics 20: 749–758.
https://doi.org/10.1016/j.ecolecon.2010.11.012.
Chaturvedi, Vaibhav, Poonam Nagar Koti, Rudresh Sugam, Kangkanika Neog, and Mohamad Hejazi. 2019. “Cooperation or rivalry? Impact of alternative development pathways on India’s long-term electricity generation and associated water demands.” Energy 192 (1). https://doi.org/10.1016/j.energy.2019.116708.
62
Chavas, J. P., R. G. Chambers, and R. D. Pope. 2010. “Production Economics and Farm Management: A Century of Contributions.” American Journal of Agricultural Economics 92 (2): 356–375. https://doi.org/10.1093/ajae/aaq004.
Colback, Richard. 2015. “The Case for Solar Water Pumps.” World Bank Blogs: The Water Blog, 23 August. Accessed April 15, 2020. https://blogs.worldbank.org/water/world-water-week-case-solar-water-pumps.
Commission for Agricultural Costs and Prices. 2015. Price Policy for Kharif Crops : The Marketing Season 2015-16. Department of Agriculture and Cooperation, Ministry of Agriculture, Government of India, New Delhi: Ministry of Agriculture, Government of India. Accessed May 05, 2020. https://cacp.dacnet.nic.in/ViewReports.aspx?Input=2&PageId=39&KeyId=547.
CTCN. 2019. “Water Reallocation.” UN Environment-DHI Centre on Water and Environment. Accessed June 20, 2019.https://www.ctcn.org/sites/www.ctcn.org/files/resources/water_reallocation.pdf.
Central Statistical Organisation. 2008. Manual on Cost of Cultivation Surveys. Manual, New Delhi : Ministry of Statistics and Programme Implementation, Government of India. Accessed January 20, 2019. http://mospi.nic.in/sites/default/files/publication_reports/manual_cost_cultivation_surveys_23july08_0.pdf.
Das, Subhajyoti. 2019. “Ground Water Development - Issues and Sustainable Solutions.” In Ground Water Development - Issues and Sustainable Solutions, by S P S Ray, 15-33. Singapore: Springer Nature Singapore Pte Ltd. 2019 .
Directorate of Economics and Statistics. 2008-14. Plot Level Summary Data Under the Cost of Cultivation Scheme. Department of Agriculture, Cooperation and Farmers Welfare, Ministry of Agriculture and Farmers Welfare, Governent of India, New Delhi: Ministry of Agriculture and Farmers Welfare, Governent of India. Accessed January 20, 2019. https://eands.dacnet.nic.in/Plot-Level-Summary-Data.htm.
Directorate of Economics and Statistics. 2007. Cost of Cultivation of Principal Crops in India. Departmenr of Agriculture, Cooperation and Farmers Welfare, Ministry of Agriculture, Government of India, New Delhi: Ministry of Agriculture, Government of India. Accessed January 20, 2019. https://eands.dacnet.nic.in/costofcultivation.pdf.
Ekanayake, S., and S. Jayasuriya. 1987. “Measurement of Firm-specific Technical Efficiency: A Comparison of Methods.” Journal of Agricultural Economics 38 (1): 115–122. https://doi.org /10.1111/j.1477-9552.1987.tb01032.x.
Elnour, Fadelmola M., and E. M. Elamin Abbas. 2014. Status of On-Farm Water Use Efficiency and Source of Inefficiency in the Sudan Gezira Scheme. NAF international working paper series. NAF International.
Fisher, Brooke. 2020. The Future of Farming. Accessed April 10, 2020. https://www.ce.washington.edu/news/article/2018-08-30/future-farming.
Fishman, Ram, Naresh Devineni, and Swaminathan Raman. 2015. “Can Improved Agricultural Water Use Efficiency Save India’s Groundwater?” Environmental Research Letters 10 (8). https://doi.org/10.1088/1748-9326/10/8/084022
Food and Agriculture Organisation of the United Nations. 1999. Realizing the Value of Irrigation System Maintenance. IPTRID Secretariat, Food and Agriculture Organisation of the United Nations. Accessed May 05, 2020. http://www.fao.org/3/a-x2089e.pdf.
Food and Agriculture Organisation of the United Nations 2011. Climate Change, Water and Food Security. FAO Water Reports, Rome: Food and Agriculture Organisation of the United Nations. Accessed April 10, 2020. http://www.fao.org/3/i2096e/i2096e02.pdf.
Food and Agriculture Organisation of the United Nations 2016. The Global Agriculture Perspectives System (GAPS) Version 1.0. Rome: Food and Agriculture Organisation of the United Nations. Accessed October 15, 2019. http://www.fao.org/global-perspectives-studies/resources/detail/en/c/433548/
63References
Reallocating Water for India’s Growth: Sectoral Withdrawals, Water-efficient Agriculture, and Institutional Mechanisms
Food and Agriculture Organisation of the United Nations 2018. Progress on Water Use Efficiency: Global Baseline for SDG Indicator 6.4.1. Rome: FAO.
Food and Agriculture Organisation of the United Nations 2020. AQUASTAT. Accessed May 15, 2019. http://www.fao.org/nr/water/aquastat/data/query/results.html?regionQuery=true&yearGrouping=SURVEY&showCodes=false&yearRange.fromYear=1960&yearRange.toYear=2015&varGrpIds=4250,4251,4252,4253,4257,4275&cntIds=®Ids=9729,9730,9731,9732&query_type=RegProf&n.
Francesco Vuolo, Guido D’Urso, Carlo De Michele, Biagio Bianchi, and Michael Cutting. 2015. “Satellite-based Irrigation Advisory Services: A Common Tool for Different Experiences from Europe to Australia.” Agricultural Water Management 147: 82–95. https://doi.org/10.1016/j.agwat.2014.08.004
Franco-Crespo, Christian, and Jose Maria Sumpsi Viñas. 2017. “The Impact of Pricing Policies on Irrigation Water for Agro-Food Farms in Ecuador.” MDPI Sustainability 9(9) 1515 https://doi.org/10.3390/su9091515.
Freshwater Health Index. 2017. Freshwater Health Index: User Manual Version 1.1. User Manual, Freshwater Health Index. Accessed May 5, 2020. https://www.freshwaterhealthindex.org/sites/default/files/FHI%20User%20Manual%20v1.1_October%202017.pdf.
Gadanakis, Y., R. Bennett, J. Park, and F. J. Areal. 2015. “Improving Productivity and water Use Efficiency: A Case Study of Farms in ENGLAND.” Agricultural Water Management 160: 22–32. https://doi.org/10.1016/j.agwat.2015.06.020.
Gallardo, M., Thompson, R.B., Giménez, C., Padilla, F.M., Stöckle, C. 2003. “Prototype Decision Support System Based on the VegSyst Simulation Model to Calculate Crop N and Water Requirements for Tomato under Plastic Cover.” Irrigation Science 32: 237–253. https://doi.org/10.1007/s00271-014-0427-3.
Gandhi, Vasant P., Nicky Johnson, Kangkanika Neog, and Dinesh Jain. 2020. “Institutional Structure, Participation, and Devolution in Water Institutions of Eastern India.” Water (MDPI) 12. https://doi.org/10.3390/w12020476.
Gangopadhyay, P.K., Khatri-Chhetri, A., Shirsath, P.B., Agarwal, P.K. 2019. “Spatial Targeting of ICT-based Weather and Agro-advisory Services for Climate Risk Management in Agriculture.” Climatic Change 154: 241–256. https://doi.org/10.1007/s10584-019-02426-5.
Garrido, Alberto, Pedro Martınez-Santos, and M. Ramon Llamas. 2005. “Groundwater Irrigation and its Implications for Water Policy in Semiarid Countries: The Spanish Experience.” Hydrogeology. 14, 340 https://doi.org/10.1007/s10040-005-0006-z
Ghosh, Narayan C. 2017. “Geogenic Contamination and Technologies for Safe Drinking Water Supply.” In: Nath K., Sharma V. (eds)Water and Sanitation in the New Millenium. 81–95, New Delhi: Springer. https://doi.org/10.1007/978-81-322-3745-7_8
Global Water Partnership. 2011. What is IWRM? 12 July. Accessed July 01, 2020. https://www.gwp.org/en/GWP-CEE/about/why/what-is-iwrm/#:~:text=Integrated%20Water%20Resources%20Management%20(IWRM,vital%20ecosystems%20and%20the%20environment.
Gopal, Brij. 2016. “A Conceptual Framework for Environmental Flows Assessment Based on Ecosystem Services and Their Economic Valuation.” Ecosystem Services 21: 53-58 DOI: https://doi.org/10.1016/j.ecoser.2016.07.013.
Government of India. 2012. National Water Policy. New Delhi: Government of India
Government of Maharashtra. 2005. “Maharashtra Water Resources Regulatory Authority Act, 2005.” Law & Judiciary Department, Government of Maharashtra.
Groundwater Surveys and Development Agency and Central Ground Water Board. 2011. Dynamic Ground Water Resources of Maharastra (2008-09). Pune and Nagpur: Groundwater Surveys and Development Agency and Central Ground Water Board.
64
Gutiérrez-Martín, Carlos, José A. Gómez-Limón, and Nazaret M. Montilla-López. 2020. “Self-financed Water Bank for Resource Reallocation to the Environment and within the Agricultural Sector.” Ecological Economics 169. https://doi.org/10.1016/j.ecolecon.2019.106493.
Harsha, J. 2017. Micro-irrigation in India: An Assessment of Bottlenecks and Realities. Global Water Forum. Accessed June 12, 2020. https://globalwaterforum.org/2017/06/13/micro-irrigation-in-india-an-assessment-of-bottlenecks-and-realities/.
Hartung, Hans, and Lucie Pluschke. 2018. The Benefits and Risks of Solar Powered Irrigation. Rome: FAO and GIZ.
Hidayah, Ismatul, Hanani Nuhfil, Anandita Ratya, and Setiawan Budi. 2013. “Production and Cost Efficiency Analysis Using Frontier Stochastic Approach, A case on Paddy Farming System with Integrated Plant and Resource Management (IPRM) Approach in Buru district Maluku PROVINCE INDONESIA.” Journal of Economics and Sustainable 4 (1): 78–84.
High Level Committee on Reorienting the Role and Restructuring of Food Corporation of India. 2015. Report of the High Level Committee on Reorienting the Role and Restructuring of Food Corporation of India (FCI). New Delhi: Food Corporation of India.
India Meteorological Department. 2018. “Weather Forecasting Capabilities of IMD & Preparedness for SW Monsoon and Cyclones.” India Meteorological Organisation. Accessed June 20, 2020. https://www.ndmindia.nic.in/images/pdf/Weather-Forecasting-Capabilities-of-IMD-&-Preparedness-for-SW-Monsoon-and-Cyclones-2018.pdf.
India Meteorological Department 2020. Current Agromet Bulletins in Local Language. Accessed June 12, 2020. https://mausam.imd.gov.in/imd_latest/contents/agromet/advisory/blocalmain.php.
India Meteorological Department 2020a. Meteorological Services for Agriculture in India. Accessed June 12, 2020. mausam.imd.gov.in/imd_latest/contents/meteorological-agriculture-services.php.
India Meteorological Department 2020b. Rainfall and temperature dataset for Andhra Pradesh, Maharashtra and Uttar Pradesh 2008-2014. Distributed by India Meteorological Department. http://dsp.imdpune.gov.in/
International Energy Agency. 2018. World Energy Outlook. Paris: International Energy Agency.
International Union for Conservation of Nature. n.d. Environmental FLows: Managing Water Allocation and Trade-Offs. International Union for Conservation of Nature. Accessed June 15, 2020. https://www.iucn.org/downloads/water_briefing_eflows.pdf.
Iyer, R. R. 2005. “The Notion of Environmental Flows: A Caution.” NIE/IWMI Workshop on Environmental Flows March 23–24, 2005. New Delhi.
Jain, Sharad K. 2012. “Assessment of Environmental Flow Requirements.” Hydrological Processes (National Institute of Hydrology) 26: 3472–3476. https://doi.org/10.1002/hyp.9455.
Jain, Sharad K. 2019. “Water Resources Management in India – Challenges and the Way Forward.” Current Science Vol. 117 04 569–576. https://doi.org/10.18520/cs/v117/i4/569-576.
Jiang, Min. 2018. Towards Tradable Water Rights: Water Law and Policy Reform in China. Springer International Publishing. https://doi.org/10.1007/978-3-319-67087-4.
Jønch-Clausen, T., and J. Fugl. 2001. “Firming up the Conceptual Basis of Integrated Water Resources Management.” International Journal of Water Resources Development 17:4,501–510. https://doi.org/10.1080/07900620120094055.
Julaniya, R. S., Manish Singh, M. G. Choubey, and Shubhankar Biswas. 2016. “A Management Approach to Increase Irrigated Area and Production in Madhya Pradesh, India.” Second World Economic Forum 1–11. Chiang Mai.
65References
Reallocating Water for India’s Growth: Sectoral Withdrawals, Water-efficient Agriculture, and Institutional Mechanisms
Kaneko, S., K. Tanaka, T. Toyota, and S. Mangi. 2004. “Water Efficiency of Agricultural Production in China: Regional Comparison from 1999 to 2002.” International Journal of Agricultural Resources, Governance and Ecology (IJARGE) 3: 231–251. https://doi.org/10.1504/IJARGE.2004.006038·
Katz, David. 2016. “Undermining Demand Management with Supply Management: Moral Hazard in Israeli Water Policies.” Water 8 (159). doi:10.3390/w8040159.
Kaushal, Nitin, Suresh Babu, Arjit Mishra, Nilanjan Ghosh, Vinod Tare, Ravindra Kumar, Phanish Kumar Sinha, and Ram Ujagir Verma. 2019. Towards a Healthy Ganga—Improving River Flows Through Understanding Trade Offs. Frontiers in Environmental Sciences. https://doi.org/10.3389/fenvs.2019.00083.
Kaushika G. S., Himanshu Arora, and Hari Prasad K. S. 2019. “Analysis of Climate Change Effects on Crop Water Availability for Paddy, Wheat and Berseem.” Agricultural Water Management 225, Science Direct. https://doi.org/10.1016/j.agwat.2019.105734.
KC, Samir, M Speringer, and M Wurzer. 2017. Population projection by age, sex, and educational attainment in rural and urban regions of 35 provinces of India, 2011-2101: Technical report on projecting the regionally explicit socioeconomic heterogeneity in India. IIASA Working Paper WP-17-004, Laxenburg, Austria: International Institute for Applied Systems Analysis.
Kikuchi, M., R. Barker, P. Weligamage, and M. Samad. 2002. Irrigation Sector in Sri Lanka: Recent Investment Trends and the Development Path Ahead. Colombo: International Water Management Institute.
Kim, Narae, Swastik Das, Kangkanika Neog, and Rudresh Sugam. 2018. The Perfect Storm. New Delhi: United Nations in India and Council on Energy, Environment and Water.
Koshy, Jacob. 2019. “Is Desalination Realistically a Help in Harnessing Potable Water from the Sea?” The Hindu, June 7, 2019. Accessed May 10, 2020. https://www.thehindu.com/sci-tech/is-desalination-realistically-a-help-in-harnessing-potable-water-from-the-sea/article28306470.ece.
Kumar, M. Dinesh, Upali A. Amarasinghe, Bharat R. Sharma, Kairav Trivedi, O. P. Singh, Alok K. Sikka, and Jos C. van Dam. 2009. Water Productivity Improvements in Indian Agriculture: Potentials, Constraints and Prospects. International Water Management Institute.
Kummu, M, J H A Guillaume, H de Moel, S Eisner, M Flörke, M Porkka, S Siebert, T I E Veldkamp, and P J Ward. 2016. “The world’s road to water scarcity: shortage and stress in the 20th century and pathways towards sustainability.” Nature Scientific Reports. https://doi.org/10.1038/srep38495.
Lankford, B., I. Makin, N. Matthews, A. Noble, and T. Shah. 2016. “A Compact to Revitalise Large-Scale Irrigation Systems Using a Leadership-Partnership-Ownership ‘Theory of Change’.” Water Alternatives 9 (1): 1–32. https://hdl.handle.net/10568/72602
Marston, L., and X. Cai. 2016. “An Overview of Water Reallocation and the Barriers to Its Implementation.” Water 3 (5): 658–677. https://doi.org/10.1002/wat2.1159.
Martin A. Burton, Amarjit Singh Dhingra. 2014. India: Support for the Implementation of the National Water Mission by State Governments in India: Scoping Study for a National Water Use Efficiency Improvement Support Program. New Delhi: Asian Development Bank.
Meenakshi, J. V., Abhijit Banerji, Aditi Mukherji, and Anubhab Gupta. 2013. “Does Marginal Cost Pricing of Electricity Affect the Groundwater Pumping Behaviour of Farmers? Evidence from India.” New Delhi: 3ie Impact Evaluation Report 4, 3ie.
Meinzen-Dick, Ruth S., Rajendra Pradhan, K. Palanisami, Ajaya Dixit, and Kusum Athukorala. 2004. Livelihood Consequences of Transferring Water out of Agriculture: Synthesis of Findings from South Asia. New Delhi: Report submitted to Ford Foundation.
66
Meinzen-Dick, Ruth S. and Claudia Ringler. 2006. Water Reallocation: Challenges, Threats, and Solutions for the Poor, Journal of Human Development,9(1). 47-64. https://doi.org/10.1080/14649880701811393.
Ministry of Agriculture & Farmers’ Welfare. 2017. “Operational Guidelines of Per Drop More Crop (Micro Irrigation): Components of PMKSY.” Pradhan Mantri Krishi Sinchayee Yojana. Accessed March 10, 2020. https://pmksy.gov.in/MicroIrrigation/Archive/GuidelinesMIRevised250817.pdf.
Ministry of Agriculture & Farmers’ Welfare 2018. “Pradhan Mantri Krishi Sinchayee Yojana Micro Irrigation Fund: Operational Guidelines.” Pradhan Mantri Krishi Sinchayee Yojana. Accessed March 10, 2020. https://pmksy.gov.in/MicroIrrigation/Archive/Guideline_MIF_19092019.pdf.
Ministry of Agriculture & Farmers’ Welfare 2018a. Agricutural Statistics at a Glance 2018. New Delhi: Ministry of Agriculture and Farmers’ Welfare.
Ministry of Agriculture & Farmers’ Welfare 2019. About PMKSY. Accessed March 10, 2020. https://pmksy.gov.in/AboutPMKSY.aspx.
Ministry of Environment, Forest and Climate Change. 2015. Notification under Environment (Protection) Amendment Rules 2015. New Delhi: Ministry of Environment, Forest and Climate Change, Government of India. Accessed June 08, 2019. http://www.indiaenvironmentportal.org.in/files/file/Moef%20notification%20-%20gazette.pdf.
Ministry of Environment, Forest and Climate Change 2019. National status of wastewater generation and treatment. Accessed January 08, 2020. http://www.sulabhenvis.nic.in/Database/STST_wastewater_2090.aspx.
Ministry of New and Renewable Energy. 2019. Annual Report 2019–20. New Delhi: Ministry of New and Renewable Energy.
Ministry of Statistics and Programme Implementation. 2018. “Water.” In EnviStats India-2018 (Supplement on Environmental Accounts), by Ministry of Statistics and Programme Implementation. Accessed March 10, 2019. http://www.mospi.gov.in/sites/default/files/reports_and_publication/statistical_publication/EnviStats/5_Chapter%203%20-%20Water.pdf.
Ministry of Urban Development. 2009. “Handbook of Service Level Benchmarking.” New Delhi. Accessed April 03, 2020. http://cpheeo.gov.in/upload/uploadfiles/files/Handbook.pdf.
Ministry of Urban Development 2012. Service Levels in Urban Water and Sanitation Sector: Status Report (2010-11). Ministry of Urban Development, Government of India, New Delhi: Ministry of Urban Development. Accessed March 18, 2020. http://mohua.gov.in/upload/uploadfiles/files/SLB%20National%20Data%20Book_0.pdf.
Ministry of Water and Irrigation. 2016. “Water Reallocation Policy.” Government of Jordan. http://www.mwi.gov.jo/sites/en-us/Hot%20Issues/Strategic%20Documents%20of%20%20The%20Water%20Sector/Water%20Reallocation%20Policy%2025.2.2016.pdf
Ministry of Water Resources. 1999. “Report of the Standing Committee for Assessment of Availability and Requirement of Water”, National Commission on Integrated Water Resources Development (NCIWRD). New Delhi: Ministry of Water Resources.
Ministry of Water Resources 2012. “Per Capita Water Availability in India.” Press Information Bureau, April 26, 2012. Accessed December 20, 2019. https://pib.gov.in/PressReleasePage.aspx?PRID=1604871#:~:text=As%20per%20Ministry%20of%20Housing,to%20higher%20level%20by%20states.
Ministry of Water Resources, River Development and Ganga Rejuvenation. 2018. “Study of Groundwater Contamination.” Press Bureau of India, July 30, 2018. Accessed December 20, 2019. https://pib.gov.in/PressReleasePage.aspx?PRID=1540632.
Minor Irrigation (Statistics) Wing. 2017. Report of the 5th Census of Minor Irrigation Schemes. New Delhi: Ministru of Water Resources, River Development and Ganga Rejuvenation. Accessed June 15, 2019. http://www.
67References
Reallocating Water for India’s Growth: Sectoral Withdrawals, Water-efficient Agriculture, and Institutional Mechanisms
indiaenvironmentportal.org.in/files/file/Report%20of%205th%20Census%20of%20Minor%20Irrigation%20Schemes.pdf.
Modanesi, S., C. Massari, S. Camici, L. Brocca, and Giriraj. Amarnath. 2020. “Do Satellite Surface Soil Moisture Observations Better Retain Information about Crop-yield Variability in Drought Conditions?” Water Resources Research 56(2): 1–19. https://doi.org/10.1029/2019WR025855.
Molle, Francois, and Jeremy Berkoff. 2009. “Cities vs. Agriculture: A Review of Intersectoral Water Re-Allocation.” Natural Resources Forum 33: 6–18.
Mungarwal, Amit Kumar, and S. K. Mehta. 2019. “Why Farmers Today Need to Take Up Precision Farming.” Down To Earth, Accessed May 12, 2020. https://www.downtoearth.org.in/blog/agriculture/why-farmers-today-need-to-take-up-precision-farming-64659.
Narayanamoorthy, A. 2018. “Financial Performance of India’s Irrigation Sector: A Historical Analysis.” International Journal of Water Resources Development 34 (1): 116–131. https://doi.org/10.1080/07900627.2017.1298998
NITI Aayog. 2019. Composite Water Management Index. New Delhi: NITI Aayog.
Pant, Dhruv, Madhusudan Bhattarai, and Govinda Basnet. 2008. Implications of Bulk Water Transfer on Local Water Management Institutions: A Case Study of Melamchi Water Supply Project in Nepal. Washington DC: Collective Action and Property Rights.
PHD Chamber of Commerce. 2018. Exploring Prospects from Make in India and Made in India: A Study. New Delhi: PHD Chamber of Commerce.
Planning Commission. 2012. Sustainable Management of Water Resources. New Delhi: Planning Commission. Accessed June 13, 2020. http://164.100.94.191/niti/writereaddata/files/coop/24.pdf.
Purandare, Pradeep. 2020. Lawlessness in Maharashtra’s Water Sector. Accessed May 13, 2020. https://sandrp.in/tag/irrigation-laws/.
Qtaishat, Tala. 2013. “Impact of Water Reallocation on the Economy in the Fertile Crescent.” Water Resources Management 27: 3765–3774. https://doi.org/10.1007/s11269-013-0379-z.
Raju, K. V., Ashok Gulati, and Ruth Suseela Meinzen-Dick. 2003. Innovations in Irrigation Financing: Tapping Domestic Financial Markets in India. Washington D.C.: International Food Policy Research Institute.
Raymond, Anne, and Abhishek Jain. 2018. Solar for Irrigation: A Comparative Assessment of Deployment Strategies. New Delhi: Council on Energy, Environment and Water.
Richter, Brian. 2014. Chasing Waters: A Guide for Moving from Scarcity to Sustainability. Washington DC: Island Press.
Rotich, Stella C., and Deogratias M. M. Mulungu. 2017. “Adaptation to Climate Change Impacts on Crop Water Requirements in Kikafu Catchment, Tanzania.” Journal of Water and Climate Change 8 (2): 274–292. https://doi.org/10.2166/wcc.2017.058.
Ruttan, V. W. 2002. “Productivity Growth in World Agriculture: Sources and Constraints.” Journal of Economic Perspectives 16 (4): 161–184.
Scheierling, Susanne M., David O. Treguer, James F. Booker, and Elisabeth Decker. 2014. “How to Assess Agricultural Water Productivity? Looking for Water in the Agricultural Productivity and Efficiency Literature.” Policy research working paper no. WPS 6982, Washington, D.C: World Bank.
Schwartz, K., and M. Schouten. 2007. “Water as a Political Good: Revisiting the Relationship between Politics and Service Provision.” Water Policy 9 (2): 119–129. https://doi.org/10.2166/wp.2007.008
68

Serrat Capdevila, Aleix, and Stefanie Maria Herrmann. 2019. New Avenues for Remote Sensing Applications for Water Management: A Range of Applications and the Lessons Learned from Implementation (English). Washington DC: World Bank Group.
Shah, T. 2014. “Groundwater Governance and Irrigated Agriculture.” Sweden: Global Water Partnership.
Shah, Tushaar. 2009. “Climate Change and Groundwater: India’s Opportunities for Mitigation and Adaptation.” Environmental Research Letters. 4(3) https://doi.org/10.1088/1748-9326/4/3/035005.
Sharma, Bharat R., Ashok Gulati, Gayathri Mohan, Stuti Manchanda, Indro Ray, and Upali Amarasinghe. 2018. Water Productivity Mapping of Major Indian Crops. Mumbai: NABARD and ICRIER.
Shen, Dajun, and V. Ratna Reddy. 2016. “Water Pricing in China and India: A Comparative Analysis.” Water Policy (18): 103–121. https://doi.org/10.2166/wp.2016.107.
Shi, Minjun, Xiaojun Wang, Hong Yang, and Tao Wang. 2014. “Pricing or Quota? A Solution to Water Scarcity in Oasis Regions in China: A Case Study in the Heihe River Basin.” MDPI Sustainability 6: 7601–7620. https://doi.org/10.3390/su6117601.
Siebert, Stefan, and Petra Döll. 2010. “Quantifying Blue and Green Virtual Water Contents in Global Crop Production as well as Potential Production Losses without Irrigation.” Journal of Hydrology 384 (3–4): 198–217. https://doi.org/10.1016/j.jhydrol.2009.07.031.
Smakhtin, V. U., C. Revenga, and P. Döll. 2004. Taking into Account Environmental Water Requirements in Global-scale Water Resources Assessments: Comprehensive Assessment of Water Management in Agriculture Research Report, Colombo: Comprehensive Assessment Secretariat.
Smakhtin, V., and M. Anputhas. 2006. An Assessment of Environmental Flow Requirements of Indian River Basins. IWMI Research Report 107, Colombo: International Water Management Institute.
Soma, Mahesh Kumar, Musarrat Shaheen, Farrah Zeba, and M. Aruna. 2019. “Precision Agriculture in India—Challenges and Opportunities.” In Proceedings of International Conference on Sustainable Computing in Science, Technology and Management (SUSCOM), Jaipur: Amity University
Speed, R., L. Yuanyuan, T. Le Quesne, G. Pegram, and Z. Zhiwei. 2013. Basin Water Allocation Planning: Principles, Procedures and Approaches for Basin Allocation Planning. Paris: UNESCO.
Speelman, Stijn, Marijke D’Haese, Jeroen Buysse, and Luc D’Haese. 2007. “Technical Efficiency of Water Use and Its Determinants, Study at Small-scale Irrigation Schemes in North-West Province, South Africa.” 106th seminar of the EAAE: Pro-poor Development in Low Income Countries - Food, Agriculture, Trade, and Environment. Montpellier: EAAE.
Sugam, R. K., P. Choudhury, and J. Hartl. 2016. Promoting Neo-traditional Agriculture to Achieve Food and Livelihood Security, and Climate Change Adaptation. Policy brief. New Delhi: Council on Energy, Environment and Water.
The Australian Water Partnership. 2017. Understanding Supply-side and Demand-side to Support Water Management in the Asia Pacific. Accessed February 6, 2020. https://waterpartnership.org.au/understanding-supply-side-and-demand-side-to-support-water-management-in-the-asia-pacific/.
Thobani, Mateen. 1997. “Formal Water Markets: Why, When, and How to Introduce Tradable Water Rights.” World Bank Research Observer 12(2): 161-179, Oxford: Oxford University Press.
Tsur, Yacov, Terry Roe, Rachid Dukkali, and Ariel Dinar. 2004. Pricing Irrigation Water: Principles and Cases from Developing Countries. Washington DC: Resources for the future.
United Nations in India. 2020. SDG 6: Clean Water and Sanitation. Accessed February 6, 2020. https://in.one.un.org/page/sustainable-development-goals/sdg-6/.
69References
Reallocating Water for India’s Growth: Sectoral Withdrawals, Water-efficient Agriculture, and Institutional Mechanisms
United Nations. 2003. Sectoral Water Allocation Policies in Selected ESCWA Member Countries. New York: UN.
Vijay Kumar, S. K. 2005. “Analysis of Long-Term Rainfall Trends in India.” Hydrological Sciences 55 (4) 484-496, https://doi.org/10.1080/02626667.2010.481373.
Vörösmarty, Charles J., Peter B. McIntyre, Mark O. Gessner, David Dudgeon, Alexander Prusevich, Pamela Green, and Stanley Glidden. 2010. “Global Threats to Human Water Security and River Biodiversity.” Nature 467 (7315): 555–561. https://doi.org/10.1038/nature09440
Wagle, Subodh, Sachin Warghade, and Mandar Sathe. 2013. Water Reallocation and Grabbing: Processes, Mechanisms and Contributory Factors. TISS Working Paper No. 2. Mumbai: Tata Institute of Social Sciences.
Walud, A., and B. White. 2000. “Farm Household Efficiency in Bangladesh: a Comparison of Stochastic Frontier and DEA Methods.” Applied Economics 32 (13): 1665–1673. https://doi.org/10.1080/000368400421011.
Weng, Mark, and Chen Li. 2019. “An Institutional Analysis of China’s South-to-North Water Diversion.” Thesis Eleven 150 (1): 68–80. https://doi.org/10.1177/0725513618822419.
Won-Ho Nam, Taegon Kim, Eun-Mi Hong, Jin-Yong Choi, Jin-TaekKim. 2017. “A Wireless Sensor Network (WSN) Application for Irrigation Facilities Management Based on Information and Communication Technologies (ICTs).” Computers and Electronics in Agriculture 143: 185–192. https://doi.org/10.1016/j.compag.2017.10.007.
World Bank. 1998. India—Water Resources Management Sector Review: Report on the Irrigation Sector. Washington DC: World Bank.
World Bank 2008. Performance Improvement Planning: Designing an Effective Leakage Reduction and Management Program. World Bank. Accessed April 03, 2020. http://documents1.worldbank.org/curated/en/479201468316169165/pdf/441260WSP0BOX31e0reduction01PUBLIC1.pdf.
World Bank 2011. Water Sector in India. Accessed September 29, 2019. https://www.worldbank.org/en/news/feature/2011/09/29/india-water.
Wurbs, Ralph A. 2013. “Water Allocation Systems.” In Water Resources Planning, Development and Management. https://doi.org/10.5772/54438.
Wyatt, Alan S. 2010. Non-Revenue Water: Financial Model for Optimal Management in Developing Countries. RTI Press publication No. MR-0018-1006. Research Triangle Park, NC:, North Carolina: RTI International. https://doi:10.3768/rtipress.2010.mr.0018.1006
Young, R. A. 2005. Determining the Economic Value of Water: Concepts and Methods. Washington DC: Resources for the Future.
Zhang, Jingting, Wei Ren, Pingli An, Zhihua Pan, Liwei Wang, Zhiqiang Dong, Di He, Jia Yang, Shufen Pan, and Hanqin Tian. 2015. “Responses of Crop Water Use Efficiency to Climate Change and Agronomic Measures in the Semiarid Area of Northern China.” PLoS ONE 10 (9). https://doi.org/10.1371/journal.pone.0137409.
Zheng, J., H. Zhang, and Z. Xing. 2018. “Re-Examining Regional Total-Factor Water Efficiency and Its Determinants in China: A Parametric Distance Function Approach.” Water 10, 1286. https://doi.org/10.3390/w10101286.
Zhou, Tianwa, Pute Wu, Shikun Sun, Xiaolei Li, Yubao Wang, and Xiaobo Luan. 2017. “Impact of Future Climate Change on Regional Crop Water Requirement—A Case Study of Hetao Irrigation District, China.” Water 9 429. https://doi.org/10.3390/w9060429.
70
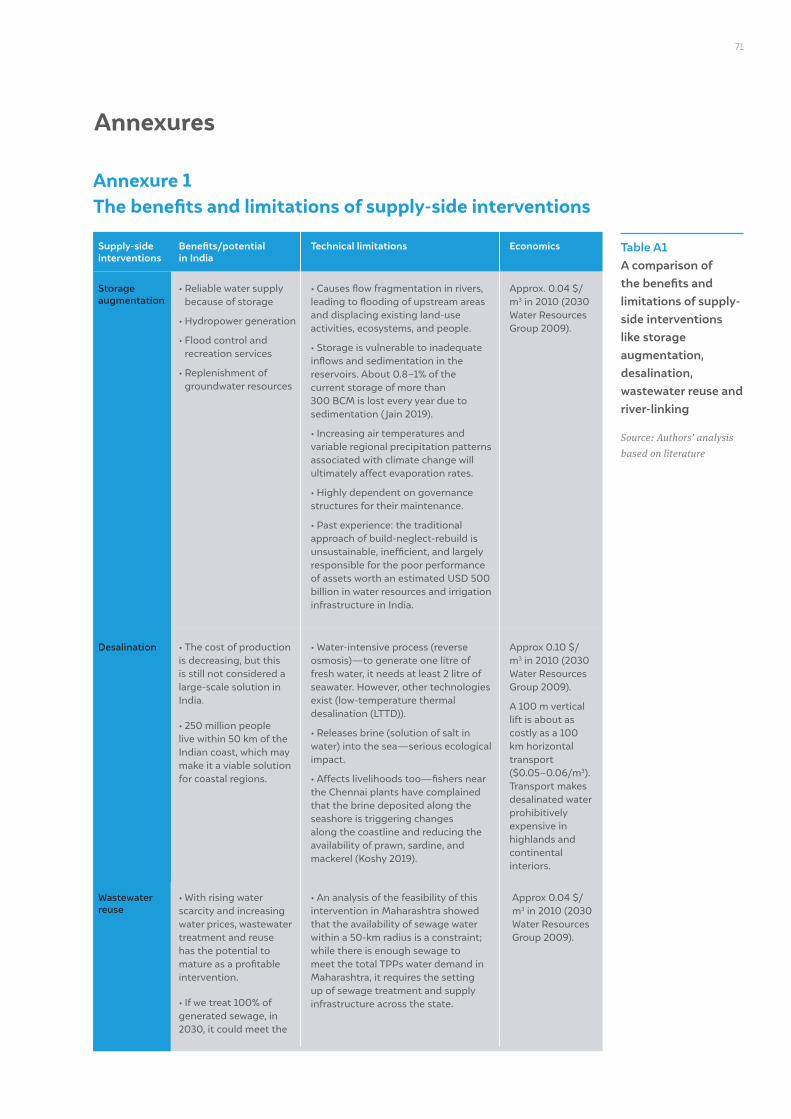
Annexure 1 The benefits and limitations of supply-side interventions
Annexures
Table A1 A comparison of the benefits and limitations of supply-side interventions like storage augmentation, desalination, wastewater reuse and river-linking
Source: Authors’ analysis
based on literature
Supply-side interventions
Benefits/potential in India
Technical limitations Economics
Storage augmentation
Wastewater reuse
Desalination
• Reliable water supply because of storage
• Hydropower generation
• Flood control and recreation services
• Replenishment of groundwater resources
• With rising water scarcity and increasing water prices, wastewater treatment and reuse has the potential to mature as a profitable intervention.
• If we treat 100% of generated sewage, in 2030, it could meet the
• The cost of production is decreasing, but this is still not considered a large-scale solution in India.
• 250 million people live within 50 km of the Indian coast, which may make it a viable solution for coastal regions.
• Causes flow fragmentation in rivers, leading to flooding of upstream areas and displacing existing land-use activities, ecosystems, and people.
• Storage is vulnerable to inadequate inflows and sedimentation in the reservoirs. About 0.8–1% of the current storage of more than 300 BCM is lost every year due to sedimentation ( Jain 2019).
• Increasing air temperatures and variable regional precipitation patterns associated with climate change will ultimately affect evaporation rates.
• Highly dependent on governance structures for their maintenance.
• Past experience: the traditional approach of build-neglect-rebuild is unsustainable, inefficient, and largely responsible for the poor performance of assets worth an estimated USD 500 billion in water resources and irrigation infrastructure in India.
• An analysis of the feasibility of this intervention in Maharashtra showed that the availability of sewage water within a 50-km radius is a constraint; while there is enough sewage to meet the total TPPs water demand in Maharashtra, it requires the setting up of sewage treatment and supply infrastructure across the state.
• Water-intensive process (reverse osmosis)—to generate one litre of fresh water, it needs at least 2 litre of seawater. However, other technologies exist (low-temperature thermal desalination (LTTD)).
• Releases brine (solution of salt in water) into the sea—serious ecological impact.
• Affects livelihoods too—fishers near the Chennai plants have complained that the brine deposited along the seashore is triggering changes along the coastline and reducing the availability of prawn, sardine, and mackerel (Koshy 2019).
Approx. 0.04 $/m3 in 2010 (2030 Water Resources Group 2009).
Approx 0.04 $/m3 in 2010 (2030 Water Resources Group 2009).
Approx 0.10 $/m3 in 2010 (2030 Water Resources Group 2009).
A 100 m vertical lift is about as costly as a 100 km horizontal transport ($0.05–0.06/m3). Transport makes desalinated water prohibitively expensive in highlands and continental interiors.
71
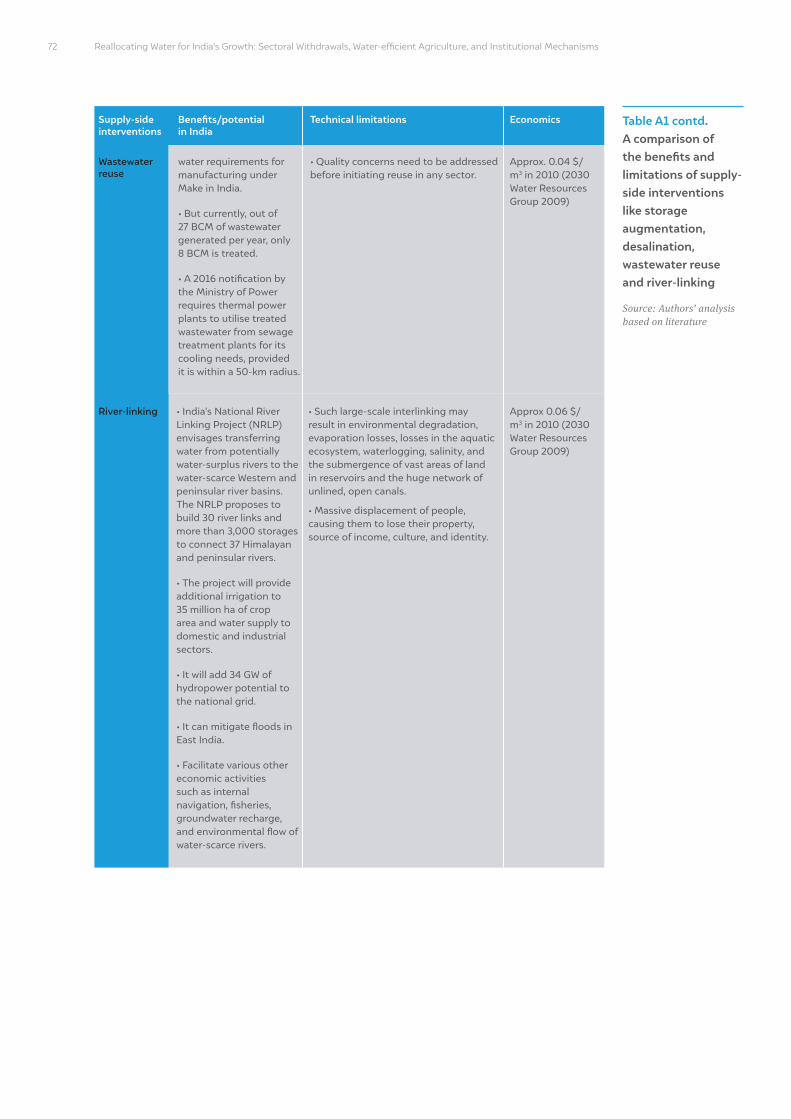
Reallocating Water for India’s Growth: Sectoral Withdrawals, Water-efficient Agriculture, and Institutional Mechanisms
Table A1 contd. A comparison of the benefits and limitations of supply-side interventions like storage augmentation, desalination, wastewater reuse and river-linking
Source: Authors’ analysis based on literature
Supply-side interventions
Benefits/potential in India
Technical limitations Economics
Wastewater reuse
River-linking
water requirements for manufacturing under Make in India.
• But currently, out of 27 BCM of wastewater generated per year, only 8 BCM is treated.
• A 2016 notification by the Ministry of Power requires thermal power plants to utilise treated wastewater from sewage treatment plants for its cooling needs, provided it is within a 50-km radius.
• India’s National River Linking Project (NRLP) envisages transferring water from potentially water-surplus rivers to the water-scarce Western and peninsular river basins. The NRLP proposes to build 30 river links and more than 3,000 storages to connect 37 Himalayan and peninsular rivers.
• The project will provide additional irrigation to 35 million ha of crop area and water supply to domestic and industrial sectors.
• It will add 34 GW of hydropower potential to the national grid.
• It can mitigate floods in East India.
• Facilitate various other economic activities such as internal navigation, fisheries, groundwater recharge, and environmental flow of water-scarce rivers.
• Quality concerns need to be addressed before initiating reuse in any sector.
• Such large-scale interlinking may result in environmental degradation, evaporation losses, losses in the aquatic ecosystem, waterlogging, salinity, and the submergence of vast areas of land in reservoirs and the huge network of unlined, open canals.
• Massive displacement of people, causing them to lose their property, source of income, culture, and identity.
Approx. 0.04 $/m3 in 2010 (2030 Water Resources Group 2009)
Approx 0.06 $/m3 in 2010 (2030 Water Resources Group 2009)
72
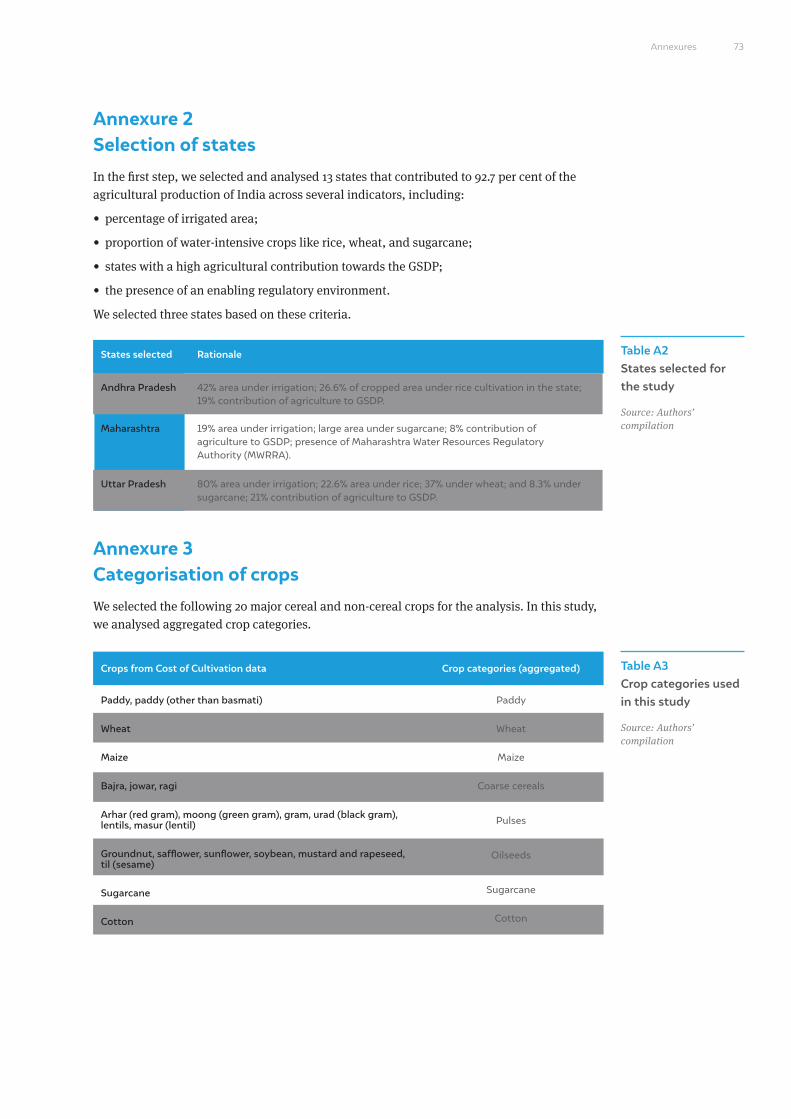
Annexure 2 Selection of states In the first step, we selected and analysed 13 states that contributed to 92.7 per cent of the agricultural production of India across several indicators, including:
• percentage of irrigated area;
• proportion of water-intensive crops like rice, wheat, and sugarcane;
• states with a high agricultural contribution towards the GSDP;
• the presence of an enabling regulatory environment.
We selected three states based on these criteria.
Annexure 3 Categorisation of crops We selected the following 20 major cereal and non-cereal crops for the analysis. In this study, we analysed aggregated crop categories.
Table A2 States selected for the study
Source: Authors’ compilation
Table A3 Crop categories used in this study
Source: Authors’ compilation
States selected
Crops from Cost of Cultivation data
Rationale
Crop categories (aggregated)
Andhra Pradesh
Paddy, paddy (other than basmati)
Wheat
Maize
Bajra, jowar, ragi
Arhar (red gram), moong (green gram), gram, urad (black gram), lentils, masur (lentil)
Groundnut, safflower, sunflower, soybean, mustard and rapeseed, til (sesame)
Sugarcane
Cotton
Uttar Pradesh
Maharashtra
42% area under irrigation; 26.6% of cropped area under rice cultivation in the state; 19% contribution of agriculture to GSDP.
Paddy
Wheat
Maize
Coarse cereals
Pulses
Oilseeds
Sugarcane
Cotton
80% area under irrigation; 22.6% area under rice; 37% under wheat; and 8.3% under sugarcane; 21% contribution of agriculture to GSDP.
19% area under irrigation; large area under sugarcane; 8% contribution of agriculture to GSDP; presence of Maharashtra Water Resources Regulatory Authority (MWRRA).
73Annexures
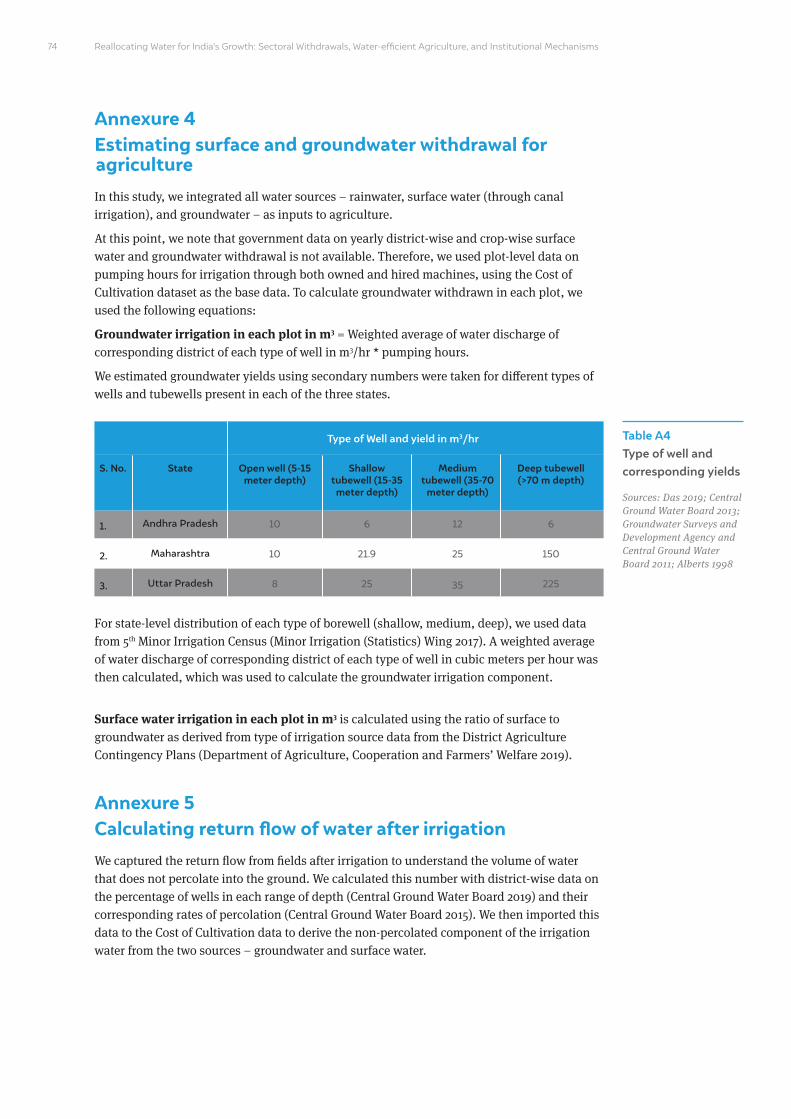
Reallocating Water for India’s Growth: Sectoral Withdrawals, Water-efficient Agriculture, and Institutional Mechanisms
Annexure 4 Estimating surface and groundwater withdrawal for agriculture In this study, we integrated all water sources – rainwater, surface water (through canal irrigation), and groundwater – as inputs to agriculture.
At this point, we note that government data on yearly district-wise and crop-wise surface water and groundwater withdrawal is not available. Therefore, we used plot-level data on pumping hours for irrigation through both owned and hired machines, using the Cost of Cultivation dataset as the base data. To calculate groundwater withdrawn in each plot, we used the following equations:
Groundwater irrigation in each plot in m3 = Weighted average of water discharge of corresponding district of each type of well in m3/hr * pumping hours.
We estimated groundwater yields using secondary numbers were taken for different types of wells and tubewells present in each of the three states.
For state-level distribution of each type of borewell (shallow, medium, deep), we used data from 5th Minor Irrigation Census (Minor Irrigation (Statistics) Wing 2017). A weighted average of water discharge of corresponding district of each type of well in cubic meters per hour was then calculated, which was used to calculate the groundwater irrigation component.
Surface water irrigation in each plot in m3 is calculated using the ratio of surface to groundwater as derived from type of irrigation source data from the District Agriculture Contingency Plans (Department of Agriculture, Cooperation and Farmers’ Welfare 2019).
Annexure 5 Calculating return flow of water after irrigationWe captured the return flow from fields after irrigation to understand the volume of water that does not percolate into the ground. We calculated this number with district-wise data on the percentage of wells in each range of depth (Central Ground Water Board 2019) and their corresponding rates of percolation (Central Ground Water Board 2015). We then imported this data to the Cost of Cultivation data to derive the non-percolated component of the irrigation water from the two sources – groundwater and surface water.
Table A4 Type of well and corresponding yields
Sources: Das 2019; Central Ground Water Board 2013; Groundwater Surveys and Development Agency and Central Ground Water Board 2011; Alberts 1998
S. No. State Open well (5-15 meter depth)
Shallow tubewell (15-35
meter depth)
Medium tubewell (35-70
meter depth)
Deep tubewell (>70 m depth)
Type of Well and yield in m3/hr
Andhra Pradesh
Maharashtra
Uttar Pradesh
1.
2.
3.
10
10
8
6
21.9
25
12
25
35
6
150
225
74

Table A5 Return flow for each range of depth
Source: (Central Ground Water Board 2015)
Source of irrigation Type of crop Water table below ground level
<10 m 10 -25 m >25 m
Groundwater
Groundwater
Surface water
Surface water
Non-paddy
Paddy
Non-paddy
Paddy
25
45
30
50
15
35
20
40
5
20
10
25
Annexure 6 Calculating rainfall input for irrigation water Using district-wise monthly rainfall data from the India Meteorological Department for 2008–2014 in each district, we estimated the effective rainfall (using the USDA Soil Conservation Service (USDA SCS) method) during their respective cropping seasons. We only consider the cropping season relevant to each crop to estimate the total rainfall for that crop.
Calculation of effective rainfall: USDA Soil Conservation Services (USDA SCS) method
Pmth – monthly precipitation; Peff – effective precipitation
Peff = Pmth x (125 – 0.2 Pmth)/125, (for Pmth ≤ 250 mm)
Peff = 125 + 0.1 Pmth, (for Pmth > 250 mm)
Annexure 7 Bifurcation of drought and non-drought districtsTo analyse whether water-use efficiency differs across drought and non-drought districts, the study defines drought districts as those in which the government had declared drought for three out of the four years (2014–2017). State governments use a three-step process to assess and declare drought districts – the two mandatory indicators are rainfall deviation and dry spells. The four impact indicators are status of agriculture, vegetation indices based on remote sensing, soil moisture, and hydrology. Finally, ground-truthing surveys are used for confirmation. Therefore, this contains elements of hydrological, meteorological, and agricultural droughts.
The districts we selected are:
• In Andhra Pradesh: Prakasam, Nellore, Chittoor, Kadapa, Anantapur, Kurnool, Guntur, and Vizianagaram (8 of 13 districts that faced drought in 3 out of 4 years)
• In Maharashtra: Nagpur, Akola, Yavatmal, Aurangabad, Parbhani, Latur, Nanded, Beed, Jalna, Osmanabad, Hingoli, Pune, Satara, Sangli, Nashik, Dhule, Nandurbar, Jalgaon, and Ahmednagar (19 of 36 districts that faced drought in 3 out of 4 years)
• In Uttar Pradesh: Jhansi, Jalaun, Lalitpur, Chitrakoot, Banda, and Mahoba (6 of 76 districts that faced drought in 3 out of 4 years)
75Annexures
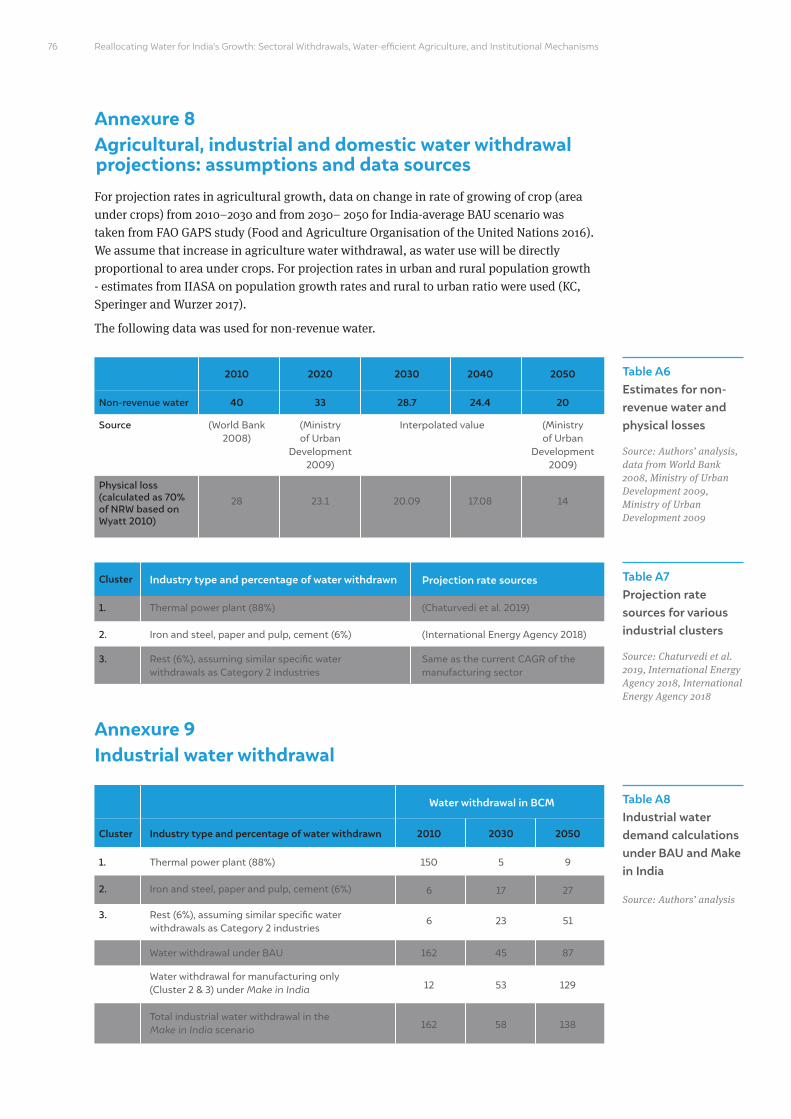
Reallocating Water for India’s Growth: Sectoral Withdrawals, Water-efficient Agriculture, and Institutional Mechanisms
Annexure 8 Agricultural, industrial and domestic water withdrawal projections: assumptions and data sourcesFor projection rates in agricultural growth, data on change in rate of growing of crop (area under crops) from 2010–2030 and from 2030– 2050 for India-average BAU scenario was taken from FAO GAPS study (Food and Agriculture Organisation of the United Nations 2016). We assume that increase in agriculture water withdrawal, as water use will be directly proportional to area under crops. For projection rates in urban and rural population growth - estimates from IIASA on population growth rates and rural to urban ratio were used (KC, Speringer and Wurzer 2017).
The following data was used for non-revenue water.
Table A6 Estimates for non-revenue water and physical losses
Source: Authors’ analysis, data from World Bank 2008, Ministry of Urban Development 2009, Ministry of Urban Development 2009
Table A7 Projection rate sources for various industrial clusters
Source: Chaturvedi et al. 2019, International Energy Agency 2018, International Energy Agency 2018
2010
Industry type and percentage of water withdrawn Projection rate sourcesCluster
2020 2030 2040 2050
40 33 28.7 24.4 20Non-revenue water
1.
2.
3.
Source
Physical loss (calculated as 70% of NRW based on Wyatt 2010)
(World Bank 2008)
Thermal power plant (88%)
Iron and steel, paper and pulp, cement (6%)
Rest (6%), assuming similar specific water withdrawals as Category 2 industries
(Chaturvedi et al. 2019)
(International Energy Agency 2018)
Same as the current CAGR of the manufacturing sector
28 23.1 20.09 17.08 14
(Ministry of Urban
Development 2009)
Interpolated value (Ministry of Urban
Development 2009)
Annexure 9 Industrial water withdrawal
Table A8 Industrial water demand calculations under BAU and Make in India
Source: Authors’ analysis
Industry type and percentage of water withdrawn
Water withdrawal in BCM
Cluster 2030 2050
1.
2.
3.
Thermal power plant (88%) 5 9
17 27
23 51
45 87
53 129
2010
150
6
6
162
12
162 58 138
Iron and steel, paper and pulp, cement (6%)
Rest (6%), assuming similar specific water withdrawals as Category 2 industries
Water withdrawal under BAU
Water withdrawal for manufacturing only (Cluster 2 & 3) under Make in India
Total industrial water withdrawal in the Make in India scenario
76
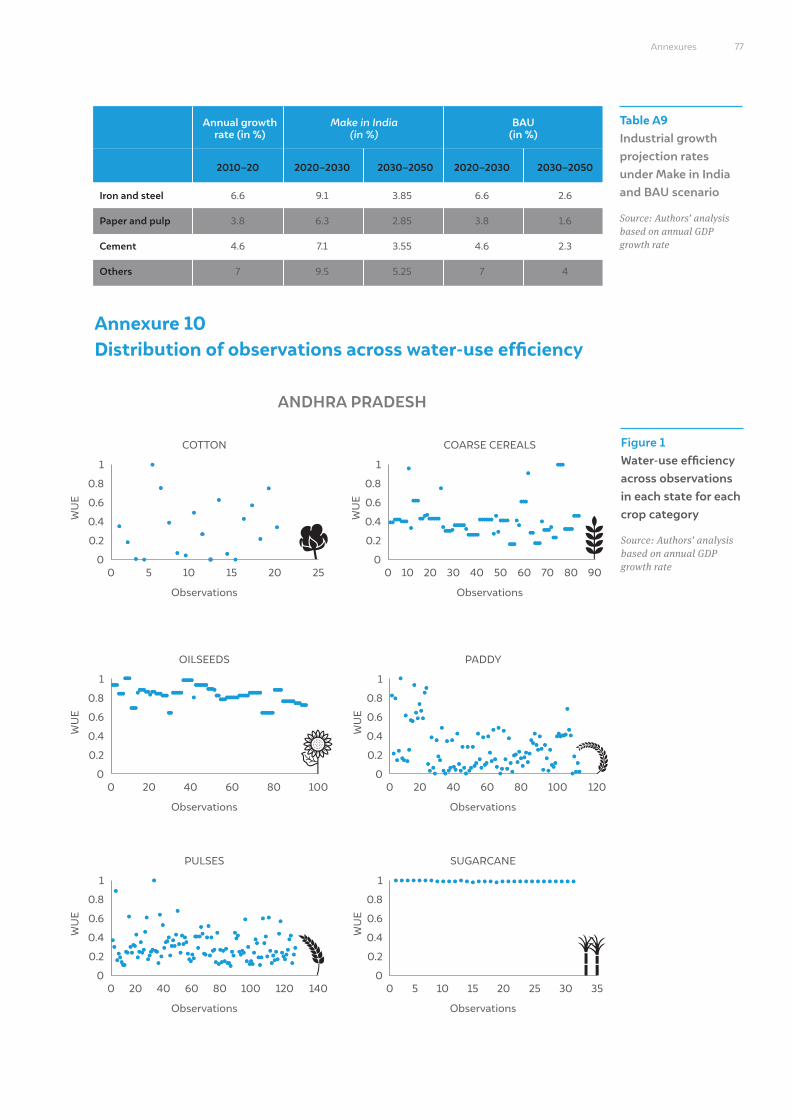
Figure 1 Water-use efficiency across observations in each state for each crop category
Source: Authors’ analysis based on annual GDP growth rate
Annexure 10 Distribution of observations across water-use efficiency
ANDHRA PRADESH
Table A9 Industrial growth projection rates under Make in India and BAU scenario
Source: Authors’ analysis based on annual GDP growth rate
BAU (in %)
Annual growth rate (in %)
2010–20 2020–2030 2020–20302030–2050 2030–2050
Make in India (in %)
Iron and steel
Paper and pulp
Cement
Others
6.6
3.8
4.6
7
9.1
6.3
7.1
9.5
3.85
2.85
3.55
5.25
6.6
3.8
4.6
7
2.6
1.6
2.3
4
77Annexures
0
0
0
0
0
00
0
0
0
0
0
0.2
0.2
0.2
0.2
0.2
0.2
5
20
20
20
5
10
40
40
40
10
10 20 30 40 50
Observations
Observations
Observations
Observations
Observations
Observations
COTTON
OILSEEDS
PULSES
PADDY
SUGARCANE
COARSE CEREALS
15
60
60
60
15
6020
80
80
80
20
70 8025
100
140120100
120
35
100
25 30
90
0.4
0.4
0.4
0.4
0.4
0.4
0.6
0.6
0.6
0.6
0.6
0.6
0.8
0.8
0.8
0.8
0.8
0.8
1
1
1
1
1
1
WU
EW
UE
WU
E
WU
EW
UE
WU
E
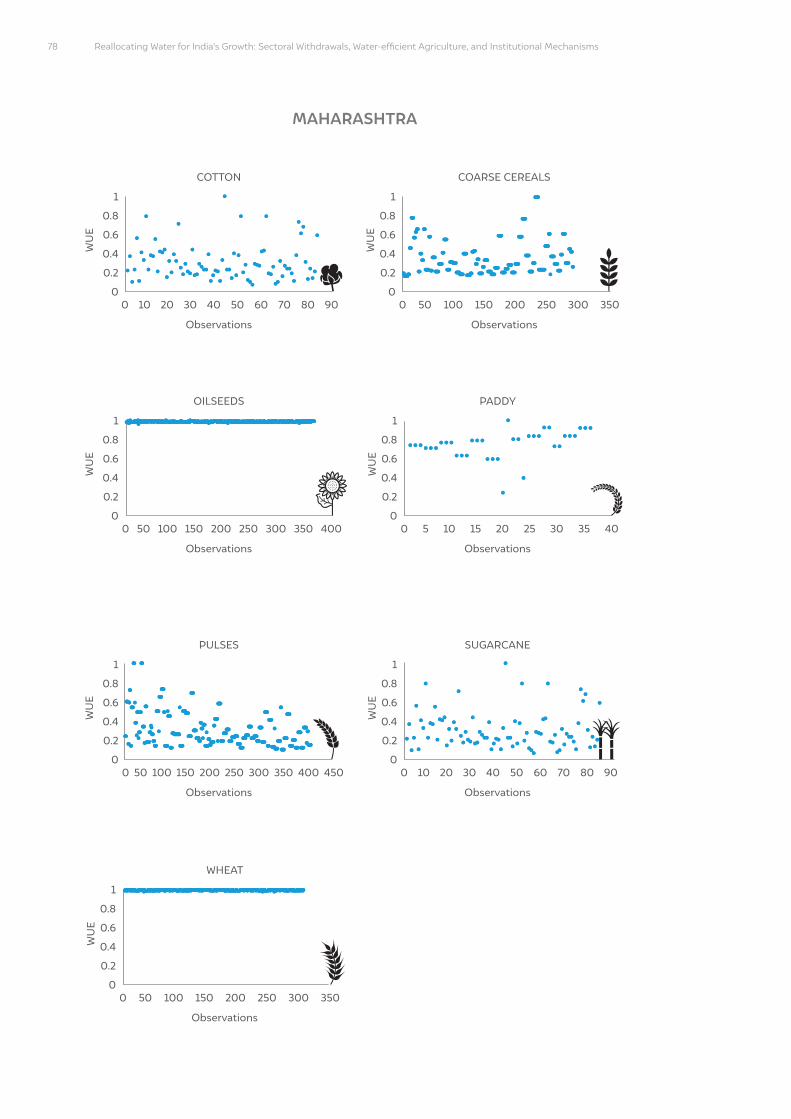
Reallocating Water for India’s Growth: Sectoral Withdrawals, Water-efficient Agriculture, and Institutional Mechanisms78
MAHARASHTRA
0
0
0
0
0
0
0
0
0
0
0
0
0
0.2
0.2
0.2
0.2
0.2
0.2
0.2
50
50
100
100
150
150
200
200
250
250
300
300
350
350
5 10
10 20 30 40 50
50
50
Observations
Observations
Observations
Observations
Observations
Observations
Observations
COTTON
OILSEEDS
PULSES
PADDY
SUGARCANE
COARSE CEREALS
WHEAT
15 20
60
25
70 80
400
400 450
4030 35
350
350
300
300
250
250
200
200
150
150
100
100
90
0.4
0.4
0.4
0.4
0.4
0.4
0.4
0.6
0.6
0.6
0.6
0.6
0.6
0.6
0.8
0.8
0.8
0.8
0.8
0.8
0.8
1
1
1
1
1
1
1
WU
EW
UE
WU
E
WU
EW
UE
WU
E
WU
E
0 10 20 30 40 50 60 70 80 90
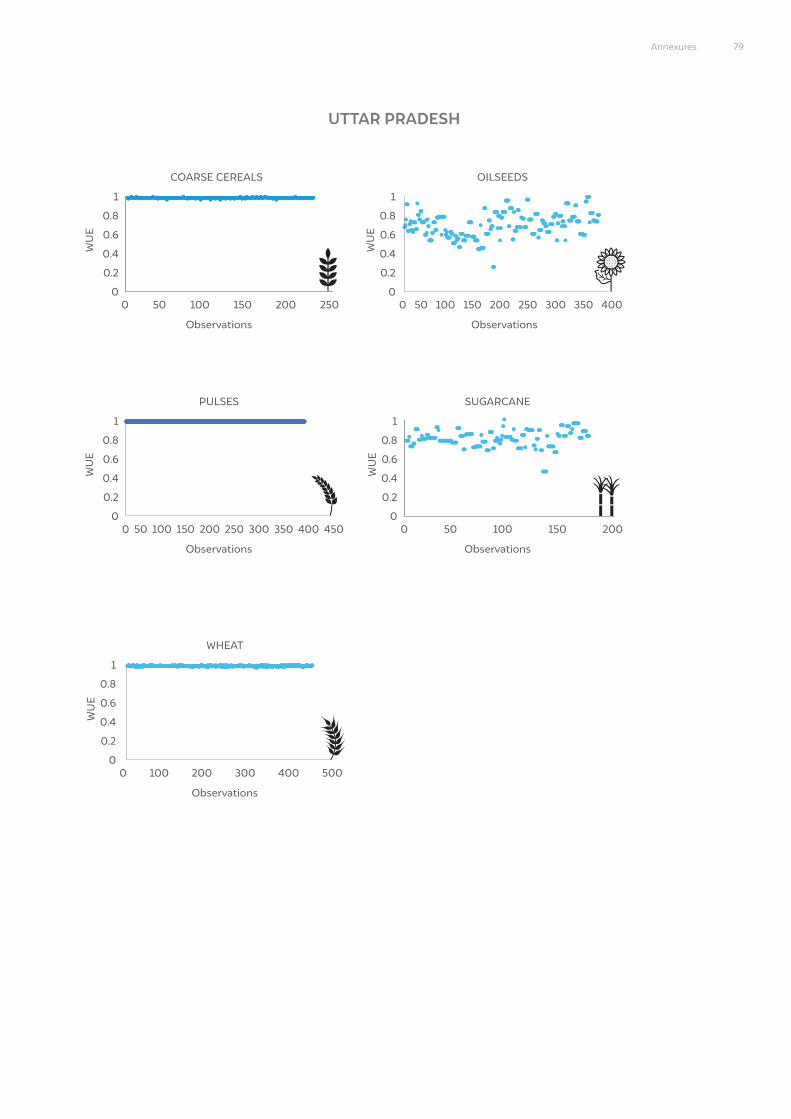
79Annexures
UTTAR PRADESH
0
0 0
0
0
0
0
0
0
0.2
0.2 0.2
0.2
0.2
50 100 150 200 250 300 350
5050
Observations
Observations Observations
Observations
Observations
PULSES SUGARCANE
COARSE CEREALS OILSEEDS
WHEAT
400 450
400350
500
300
300 400
250250 200200
200
150150 100100
100
0.4
0.4 0.4
0.4
0.4
0.6
0.6 0.6
0.6
0.6
0.8
0.8 0.8
0.8
0.8
1
1 1
1
1
WU
EW
UE
WU
EW
UE
WU
E
0 50 100 150 200
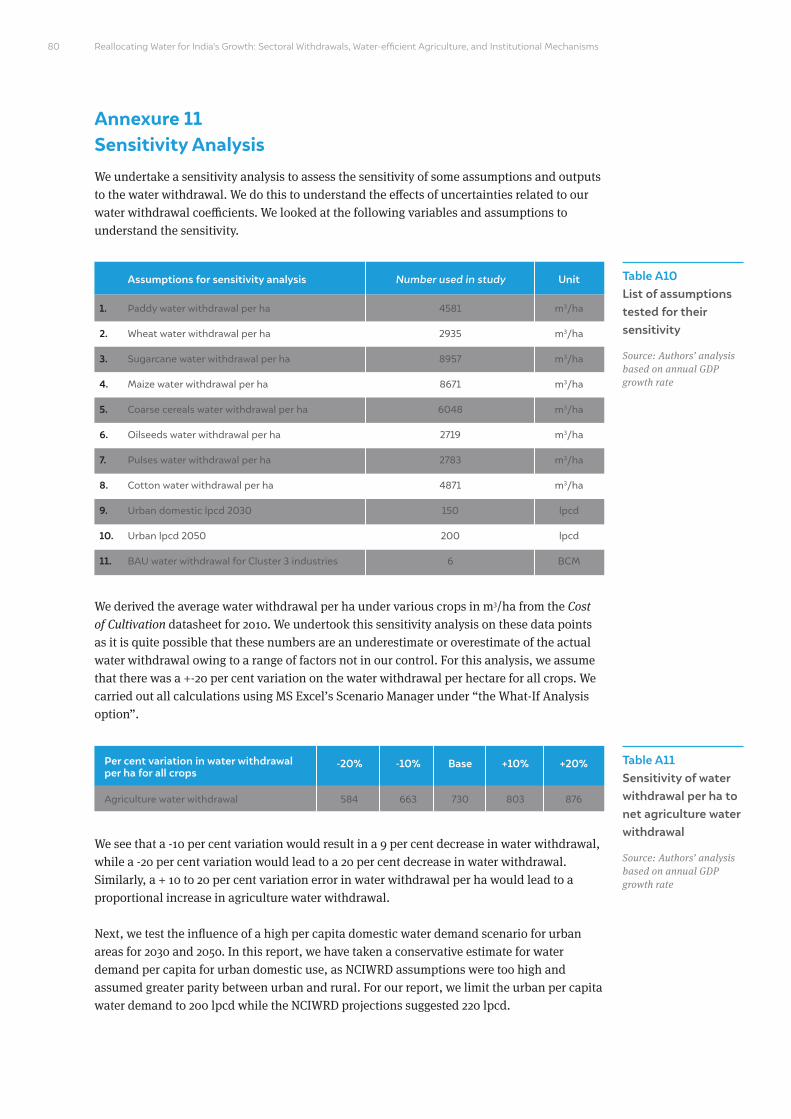
Reallocating Water for India’s Growth: Sectoral Withdrawals, Water-efficient Agriculture, and Institutional Mechanisms
Annexure 11 Sensitivity AnalysisWe undertake a sensitivity analysis to assess the sensitivity of some assumptions and outputs to the water withdrawal. We do this to understand the effects of uncertainties related to our water withdrawal coefficients. We looked at the following variables and assumptions to understand the sensitivity.
We derived the average water withdrawal per ha under various crops in m3/ha from the Cost of Cultivation datasheet for 2010. We undertook this sensitivity analysis on these data points as it is quite possible that these numbers are an underestimate or overestimate of the actual water withdrawal owing to a range of factors not in our control. For this analysis, we assume that there was a +-20 per cent variation on the water withdrawal per hectare for all crops. We carried out all calculations using MS Excel’s Scenario Manager under “the What-If Analysis option”.
We see that a -10 per cent variation would result in a 9 per cent decrease in water withdrawal, while a -20 per cent variation would lead to a 20 per cent decrease in water withdrawal. Similarly, a + 10 to 20 per cent variation error in water withdrawal per ha would lead to a proportional increase in agriculture water withdrawal.
Next, we test the influence of a high per capita domestic water demand scenario for urban areas for 2030 and 2050. In this report, we have taken a conservative estimate for water demand per capita for urban domestic use, as NCIWRD assumptions were too high and assumed greater parity between urban and rural. For our report, we limit the urban per capita water demand to 200 lpcd while the NCIWRD projections suggested 220 lpcd.
Table A10 List of assumptions tested for their sensitivity
Source: Authors’ analysis based on annual GDP growth rate
Table A11 Sensitivity of water withdrawal per ha to net agriculture water withdrawal
Source: Authors’ analysis based on annual GDP growth rate
UnitAssumptions for sensitivity analysis
Per cent variation in water withdrawal per ha for all crops
Number used in study
-20% -10% Base +10% +20%
1.
2.
3.
4.
5.
6.
7.
8.
9.
10.
11.
Paddy water withdrawal per ha
Wheat water withdrawal per ha
Sugarcane water withdrawal per ha
Maize water withdrawal per ha
Coarse cereals water withdrawal per ha
Oilseeds water withdrawal per ha
Pulses water withdrawal per ha
Cotton water withdrawal per ha
Urban domestic lpcd 2030
Urban lpcd 2050
BAU water withdrawal for Cluster 3 industries
Agriculture water withdrawal
4581
2935
8957
8671
6048
2719
2783
4871
150
200
6
584 663 730 803 876
m3/ha
m3/ha
m3/ha
m3/ha
m3/ha
m3/ha
m3/ha
m3/ha
lpcd
lpcd
BCM
80
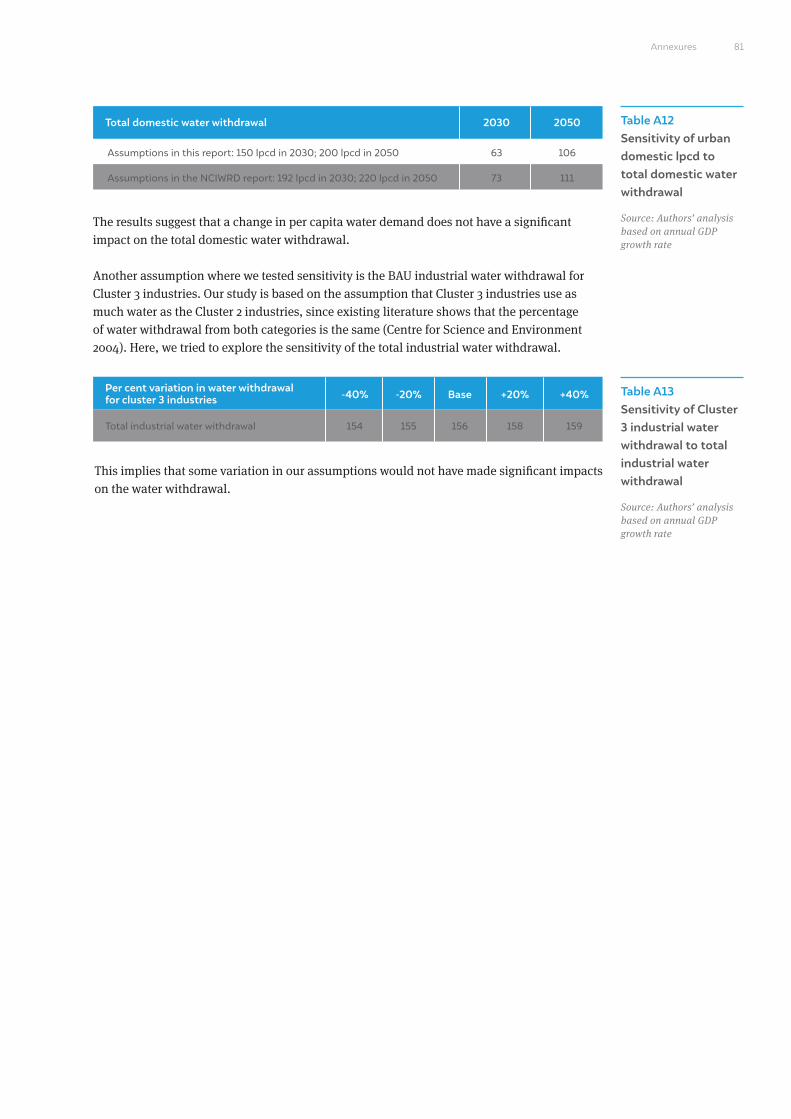
Table A12 Sensitivity of urban domestic lpcd to total domestic water withdrawal
Source: Authors’ analysis based on annual GDP growth rate
Table A13 Sensitivity of Cluster 3 industrial water withdrawal to total industrial water withdrawal
Source: Authors’ analysis based on annual GDP growth rate
Total domestic water withdrawal 2030 2050
Assumptions in this report: 150 lpcd in 2030; 200 lpcd in 2050
Assumptions in the NCIWRD report: 192 lpcd in 2030; 220 lpcd in 2050
63
73
106
111
The results suggest that a change in per capita water demand does not have a significant impact on the total domestic water withdrawal.
Another assumption where we tested sensitivity is the BAU industrial water withdrawal for Cluster 3 industries. Our study is based on the assumption that Cluster 3 industries use as much water as the Cluster 2 industries, since existing literature shows that the percentage of water withdrawal from both categories is the same (Centre for Science and Environment 2004). Here, we tried to explore the sensitivity of the total industrial water withdrawal.
This implies that some variation in our assumptions would not have made significant impacts on the water withdrawal.
Per cent variation in water withdrawal for cluster 3 industries -40% -20% Base +20% +40%
Total industrial water withdrawal 154 155 156 158 159
81Annexures
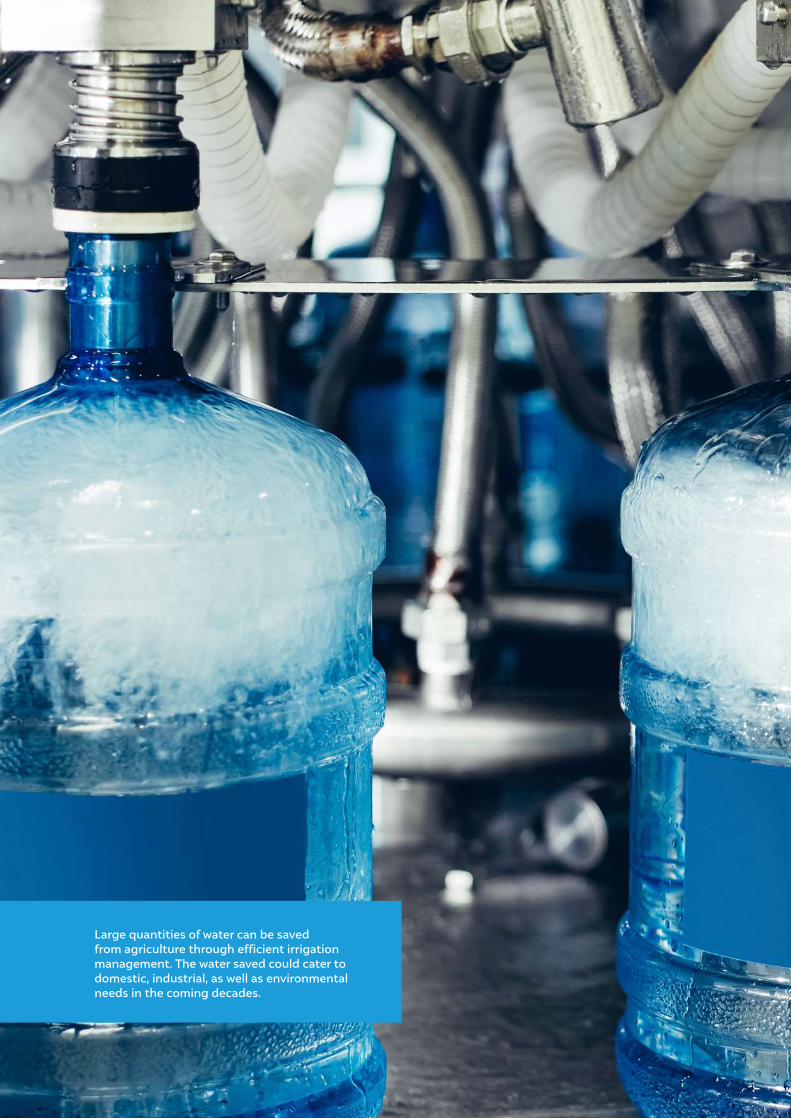
Reallocating Water for India’s Growth: Sectoral Withdrawals, Water-efficient Agriculture, and Institutional Mechanisms
Large quantities of water can be saved from agriculture through efficient irrigation management. The water saved could cater to domestic, industrial, as well as environmental needs in the coming decades.
Image: iStock
Reallocating Water for India’s Growth: Sectoral Withdrawals, Water-efficient Agriculture, and Institutional Mechanisms
COUNCIL ON ENERGY, ENVIRONMENT AND WATER (CEEW)
Sanskrit Bhawan, A-10, Aruna Asaf Ali Marg Qutab Institutional AreaNew Delhi - 110 067, IndiaT: +91 11 4073 3300
[email protected] | ceew.in | @CEEWIndia