Embed Size (px)
Citation preview
REALTY INCOME
2019 ANNUAL REPORT

TABLE OF CONTENTS
2 Company Performance
4 Letter to Shareholders
10 Historical Financial Performance
12 Real Estate Portfolio
16 Disciplined Investment Process
18 Conservative Capital Structure
19 Dependable Monthly Dividends
20 Corporate Responsibility
22 Select Financial Data
29 Company Information
Celebrating 25 Years on the New York Stock Exchange
16.5%COMPOUND AVERAGE ANNUAL TOTAL SHAREHOLDER RETURN
5.0%ANNUAL AFFO PER SHARE GROWTH
4.5%COMPOUND AVERAGE ANNUAL DIVIDEND PER SHARE GROWTH
104 DIVIDEND INCREASES
89CONSECUTIVE QUARTERLY
DIVIDEND INCREASES
0DIVIDEND REDUCTIONS
PERFORMANCE
HIGHLIGHTS
SINCE
1994 NYSE
LISTING(1)
“The Company believes that owning a diversified portfolio of commercialproperties operated under triple-net lease agreements may offer it one of the best opportunities for creating predictable results for its Shareholders.”
– PROSPECTUS, 1994
(1) As of 12/31/19

REALTY INCOME 2019 ANNUAL REPORT 1
1969 Realty Income is founded by William and Joan Clark
1994 Began trading on the New York Stock Exchange
under the ticker symbol “0”
1996 Received investment-grade credit ratings
from Moody’s Investors Service and Standard and Poor’s Rating Agency
2011 Completed $1.0 billion in annual
property acquisitions for the first time
2013 Closed acquisition of American Realty
Capital Trust for $3.2 billion
2015 Added to the S&P 500 index and the
S&P High Yield Dividend Aristocrats® index
2016 Surpassed $1.0 billion in annual rental revenue
2017 Credit rating upgraded to ‘A3’ by Moody’s Investors Service
2018 Credit rating upgraded to ‘A-’
by Standard and Poor’s Rating Agency
2019 Celebrated the 50th anniversary of the company’s
founding and the 25th anniversary of the company’s listing on the New York Stock Exchange
Surpassed $6.7 billion in common stock dividends paid to shareholders
Expanded internationally through property acquisitions in the United Kingdom

2 REALTY INCOME 2019 ANNUAL REPORT
COMPOUND AVERAGE ANNUAL TOTAL SHAREHOLDER RETURN SINCE 1994 NYSE LISTING(AS OF DECEMBER 31, 2019)
COMPARISON OF $100 INVESTED IN REALTY INCOME IN 1994 VS. MAJOR STOCK INDICES(1) (AS OF DECEMBER 31, 2019)
R E A LT Y I N CO M E
E Q U I T Y R E I T I N D E X
D O W J O N E S I N D U S T R I A L A V E R A G E
N A S D A Q CO M P O S I T E
S & P 5 0 0
$3,777
$1,329
$1,192$1,140
$1,326
94 95 96 97 98 99 00 01 02 03 04 05 06 07 08 09 10 11 12 13 14 15 16 17 18 19
EARNINGS AND DIVIDENDS
COMPOUND AVERAGE ANNUAL GROWTH SINCE 1994 NYSE LISTING
5.0% AFFO PER SHARE GROWTH
4.5% DIVIDEND PER SHARE GROWTH
$3.322019 AFFO PER SHARE
$2.73(1)
2019 ANNUALIZED DIVIDEND PER SHARE
94 95 96 97 98 99 00 01 02 03 04 05 06 07 08 09 10 11 12 13 14 15 16 17 18 19
Company Performance
(1) Annualized dividend amount reflects the December declared dividend rate per share multiplied by 12. Information as of 12/31/2019.
D O W J O N E S I N D U S T R I A L A V E R A G E
E Q U I T Y R E I T I N D E X
N A S D A Q CO M P O S I T E
S & P 5 0 0
R E A LT Y I N CO M E
10.3%
10.1%
10.7%
10.8%
16.5%
(1) Refer to page 27 for additional information on the calculation of total shareholder return.

REALTY INCOME 2019 ANNUAL REPORT 3
21.3%TOTAL SHAREHOLDER RETURN
4.1%AFFO PER SHARE GROWTH
3.0%DIVIDEND PER SHARE GROWTH
$1.4 BILLION RENTAL REVENUE
$3.7BILLION INVESTMENT VOLUME
$3.0BILLION ATTRACTIVELY PRICED
CAPITAL RAISED
98.6%PORTFOLIO OCCUPANCY
102.6%RECAPTURE RATE ON RE-LEASING ACTIVITY
2019
PERFORMANCE
HIGHLIGHTS

4 REALTY INCOME 2019 ANNUAL REPORT
Dear Fellow Shareholders,
Realty Income had a milestone year in 2019 as we
celebrated the 50th anniversary of our company’s
founding, the 25th anniversary of our public listing on
the New York Stock Exchange (NYSE), and another
year of favorable operating results and shareholder
returns. I am deeply proud of our company’s track
record of success, humbled by the team’s many
accomplishments, and extremely optimistic about
our future. As I reflect on Realty
Income’s bright prospects in this
new decade, I am gratified that
the mission which has guided
the company since its inception
remains core to our success.

REALTY INCOME 2019 ANNUAL REPORT 5
William and Joan Clark founded Realty
Income in 1969 with the mission to
provide dependable monthly income that
increases over time. We have sustained this
commitment to our shareholders, whom we
consider loyal customers, to the present day,
as we were one of only a handful of REITs
that continued raising dividends through the
Great Recession and, as of year-end 2019, we
had paid 593 consecutive monthly dividends.
That achievement led to Realty Income being
added to the S&P 500 Dividend Aristocrats®
index this year, making us one of only 64
companies in this exclusive group and one of
only three REITs. I share this incredible honor
with all of you and thank you from the bottom
of my heart for the loyalty, hard work, and
passion that makes this possible.
Since our founding, the company has grown
its market capitalization to more than
$32 billion, annual revenue to over $1.4 billion,
the real estate portfolio to 6,483 properties,
and the team to 194 employees. In addition,
since our public listing in 1994, we have grown
AFFO per share by a compound average
annual growth rate of 5%, increased total
market capitalization by a compound average
annual growth rate of 19.1%, and delivered
16.5% compound average annual total
shareholder return.
Our dedication to the company’s mission has
remained steadfast throughout this period of
growth. However, the way we do business and
serve our shareholders, clients, colleagues,
and community has evolved. When we listed
on the NYSE in 1994, our real estate portfolio
of 628 properties was primarily concentrated
in child care centers, restaurants, and
automotive retailers. Today, our portfolio has
expanded to include clients operating in 50
industries. Similarly, ten years ago, our real
estate portfolio was entirely comprised of
retail properties.

6 REALTY INCOME 2019 ANNUAL REPORT
Today, our strategy has expanded to include
industrial properties, which represents nearly
12% of revenue. As we entered 2019, our real
estate portfolio was centered in the United
States and Puerto Rico. Today, we serve
clients internationally to include properties
located in the United Kingdom.
We are excited about our international
expansion, as it enhances our robust
investment pipeline and represents a natural
evolution of the company’s growth strategy.
We believe the size of the European net
lease market and the need for a large-scale,
well-capitalized institutional real estate
partner offers a propitious environment for
us to increase our total addressable market
for growth, and that our company is ideally
positioned to pursue this adjacent vertical
given our standing as a leader in the net lease
industry. Our prospects are further enhanced
by our sector-leading cost of capital and
ability to complete large-scale transactions
without creating issues around tenant or
industry concentration. Domestically, we will
continue to seek to capitalize on our size and
scale advantages to drive favorable operating
and financial results.
OUR 2019 RESULTS
Our disciplined execution across all areas of
our business culminates in healthy earnings
and dividend growth. In 2019, we grew AFFO
per share, or the cash earnings available to
pay dividends to our shareholders, by 4.1%
to $3.32. This allowed us to increase the
dividend five times throughout the year, and
again in February 2020, raising the dividend
by 3.1% as compared to February 2019. The
continued strength of our operations enabled
us to increase the dividend while achieving
an AFFO payout ratio of 81.7% in 2019, which
we believe provided a comfortable margin
of safety for our shareholders. In 2019, the
shareholders who owned our common
stock for the full calendar year realized a
total return of 21.3%, which is comprised of
the change to our stock price as well as the
dividends paid throughout the year, assuming
reinvestment of dividends.
During 2019, we invested more than
$3.7 billion in high-quality real estate,
acquiring only 6.5% of the $57 billion in
potential real estate transactions sourced
and reviewed. Total international investments
during 2019 were $798 million, which
includes our first international acquisition—
a portfolio of 12 properties located in the
United Kingdom leased to Sainsbury’s, a
leading grocer. We ended the year with
portfolio occupancy of 98.6% and achieved
a 102.6% rent recapture rate on re-leasing
activity during the year. We remain very
well-positioned with a conservative capital
structure and strong liquidity, ending the year
with a Net Debt-to-Adjusted EBITDAre of
5.5x and approximately $2.3 billion available
on our $3.0 billion multi-currency
revolving credit facility.

REALTY INCOME 2019 ANNUAL REPORT 7
OUR TEAM - WE VALUE
THOSE WE SERVE
In 2019, we revisited and refined our values,
with an acute focus on those we serve—
our shareholders, clients, colleagues, and
community. Here are some of the key values
which guide us:
We do business with integrity, respect,
transparency and humility, because how
we act is more important than what we
accomplish
We do right by our clients, because their
success is our success
We nurture and reward our team, so they
will be inspired and engaged to give their
best every day
We prioritize diversity and inclusion,
because we are all equal
We aspire to give more than we take,
in our community and the environment
Employees form the foundation of Realty
Income’s corporate culture and are our
most valuable assets. Our team consists
of 194 dedicated team members across 13
departments, and the talent and commitment
of our colleagues drive the company’s
success. Our collective achievements are
made possible through the guidance of
the independent members of our Board of
Directors, and we were pleased to welcome
Christie Kelly, former Global Chief Financial
Officer of Jones Lang Lasalle Incorporated,
to our board in 2019.
We are One Team, and we are dedicated
to ensuring that we have the right people,
processes, and systems in place, while
fostering an environment in which all
employees can excel. In 2019, we completed
an employee engagement survey to assess,
analyze, and respond to employee sentiment.
The results were positive, affirming the
continued strength of our corporate
culture; however, we continuously monitor
opportunities for improvement and will
conduct employee engagement surveys on
an ongoing basis. Additionally, we emphasize
investing in proprietary technology solutions
to ensure we have the tools to continue
enhancing the scalability of our platform as
we grow the company.
As a service-driven business, we are
dedicated not only to our shareholders,
clients, and colleagues, but also to our
community. We have maintained a significant
presence in San Diego County since our
founding in 1969, devoting over 900 hours
in employee volunteer time in 2019. We
donate annually to a variety of charitable
organizations and remain dedicated to
operating our business in a socially and
environmentally responsible manner.
Environmental, social and governance
(“ESG”) issues increasingly factor into a

8 REALTY INCOME 2019 ANNUAL REPORT
company’s long-term prospects, and we are
thus evolving our philosophy and strategy
to take advantage of ESG opportunities
and manage risks. We officially developed a
Sustainability Department this year and are
dedicating resources to numerous initiatives
in 2020.
MACROECONOMIC OUTLOOK
We remain dedicated to creating long-
term value across a variety of economic
environments. This idea is core to our
business, as we are focused on being a
reliable safe harbor throughout all economic
cycles. Although we believe our portfolio and
investment strategies are well-positioned
to deliver consistently on this goal, our
team continuously monitors and analyzes
macroeconomic factors and their potential
impact on domestic and international
economies. Considerations that could
affect market performance include interest
rate trends, the geopolitical climate, global
trade, global health, and evolving consumer
behavior. The U.S. presidential election, trade
negotiations between the U.S. and China,
Middle East geopolitical discussions, terms
of the United Kingdom’s withdrawal from the
European Union, enhanced volatility in oil
prices, and the impact of a global pandemic
are key topics we are monitoring in 2020.
Recently, the COVID-19 global pandemic
has significantly impacted the stability of
the capital markets, the health of certain
industries and subsectors, and has weakened
the forecast for global economic output.
Despite these challenges, we continue to
believe that the strength of our balance
sheet, defensive nature of our real estate
portfolio, and overall credit quality of our
tenant base support a resilient income stream
that can perform as consistently as it has for
over 50 years.
As of the end of 2019, approximately half of
our annualized rental revenue was generated
from tenants, their subsidiaries or affiliated
companies with an investment-grade credit
rating. Additionally, 96% of our annualized
retail rental revenue was generated from
tenants with a service, non-discretionary,
and/or low price point component to their
business. We believe these characteristics
allow our tenants to operate effectively in
a variety of economic environments and
to compete effectively with e-commerce.
We view our tenants as clients, and we are
committed to helping them keep the cost
of occupancy low so they can grow their
business over time, and we can, in turn,
do the same.
Macroeconomic and geopolitical
uncertainty requires increased diligence and
a commitment to stringent underwriting
principles, but uncertainty also provides
opportunity. Our international expansion is
an example of capitalizing on uncertainty, as
a historically weak British Pound, driven by
Brexit uncertainty, contributed to favorable
transactional and financing terms on our
debut international acquisition. Further,
historically-low interest rates in the U.K.
provided favorable pricing on Sterling-
denominated debt.

REALTY INCOME 2019 ANNUAL REPORT 9
LOOKING AHEAD
Our strong track record of performance,
which now spans more than 50 years,
continued throughout 2019; however, we
constantly seek to continue building upon
our solid foundation. We entered 2020
well-positioned with a conservatively
capitalized balance sheet with strong
liquidity, a healthy global investment
pipeline, and an experienced team
prepared to execute on opportunistic
growth initiatives. Our size, scale, and cost of
capital advantages are fundamental to our
continued success. We believe that these
advantages, which are key differentiators
within the net lease sector, position us
to effectively expand our addressable
market internationally, as well as to execute
large-scale portfolio and sale-leaseback
transactions on a negotiated basis.
The efficiency of our business demonstrates
the scalability of our platform. In 2019,
we generated more than $1.42 billion of
revenue with approximately $1.34 billion of
Adjusted EBITDAre. Effectively, for every
dollar of revenue we generate, we retain
approximately 94 cents as earnings for
investors. This enables us to effectively
expand our business across new verticals,
and we continue to have the lowest general
and administrative expense ratio in the
net lease sector.
Our cost of capital, developed through
our track record of performance and loyal
shareholder support, affords us the ability
to pursue high-quality transactions while
generating meaningful earnings growth.
We are pleased to be included in the small
group of REITs with at least two ‘A’ credit
ratings by the major credit rating agencies,
with ratings of ‘A3’ and ‘A-’ by Moody’s and
S&P Global, respectively.
CONCLUSION
As I hope this letter shows, our strategy to
ensure the stability and growth in earnings
and dividends will continue to evolve, but our
commitment to our mission is steadfast. Across all
we do, we take the long view every day, in every
relationship, to provide stability to the clients
we serve, the team we nurture, the communities
we support, and the people who invest in us.
As we celebrated the 50th anniversary of our
company’s founding and the 25th anniversary
of our public listing, we took important
steps to position the company to drive
favorable shareholder results throughout the
company’s next chapter. Most notably, our
international expansion complements our
domestic business and significantly increases
our addressable market for growth. As we
continue to grow our company, we remain
cognizant of the values which have dictated
our prior successes.
Thank you for your continued support, and
for joining us on our journey to be a great
company and create a better world.
Sincerely,
Sumit Roy
President & Chief Executive Officer

1 0 REALTY INCOME 2019 ANNUAL REPORT
For the Years Ended December 31, 2019 2018 2017 2016 2015 2014 2013 2012 2011 2010
Total revenue(1) $1,423 $1,281 $1,170 $1,060 $980 $895 $760 $484 $422 $346
Net income available to common stockholders $436 $364 $302 $288 $257 $228 $204 $115 $133 $107
Funds from operations (“FFO”)(2) $1,040 $903 $773 $735 $652 $563 $462 $269 $249 $194
Adjusted funds from operations (“AFFO”)(2) $1,050 $925 $839 $736 $647 $562 $463 $274 $253 $197
Dividends paid to common stockholders $852 $762 $689 $611 $533 $479 $409 $236 $219 $183
AT YEAR END
Real estate at cost, before accumulated depreciation and amortization(1) $19,518 $16,541 $15,016$13,864 $12,297 $11,154 $9,899 $5,921 $4,972 $4,113
Number of properties 6,483 5,797 5,172 4,944 4,538 4,327 3,896 3,013 2,634 2,496
Gross leasable square feet (millions) 106 93 90 83 76 71 63 38 27 21
Properties acquired(4) 789 764 303 505 286 506 974 423 164 186
Cost of properties acquired(4) $3,715 $1,797 $1,519 $1,859 $1,259 $1,402 $4,670 $1,165 $1,016 $714
Property dispositions 93 128 59 77 38 46 75 44 26 28
Net proceeds from property dispositions $109 $142 $167 $91 $66 $107 $134 $51 $24 $27
Number of industries 50 48 47 47 47 47 47 44 38 32
Portfolio occupancy rate 98.6% 98.6% 98.4% 98.3% 98.4% 98.4% 98.2% 97.2% 96.7% 96.6%
Remaining weighted average lease term (years) 9.2 9.2 9.5 9.8 10.0 10.2 10.8 11.0 11.3 11.4
PER COMMON SHARE DATA(5)
Net income (diluted) $1.38 $1.26 $1.10 $1.13 $1.09 $1.04 $1.06 $0.86 $1.05 $1.01
Funds from operations (“FFO”)(2) $3.29 $3.12 $2.82 $2.88 $2.77 $2.58 $2.41 $2.02 $1.98 $1.83
Adjusted funds from operations (“AFFO”)(2) $3.32 $3.19 $3.06 $2.88 $2.74 $2.57 $2.41 $2.06 $2.01 $1.86
Dividends paid $2.711 $2.631 $2.527 $2.392 $2.271 $2.192 $2.147 $1.772 $1.737 $1.722
Annualized dividend amount(6) $2.73 $2.65 $2.55 $2.43 $2.29 $2.20 $2.19 $1.82 $1.75 $1.73
Common shares outstanding (millions) 334 304 284 260 250 225 207 133 133 118
INVESTMENT RESULTS
Closing price on December 31, $73.63 $63.04 $57.02 $57.48 $51.63 $47.71 $37.33 $40.21 $34.96 $34.20
Dividend yield(7)(8) 3.7% 4.2% 4.5% 4.6% 4.4% 5.9% 5.3% 5.1% 5.1% 6.6%
Total return to stockholders(9) 21.1% 15.2% 3.6% 16.0% 13.0% 33.7% (1.8%) 20.1% 7.3% 38.6%
Historical Financial Performance(UNAUDITED; DOLLARS IN MILLIONS, EXCEPT PER SHARE DATA)
(1) Foryearspriorto2016,totalrevenueincludesamountsreclassifiedtoincomefromdiscontinuedoperations,butexcludesgainonsales,tenantreimbursements,andrevenuefromCrestNetLease,asubsidiaryofRealtyIncome.ConsistentwithRealtyIncome’sfinancialreportingmethodologychanges,totalrevenuefor2016andlaterincludesrevenuefromCrestNetLease
(2)FFOandAFFOarenon-GAAPfinancialmeasures.RefertoManagement’sDiscussionandAnalysisintheCompany’s2019Form10-KforthedefinitionsofFFOandAFFOandareconciliationofeachtonetincomeavailabletocommonstockholders.For2012and2013,FFOhasbeenadjustedtoaddbackAmericanRealtyCapitalTrustmerger-relatedcosts
(3)Doesnotincludepropertiesheldforsale(4)IncludesnewpropertiesacquiredbyRealtyIncomeandCrestNetLeaseandpropertiesunderdevelopment,redevelopment,orexpansion(5)Allshareandpershareamountsreflectthe2-for-1stocksplitthatoccurredonDecember31,2004(6)AnnualizeddividendamountreflectstheDecemberdeclareddividendratepersharemultipliedby12
2009 2008 2007 2006 2005 2004 2003 2002 2001 2000 1999 1998 1997 1996 1995 1994
$329 $331 $296 $241 $198 $178 $150 $138 $121 $116 $105 $85 $68 $57 $52 $49
$107 $108 $116 $99 $90 $90 $77 $69 $58 $45 $41 $41 $35 $32 $26 $15
$191 $186 $190 $156 $130 $121 $105 $95 $78 $67 $66 $63 $52 $48 $40 $39
$193 $192 $193 $159 $131 $126 $107 $96 $79 $68 $66 $62 $52 $47 $40 $39
$178 $170 $158 $130 $109 $97 $84 $78 $65 $58 $56 $52 $44 $43 $37 $39
$3,439 $3,409 $3,239 $2,744 $2,096 $1,691 $1,533 $1,286 $1,178 $1,074 $1,017 $890 $700 $565 $515 $451
2,339 2,348 2,270 1,955 1,646 1,533 1,404 1,197 1,124 1,068 1,076 970 826 740 685 630
19 19 19 17 13 12 11 10 10 9 9 8 6 5 5 4
16 108 357 378 156 194 302 111 117 22 110 149 96 62 58 4
$58 $190 $534 $770 $487 $215 $372 $139 $156 $99 $181 $193 $142 $56 $65 $3
25 29 10 13 23 43 35 35 35 21 3 5 10 7 3 5
$20 $28 $7 $11 $23 $35 $23 $20 $40 $45 $9 $3 $4 $4 $1 $4
30 30 30 29 29 30 28 26 25 24 24 22 14 8 7 5
96.8% 97.0% 97.9% 98.7% 98.5% 97.9% 98.1% 97.7% 98.2% 97.7% 98.4% 99.5% 99.2% 99.1% 99.3% 99.4%
11.2 11.9 13.0 12.9 12.4 12.0 11.8 10.9 10.4 9.8 10.7 10.2 9.8 9.5 9.2 9.5
$1.03 $1.06 $1.16 $1.11 $1.12 $1.15 $1.08 $1.01 $0.99 $0.84 $0.76 $0.78 $0.74 $0.70 $0.63 $0.39
$1.84 $1.83 $1.89 $1.73 $1.62 $1.53 $1.47 $1.40 $1.33 $1.26 $1.23 $1.18 $1.11 $1.04 $1.00 $0.98
$1.86 $1.90 $1.92 $1.77 $1.63 $1.61 $1.50 $1.41 $1.34 $1.27 $1.24 $1.17 $1.10 $1.03 $0.98 $0.98
$1.707 $1.662 $1.560 $1.437 $1.346 $1.241 $1.181 $1.151 $1.121 $1.091 $1.043 $0.983 $0.946 $0.931 $0.913 $0.300
$1.72 $1.70 $1.64 $1.52 $1.40 $1.32 $1.20 $1.17 $1.14 $1.11 $1.08 $1.02 $0.96 $0.95 $0.93 $0.90
104 104 101 101 84 79 76 70 66 53 54 54 51 46 46 39
$25.91 $23.15 $27.02 $27.70 $21.62 $25.29 $20.00 $17.50 $14.70 $12.44 $10.31 $12.44 $12.72 $11.94 $11.25 $8.56
7.4% 6.1% 5.6% 6.7% 5.3% 6.2% 6.7% 7.8% 9.0% 10.6% 8.4% 7.7% 7.9% 8.3% 10.7% 9.9%
19.3% (8.2%) 3.2% 34.8% (9.2%) 32.7% 21.0% 26.9% 27.2% 31.2% (8.7%) 5.5% 14.5% 15.4% 42.0% 28.5%

REALTY INCOME 2019 ANNUAL REPORT 1 1
For the Years Ended December 31, 2019 2018 2017 2016 2015 2014 2013 2012 2011 2010
Total revenue(1) $1,423 $1,281 $1,170 $1,060 $980 $895 $760 $484 $422 $346
Net income available to common stockholders $436 $364 $302 $288 $257 $228 $204 $115 $133 $107
Funds from operations (“FFO”)(2) $1,040 $903 $773 $735 $652 $563 $462 $269 $249 $194
Adjusted funds from operations (“AFFO”)(2) $1,050 $925 $839 $736 $647 $562 $463 $274 $253 $197
Dividends paid to common stockholders $852 $762 $689 $611 $533 $479 $409 $236 $219 $183
AT YEAR END
Real estate at cost, before accumulated depreciation and amortization(1) $19,518 $16,541 $15,016$13,864 $12,297 $11,154 $9,899 $5,921 $4,972 $4,113
Number of properties 6,483 5,797 5,172 4,944 4,538 4,327 3,896 3,013 2,634 2,496
Gross leasable square feet (millions) 106 93 90 83 76 71 63 38 27 21
Properties acquired(4) 789 764 303 505 286 506 974 423 164 186
Cost of properties acquired(4) $3,715 $1,797 $1,519 $1,859 $1,259 $1,402 $4,670 $1,165 $1,016 $714
Property dispositions 93 128 59 77 38 46 75 44 26 28
Net proceeds from property dispositions $109 $142 $167 $91 $66 $107 $134 $51 $24 $27
Number of industries 50 48 47 47 47 47 47 44 38 32
Portfolio occupancy rate 98.6% 98.6% 98.4% 98.3% 98.4% 98.4% 98.2% 97.2% 96.7% 96.6%
Remaining weighted average lease term (years) 9.2 9.2 9.5 9.8 10.0 10.2 10.8 11.0 11.3 11.4
PER COMMON SHARE DATA(5)
Net income (diluted) $1.38 $1.26 $1.10 $1.13 $1.09 $1.04 $1.06 $0.86 $1.05 $1.01
Funds from operations (“FFO”)(2) $3.29 $3.12 $2.82 $2.88 $2.77 $2.58 $2.41 $2.02 $1.98 $1.83
Adjusted funds from operations (“AFFO”)(2) $3.32 $3.19 $3.06 $2.88 $2.74 $2.57 $2.41 $2.06 $2.01 $1.86
Dividends paid $2.711 $2.631 $2.527 $2.392 $2.271 $2.192 $2.147 $1.772 $1.737 $1.722
Annualized dividend amount(6) $2.73 $2.65 $2.55 $2.43 $2.29 $2.20 $2.19 $1.82 $1.75 $1.73
Common shares outstanding (millions) 334 304 284 260 250 225 207 133 133 118
INVESTMENT RESULTS
Closing price on December 31, $73.63 $63.04 $57.02 $57.48 $51.63 $47.71 $37.33 $40.21 $34.96 $34.20
Dividend yield(7)(8) 3.7% 4.2% 4.5% 4.6% 4.4% 5.9% 5.3% 5.1% 5.1% 6.6%
Total return to stockholders(9) 21.1% 15.2% 3.6% 16.0% 13.0% 33.7% (1.8%) 20.1% 7.3% 38.6%
2009 2008 2007 2006 2005 2004 2003 2002 2001 2000 1999 1998 1997 1996 1995 1994
$329 $331 $296 $241 $198 $178 $150 $138 $121 $116 $105 $85 $68 $57 $52 $49
$107 $108 $116 $99 $90 $90 $77 $69 $58 $45 $41 $41 $35 $32 $26 $15
$191 $186 $190 $156 $130 $121 $105 $95 $78 $67 $66 $63 $52 $48 $40 $39
$193 $192 $193 $159 $131 $126 $107 $96 $79 $68 $66 $62 $52 $47 $40 $39
$178 $170 $158 $130 $109 $97 $84 $78 $65 $58 $56 $52 $44 $43 $37 $39
$3,439 $3,409 $3,239 $2,744 $2,096 $1,691 $1,533 $1,286 $1,178 $1,074 $1,017 $890 $700 $565 $515 $451
2,339 2,348 2,270 1,955 1,646 1,533 1,404 1,197 1,124 1,068 1,076 970 826 740 685 630
19 19 19 17 13 12 11 10 10 9 9 8 6 5 5 4
16 108 357 378 156 194 302 111 117 22 110 149 96 62 58 4
$58 $190 $534 $770 $487 $215 $372 $139 $156 $99 $181 $193 $142 $56 $65 $3
25 29 10 13 23 43 35 35 35 21 3 5 10 7 3 5
$20 $28 $7 $11 $23 $35 $23 $20 $40 $45 $9 $3 $4 $4 $1 $4
30 30 30 29 29 30 28 26 25 24 24 22 14 8 7 5
96.8% 97.0% 97.9% 98.7% 98.5% 97.9% 98.1% 97.7% 98.2% 97.7% 98.4% 99.5% 99.2% 99.1% 99.3% 99.4%
11.2 11.9 13.0 12.9 12.4 12.0 11.8 10.9 10.4 9.8 10.7 10.2 9.8 9.5 9.2 9.5
$1.03 $1.06 $1.16 $1.11 $1.12 $1.15 $1.08 $1.01 $0.99 $0.84 $0.76 $0.78 $0.74 $0.70 $0.63 $0.39
$1.84 $1.83 $1.89 $1.73 $1.62 $1.53 $1.47 $1.40 $1.33 $1.26 $1.23 $1.18 $1.11 $1.04 $1.00 $0.98
$1.86 $1.90 $1.92 $1.77 $1.63 $1.61 $1.50 $1.41 $1.34 $1.27 $1.24 $1.17 $1.10 $1.03 $0.98 $0.98
$1.707 $1.662 $1.560 $1.437 $1.346 $1.241 $1.181 $1.151 $1.121 $1.091 $1.043 $0.983 $0.946 $0.931 $0.913 $0.300
$1.72 $1.70 $1.64 $1.52 $1.40 $1.32 $1.20 $1.17 $1.14 $1.11 $1.08 $1.02 $0.96 $0.95 $0.93 $0.90
104 104 101 101 84 79 76 70 66 53 54 54 51 46 46 39
$25.91 $23.15 $27.02 $27.70 $21.62 $25.29 $20.00 $17.50 $14.70 $12.44 $10.31 $12.44 $12.72 $11.94 $11.25 $8.56
7.4% 6.1% 5.6% 6.7% 5.3% 6.2% 6.7% 7.8% 9.0% 10.6% 8.4% 7.7% 7.9% 8.3% 10.7% 9.9%
19.3% (8.2%) 3.2% 34.8% (9.2%) 32.7% 21.0% 26.9% 27.2% 31.2% (8.7%) 5.5% 14.5% 15.4% 42.0% 28.5%
(7)Dividendyieldwascalculatedbydividingthedividendpaidpershare,duringtheyear,bytheclosingsharepriceonDecember31orthelasttradingdayoftheprecedingyear.Dividendyield
excludesspecialdividends(8)The1994dividendyieldisbasedontheannualizeddividendsfortheperiodfromAugust15,1994(thedateoftheconsolidationofthepredecessorstotheCompany)toDecember31,1994.The
1994totalreturnisbasedonthepricechangefromtheopeningonOctober18,1994(theCompany’sfirstdayoftrading)toDecember31,1994plustheannualizeddividendyield(9)Totalreturncalculatedasthedifferencebetweentheclosingstockpriceasofperiodendlesstheclosingstockpriceasofpreviousperiod,plusdividendspaidinperiod,dividedbyclosingstock
priceasofendofpreviousperiod.Doesnotincludereinvestmentofdividends

1 2 REALTY INCOME 2019 ANNUAL REPORT
Real Estate Portfolio
Our real estate portfolio of 6,483 properties
primarily consists of freestanding, single-tenant
commercial properties that are diversified by
tenant, industry, geography, and property type.
At the end of 2019, our properties were leased
to tenants operating across 50 industries and
located in 49 states, Puerto Rico and the United
Kingdom. Most of our properties continue to
be retail, with the largest asset type outside of
retail being industrial properties. Our tenant
base remains healthy with approximately half
of our annualized rental revenue generated from
properties leased to tenants, their subsidiaries or
affiliated companies, with an investment-grade
credit rating. Maintaining a diversified portfolio of
quality real estate leased to strong tenants helps
ensure the stability of revenue that supports the
payment of monthly dividends.
(1)Basedonrentalrevenueforthequarterended12/31/19
GEOGRAPHIC DIVERSIFICATIONAS A % OF REVENUE(1)
TEXAS 11.0%
CALIFORNIA 8.7%
ILLINOIS 5.9%
FLORIDA 5.5%
OHIO 4.7%
NEW YORK 4.3%
ALASKA, PUERTO RICO AND UNITED KINGDOM NOT TO SCALE
<1% 2–3%
3–4%
1–2%
4–5% 5–6%
6–11%
REALTY INCOME 2019 ANNUAL REPORT 1 3
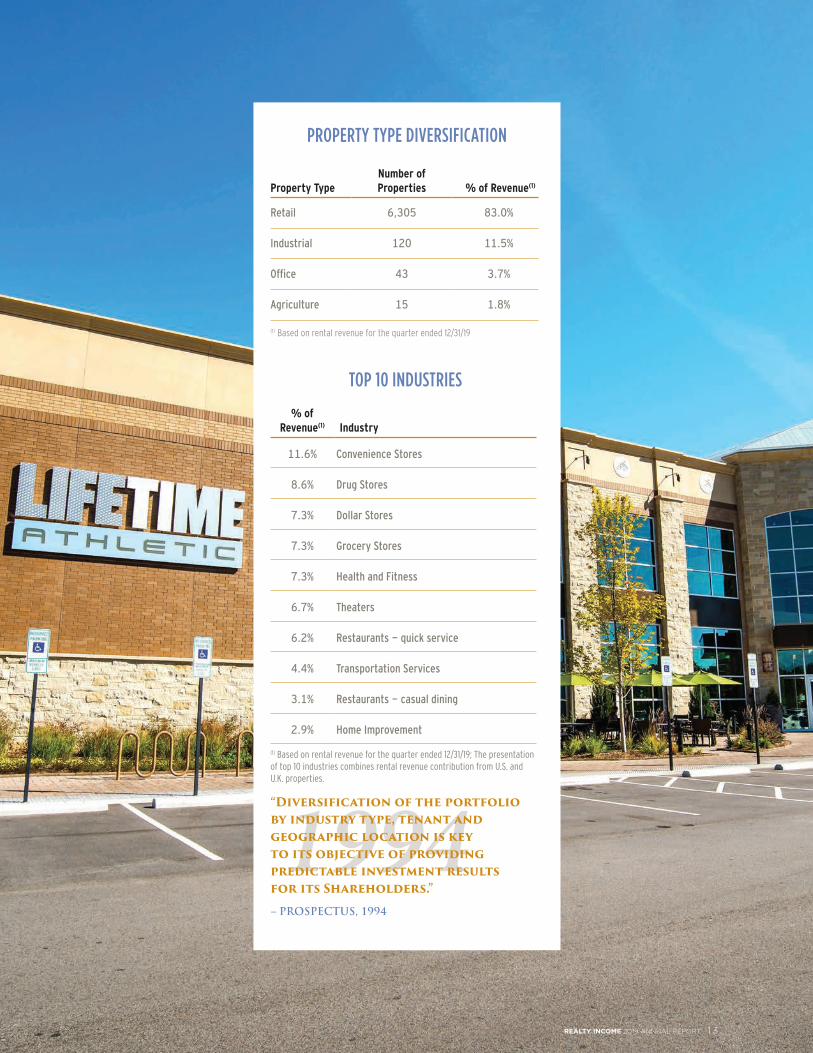
TOP 10 INDUSTRIES
% of Revenue(1) Industry
11.6% Convenience Stores
8.6% Drug Stores
7.3% Dollar Stores
7.3% Grocery Stores
7.3% Health and Fitness
6.7% Theaters
6.2% Restaurants - quick service
4.4% Transportation Services
3.1% Restaurants - casual dining
2.9% Home Improvement
(1)Basedonrentalrevenueforthequarterended12/31/19;Thepresentationoftop10industriescombinesrentalrevenuecontributionfromU.S.andU.K.properties.
Property TypeNumber ofProperties % of Revenue(1)
Retail 6,305 83.0%
Industrial 120 11.5%
Office 43 3.7%
Agriculture 15 1.8%
(1)Basedonrentalrevenueforthequarterended12/31/19
PROPERTY TYPE DIVERSIFICATION
“Diversification of the portfolioby industry type, tenant andgeographic location is key to its objective of providingpredictable investment results for its Shareholders.” – PROSPECTUS, 1994

1 4 REALTY INCOME 2019 ANNUAL REPORT
The strength of our portfolio is further
enhanced by the experience of our Asset
Management and Real Estate Operations
teams in maximizing the revenue generated
from our properties. As one of the most
seasoned net lease companies, we have
re-leased or sold over 3,100 properties
with expiring leases throughout our history as
a public company. This is unprecedented in our
sector and, as a result, we have achieved stable
occupancy that has never been below 96% at
year-end since 1994 while achieving a long-term
average rent recapture rate above 100% on
re-leasing activity since 1996.
Real Estate Portfolio (continued)
PORTFOLIO OCCUPANCY(1)
(1)Calculatedattheendofeachyearbythenumberofproperties
99.4
%
99.3
%
99.1%
99.2
%
99.5
%
98.4
%
97.7
%
98.2
%
97.7
%
98.1%
97.9
%
98.5
%
98.7
%
97.9
%
97.0
%
96.8
%
96.6
%
96.7
%
97.2
%
98.2
%
98.4
%
98.4
%
98.3
%
98.4
%
98.6
%
98
.6%
94 95 96 97 98 99 00 01 02 03 04 05 06 07 08 09 10 11 12 13 14 15 16 17 18 19

REALTY INCOME 2019 ANNUAL REPORT 1 5
TENANT DIVERSIFICATION
% of Revenue(1)
Number of Leases Tenant
6.1% 250 Walgreens*
4.8% 403 7-Eleven*
4.4% 752 Dollar General*
4.0% 41 FedEx*
3.5% 550 Dollar Tree / Family Dollar*
3.4% 58 LA Fitness
3.0% 34 AMC Theatres
2.9% 42 Regal Cinemas (Cineworld)
2.6% 54 Walmart / Sam's Club*
2.4% 15 Sainsbury's
2.1% 14 Lifetime Fitness
1.9% 285 Circle K (Couche-Tard)*
1.8% 15 BJ's Wholesale Clubs
1.7% 88 CVS Pharmacy*
1.7% 17 Treasury Wine Estates
1.6% 161 Super America (Marathon)*
1.6% 22 Kroger*
1.4% 206 GPM Investments / Fas Mart
1.3% 159 TBC Corp*
1.2% 17 Home Depot*
(1)Basedonannualizedrentalrevenueasof12/31/19*Investment-graderated
“Our Asset Management and Real
Estate Operations teams generate
long-term value in the portfolio
through active asset management,
driving internal growth and
positioning the portfolio for stability
through any economic environment.”
– Benjamin N. Fox, Executive Vice President, Asset Management & Real Estate Operations

1 6 REALTY INCOME 2019 ANNUAL REPORT
We focus on acquiring freestanding, single-
tenant commercial properties leased to high-
quality tenants under long-term, net lease
agreements, typically in excess of 10 years.
During 2019, we reviewed approximately $57
billion of investment opportunities that generally
satisfied one or more of these criteria. These
opportunities underwent a rigorous, multi-step
internal underwriting and legal diligence process,
resulting in the selection of over $3.7 billion of real
estate investments completed during the year.
The process begins with a review of the real
estate. We target properties located in significant
markets or strategic locations critical to
generating revenue for the tenant. We examine
the property-level attributes such as access and
signage, demographic trends relative to the
property’s intended use, potential alternative
uses, and overall viability of the market.
In addition to the real estate, we also carefully
review the characteristics, credit, and overall
financial strength of the tenant and its industry.
Our team of research professionals conducts
a thorough financial review and analysis of
the tenant, including an assessment of the store-
level performance of the retail operations, when
available, to try to identify the tenant’s highest-
performing locations. Our team stays abreast
of trends in the various industries and frequently
meets with management representatives within
these industries to better understand our
tenants’ operations.
The information gathered on the real estate,
lease characteristics, tenant, and industry
informs the appropriate price for an investment.
Our goal is to ensure the real estate that we
acquire is appropriately priced relative to
replacement cost and leased at rental rates
that are generally in line with market rent in
order to support strong long-term investment
returns generated by each asset. Our
Investment Committee collectively reviews these
characteristics and metrics to make investment
decisions. In addition, investment opportunities
above a certain investment amount require
approval by our Board of Directors. We believe
this rigorous selection process maintains the
quality of our investment portfolio and supports
the stability of our cash flow over time.
Disciplined Investment Process
TOTAL REVENUE(1)
(DOLLARS IN MILLIONS)
(1)Seepage10,footnote1,forthedefinitionoftotalrevenue
$49
$1,423
94 95 96 97 98 99 00 01 02 03 04 05 06 07 08 09 10 11 12 13 14 15 16 17 18 19
“Our strategic focus continues to be on
meaningfully increasing our growth rate
while maintaining our conservative risk
profile. Our international platform is the
first of various initiatives that are intended
to achieve this goal by significantly
expanding our total addressable market.
We are pleased with the strength of
the international investment outlook and
look forward to judiciously growing the
international business and other initiatives
in the coming years.”
– Neil Abraham, Executive Vice President, Chief Strategy Officer
“When the Partnerships were formed,the General Partners believed, andcontinue to believe, that thisinvestment strategy remains viableduring a variety of economic and real estate conditions over anextended period of time.” – PROSPECTUS, 1994

REALTY INCOME 2019 ANNUAL REPORT 1 7
YearAmount Sourced
Amount Acquired Selectivity(1)
2010 $5.7 $0.71 12%
2011 $13.3 $1.02 8%
2012 $17.0 $1.16 7%
2013 $39.4 $4.67 12%
2014 $24.3 $1.40 6%
2015 $31.7 $1.26 4%
2016 $28.5 $1.86 7%
2017 $30.4 $1.52 5%
2018 $32.1 $1.80 6%
2019 $57.4 $3.72 7%(1)Selectivityiscalculatedastheamountofacquisitionsacquireddivided
bytheamountofacquisitionssourced
ACQUISITIONS SELECTIVITY(DOLLARS IN BILLIONS)
“The investment objectives of thePartnerships were and continue to be to preserve original capital by owning real estate properties with no loans or encumbrances; to produce monthly spendableincome by preleasing each property to commercial retailtenants under long-term, triple-net lease agreements; and to hold properties to allow for the potential for long-termcapital appreciation.” – PROSPECTUS, 1994
“Our size, scale, and cost of capital
are important competitive advantages
within the net lease sector, and we
believe we are uniquely positioned to
pursue large-scale portfolio and sale-
leaseback transactions on a negotiated
basis. To generate investment activity,
our Acquisitions Department establishes
and maintains strong relationships with
tenants, property owners, developers,
brokers, and advisors.”
– Mark Hagan, Executive Vice President, Chief Investment Officer
1 8 REALTY INCOME 2019 ANNUAL REPORT
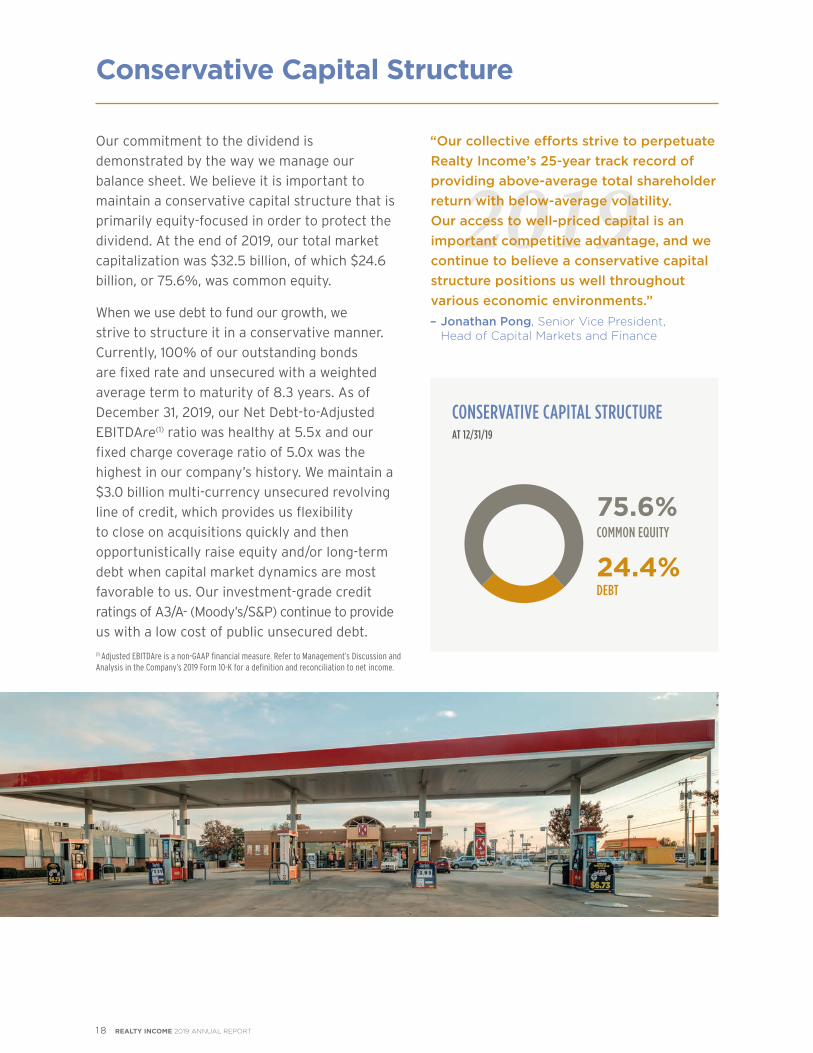
Our commitment to the dividend is
demonstrated by the way we manage our
balance sheet. We believe it is important to
maintain a conservative capital structure that is
primarily equity-focused in order to protect the
dividend. At the end of 2019, our total market
capitalization was $32.5 billion, of which $24.6
billion, or 75.6%, was common equity.
When we use debt to fund our growth, we
strive to structure it in a conservative manner.
Currently, 100% of our outstanding bonds
are fixed rate and unsecured with a weighted
average term to maturity of 8.3 years. As of
December 31, 2019, our Net Debt-to-Adjusted
EBITDAre(1) ratio was healthy at 5.5x and our
fixed charge coverage ratio of 5.0x was the
highest in our company’s history. We maintain a
$3.0 billion multi-currency unsecured revolving
line of credit, which provides us flexibility
to close on acquisitions quickly and then
opportunistically raise equity and/or long-term
debt when capital market dynamics are most
favorable to us. Our investment-grade credit
ratings of A3/A- (Moody’s/S&P) continue to provide
us with a low cost of public unsecured debt.
Conservative Capital Structure
CONSERVATIVE CAPITAL STRUCTUREAT 12/31/19
“Our collective efforts strive to perpetuate
Realty Income’s 25-year track record of
providing above-average total shareholder
return with below-average volatility.
Our access to well-priced capital is an
important competitive advantage, and we
continue to believe a conservative capital
structure positions us well throughout
various economic environments.”
– Jonathan Pong, Senior Vice President, Head of Capital Markets and Finance
75.6%COMMON EQUITY
24.4%DEBT
(1)AdjustedEBITDAreisanon-GAAPfinancialmeasure.RefertoManagement’sDiscussionandAnalysisintheCompany’s2019Form10-Kforadefinitionandreconciliationtonetincome.

As The Monthly Dividend Company®, we remain
committed to operating our company in a
manner that provides our shareholders with
dependable monthly dividends that increase
over time. At the core of every business decision
we make is the focus on positioning and
preparing our portfolio and balance sheet to
continue generating predictable cash flow. Our
commitment is evidenced by our track record
of dividend performance. Since our company’s
listing on the NYSE in 1994, we have increased
the dividend every year at a compound average
annual growth rate of approximately 4.5% and
have never reduced the dividend. We are one
of only three REITs in the S&P 500 Dividend
Aristocrats® index, which includes S&P 500
constituents that have increased their dividend
every year for the last 25 consecutive years.
REALTY INCOME 2019 ANNUAL REPORT 1 9
Dependable Monthly Dividends
(1)AnnualizeddividendamountreflectstheDecemberdeclareddividendratepersharemultipliedby12.AllinformationasofDecember31,2019.
CONSISTENT DIVIDEND GROWTHANNUALIZED DIVIDENDS PER SHARE AND DIVIDEND INCREASES(1)
94 95 96 97 98 99 00 01 02 03 04 05 06 07 08 09 10 11 12 13 14 15 16 17 18 19
$2.73
$0.90
89CONSECUTIVE QUARTERLY INCREASES
4.5%COMPOUND AVERAGE ANNUAL GROWTH RATE
104DIVIDEND INCREASES SINCE 1994 NYSE LISTING
“The investment objectives of the Company will be to pay regular cash dividends to its Shareholders from a portfolio of properties under long-term, triple-net lease agreements.” – PROSPECTUS, 1994

2 0 REALTY INCOME 2019 ANNUAL REPORT
We are committed to conducting our business
according to the highest ethical standards.
We are dedicated to operating our business
in an environmentally conscious manner
and upholding our corporate responsibilities
as a public company for the benefit of our
stakeholders - our shareholders, clients,
colleagues, and community.
In recent years, our environmental, social,
and governance (“ESG”) efforts have
quickly evolved from commitments to
action. We continue to focus on how best to
institutionalize efforts for a lasting and positive
impact. We strive to be a leader in the net lease
industry in ESG initiatives.
We believe that our commitment to corporate
responsibility, which encompasses ESG
principles, is critical to our performance and
long-term success, and that we all have a
shared responsibility to our community and
the planet. That responsibility starts with
our workforce and is demonstrated through
sound governance and our ethical operating
behaviors. The Nominating and Corporate
Governance Committee of our Board of
Directors has direct oversight of ESG matters.
In 2019, we approved resources needed to
advance our sustainability agenda, including
appointing a new dedicated Associate Vice
President of Sustainability. We envision
developments in the coming years as we build
out the strategy, by and on behalf of our internal
and external stakeholders, while engaging all
levels of our organization in the process.
Relationships with our stakeholders are key
to our success. Additionally, our corporate
partners help us achieve our mission.
Accordingly, we assess ways in which we can
generate and sustain value for all stakeholders.
Corporate Responsibility
We believe our dedication to corporate
responsibility fosters our ability to grow in a
sustainable manner.
Highlights of various environmental initiatives
during 2019 include:
• Established a Sustainability Department
• Appointed a new dedicated Associate
Vice President of Sustainability
• Expanded property acquisition diligence
to collect important environmental efficiency
characteristics and green building
certifications when available
• Continued tenant engagement to discuss
sustainable operations
• Partnered with certain tenants to implement
solar and electric vehicle charging installations
• Added a “Green Lease” clause to lease templates
• Our internal Green Team engaged in several
community volunteer events focused on
positively impacting the environment
• Increased employee engagement with
a quarterly Green Team newsletter and
additional educational events hosted
throughout the year
• Reviewed breakroom and restroom supplies to
substitute with recyclable, biodegradable or Forest
Stewardship Council (FSC) sourced materials
• Reduced single-use disposables at our
corporate headquarters
“Our focus is to conduct our business
with the utmost integrity, transparency,
respect and humility. We emphasize
this in our interactions with all of
our stakeholders, including our
shareholders, clients, colleagues
and our community.”
– Mike Pfeiffer, Executive Vice President, Chief Administrative Officer, General Counsel and Secretary

REALTY INCOME 2019 ANNUAL REPORT 2 1
Highlights of various social initiatives during
2019 include:
• Launched our first Employee Engagement Survey
• Participated in our Annual San Diego Habitat
for Humanity volunteer day and donation
• Enhanced onsite and offsite employee
training opportunities
• Increased our philanthropic efforts through
employee charity donation match and
“Dollars for Doers” volunteerism program
• Introduced new policies and events which
support gender equity and diversity, such
as expanded support for parental, maternity,
and disability leave
• Instituted a new professionally appropriate
dress code policy to accommodate our active
workforce
Highlights of various governance initiatives
during 2019 include:
• Announced the appointment of Christie Kelly
to the Board of Directors
• Maintained Nominating and Corporate
Governance Board Committee
oversight on ESG
• Engaged with shareholders representing
34% of ownership
Additional information on Realty Income’s
commitment to Corporate Responsibility
may be found at www.realtyincome.com/
corporate-responsibility.
“Our continued commitment to
corporate responsibility has united
our employees while strengthening
our company’s culture. A culture that
promotes individual philanthropy,
employee engagement, and encourages
personal and professional growth.
A positive workplace that inspires
new thinking that attracts and retains
world-class talent. Together, we’re a
socially responsible employer with an
aligned culture that in turn supports our
domestic and international growth.”
– Shannon Kehle, Senior Vice President, Human Resources
DONATED TO
39CHARITIES
CONTRIBUTED
900+VOLUNTEERS HOURS
RECYCLED
25,714POUNDS OF PAPER
2019 HIGHLIGHTS

2 2 REALTY INCOME 2019 ANNUAL REPORT
SELECT FINANCIAL DATA(1)
23 Consolidated Balance Sheets
24 Consolidated Statements of Income and Comprehensive Income
25 Consolidated Statements of Equity
26 Consolidated Statements of Cash Flows
(1) This financial data is derived from our audited financial statements found in the company’s 2019 Form 10-K

REALTY INCOME 2019 ANNUAL REPORT 2 3
Theaccompanyingnotestoconsolidatedfinancialstatementsareanintegralpartofthesestatementsandmaybefoundinthecompany’s2019Form10-K.
REALTY INCOME CORPORATION AND SUBSIDIARIES
Consolidated Balance SheetsAt December 31, 2019 and 2018(Dollars in thousands, except share data)
2019 2018ASSETS
Real estate, at cost:
Land $ 5,684,034 $ 4,682,660
Buildings and improvements 13,833,882 11,858,806
Total real estate, at cost 19,517,916 16,541,466
Less accumulated depreciation and amortization (3,117,919) (2,714,534)
Net real estate held for investment 16,399,997 13,826,932
Real estate held for sale, net 96,775 16,585
Net real estate 16,496,772 13,843,517
Cash and cash equivalents 54,011 10,387
Accounts receivable 181,969 144,991
Lease intangible assets, net 1,493,383 1,199,597
Other assets, net 328,661 61,991
Total assets $ 18,554,796 $ 15,260,483
LIABILITIES AND EQUITY
Distributions payable $ 76,728 $ 67,789
Accounts payable and accrued expenses 177,039 133,765
Lease intangible liabilities, net 333,103 310,866
Other liabilities 262,221 127,109
Line of credit payable 704,335 252,000
Term loans, net 499,044 568,610
Mortgages payable, net 410,119 302,569
Notes payable, net 6,288,049 5,376,797
Total liabilities 8,750,638 7,139,505
Commitments and contingencies
Stockholders’ equity:
Common stock and paid in capital, par value $0.01 per share,740,200,000 shares authorized, 333,619,106 shares issued and out-standing as of December 31, 2019 and 370,100,000 shares authorized, 303,742,090 shares issued and outstanding as of December 31, 2018
12,873,849 10,754,495
Distributions in excess of net income (3,082,291) (2,657,655)
Accumulated other comprehensive loss (17,102) (8,098)
Total stockholders’ equity 9,774,456 8,088,742
Noncontrolling interests 29,702 32,236
Total equity 9,804,158 8,120,978
Total liabilities and equity $ 18,554,796 $ 15,260,483
24 REALTY INCOME 2019 ANNUAL REPORT
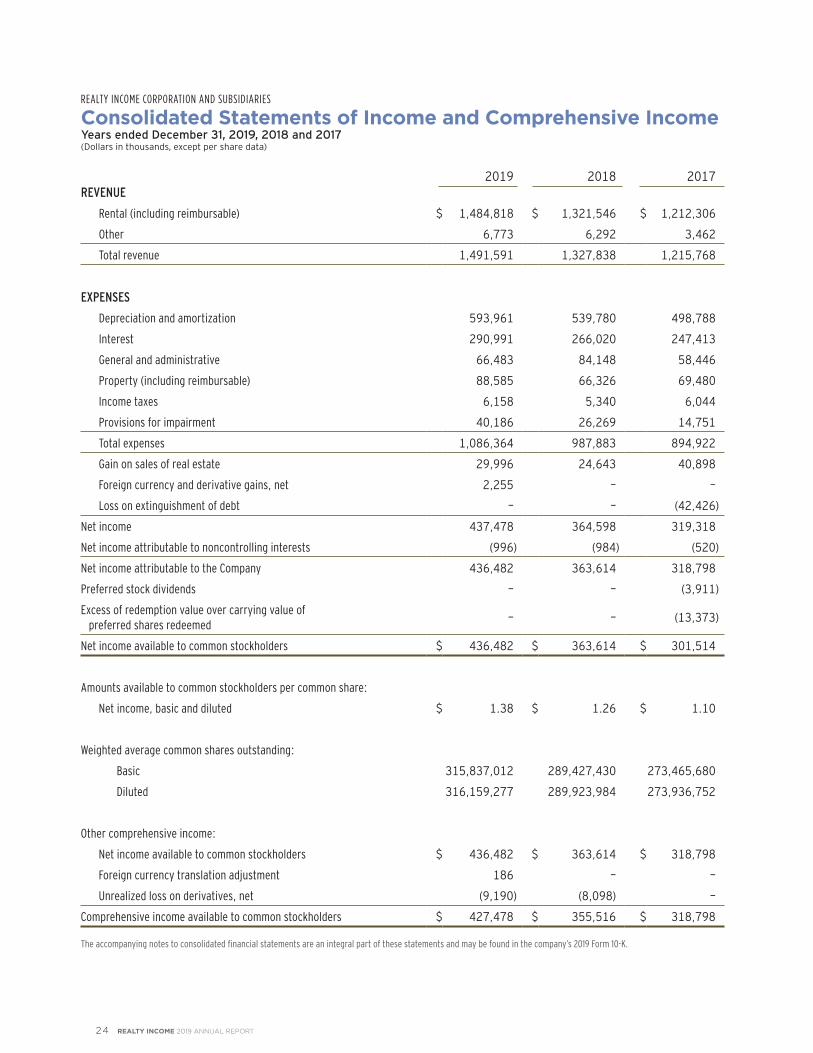
REALTY INCOME CORPORATION AND SUBSIDIARIES
Consolidated Statements of Income and Comprehensive IncomeYears ended December 31, 2019, 2018 and 2017(Dollars in thousands, except per share data)
2019 2018 2017REVENUE
Rental (including reimbursable) $ 1,484,818 $ 1,321,546 $ 1,212,306
Other 6,773 6,292 3,462
Total revenue 1,491,591 1,327,838 1,215,768
EXPENSES
Depreciation and amortization 593,961 539,780 498,788
Interest 290,991 266,020 247,413
General and administrative 66,483 84,148 58,446
Property (including reimbursable) 88,585 66,326 69,480
Income taxes 6,158 5,340 6,044
Provisions for impairment 40,186 26,269 14,751
Total expenses 1,086,364 987,883 894,922
Gain on sales of real estate 29,996 24,643 40,898
Foreign currency and derivative gains, net 2,255 — —
Lossonextinguishmentofdebt — — (42,426)
Net income 437,478 364,598 319,318
Net income attributable to noncontrolling interests (996) (984) (520)
Net income attributable to the Company 436,482 363,614 318,798
Preferred stock dividends — — (3,911)
Excess of redemption value over carrying value of preferred shares redeemed
— — (13,373)
Net income available to common stockholders $ 436,482 $ 363,614 $ 301,514
Amounts available to common stockholders per common share:
Net income, basic and diluted $ 1.38 $ 1.26 $ 1.10
Weighted average common shares outstanding:
Basic 315,837,012 289,427,430 273,465,680
Diluted 316,159,277 289,923,984 273,936,752
Other comprehensive income:
Net income available to common stockholders $ 436,482 $ 363,614 $ 318,798
Foreign currency translation adjustment 186 — —
Unrealized loss on derivatives, net (9,190) (8,098) —
Comprehensive income available to common stockholders $ 427,478 $ 355,516 $ 318,798
Theaccompanyingnotestoconsolidatedfinancialstatementsareanintegralpartofthesestatementsandmaybefoundinthecompany’s2019Form10-K.
REALTY INCOME 2019 ANNUAL REPORT 2 5
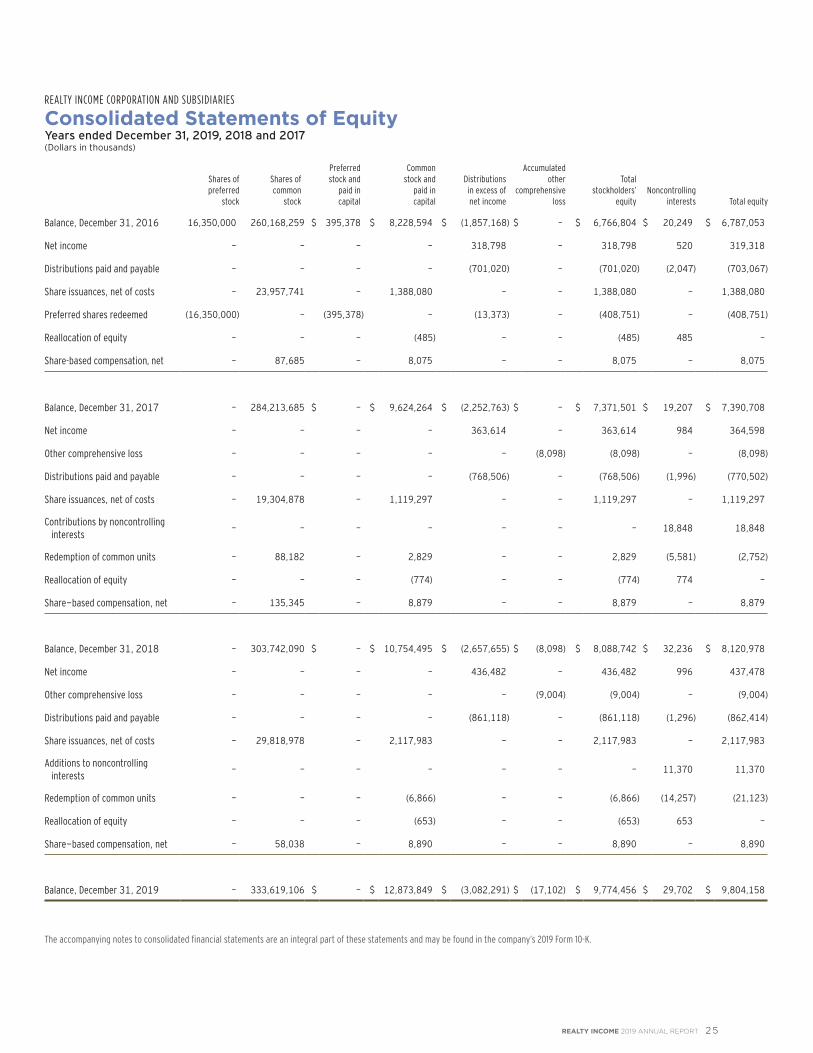
REALTY INCOME CORPORATION AND SUBSIDIARIES
Consolidated Statements of EquityYears ended December 31, 2019, 2018 and 2017(Dollars in thousands)
Shares of preferred
stock
Shares of common
stock
Preferred stock and
paid in capital
Common stock and
paid in capital
Distributions in excess of net income
Accumulated other
comprehensive loss
Total stockholders’
equityNoncontrolling
interests Total equity
Balance, December 31, 2016 16,350,000 260,168,259 $ 395,378 $ 8,228,594 $ (1,857,168) $ — $ 6,766,804 $ 20,249 $ 6,787,053
Net income — — — — 318,798 — 318,798 520 319,318
Distributions paid and payable — — — — (701,020) — (701,020) (2,047) (703,067)
Share issuances, net of costs — 23,957,741 — 1,388,080 — — 1,388,080 — 1,388,080
Preferred shares redeemed (16,350,000) — (395,378) — (13,373) — (408,751) — (408,751)
Reallocation of equity — — — (485) — — (485) 485 —
Share-basedcompensation,net — 87,685 — 8,075 — — 8,075 — 8,075
Balance, December 31, 2017 — 284,213,685 $ — $ 9,624,264 $ (2,252,763) $ — $ 7,371,501 $ 19,207 $ 7,390,708
Net income — — — — 363,614 — 363,614 984 364,598
Other comprehensive loss — — — — — (8,098) (8,098) — (8,098)
Distributions paid and payable — — — — (768,506) — (768,506) (1,996) (770,502)
Share issuances, net of costs — 19,304,878 — 1,119,297 — — 1,119,297 — 1,119,297
Contributions by noncontrolling interests
— — — — — — — 18,848 18,848
Redemption of common units — 88,182 — 2,829 — — 2,829 (5,581) (2,752)
Reallocation of equity — — — (774) — — (774) 774 —
Share-based compensation, net — 135,345 — 8,879 — — 8,879 — 8,879
Balance, December 31, 2018 — 303,742,090 $ — $ 10,754,495 $ (2,657,655) $ (8,098) $ 8,088,742 $ 32,236 $ 8,120,978
Net income — — — — 436,482 — 436,482 996 437,478
Other comprehensive loss — — — — — (9,004) (9,004) — (9,004)
Distributions paid and payable — — — — (861,118) — (861,118) (1,296) (862,414)
Share issuances, net of costs — 29,818,978 — 2,117,983 — — 2,117,983 — 2,117,983
Additions to noncontrolling interests
— — — — — — — 11,370 11,370
Redemption of common units — — — (6,866) — — (6,866) (14,257) (21,123)
Reallocation of equity — — — (653) — — (653) 653 —
Share-based compensation, net — 58,038 — 8,890 — — 8,890 — 8,890
Balance, December 31, 2019 — 333,619,106 $ — $ 12,873,849 $ (3,082,291) $ (17,102) $ 9,774,456 $ 29,702 $ 9,804,158
Theaccompanyingnotestoconsolidatedfinancialstatementsareanintegralpartofthesestatementsandmaybefoundinthecompany’s2019Form10-K.

2 6 REALTY INCOME 2019 ANNUAL REPORT
REALTY INCOME CORPORATION AND SUBSIDIARIES
Consolidated Statements of CashYears ended December 31, 2019, 2018 and 2017(Dollars in thousands)
2019 2018 2017CASH FLOWS FROM OPERATING ACTIVITIESNet income $ 437,478 $ 364,598 $ 319,318
Adjustments to net income:
Depreciation and amortization 593,961 539,780 498,788
Loss on extinguishment of debt — — 42,426
Amortization of share-based compensation 13,662 27,267 13,946
Non-cash revenue adjustments (9,338) (7,835) (3,927)
Amortization of net premiums on mortgages payable (1,415) (1,520) (466)
Amortization of net (premiums) discounts on notes payable (995) (1,256) 884
Amortization of deferred financing costs 9,795 9,021 8,274
Loss (gain) on interest rate swaps 2,752 (2,733) (3,250)
Foreign currency and derivative gains, net (2,255) — —
Gain on sales of real estate (29,996) (24,643) (40,898)
Provisions for impairment on real estate 40,186 26,269 14,751
Change in assets and liabilities
Accounts receivable and other assets (8,954) (6,901) (92)
Accounts payable, accrued expenses and other liabilities 24,056 18,695 26,096
Net cash provided by operating activities 1,068,937 940,742 875,850
CASH FLOWS FROM INVESTING ACTIVITIESInvestment in real estate (3,572,581) (1,769,335) (1,413,270)
Improvements to real estate, including leasing costs (23,536) (25,350) (15,247)
Proceeds from sales of real estate 108,911 142,286 166,976
Insurance and other proceeds received — 7,648 14,411
Collection of loans receivable — 5,267 123
Non-refundable escrow deposits (14,603) (200) (7,500)
Net cash used in investing activities (3,501,809) (1,639,684) (1,254,507)
CASH FLOWS FROM FINANCING ACTIVITIESCash distributions to common stockholders (852,134) (761,582) (689,294)
Cash dividends to preferred stockholders — — (6,168)
Borrowings on line of credit 2,816,632 1,774,000 1,465,000
Payments on line of credit (2,365,368) (1,632,000) (2,475,000)
Principal payment on term loan (70,000) (125,866) —
Proceeds from notes and bonds payable issued 897,664 497,500 2,033,041
Principal payment on notes payable — (350,000) (725,000)
Proceeds from term loan — 250,000 —
Payments upon extinguishment of debt — — (41,643)
Principal payments on mortgages payable (20,723) (21,905) (139,725)
Redemption of preferred stock — — (408,750)
Proceeds from common stock offerings, net 845,061 — 704,938
Proceeds from dividend reinvestment and stock purchase plan 8,437 9,114 69,931
Proceeds from At-the-Market (ATM) program 1,264,518 1,125,364 621,697
Redemption of common units (21,123) (2,752) —
Distributions to noncontrolling interests (1,342) (1,930) (2,043)
Net receipts on derivative settlements 4,881 - -
Debt issuance costs (9,129) (18,685) (17,510)
Other items, including shares withheld upon vesting (4,772) (33,387) (14,356)
Net cash provided by financing activities 2,492,602 707,871 375,118
Effect of exchange rate changes on cash and cash equivalents (9,796) — —
Net increase (decrease) in cash, cash equivalents and restricted cash 49,934 8,929 (3,539)
Cash, cash equivalents and restricted cash, beginning of period 21,071 12,142 15,681
Cash, cash equivalents and restricted cash, end of period $ 71,005 $ 21,071 $ 12,142
Theaccompanyingnotestoconsolidatedfinancialstatementsareanintegralpartofthesestatementsandmaybefoundinthecompany’s2019Form10-K.
Flows

Note:Thedividendyieldsarecalculatedasannualizeddividendsbasedonthelastdividendpaidinapplicabletimeperioddividedbytheclosingpriceasofperiodend.Dividendyieldsources:NAREITwebsiteandBloomberg,exceptforthe1994NASDAQdividendyieldwhichwassourcedfromDatastream/ThomsonFinancial.(1) FTSENAREITUSEquityREITIndex,asperNAREITwebsite. (2)Calculatedasthedifferencebetweentheclosingstockpriceasofperiodendlesstheclosingstockpriceasofpreviousperiod,plusdividendspaidinperiod,dividedbyclosingstockprice
asofendofpreviousperiod.Doesnotincludereinvestmentofdividendsfortheannualpercentages. (3)Includesreinvestmentofdividends.Source:NAREITwebsiteandFactset. (4)Priceonlyindex,doesnotincludedividendsasNASDAQdidnotreporttotalreturnmetricsfortheentiretyofthemeasurementperiod.Source:Factset. (5)TheCompoundAverageAnnualTotalReturnratesarecalculatedinthesamemannerforeachperiodfromRealtyIncome’sNYSElistingonOctober18,1994throughDecember31,2019,and
(exceptforNASDAQ)assumereinvestmentofdividends.Pastperformancedoesnotguaranteefutureperformance.RealtyIncomepresentsthisdataforinformationalpurposesonlyandmakesnorepresentationaboutitsfutureperformanceorhowitwillcompareinperformancetootherindicesinthefuture.
Realty Income Equity REIT Index(1)
Dow Jones Industrial Average S&P 500 NASDAQ Composite
DIVIDEND YIELD
TOTAL RETURN(2)
DIVIDEND YIELD
TOTAL RETURN(3)
DIVIDEND YIELD
TOTAL RETURN(3)
DIVIDEND YIELD
TOTAL RETURN(3)
DIVIDEND YIELD
TOTAL RETURN(4)
10/18–12/31 1994 10.5% 10.8% 7.7% 0.0% 2.9% (1.6%) 2.9% (1.2%) 0.5% (1.7%)
1995 8.3% 42.0% 7.4% 15.3% 2.4% 36.9% 2.3% 37.6% 0.6% 39.9%
1996 7.9% 15.4% 6.1% 35.3% 2.2% 28.9% 2.0% 23.0% 0.2% 22.7%
1997 7.5% 14.5% 5.5% 20.3% 1.8% 24.9% 1.6% 33.4% 0.5% 21.6%
1998 8.2% 5.5% 7.5% (17.5%) 1.7% 18.1% 1.3% 28.6% 0.3% 39.6%
1999 10.5% (8.7%) 8.7% (4.6%) 1.3% 27.2% 1.1% 21.0% 0.2% 85.6%
2000 8.9% 31.2% 7.5% 26.4% 1.5% (4.7%) 1.2% (9.1%) 0.3% (39.3%)
2001 7.8% 27.2% 7.1% 13.9% 1.9% (5.5%) 1.4% (11.9%) 0.3% (21.1%)
2002 6.7% 26.9% 7.1% 3.8% 2.6% (15.0%) 1.9% (22.1%) 0.5% (31.5%)
2003 6.0% 21.0% 5.5% 37.1% 2.3% 28.3% 1.8% 28.7% 0.6% 50.0%
2004 5.2% 32.7% 4.7% 31.6% 2.2% 5.6% 1.8% 10.9% 0.6% 8.6%
2005 6.5% (9.2%) 4.6% 12.2% 2.6% 1.7% 1.9% 4.9% 0.9% 1.4%
2006 5.5% 34.8% 3.7% 35.1% 2.5% 19.0% 1.9% 15.8% 0.8% 9.5%
2007 6.1% 3.2% 4.9% (15.7%) 2.7% 8.8% 2.1% 5.5% 0.8% 9.8%
2008 7.3% (8.2%) 7.6% (37.7%) 3.6% (31.8%) 3.2% (37.0%) 1.3% (40.5%)
2009 6.6% 19.3% 3.7% 28.0% 2.6% 22.6% 2.0% 26.5% 1.0% 43.9%
2010 5.1% 38.6% 3.5% 27.9% 2.6% 14.0% 1.9% 15.1% 1.2% 16.9%
2011 5.0% 7.3% 3.8% 8.3% 2.8% 8.3% 2.3% 2.1% 1.3% (1.8%)
2012 4.5% 20.1% 3.5% 19.7% 3.0% 10.2% 2.5% 16.0% 2.6% 15.9%
2013 5.8% (1.8%) 3.9% 2.9% 2.3% 29.6% 2.0% 32.4% 1.4% 38.3%
2014 4.6% 33.7% 3.6% 28.0% 2.3% 10.0% 2.0% 13.7% 1.3% 13.4%
2015 4.4% 13.0% 3.9% 2.8% 2.6% 0.2% 2.2% 1.4% 1.4% 5.7%
2016 4.2% 16.0% 4.0% 8.6% 2.5% 16.5% 2.1% 12.0% 1.4% 7.5%
2017 4.5% 3.6% 3.9% 8.7% 2.2% 28.1% 1.9% 21.8% 1.1% 28.2%
2018 4.2% 15.2% 4.4% (4.0%) 2.5% (3.5%) 2.2% (4.4%) 1.4% (3.9%)
2019 3.7% 21.1% 3.7% 28.7% 2.4% 25.3% 1.9% 31.5% 1.1% 35.2%
COMPOUND AVERAGE ANNUAL TOTAL RETURN(5)
16.5% 10.8% 10.7% 10.1% 10.3%
Realty Income Performance vs. Major Stock Indices
REALTY INCOME 2019 ANNUAL REPORT 27

2 8 REALTY INCOME 2019 ANNUAL REPORT
REALTY INCOME CORPORATION
RUSSELL 2000
S&P 500
REALTY INCOME PEER GROUP INDEX*
80
12/31/14 12/31/15 12/31/16 12/31/17 12/31/18 12/31/19
100
120
140
160
180
200
IN
DE
X
VA
LU
E
** Realty Income Peer Group index consists of 18 companies with an implied market capitalization between $3.8 billion and $49.8 billion as of December 31, 2019.
P E R I O D E N D I N G
I N D E X 12/31/14 12/31/15 12/31/16 12/31/17 12/31/18 12/31/19
Realty Income Corporation 100.00 113.38 131.27 136.10 157.78 191.31
Russell 2000 100.00 95.59 115.96 132.95 118.31 148.50
S&P 500 100.00 101.38 113.51 138.28 132.23 173.86
Realty Income Peer Group Index* 100.00 102.19 108.94 113.93 109.43 137.72
Total Return Performance

REALTY INCOME 2019 ANNUAL REPORT 2 9
TRANSFER AGENT
For shareholder administration and account information, please visit Computershare’s website at www.computershare.com or call toll-free at 1-877-218-2434.
INDEPENDENT REGISTERED
PUBLIC ACCOUNTING FIRM
KPMG LLP San Diego, CA
FOR ADDITIONAL
CORPORATE INFORMATION
Visit the Realty Income corporate website at www.realtyincome.com
Contact your financial advisor, or Realty Income at: 877-924-6266 [email protected]
Copies of Realty Income’s Annual Report are available upon written request to: REALTY INCOME CORPORATION Attention: Investor Relations 11995 El Camino Real San Diego, CA 92130
BACK: Ronald L. Merriman, Michael D. McKee, Sumit Roy, Christie Kelly FRONT: A. Larry Chapman, Priya Cherian Huskins, Reginald H. Gilyard, Kathleen R. Allen, Gregory T. McLaughlin, Gerardo I. Lopez
Company InformationDIRECTORS
Gerardo I. LopezOperating Partner and Head of the Operating Group, SoftBank Investment Advisers
Michael D. McKeeNon-Executive ChairmanPrincipal, The Contrarian Group
Gregory T. McLaughlinChief Executive Officer, PGA TOUR First Tee Foundation
Ronald L. MerrimanRetired Vice Chair and Partner, KPMG LLP
Sumit RoyPresident & Chief Executive Officer
Kathleen R. Allen, Ph.D.Founding Director, Center for Technology Commercialization,University of Southern California
A. Larry ChapmanRetired, Executive Vice President,Head of Commercial Real Estate,Wells Fargo Bank
Reginald H. GilyardSenior Advisor, Boston Consulting Group, Inc.
Priya Cherian HuskinsSenior Vice President and Partner, Woodruff-Sawyer & Co.
Christie KellyFormer Global Chief Financial Officer, Jones Lang LaSalle Incorporated
Michael R. PfeifferExecutive Vice President, Chief Administrative Officer, General Counsel and Secretary
Neil AbrahamExecutive Vice President, Chief Strategy Officer
Scott KohnenSenior Vice President, Research
Shannon KehleSenior Vice President, Human Resources
Sean P. NugentSenior Vice President, Controller
Jonathan PongSenior Vice President, Head of Capital Markets and Finance
Benjamin N. FoxExecutive Vice President, Asset Management & Real Estate Operations
Mark HaganExecutive Vice President, Chief Investment Officer
Shannon JensenSenior Vice President, Associate General Counsel and Assistant Secretary
Ross EdwardsSenior Vice President, Leasing & Real Estate Operations
Janeen S. DrakulichSenior Vice President, Development
TJ ChunSenior Vice President, Investments & Head of Asset Management
Cary WenthurSenior Vice President, Managing Director - Acquisitions
Lori SatterfieldSenior Vice President, Associate General Counsel, Asset Management & Real Estate Operations
EXECUTIVE & SENIOR OFFICERS
Sumit RoyPresident & Chief Executive Officer
April LittleVice President, Acquisitions
Steve BurchettVice President, Senior Legal Counsel
Jonathan KresserVice President, Head of Internal Audit
Michael LeeVice President, Tax Director
Jill CossaboomVice President, Assistant Controller, Systems
John R. CouvillionVice President, Real Estate Development
Kristin FerrellVice President, Head of Lease Administration
Elizabeth CateVice President, Asset Management
Kyle CampbellVice President, Senior Legal Counsel, Risk Management
Matt RennerVice President, Assistant Controller, Corporate Accounting
Garret PavelkoVice President, Asset Management, Office & Industrial
ADDITIONAL OFFICERS
Ann ZhangVice President, Assistant Controller, Property Accounting
Joe StewartVice President, Information Technology

11995 EL CAMINO REAL
SAN DIEGO, CA 92130
WWW.REALTYINCOME.COM