Embed Size (px)
Citation preview

RADIANT HEAT EFFECTS ON CERAMIC ARTIFACTS FROM THE AMERICAN
SOUTHWEST: FROM EXPERIMENTAL RESULTS TO SITE TREATMENT GUIDELINES
By
REBEKAH RENEE KNEIFEL
B.A., Anthropology Western Washington University, Bellingham, WA, 2012
Thesis
presented in partial fulfillment of the requirements
for the degree of
Master of Arts
in Anthropology
The University of Montana
Missoula, MT
May 2015
Approved by:
Sandy Ross, Dean of The Graduate School
Graduate School
Dr. John Douglas, Chair
Anthropology
Dr. Anna Prentiss
Anthropology
Dr. Rachel Loehman
Geography

ii
ABSTRACT
Kneifel, Rebekah, M.A., May 2015 Anthropology
Radiant Heat Effects on Ceramic Artifacts from the American Southwest: From Experimental
Results to Site Treatment Guidelines
Chairperson: Dr. John Douglas
Archaeological assemblages in the American Southwest are currently subjected to
periodic wildfires and prescribed burns, and have been exposed to fires in the past. Ceramics are
a key constituent of these assemblages, leading to questions regarding the effects of post-
depositional heat exposure on pottery. Alterations of ceramic surface appearance and other
attributes have been observed following wildfires, and such changes are significant because
intact ceramics provide important temporal context and social information. Over the past 150
years, southwestern wildfires have shifted away from the historical high-frequency, low-severity
regime; thus, cultural resources can be exposed to fires that are potentially more damaging than
have occurred in the past. The range of fire environments and the duration and intensity of
heating that result in damages to ceramic artifacts have not been previously systematically
assessed. Results from laboratory tests conducted as part of the Joint Fire Science Program-
funded ArcBurn project demonstrate that radiant heat fire environments, sustained dose, and
ceramic category are important determinates for predicting the patterns of alteration. Results can
be used to identify fire environments that cause loss of cultural information from artifact
assemblages in order to develop management treatments and procedures to guide archaeological
preservation in fire-prone landscapes.

iii
ACKNOWLEDGEMENTS
It is a pleasure to thank those who made this thesis possible. First I’d like to thank my
committee chair, Dr. John Douglas, for sharing his valuable expertise on Southwestern ceramics,
as well as his guidance and patience throughout the entire writing process. The thesis would also
not be possible without the generosity of Dr. Rachel Loehman, the principal investigator of the
ArcBurn project, who permitted the use of project data and sat on my committee as well. I also
deeply appreciate the contributions and insights of committee member Dr. Anna Prentiss. The
foundation of this thesis heavily relied on the ArcBurn specialists: Connie Constan, Jim Reardon,
Anastasia Steffen, Jennifer Dyer, Zander Evans, Bret Butler and Megan Friggens. Lastly, I
would like to acknowledge Faith Ann Heinsch, Jason Forthofer and Sarah Flanary from the
Missoula Fire Sciences Laboratory for their help on this project. Thank you all for your support,
I couldn’t have done it without you.

iv
TABLE OF CONTENTS
Chapter 1. Introduction……………………………………………………………………………1
Literature Review of Experimental Approaches to Fire Damage of Artifacts…………...…...6
Chapter 2. Cultural and Environmental Background……………...…………………………… ..9
Cultural and Artifact Background………………………………………………………….....9
Fire history, fire ecology, and fire behavior……………………..……………………...…...17
Chapter 3. Materials and Methods………………………………………………………………22
Radiant Heat………………………………………………………………………...……….22
Preservation Guide…………….…………………………………………………………….32
Chapter 4. Results…………………………………………………………………………….….33
Textured Utility: 600ºC x 60 sec…………………………………………………………….33
Textured Utility: 600ºC x 90 sec…………………………………………………………….35
Textured Utility: 900ºC x 60 sec…………………………………………………………….36
Textured Utility: 900ºC x 90 sec…………………………………………………………….38
Carbon Paint: 600ºC x 60 sec………………………………………………………………..39
Carbon Paint: 600ºC x 90 sec………………………………………………………………..41
Carbon Paint: 900ºC x 60 sec………………………………………………………………..42
Carbon Paint: 600ºC x 90 sec………………………………………………………………..44
Mineral Paint: 600ºC x 60 sec……………………………………………………………….45
Mineral Paint: 600ºC x 90 sec……………………………………………………………….47
Mineral Paint: 900ºC x 60 sec……………………………………………………………….48
Mineral Paint: 900ºC x 90 sec……………………………………………………………….50
Plain Utility: 600ºC x 60 sec…………………………………………………………………51
Plain Utility: 600ºC x 90 sec…………………………………………………………………53
Plain Utility: 900ºC x 60 sec…………………………………………………………………54
Plain Utility: 900ºC x 90 sec…………………………………………………………………55
Glaze Paint: 600ºC x 60 sec…….……………………………………………………………57
Glaze Paint: 600ºC x 90 sec………………………………………………………………….58
Glaze Paint: 900ºC x 60 sec……………………………………………………………….....59
Glaze Paint: 900ºC x 90 sec……………………………………..…………………………...61
Chapter 5. Conclusions……………….………………………………………………………….64
Conclusions…………………………………………………………………………………..64
Future Work………………………………………………………………………………….76
References Cited………………………………………………………………………………....78
Appendix A. Experimental Data………………………………………………………………....83

v
LIST OF FIGURES
Figure 1.1. Examples of ArcBurn ceramic categories……………………………………………5
Figure 2.1. Map of Southwestern US outlining Hohokam, Mogollon and Ancestral Puebloan
culture boundaries as well as the ArcBurn study area …………………………………………..10
Figure 2.2. Fire Triangle………………………………………………………………………....17
Figure 2.3. Map of fire severity in the Jemez Mountians of north-central New Mexico.….........21
Figure 3.1. Photo light box……………………………………………………………………....26
Figure 3.2. Arrangement of painted sherds (on left) and utility sherds (on right)…………….…27
Figure 3.3. Kiln with firebricks and slot for inserting and removing sand bed……………….…28
Figure 3.4. Sand bed and thermocouples…………………………………………………….…..29
Figure 3.5. Data logger setup…………………………………………………………………….30
Figure 4.1. Textured utility 600ºC x 60 sec typical effects………………………………………33
Figure 4.2. Textured utility 600ºC x 90 sec typical effects………………………………………35
Figure 4.3. Textured utility 900ºC x 60 sec typical effects………………………………………36
Figure 4.4. Textured utility 900ºC x 90 sec typical effects………………………………………38
Figure 4.5. Carbon paint 600ºC x 60 sec typical effects…………………………………………39
Figure 4.6. Carbon paint 600ºC x 90 sec typical effects…………………………………………41
Figure 4.7. Carbon paint 900ºC x 60 sec typical effects…………………………………………42
Figure 4.8. Carbon paint 900ºC x 90 sec typical effects…………………………………………44
Figure 4.9. Mineral paint 600ºC x 60 sec typical effects………………………………………...45
Figure 4.10. Mineral paint 600ºC x 90 sec typical effects……………………………………….47
Figure 4.11. Mineral paint 900ºC x 60 sec typical effects……………………………………….48
Figure 4.12. Mineral paint 900ºC x 90 sec typical effects……………………………………….50
Figure 4.13. Plain utility 600ºC x 60 sec typical effects…………………………………………51
Figure 4.14. Plain utility 600ºC x 90 sec typical effects…………………………………………53
Figure 4.15. Plain utility 900ºC x 60 sec typical effects…………………………………………54
Figure 4.16. Plain utility 900ºC x 90 sec typical effects…………………………………………55
Figure 4.17. Glaze paint 600ºC x 60 sec typical effects……………………………………..…..57
Figure 4.18. Glaze paint 600ºC x 90 sec typical effects…………………………………………58
Figure 4.19. Glaze paint 900ºC x 60 sec typical effects…………………………………………59
Figure 4.20. Glaze paint 900ºC x 90 sec typical effects…………………………..……………..61
Figure 5.1. Prototype preservation guide cover page……………………………………………69
Figure 5.2. Prototype preservation guide page 1………………………………………………...70
Figure 5.3. Prototype preservation guide page 2………………………………………………...71
Figure 5.4. Prototype preservation guide page 3………………………………………………...72
Figure 5.5. Prototype preservation guide page 4………………………………………………...73
Figure 5.6. Prototype preservation guide page 5………………………………………………...74
Figure 5.7. Prototype preservation guide page 6………………………………………………...75
Figure 5.8. Prototype preservation guide page 7…………………………..…………………….76

vi
LIST OF TABLES
Table 1.1. Terms used throughout this thesis………………………...…………………………...3
Table 1.2. Summary of experimental work pertaining to thermal effects on ceramics...................6
Table 2.1. Pecos Classification of Ancestral Puebloan chronology as outlined by Ruscavage-Barz
(1999:13-14) and Reyman (1993), and classification of Northern Rio Grande chronology as
outlined by Wendorf and Reed (1955).…………………..………………………………...…….11
Table 3.1. Definitions of thermal effects to ceramics.…………………………………………...23
Table 4.1. Summary table of radiant heat effects………………………………………………..62
Table 4.2. Weight (g) change table developed by Constan (personal communication, 2015)…..63
Table 4.3. Hardness change, measured by Constan (personal communication, 2015)…………..63
Table 4.4. Core pattern change, measured by Constan (personal communication, 2015)……….64
Table 5.1. Determination of which kiln environments are damaging to ceramic categories…….66
Table A.1. Kneifel’s lab notes………………………………………………………...…………83

1
Chapter 1. Introduction
Over the centuries, ecological structures in the United States have been altered due to
human action and climate change. One example of this is wildfires, which have become larger
and more severe in recent decades across many regions, including the American Southwest
(Allen 2001; Romme et al. 2009). Although wildfires can be beneficial for the rejuvenation of
natural resources that are fire-adapted or fire-dependent, other resources, such as archaeological
sites, are non-renewable and can be damaged or destroyed by wildfires or prescribed burns. This
damage thus becomes an issue of permanent loss of cultural heritage in fire-prone landscapes.
The topic for this thesis was established by the research project entitled Linking Field
Based and Experimental Methods to Quantify, Predict and Manage Fire Effects on Cultural
Resources, hereafter referred to by its working title, ArcBurn. This project is led by principal
investigator Dr. Rachel Loehman of the US Geological Survey, and is a collaborative project of
archaeologists, fire ecologists, fire behavior specialists, and foresters from the US Forest Service,
US Geological Survey, National Park Service, The Forest Guild, and southwestern tribes.
ArcBurn is funded by the Joint Fire Science Program, a collaborative interagency organization in
the Department of the Interior that funds scientific research on wildland fires and distributes
results to help policymakers, fire managers and practitioners make sound decisions
(http://www.firescience.gov/JFSP_about_us.cfm). The overarching goal of the ArcBurn project
is to better understand effects of wildfires and prescribed burns on archaeological resources,
using rigorous fire effects testing and analysis in wildfire and controlled laboratory settings.
Project collaborators will then translate experimental results into guidelines to help forest and
fire managers use the best available science to make decisions about how to protect cultural
resources during fuel treatments, prescribed fire, wildfire suppression, and post-fire

2
rehabilitation. The controlled laboratory experiments are conducted at the Missoula Fire Sciences
Laboratory in Missoula, Montana on three artifact types found in the culture-rich north-central
region of New Mexico: ceramics, obsidian, and welded tuff masonry blocks (architectural stone).
These three artifact types are tested in three fire environments common to the region: smoldering
(ground fire), flame (surface fire) and radiant heat (crown fire/slash pile burn).
There are many challenges to replicating fire environments in a lab and measuring their
effects on materials, so prior to testing, Dr. Loehman assembled a team of consultants and co-
principal investigators. Each expert was chosen based on their specialist knowledge of particular
artifacts, fire behavior, engineering, material sciences or forestry: Bret Butler and Jim Reardon
(USFS Missoula Fire Sciences Laboratory), Jennifer Dyer (USFS Six Rivers National Forest),
Connie Constan (USFS Santa Fe National Forest), Jamie Civitello and Anastasia Steffen (Valles
Caldera National Preserve), Rory Gauthier (National Park Service, Bandelier National Park),
Alexander Evans (The Forest Guild), and Ronald Loehman (University of New Mexico). Many
of these consultants work for northern New Mexico land management organizations and are
invested in learning how wildfires and prescribed burns, which are common in the area, affect
their local archaeological resources so that they can better manage the effects from severe fires.
This thesis focuses on one component of the experimental work conducted for the
ArcBurn project: effects of radiant heat on ceramics, and potential loss of information that might
result from exposure to crown fire or slash fire environments. I then demonstrate how this
information can be used to develop treatment guidelines to reduce damages and loss of cultural
information resulting from fire exposure. Throughout this document, terms specific to this study
are employed, and their definitions can be found in Table 1.1.

3
Table 1.1. Terms used throughout this thesis (Fire-related definitions adapted from the National
Wildfire Coordinating Group, http://www.nwcg.gov/pms/pubs/glossary/index.htm).
Term Definition
Category Sherds that share key decoration, slip, and paste attributes and are
therefore considered equivalent for the purposes of this study; for
example plain utility, textured utility, glaze paint, mineral paint, and
carbon paint.
Crown Fire A fire that advances to the tops of trees or shrubs more or less
independent of a surface fire.
Damage Alteration of an artifact’s attributes that is severe enough to impact an
archaeologist’s ability to obtain information critical to the
interpretation of culture history.
Digging Line A line cleared of combustible materials created by fire crews,
generally with hand tools. Intended to contain or control a fire.
Dose The temperature and duration material culture is subject to in an
experiment.
Dozer Line A line cleared of combustible materials constructed by the front blade
of a dozer, intended to contain or control a fire.
Effect Alteration or change, but not severe enough to impact an
archaeologist’s ability to gain knowledge from the artifact’s original
attributes.
Experiment Overarching design for systematically testing artifacts in a controlled
laboratory setting.
Fuel Any combustible material.
Fuel Load The amount of fuel present expressed in weight of fuel per unit area.
In this case, it is measured by the consumable fuel’s dry weight.
Ground Fire Fire that consumes the organic material beneath the surface fuel layer
(smoldering).
Fire Intensity or
Intensity
Heat released per unit of time; the primary unit is BTU (British
thermal unit) per second per foot of fire front.
Management Implementation of appropriate preservation tactics.
Post-Burn Subsequent to heat-testing.
Pre-Burn Prior to heat-testing.
Prescribed Burn Any fire intentionally ignited by management actions in accordance
with applicable laws, policies, and regulations to meet specific
objectives.
Preservation
Guide
A reference for resource managers to assist in making the best
management decisions to minimize damages to cultural resources in a
fire-prone environment.
Severity Degree to which a site has been altered or disrupted by fire; loosely, a
product of fire intensity, residence time and the nature of the
archaeological site.
Sherd Any pottery fragment – a piece of broken vessel or other earthenware
item that was produced by Native Americans during the historic or
prehistoric period.
4
Term Definition
Slash Tree or brush debris resulting from such natural events as wind, fire,
or snow breakage; or such human activities as road construction,
logging, pruning, thinning, or brush cutting. Slash includes logs,
chunks, bark, branches, stumps, and broken understory trees or brush.
Surface Fire Fire that burns loose organic debris on the surface, which includes
dead branches, leaves, and low vegetation.
In this thesis, a prototype preservation guide is developed, which makes
recommendations based only on the radiant heat effects to ceramics. This is not a complete or
final product but is an initial step in development, to be finalized as a working document. Only
after laboratory studies are completed and an extensive consultation with its intended audience
and other experts is done, can the guide be developed into its final form as a tool to advise
managers in their decisions. The audience for this guide includes archaeologists and fire
managers, with the goal of bridging the two fields. The idea is to keep the guide efficient and
simple so managers are motivated to use it in the field. As such, the main guide page of the
prototype takes the form of a decision tree, which provides the opportunity for a quick
assessment of fire danger levels near their sites.
Some reasons that archaeologists are interested in protecting artifacts from fire are: 1)
Artifacts are important recorders of past history, culture, and land use; 2) Intact assemblages
preserve our country’s heritage for future generations; and 3) Archaeological sites on federal
land are protected by law and designated managers must preserve them to the best of their
abilities. Ceramics, for example, hold many clues about the past in the attributes they carry. As
described in more detail in Chapter 2, decorations on the sherds, the technology of manufacture,
and sherd density assist archaeologists in understanding the timeframes during which ceramics
were produced, function, and trade patterns between groups.

5
In this study, the tested sherds were separated based on their decoration attributes, as this
may be the most susceptible attribute in radiant heat. These categories are widely recognized as
general classes of ceramics that can be found in ArcBurn’s region of study. The five decorative
ceramic categories are: textured utility, carbon paint, glaze paint, mineral paint, and plain utility
(Figure 1.1).
Figure 1.1. Examples of ArcBurn ceramic categories
Besides the valuable information archeologists can glean from intact artifacts, the
nation’s cultural heritage is protected by law. A series of Federal laws
(http://www.nps.gov/archeology/public/publicLaw.htm), with The National Historic Preservation
Act of 1966 serving as arguably the crucial mandate, requires federal agencies to protect cultural
resources on government lands. Archaeologists have been working alongside fire managers for
decades, and have developed several tools to assist archaeologists and fire managers in
protecting sites from fire-damage (Gassaway, personal communication 2015). Unfortunately,
every region is different, not only from specific archaeological material, but fire regimes and fuel
compositions as well. Due to this variability, it may not be possible to create a preservation guide
that works universally, which is why attempting to make a regionally and material-specific guide
might be the most beneficial and user-friendly approach, as initiated in this thesis. Since
approximately 14% of northern New Mexico is public land, under which its rich culture-history
is protected, and since it is a fire-prone environment, it is the ideal place to test a regionally and
material-focused protection guide. There have been other experiments in which scientists have
6
tested fire effects on artifacts (presented in the following subsection), but the ArcBurn project is
the first study with the goal of collecting data specifically in hopes of developing a guide.
Starting in the 1980s, with the increasingly common occurrence of very large and severe
fires, cultural resource managers began to more systematically turn their attention to the range of
threats the archaeological record faced. Studies were conducted on how heat and flame
environments might damage archaeological resources. These studies, and those that followed,
paved the way for the research being conducted here. The following subsection details a few of
the experimental designs which provide a foundation for the ArcBurn project.
Literature Review of Experimental Approaches to Fire Damage of Artifacts
A number of practitioners have conducted burn tests on ceramics (e.g., Bronitsky 1986;
Bronitsky and Hamer 1986; Cogswell et al. 1996; Lentz et al. 1996; Pierce 2005; Rasmussen et
al. 2012; Schiffer 1990; Schiffer et al. 1994; Sturdevant et al. 2009; Young and Stone 1990). In
addition to the experimental work itself, land management agencies, especially the US Forest
Service and Bureau of Land Management, have published several reports or given presentations
on this topic as a reference guide for archaeologists and fire managers to help disseminate this
research (Buenger 2003; Duke et al. 2003; Ruscavage-Barz 1999; Ryan 2010; Ryan et al. 2012).
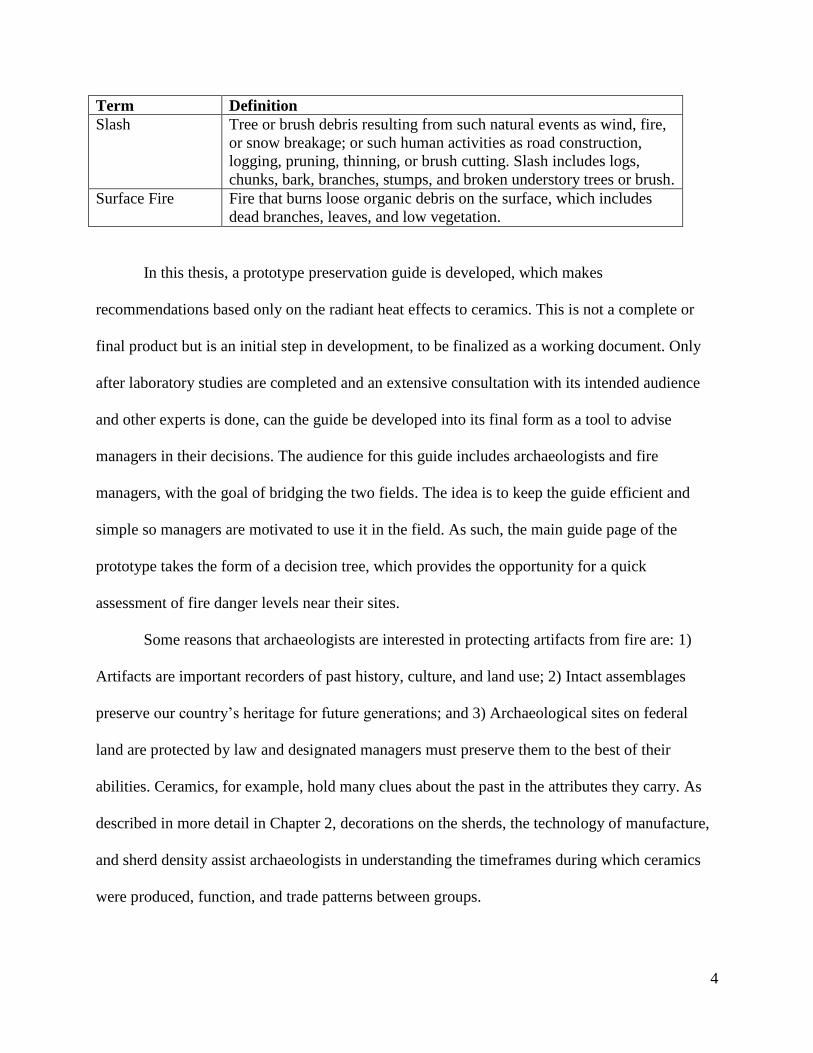
The following table (Table 1.2) is a summation from a literature review conducted on
publications and reports pertaining to the results of ceramic artifact heat testing.
Table 1.2. Summary of experimental work pertaining to thermal effects on ceramics.
Study reference Exposure temperature Observed effect(s)
Bennett and Kunzmann
(1985)
350°C Paint loss/change
400˚C-600˚C Core pattern change
400-1000˚C Paint loss/change
500˚C Spalling
500-600˚C Slip color change
600˚C Cracking
600-1000˚C Oxidation

7
Study reference Exposure temperature Observed effect(s)
Buenger (2003) 600°C-1000°C Paint loss/change
Slip color change
Crandall and Ging (1955) 700˚C-750˚C Fracture
Duke et al. (2003) 350˚C Cracking
Oxidation
Slip color change
Spalling
Vitrification
Lissoway (1986) 350˚C Paint loss/change
Rice (1987) 200˚C-500˚C Oxidation
400˚C-600˚C Cracking
900˚C-1200˚C Vitrification
Ryan (2010) 350˚C Paint loss/change
750˚C-870˚C Spalling
Ryan et al. (2012) 500˚C-900˚C Oxidation
573 ˚C-870˚C Temper alteration
750˚C-870˚C Spalling
900˚C-1100˚C Vitrification
Rye (1981) 500°C Oxidation
Schiffer et al. (1994) >800˚C Cracking
Shepard (1956) 800˚C Oxidation
As Table 1.2 demonstrates, there has been extensive experimentation already conducted
on effects of heat exposure to ceramics that set the stage for more research. However, there are
gaps in knowledge that drive the ArcBurn project’s design and methods. Key examples are the
lack of prior information on the duration of heating that caused observed effects, and the lack of
specification of how their studies apply to real-world fire environments.
For example, Bennett and Kunzmann (1985) authored one of the first reports of thermal
experiments on cultural resources. They conducted experiments on quartz, obsidian, pottery
sherds, stoneware, china, glass, bone, and enameled tinware. They did not thoroughly explain
their methods of heating, but it is briefly noted that they placed various artifacts in a muffle
furnace (similar to a kiln) at temperatures ranging from 200° to 800°C for periods of several

8
hours. Although this work established a foundation for many later publications, it is difficult to
know how their results correlate to real world conditions. Archaeological sites exposed to crown
or surface fires experience a maximum of 90 seconds of radiant heat (Silvani and Morandini
2009). Thus, the environment Bennett and Kunzmann simulated might not be realistic, although
they certainly identified a range of effects radiant heat may potentially cause.
In 2003, Brent Buenger wrote his dissertation on the topic of wildfire effects on artifacts
and conducted two experiments. The first was to validate or contradict Bennett and Kunzmann’s
(1985) results in a muffle furnace and the second was a wind tunnel experiment, which would
replicate an open flame surface fire environment. Buenger conducted thermal experiments at the
Missoula Fire Science Laboratory on mammal bone, mussel shell, lithics (porcelinite, obsidian,
chert, phosphoria, novaculite, silicified wood, and sandstone), pottery (prehistoric and historic),
and historic glass artifacts. His tests in the wind tunnel were conducted on a burn table, on which
the fuel bed (simulated ground surface loaded with fuel) was loaded with excelsior (wood
shavings to assist in ignition) and ponderosa pine sticks in light, moderate, moderate-heavy and
heavy loads. These fuels were then exposed to low and then high wind velocities. His ceramics
results from these tests were, “no significant thermal damage in the form of thermal fracturing or
spalling was observed for Southwestern black-on-white and corrugated pottery sherd specimens”
(Buenger 2003:246). Buenger was much more detailed in reporting his methodology than his
predecessors, but questions remain about his ceramic categories, replicability, and reporting.
Buenger lumped the black-on-white, corrugated and gray ware into one prehistoric ceramic
category and had only a sample size of 3 sherds per wind tunnel test. Last, Buenger
acknowledged throughout his dissertation that other effects may occur to ceramics other than
fracture and spalling, but fails to evaluate those other effects.

9
These two foundational studies, along with others, have been pivotal in the current
understanding of how to protect cultural resources from wildland fires and prescribed burns.
However, because of the limitation of these studies, the ArcBurn project tests seek to continue
developing the understanding of fire effects to cultural resources. The purpose of more testing is
to strengthen the current knowledge by reporting more detailed methods, providing more
replication of each experiment, and by simulating several real-world fire environments.
In order to understand why improving protection of this archaeological record is
important, it is crucial to establish the historic and prehistoric Native American occupation of the
Jemez Mountains where the ArcBurn project is focused, and provide more background on both
the ceramic artifacts and the fire history of the region. The following chapter provides
background for each.
Chapter 2. Cultural and Environmental Background
Cultural and Artifact Background
Anthropologists divide Southwestern past peoples into three primary ancestral culture
groups: Mogollon, Hohokom and Ancestral Puebloan (previously known as the Anasazi), each of
which is considered to occupy a sub-region of the Southwest (Cordell 1997; Wormington 1947)
(Figure 2.1). The Mogollon occupied the space from the southeast quarter of Arizona, to the
southern half of New Mexico, to the north-central portion of northwest Mexico. The Hohokam
resided in the central-southern portion of Arizona, and the Ancestral Puebloan occupied the
space from southern Utah, to southwestern Colorado, to northern Arizona, to northern New
Mexico. This thesis focuses on fire effects on the material culture of Ancestral Puebloans who
lived in the Jemez Mountains in north-central New Mexico, as shown in the red box in Figure
2.1.

10
Figure 2.1. Map of Southwestern US outlining Hohokam, Mogollon and Ancestral Puebloan
culture boundaries as well as the ArcBurn study area (adapted from Cordell 1997:24, Figure 1.7).
Archaeologists use attributes of ceramics, such as shape, paint style and color,
corrugation style, etc. to define cultural boundaries on the landscape (Blinman 1993; Cordell
1994). Thus, to interpret cultural history experienced prior to written record, archaeologists look
to oral history and the archaeological record, including ceramics, to tell the story.
Southwest tribes are known for their specialized knowledge of ceramic manufacturing
and their iconic decorations (Dobyns 2002; Lyneis 1995). Their well-developed ceramic
production varied considerably across the region and through time, which, along with other

11
supporting data, have been central to determining cultural transitions in the southwest (Cordell
1994). Across the Ancestral Pueblo area, there are a number of different “branches” and
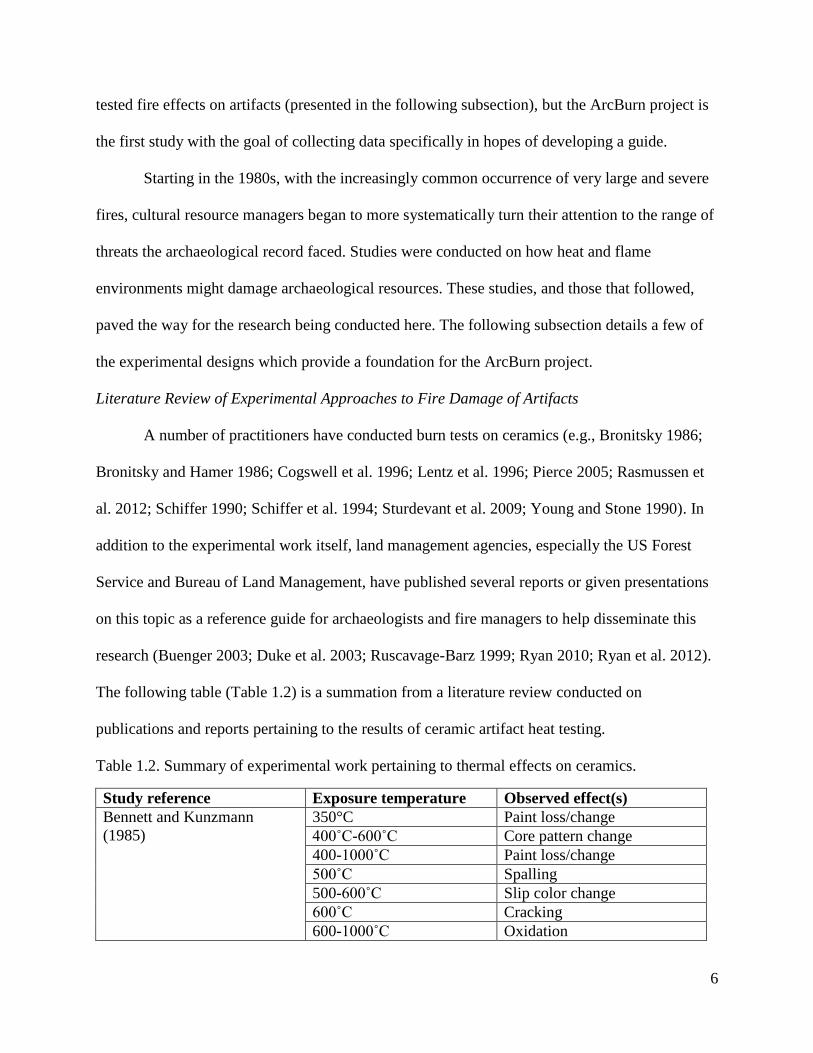
numerous local developments. The following table describes the established basic chronology
and development of the Ancestral Puebloan peoples, as well as the more detailed chronology for
our study area, that of the Northern Rio Grande peoples.
Table 2.1. Pecos Classification of Ancestral Puebloan chronology as outlined by Ruscavage-Barz
(1999:13-14) and Reyman (1993), and classification of Northern Rio Grande chronology as
outlined by Wendorf and Reed (1955).
ANCESTRAL PUEBLOAN NORTHERN RIO GRANDE
Date Puebloan
Culture
Phase
Phase
Description
Date Northern Rio
Grande
Culture Phase
Phase Description
A.D.
1600-
present
Pueblo V
(Historic)
Spanish military
and Catholic
church influences;
Ancestral
Puebloan groups
revolted against
Spanish; pueblos
were downsized
or abandoned in
the early contact
period; Puebloan
population
declined
A.D.
1600-
present
Historic Period Population declines
from warfare and
illness; Several
tribes within the
Puebloan people
revolted against
Spanish influences;
Puebloan people
fled from Spanish
for survival, some
of whom later
returned to their
ancestral land
A.D.
1300-
1600
Pueblo IV Larger pueblos;
centrally located
in plazas; black
on white ceramics
largely replaced
by a number of
different
polychrome
traditions; plain
utility category
partially replaced
textured utilities
A.D.
1325-
1600
Classic Period Glaze paint and red
slipped pottery
introduced;
beginning of mesa-
top farming; large
pueblos with
several hundred
rooms (multiple
stories) with several
plazas; masonry
and adobe used for
construction of
pueblos; kivas
present
A.D.
1100-
Pueblo III Multi-story
pueblos; elaborate
A.D.
1200-
Coalition Several groups
move into region;
12
ANCESTRAL PUEBLOAN NORTHERN RIO GRANDE
Date Puebloan
Culture
Phase
Phase
Description
Date Northern Rio
Grande
Culture Phase
Phase Description
1300 black on white
ceramics;
abandonment of
the four corners
region at the end
of the period
1325 small pueblos and
field houses with
agricultural features
appear; masonry
replaces adobe for
pueblo
construction;
pottery decoration
with organic
pigments emerge
A.D.
900-
1100
Pueblo II Cliff granaries;
emergence of
corrugated
ceramics
A.D.
600-
1200
Developmental
Period
Pottery technology
introduced;
increase in number
of pueblos after
A.D. 900
A.D.
700-
900
Pueblo I Surface-level
rooms; emergence
of early black on
white pottery
A.D.
400-
700
Basketmaker
III
(Developmen
tal Archaic)
More elaborate pit
houses; upright
storage cists; bow
and arrow
technology;
trough metates;
emergence of
early pottery
B.P.
15,000-
A.D.
600
Preceramic
period
Begins with isolate
artifacts; little
activity, develops
into sporadic
temporary use
(hunting, gathering,
collecting) and use
of an array of stone
tools
A.D.
400
Basketmaker
II (Archaic)
Small pit houses;
storage cists,
shallow grinding
slabs; one-hand
manos, corner and
side-notched dart
points;
employment of
agriculture
The ceramics we find today are representative of vessels and dishes from which organics
and liquids (often food) could be processed, cooked, served, or stored. Surface treatments, clay

13
choices, and temper choices not only affected the vessel’s practical characteristics, such as
impermeability to liquids and susceptibility to chipping, but also contain, especially for the
surface treatments, social and ideological information as well (Schiffer and Skibo 1997). The
following paragraphs provide a deeper understanding of how the sherds we find today were
manufactured in the beginning of their systemic (i.e. use-life) context.
The production process of pottery has four stages: obtain raw materials, refine and blend
raw materials, manufacture using operational methods, and distribution (Rye 1981; Sinopoli
1991). Obtaining raw materials can be accomplished through direct procurement, trading or
purchasing. The basic raw materials of pottery are water, clay (paste) and temper which are
mixed together at various ratios (depending on the vessel’s function and intended
characteristics). Since clay is elastic, temper is added to clay in order to, “counteract the
tendency of the pure clay to crack during the shrinkage that takes place in sun-drying and in
firing” (Guthe 1925:21).
The preparation of the raw materials consists of cleaning out the coarser materials and
plant remains. This can be done by sifting or drying the clay in the sun and breaking the
unwanted matter out. The method of blending materials can vary, but the simplest way is to wet
the clay until it becomes plastic and then sprinkle in non-plastic additives (temper).
Manufacturing varies heavily, but the simplest way to accomplish the task of vessel
formation was by hand through kneading the clay and then pinch-forming, coiling, and/or using a
mold (one or all of which may be employed for a single vessel) (Rye 1981). Once the vessel is
formed, it is dried and then often, but not always, dipped or painted in a slip of fine clay. If the
vessel is slipped, it must be dried again, and if it is to be further decorated, this is when the
manufacturer would do so. Decoration takes many forms; it could be painted with simple

14
pigment or glaze, or textured, which is created through incising, beating, scraping, trimming,
shaving and punctuating (Graves 2001; Rye 1981).
When the vessel is again dry, it is fired. Firing subjects the vessel to sufficient heat for
long enough to ensure that the clay minerals undergo several chemical and physical changes
making the vessel body harder, less porous and stable (Rye 1981). The potter controls for the
temperature and atmosphere of firing based on their individual product preferences, of which the
temperatures can range from 500°C to 1000°C (Rye 1981; Shepard 1956). The atmosphere is
typically oxidizing (predominance of oxygen) or reducing (predominance of carbon monoxide)
depending on the atmosphere’s openness to air fluctuation during the firing process (Rye 1981).
Ancestral Pueblo potters are well-known for using reducing atmospheres to produce grey to
white clay bodies, particularly in their painted ceramics (Rye 1981). During the firing process, a
diagnostic attribute may appear if it was manufactured in a reducing environment: a carbon core.
The core is the cross-section of a ceramic, which can be observed if the vessel is broken. The
carbon core presents itself as a dark gray band and can have up to 19 patterns (Van Hoose 2006)
(Table 3.1).
Since ceramics were manufactured in a fire or heated environment, they may resist or
succumb to certain types of damages caused by wildfires or prescribed burns. For example, they
may resist certain types of effects, such as cracking, fracturing, spalling, and core pattern change
up to the temperature at which the clay was fired, but until testing, this is only a hypothesis.
As previously mentioned, ceramic attributes, and simply their presence, can provide key
evidence of past lifeways. A few examples of evidence that can be used in site interpretation that
could be influenced by fire are: frequency of ceramic presence, decorative design (or lack
thereof), its temper and its clay. Touching on the first form of ceramic evidence, simply the

15
presence or increase of ceramics could indicate occupation type and period. During the cultural
phases shown in Table 2.1, the people of the Northern Rio Grande transitioned in time from
seasonal use of the landscape to become more sedentary (Cordell 1994). Sedentism can be
observed in the archaeological record, not only through the increase of reliance on agriculture
and more elaborate structures, but through pottery use. Cordell notes that, “ceramic containers,
because they are both heavy and fragile, are not useful items for highly mobile groups, especially
those without pack animals” (1994:55). With this logic, we can infer that an increase of ceramics
observed in the archaeological record reflects increased sedentism, and/or possibly a growing
population. While a wildfire does not inherently remove artifacts from the surface, it does
remove surface fuels, under which ceramics were covered. When artifacts are no longer covered,
they are more visibly exposed to passers-by, which could lead to their illegal removal. If these
ceramics were looted as a secondary effect of burning, then the interpretative quality of these
artifacts’ frequency becomes skewed.
Ceramic designs can be used to infer trade patterns among peoples within the region. The
Northern Rio Grande peoples manufactured much of their own pottery, but once trade networks
were established with surrounding (and even distant) groups, ceramics of other decoration styles
were observed (Adams and Duff 2004). Among other artifacts, ceramics are some of the most
indicative signs of trade networks in the Southwest. With each group’s iconic decorative
patterns, raw material choices, and manufacturing techniques, archaeologists can deduce a rough
location of manufacture, which is again a main line of evidence in establishing culture areas. If
decoration is affected or damaged from wildfires or prescribed burns, its ability to shed insight
on past trade networks and culture areas weakens.

16
Intact ceramics can also be tested with lab equipment to better understand the sherd’s
date of manufacture and source for the clay. For example, it is possible to conduct
thermoluminescence dating on temper that is comprised of certain crystalline material, as done
by Farias et al. (2009). Since temper is mixed in with the clay, the date of the ceramic’s
manufacture is sealed in the paste until the temper itself is exposed to light or heat again
(essentially, until the pot is broken and the temper is exposed). With this, if archaeologists would
like to collect a manufacture date, they may do so by conducting thermoluminescence analysis
on the sherd’s unexposed temper. Other types of lab analyses used for ceramics studies are: X-
Ray Florescence (XRF), neutron activation (INAA), and Inductively coupled plasma mass
spectrometry (ICP-MS) for determining trace element composition. These technologies have the
ability to scan the clay paste for elemental traces, the combination of which may be unique to its
clay source. These forms of analyses can determine ceramics from common origins, helping
identify manufacturing groups, and even lead archaeologists back to where the clay raw material
was collected if the chemical composition is unique.
Contemporary wildfires are becoming more severe, and according to archaeological post-
burn survey reports, loss of ceramic information such as looting and loss of decoration are
apparent (Hangan et al. 2008; Reed and Bremer 2011). It is currently unclear whether the severe
heat of contemporary wildfires can alter the dating ability of thermoluminescence, or the
elemental trace detection with XRF, INAA and ICP-MS techniques, the determination of which
is beyond the scope of the current study. However, if all of these analytical methods can be
altered by severe fire, then the ability to interpret the archeological record will be permanently
skewed or lost as severe wildfires continue to consume the forests of the Jemez Mountains. The

17
fire history of the Jemez Mountains is detailed in the following subsection for a better idea of
what the archaeological record has already experienced.
Fire history, fire ecology, and fire behavior
Three elements are needed to sustain fire: an ignition source (heat), fuel, and oxygen
(Figure 2.2). Factors such as topography, weather, and fuel properties (amount and arrangement)
control these elements and subsequently how fire behaves as it moves across the landscape. In a
wildfire, these components interact in a succession of burning stages: pre-heating, combustion,
and smoldering (Ryan et al. 2012:15-16). First, fuels are pre-heated along a wildfire’s perimeter,
which dries and warms them, in turn preparing them for combustion. The fuels then ignite,
causing flame. Once the flame front dies, it begins the smoldering stage, otherwise known as the
“glowing phase” (Ryan et al. 2012:17). The continuation of this pre-heating, combusting and
smoldering process depends on ecological, seasonal, weather, topographical and climatic factors.
Once one of these factors is altered by environmental change or human manipulation, fire
regimes can dramatically change as well.
Figure 2.2. Fire triangle
In New Mexico, an example of unintentional fuel composition change came with the
building of the railroad in 1880 (Allen 2001). With improved passenger and freight

18
transportation came more utilization of the land in New Mexico, including sheep grazing, which
in itself was an accidental form of fire suppression. Grasses tend to keep the flame front moving
from one source of dry woody fuels to another by acting as a continuous fuel bed across a large
area. Grazing can cause an indirect form of suppression by removing this continuous fuel, the
consequence of which is that the woody fuels build up in the forest as they are less frequently
being removed by fire (Swetnam and Betancourt 1990). In dry seasons, a lightning strike can
ignite these high fuel loads and cause a much larger and more severe fire.
The forests of north-central New Mexico are primarily comprised of ponderosa pine, which
intermingles with other species. At higher elevations, ponderosa pine is replaced by white and
douglas firs along with aspen (Allen, n.d.; Touchan et al. 1996). Due to the prevalence of
ponderosa pine forests in the research area, it is this species’ fire regime that was used for the
basis of this study. An examination of fire regime history of the ponderosa pine and mixed
conifer forests within our study area was conducted by Thomas Swetnam of the Laboratory of
Tree-Ring Research at the University of Arizona, outlined in the following paragraphs.
Regional fire histories can be developed using two sources: Forest Service fire documents
and tree fire-scar records (Swetnam and Betancourt 1990). The US Forest Service was
established in 1905, and ever since has collected data on the annual number and locations of fires
(Swetnam and Betancourt 1990). The second source for fire history records is the physical record
of fire scars left behind on trees that were damaged but not killed. This record can be dated using
dendrochronology, and this tree-ring record can preserve a history of fire scars for hundreds, and
sometimes thousands of years, depending on the tree’s life expectancy. These data are collected
through evaluating tree cores (core of tree trunk, from exterior to the center, demonstrating the
ring count, and subsequently dry and wet seasons or drought years) and tree cookies (cross

19
section of tree trunk showing the ring count, fire scars, dry and wet seasons and drought years,
using entire circumference), or a partial tree cookie (approximately half of a tree trunk cross
section). Not all trees are scarred during fire episodes, but when enough cookies are collected
from each sampled forest that the likelihood of several of the sampled trees having been scarred
is high.
The fire scar data Swetnam evaluated from Frijoles Canyon ranged from A.D.1709-1905,
and he established that during this time, fires typically burned every 7.3 years with a standard
deviation of 5.5 years; the maximum interval in that time was a fire-free period of 23 years
(1990). It is hypothesized that during this time Native Americans in the region influenced the
local fire regimes largely through impacts on the environment (Vale 2002). For example,
prehistoric people in the Southwest utilized, and subsequently altered attributes of the landscape
for agricultural purposes, which means they may have affected the vegetation (Briggs et al.
2006). Prehistoric peoples were not only altering the fuel composition, but also purposefully
burned for many reasons including the stimulation or promotion of certain vegetation (Vale
2002). These agricultural features and purposeful burning altered local fire regimes. However,
the full impact of Native American activities on the prehistoric landscape and how those
influenced the historic and present day state of the landscape is unknown.
According to fire scar data Swetnam collected for the last three centuries, there were two
abnormally long fire-free periods: 1830s-1840s and the late 1800s. The first is attributed to
climatic factors, specifically a wet environment (as indicated by the larger tree rings from that
decade). Swetnam states that this was the wettest decade in the last 200 years (Swetnam and
Betancourt 1990). The second period of fire absence was the late 1800s, which he suggests may
have been due to the start of sheep grazing in the 1820s (Swetnam and Betancourt 1990). Again,

20
the causal chain is that because sheep graze on grasses, the fuel that carries fire from one woody
source to another, fires that may start from lightning or human activity likely wouldn’t carry as
readily. The buildup of woody fuels resulting from fire exclusion increases the potential for more
intense fire than was typical during this environment’s prehistoric and early historic periods.
The history of fires of northern New Mexico documented by the Forest Service began with
lower frequency due to grazing and suppression, but an increase in fire severity due to fuel build-
up (Ryan et al. 2012; Swetnam and Betancourt 1990). Specifically, within the Jemez Mountains,
I will highlight some of the more recent fires with high severity: the Dome fire of 1996, the Oso
Complex of 2000, the Cerro Grande of 2000, the Las Conchas of 2011, and the Thompson Ridge
fire of 2013 (Figure 2.2). This fire data was downloaded from the Monitoring Trends in Burn
Severity website, a long-term project monitoring wildfires in the United States. The Dome fire of
1996 burned a total of 15,782 acres of land, the severity of which 2,696 acres were considered
moderate and 349 acres were considered high, which means approximately 2% of the entire fire
was considered high severity (MTBS 2015b). The Oso Complex of 2000 consumed 5,297 acres,
1,405 of which were considered moderate severity while 1,829 acres were considered high
severity, making approximately 35% of the total fire high severity (MTBS 2015d). The Cerro
Grand fire of 2000 consumed much more than the Oso Complex, reaching a total of 44,280 acres
burned. The amount classified as moderate severity was 8,129 acres, while there were 14,504
acres considered high severity, amounting to approximately 33% of the consumed land having
been exposed to high severity fire (MTBS 2015a). The Las Conchas fire of 2011 consumed a
total of 150,877 acres. Of the total consumed, 25,920 acres were considered moderately severe
and 30,499 were considered high severity (approximately 20%) (MTBS 2015c). Lastly, the

21
Thompson Ridge fire of 2013 burned a total of 21,080 acres, of which 4,354 were considered
moderate severity and 2,029 were considered high (approximately 10%) (MTBS 2015e).
Figure 2.3. Map of fire severity in the Jemez Mountains of north-central New Mexico (map
courtesy of Rachel Loehman, 2015).
Figure 2.3 displays how much area high severity contemporary fires consumed in the
study area in the last two decades. Fire severity is based on plant mortality, which means high
severity fires kill the most plants (including trees) of the possible levels on the ordinal scale of
fire severity (Keeley 2009). When trees are killed from a severe fire, they would no longer leave
a fire scar record, which means the fires of the past that left fire scars would not be considered
high severity, as demonstrated with the abundance of trees that survived prehistoric and historic
fires. With this figure in mind, we can deduce that contemporary wildfires are very different,
specifically more severe, than in the past. If these severe fires continue, whether due to fire

22
suppression, grazing or climate change, it is possible that the entirety of north-central New
Mexico could eventually be exposed to severe fire in the near future.
At this point, it is difficult for archaeologists to predict what the potential for damage is for a
site in fire events at this scale. It is unknown whether sites can tolerate low to moderate burn
severity, or if they can become damaged from all of the spectrums of fire severity. This question
will be addressed in the conclusions of this study, but first the materials and methods are detailed
in the following chapter.
Chapter 3. Materials and Methods
Radiant Heat Test
As developed in the preceding chapters, this thesis reports on the data collected from radiant
heat tests conducted on Southwest ceramics. The ceramics used for this study are
unprovenienced artifacts, referred to as, “guilt collections,” that were deaccessioned from the
accessory collections at the Maxwell Museum of Anthropology at the University of New
Mexico. The deaccessioning process was conducted by Jamie Civitello, Connie Constan,
Jennifer Dyer, and Dave Phillips. The classification and the pre-and post-burn analysis were
undertaken by ArcBurn’s ceramics expert, Dr. Connie Constan. The experiment was designed by
Jim Reardon and Dr. Loehman, and the tests were conducted by lab technicians Rebekah Kneifel
and Sarah Flanary.
The typical effects seen in post-burn surveys were provided by Constan (personal
communication 2014). The thermal effects targeted in the radiant heat tests are: blackening, core
pattern change, crazing, cracking, fracture, hardness change, oxidation, paint/slip/surface color
loss or change, size change, spalling, temper change, and vitrification. The definition of each can
be found in the table below.

23
Table 3.1. Definitions of thermal effects to ceramics.
Effect Definition Reference(s)
Blackening The darkening of the ceramic surface due to
exposure to heat or smoke (similar to fire
clouding), or the presence of a reducing
atmosphere.
Constan, personal
communication 2014
Rice 1987:478
Core pattern change Each ceramic core profile has a “core
pattern” defined as the contrasting of
oxidized and reduced portions of the sherd
profile, which ranges from one solid color
throughout the core to multiple stripes of two
or more colors (like tree rings). There are 19
possible core patterns (labeled A-S),
according to Van Hoose (2006). These
patterns, which may inform archaeologists
about manufacturing and use history of
ceramics, could possibly be altered by heat
exposure.
Van Hoose 2006:147
Rice 1987:474
Crazing The presence of fine, non-linear or latticed
cracks on the surface of a specimen.
Buenger 2003:261
Rice 1987:474
Cracking Cracking is when the ceramic surface or
profile develops shallow crevices. Cracking
is more significant than crazing and may
penetrate beyond the slip into the paste of the
sherd.
Constan, personal
communication 2014
Buenger 2003:27
Fracture The breaking of a specimen into multiple
pieces, and/or the presence of fractures or
fissures that penetrate deeply into a
specimen.
Buenger 2003:261
Hardness change Hardness is the resistance of the surface to
deformation. It is based on the Mohs
Hardness Scale, which is a standard scale
numbered from 1 to 10. Ceramics may
experience a change in hardness when
experiencing prolonged exposure to heat.
Rice 1987:474
Oxidation of
pigment used for
surface treatment
Alterations can include a change in color
from the original pigment (black to red), or
the combustion of the pigment entirely.
Oxidation is the clay’s molecular reaction to
oxygen and heat, which is manifested in color
alteration.
Buenger 2003:261
Rice 1987:479
Paint, slip, or
surface color change
or loss
Any observable color change of a specimen
from original pre-fire color.
Buenger 2003:261
Size change The dimensions of the sherd, including Constan, personal

24
Effect Definition Reference(s)
length, width, thickness, or weight, that
change due to a plethora of factors that are
instigated by thermal exposure.
communication 2014
Spalling The exfoliation of a portion of the original
surface of a specimen due to differential
heating and pressure release.
Buenger 2003:261
Temper alteration Temper is the non-plastic inclusions within
the clay which can be comprised of geologic
materials or organics. These materials have
the capacity to chemically, molecularly or
surficially alter during a heat event
Constan, personal
communication 2014
Rice 1987:483
Vitrification/Melting Melting and fusion of glassy minerals within
clay during high-temperature firing of pottery
(above 1000°C), resulting in loss of porosity;
the process in which a substance melts and
turns to glass.
Ryan et al. 2012:221
Rice 1987:484
Many of these effects have been observed in previous field and laboratory experiments,
but it has not yet been demonstrated whether all effects can be observed in all fire environments,
or if some effects are specific only to certain types of fire (radiant heat, flame exposure, or
smoldering) and certain categories of ceramics.
Pre-burn measurements were chosen based on the potential changes with thermal
exposure in the lab. The measurements were completed by Constan prior to sending the sherds to
the Fire Lab. Constan’s measurements included in the pre-burn analysis were: thickness (cm;
caliper), length (cm; caliper), width (cm; caliper), hardness (Mohs hardness scale), core color
(Munsell color chart), interior and exterior surface color (Munsell color chart), and interior and
exterior paint color (Munsell color chart), core pattern, and observations on what kind of damage
was present prior to testing, such as cracks or spalls.
Once Constan had completed the pre-analysis and the sherds arrived at the Fire Lab, their
bags were labeled with the information required by our experimental design: artifact number, a
blank space for date of the test, kiln temperature, duration of heating, and lab technician initials.

25
Artifact tags were included in each bag and contained the same information, as well as the
thermocouple numbers attached to that individual artifact. Then, the lab technicians prepared the
sherds for testing, which began with drilling two holes in each sherd. These holes serve the
purpose of attaching thermocouples during the experiment in order to read the artifact
temperature. One hole penetrated through the sherd in order to place the thermocouple’s bead at
the heat-exposed surface of the artifact. The second hole was drilled to approximately 1mm (give
or take 0.2mm) from the heat-exposed surface. This hole accommodated a thermocouple
temperature reading just below the heated surface of the artifact. Ultimately, three thermocouples
were placed with each artifact, the third positioned in the sand beneath the sherd. The system of
three thermocouples generated data to better understand heat transfer in ceramic artifacts.
Depending on the sherd’s hardness and temper composition, drilling was difficult. A few
sherds broke during the drilling process and several had up to three holes. For those that broke,
the largest piece was tested. In order to reduce the number of sherds that required replacement,
the ArcBurn team eventually decided to stop drilling the sherds that were breaking most
freqeuently: plain utility and textured utility. For this reason, a few plain and textured utility
sherds have holes for thermocouples, but most do not. For those that had three holes, the third
hole that would not host a thermocouple was filled with fine-ground ceramic powder during the
test. This powder was manufactured by crushing and grinding other “guilt collection” sherds into
a fine powder.
Ceramics were then weighed (g), their interior and exterior surfaces were scanned on a
Xerox DocuMate 700 flatbed scanner (600 DPI), and a broken edge, showing color and core
pattern was photographed with a Pentax K5 SR camera with a Tamron macro lens in a light box.
The light box was manufactured of wood, white poster paper, four lights with white tissue as
26
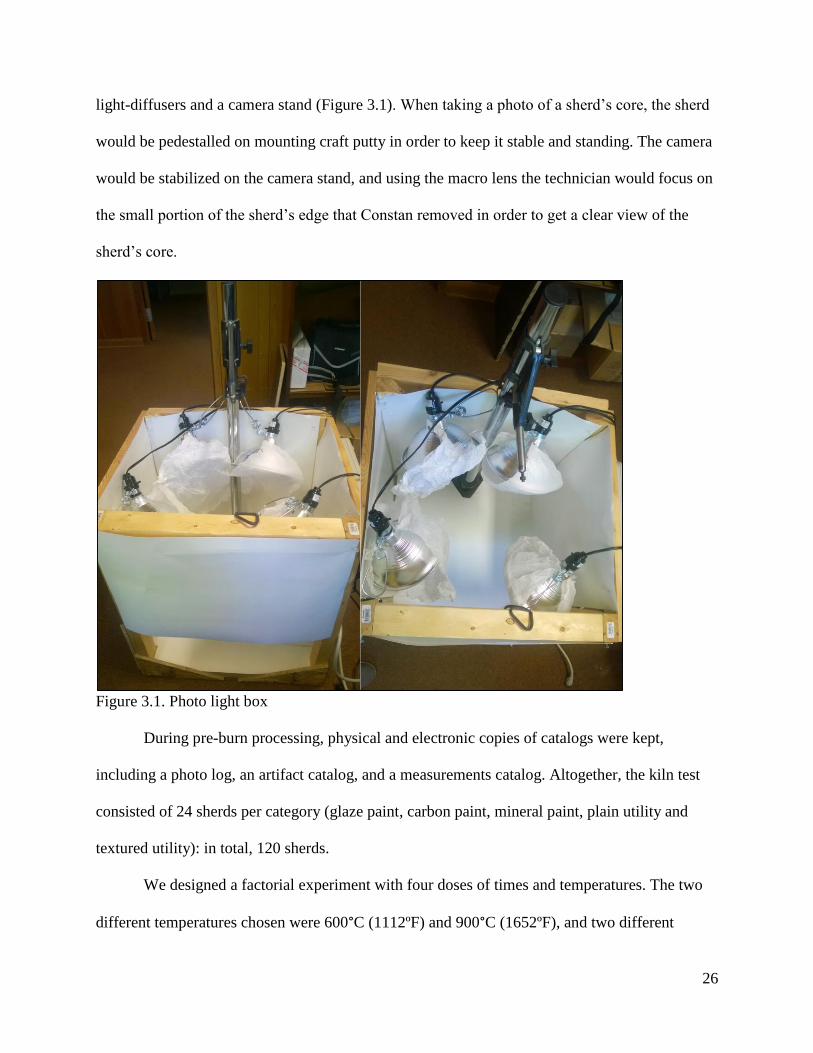
light-diffusers and a camera stand (Figure 3.1). When taking a photo of a sherd’s core, the sherd
would be pedestalled on mounting craft putty in order to keep it stable and standing. The camera
would be stabilized on the camera stand, and using the macro lens the technician would focus on
the small portion of the sherd’s edge that Constan removed in order to get a clear view of the
sherd’s core.
Figure 3.1. Photo light box
During pre-burn processing, physical and electronic copies of catalogs were kept,
including a photo log, an artifact catalog, and a measurements catalog. Altogether, the kiln test
consisted of 24 sherds per category (glaze paint, carbon paint, mineral paint, plain utility and
textured utility): in total, 120 sherds.
We designed a factorial experiment with four doses of times and temperatures. The two
different temperatures chosen were 600°C (1112ºF) and 900°C (1652ºF), and two different
27
durations: 60 seconds and 90 seconds. Six sherds per category were tested in each dose. These
temperatures and times were based on the radiant heat environment characteristic of crown fires
(Butler et al. 2004; Hartford and Frandsen 1992; Silvani and Morandini 2009). Details on the
assignment of artifacts to tests can be found in Appendix A.
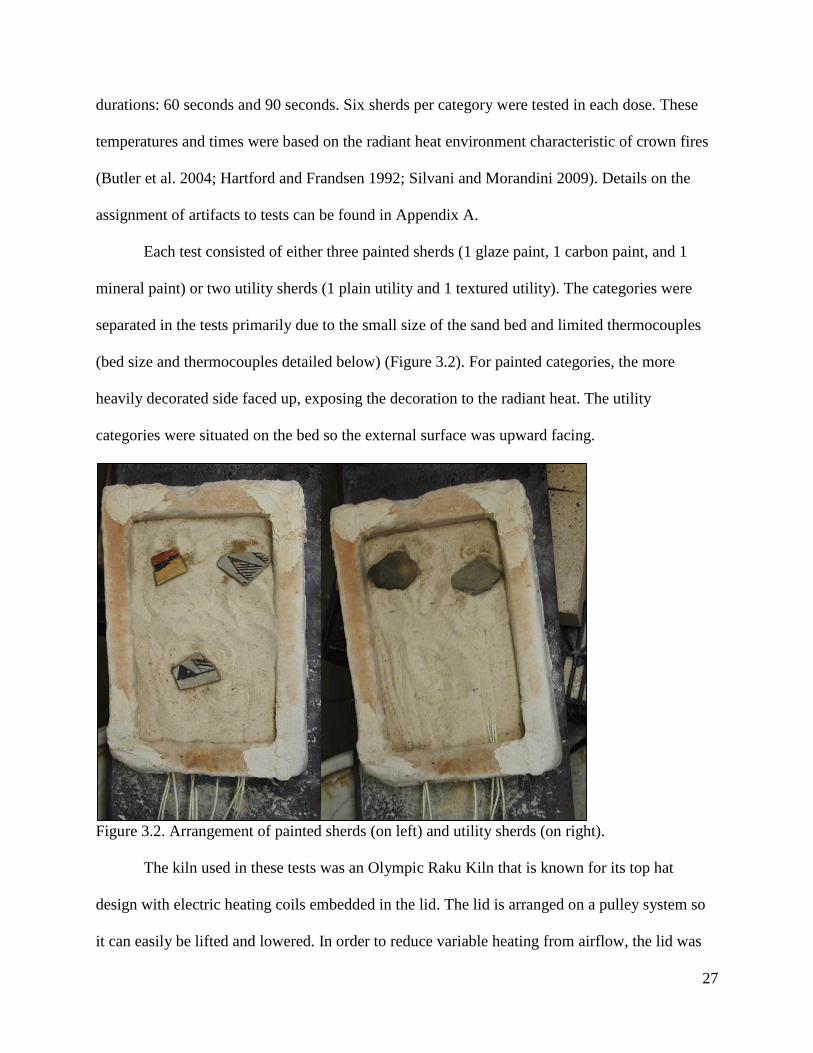
Each test consisted of either three painted sherds (1 glaze paint, 1 carbon paint, and 1
mineral paint) or two utility sherds (1 plain utility and 1 textured utility). The categories were
separated in the tests primarily due to the small size of the sand bed and limited thermocouples
(bed size and thermocouples detailed below) (Figure 3.2). For painted categories, the more
heavily decorated side faced up, exposing the decoration to the radiant heat. The utility
categories were situated on the bed so the external surface was upward facing.
Figure 3.2. Arrangement of painted sherds (on left) and utility sherds (on right).
The kiln used in these tests was an Olympic Raku Kiln that is known for its top hat
design with electric heating coils embedded in the lid. The lid is arranged on a pulley system so
it can easily be lifted and lowered. In order to reduce variable heating from airflow, the lid was

28
propped on the firing surface by firebricks, which secured the heat outlet by sealing the perimeter
with the exception of a space just large enough to insert and remove the sand bed (Figure 3.3).
Figure 3.3. Kiln with firebricks and slot for inserting and removing sand bed.
The sherds were placed in a sand bed which is 16.5cm x 25.5cm x 5cm in size with
2.5cm thick walls and base. The bed is constructed from Cotronics Corporation Ceramic Boards,
which are manufactured from refractory fibers that provide thermal shock resistance. The bed
was filled to a depth of 2.5cm of Lane Mountain fine quartz sand. Prior to testing, thermocouples
were threaded through the pre-designated back-end of the sand bed. Two metal bars were
threaded perpendicularly through the middle of the sand bed beneath the sand in order to hold the
thermocouples down.

29
Thermocouples of Type K were used in this experiment. These are comprised of a
positive leg (nickel chromium) and a negative leg (nickel aluminum). Thermocouples are
manufactured by soldering the two wires into a very small bead, the mechanism by which
temperatures between 90°C and 1260°C can be read. On the opposite end, the positive and
negative legs are then wired to a multiple-input data-logger. In the kiln test, a total of 10
thermocouples were used. The lab technicians were consistent with the placement of each
thermocouple on either the surface of the artifact, 1mm beneath the artifact’s surface, or beneath
the sand under the artifact. Last, a lone thermocouple was used as the atmospheric temperature
reader throughout the tests and resided in open air near the back of the sand bed (Figure 3.4).
Figure 3.4. Sand bed and thermocouples
Once the sherds were arranged in the sand and the thermocouples were attached, the lab
technicians tested the thermocouples and data-logger to make sure they were properly reading
temperatures. The data were displayed on a computer in a program called Loggernet and saved

30
as a text file for use in Excel (equipment setup displayed in Figure 3.5). When the thermocouples
were properly working and the kiln was preheated to its pre-designated temperature (either
600°C or 900°C), the sand bed was inserted into the kiln.
Figure 3.5. Data logger setup
Prior to inserting the sand bed, the lab technician would enter Loggernet and begin
collecting temperature data once per second. Beginning data collection prior to inserting the sand
bed in the kiln later allowed the technician to evaluate the rate of heating from room temperature
to the kiln’s target “atmospheric” temperature. As the sand bed was inserted, a stopwatch was
started and used to time the event so the lab technician would remove the sand bed at the pre-
designated duration (either 60 seconds or 90 seconds). Once the test was complete, the lab
technician removed the sand bed from the kiln, stopped data collection in Loggernet and
immediately removed the ceramics from the warm sand to a staging area where they cooled for
15 minutes. Between tests, the lab technicians would save the data, labeled with the test number,
31
on an external hard drive. Then, the hot sand from the last test was dumped into a metal tray
which was set aside to cool and was replaced by room temperature sand. When the artifacts were
cooled, they were placed back into their associated artifact bags.
Post-burn processing included: weight (g), interior and exterior scans, and photographs of
the ceramic’s core (profile). Once the post-burn processing was complete, the sherds were
carefully packed into two boxes and sent for analysis with an associated letter describing the
treatments that occurred to each artifact. The post-burn analysis conducted by Connie Constan
was similar to pre-burn analysis, consisting of the following measurements: thickness (cm),
length (cm), width (cm), hardness (Mohs hardness scale), core color (Munsell color chart),
interior and exterior surface color (Munsell color chart), and interior and exterior paint color
(Munsell color chart). Constan also noted obvious effects related to color change, residue,
obscured decoration, cracking and crazing, spalling and exfoliation, melting and vitrification,
and presence of ash. Finally, I conducted visual analysis on each artifact to evaluate radiant heat
effects. Visual analysis consisted of comparing a before and after photo of each sherd’s interior
surface, exterior surface, and core profile. If a visible change occurred, it would be considered an
effect, but if a change occurred to the extent by which it altered an attribute or attributes so badly
that it may hinder an archaeologist from proper analysis, it was considered damage. Taking the
images was standardized by using the scanner instead of a light box. The only inconsistency in
using the scanner for before and after pictures was shadows, based on how the sherd was sitting
on the flat bed. These shadows affected lighting slightly, but not enough to bias the
determination the presence or absence of radiant heat effects.

32
Preservation Guide
The results from the radiant heat tests were used to develop parameters for the proposed
preservation guide. The first stage of developing the guide was to establish which radiant heat
effects constitute damage (as defined in Table 1.1).
The second stage of developing the preservation guide was to determine the audience
who would use it and understand their needs. The audience was realized to be archaeologists
who work closely with fire managers and the fire managers working with archaeologists.
Subsequently, it became apparent that both fields would need definitions of each other’s
terminology that would be used in mitigating ceramics from radiant heat damage. Therefore,
terms such as slash (and broadcast slash), crown, tree stand, digging line, thinning, dozer line,
and prescribed burn needed to be defined for archaeologists. Fire managers likely would need
definitions for archaeological terms such as sherd, and the effects that archaeologists are looking
for: surface color change, slip color change, and paint color change. Once these terms were
defined, I created a decision-making flow chart employing these terms.
The flow chart starts with the first logical evaluation that needs to be done on site:
assessment. The assessment stage is important for determining whether action is necessary. For
example, if tight tree crown spacing and/or the presence of ladder fuels could facilitate crown
fires, or a slash pile present on the site might produce a damaging level of radiant heat if burned,
fuels treatments may be warranted to protect archaeological resources from damages.
The flow chart is the central portion of the guide because it carries the manager through
the logical questions necessary for leading them to a recommendation. The prototype developed
for this thesis is not yet ready for use by land managers. Nevertheless, it provides a concrete step

33
from which ArcBurn can move forward on consultation with fire managers and archaeologists
while continuing to measure other factors of wild fire exposure on a greater range of artifacts.
Chapter 4. Results
I conducted low-power visual analysis (i.e. effects that can be seen with the naked eye or
a low-powered hand lens and requires no measurement). The visual analysis was done using
before and after scans of the interior and exterior surfaces of each artifact (for methods, see
chapter 3). Visual analysis mimics the types of observations archaeologists may make in the field
to assess fire effects, thus these visual analysis results provide an on-par assessment to that of the
target audience of the proposed guide. The following subsections will describe how each ceramic
category visually reacts to different radiant doses.
Textured Utility: 600°C x 60 sec
Figure 4.1. Textured utility 600°C x 60 sec typical effects
Textured utility ceramics remained largely unchanged from the low radiant heat dose of
600°C x 60 seconds; only one of the six sherds displayed slip color change. The slip color change

34
was seen on both the interior and exterior surfaces of the artifact. This sherd was different from
most of the other textured utility sherds in its category in that it had a pale yellow-colored slip,
which was much lighter in color than the sherd’s paste. Most of the other textured utility sherds
tested had an absence of slip altogether, which made the surfaces (interior and exterior) close to
their paste color. This sherd may have been more prone to color change than the rest, which is
why it was the only sherd affected in the lowest heat dose.
As seen in the temperature graph above (Figure 4.1), the maximum artifact temperature
reached was approximately 200°C, which was recorded at the sherd surface exposed to radiant
heat (exterior surface). The maximum temperature recorded 1mm beneath the sherd’s exposed
surface was 185°C, and it reached its maximum temperature approximately 5 seconds after the
surface temperature reached its maximum. They reached their maximum as they were pulled
from the kiln, which indicates that the sherd would have continued to heat if left in the kiln
longer. The temperatures slightly plateaued immediately after being removed from heat, but then
rapidly declined in temperature and plateaued again around 80°C, even though the lab room
temperature was approximately 20°C (as seen on the graph prior to heating). The graph above
only represents one of the textured utility sherds, thus it does not match the temperature readings
exactly to the other five, but is representative of temperature trends when the sherds are exposed
to radiant heat.
The textured utility ceramics showed no other change in the low heat and short duration
environment. The very slight discoloration to the one artifact does not reduce the ability to
extract cultural information, and thus will not be considered damage.

35
Textured Utility: 600°C x 90 sec
Figure 4.2. Textured utility 600°C x 90 sec typical effects
Of the six textured utility ceramics exposed to this slightly longer duration (90 seconds)
at the same heat setting (600°C), only two showed signs of surface color change. Both of the
affected sherds darkened slightly on their exterior surfaces (the upward facing surface that was
most exposed to the radiant heat).
As seen in the temperature graph above (Figure 4.2), the maximum artifact temperature
reached was approximately 260°C, which was recorded at the sherd surface exposed to radiant
heat (exterior surface). The maximum temperature recorded 1mm beneath the sherd’s exposed
surface was 245°C, and it reached its maximum temperature less than 5 seconds after the surface
temperature reached its maximum. They reached their maximum as they were pulled from the
kiln, which indicates that the sherd would have continued to heat if left in the kiln longer. The
temperatures slightly plateaued immediately after being removed from heat, but then rapidly
declined in temperature and plateaued again around 100°C, even though the lab room

36
temperature was approximately 20°C (as seen on the graph prior to heating). The graph above
only represents one of the textured utility sherds, thus it does not match the temperature readings
exactly to the other five, but is representative of the trend of temperatures to which the sherds are
exposed and to which they heated.
Textured utility ceramics in the low heat and longer duration environment showed no
other changes. The very slight discoloration to the two sherds does not reduce the archaeologist’s
ability to extract cultural information, and thus will not be considered damage.
Textured Utility: 900°C x 60 sec
Figure 4.3. Textured utility 900°C x 60 sec typical effects
The textured utility ceramics in the 900°C x 60 second environment all displayed surface
color change. Two of the six sherds showed severe enough color change to produce blackening.
Five of these six sherds showed surface color change on both surfaces, the interior and exterior,
while the last one had surface color change only on the interior surface, which was downward-
facing during each test.

37
As seen in the temperature graph above (Figure 4.3), the maximum artifact temperature
reached was approximately 390°C, which was recorded at the sherd surface exposed to radiant
heat (exterior surface). The maximum temperature recorded 1mm beneath the sherd’s exposed
surface was 320°C, and it reached its maximum temperature approximately 5 seconds after the
surface temperature reached its maximum. They reached their maximum as they were pulled
from the kiln, which indicates that the sherd would have continued to heat if left in the kiln
longer. The temperatures slightly plateaued immediately after being removed from heat, but then
rapidly declined in temperature and plateaued again around 135°C, even though the lab room
temperature was approximately 20°C (as seen on the graph prior to heating). The graph above
only represents one of the textured utility sherds, thus it does not match the temperature readings
exactly to the other five, but is representative of the trend of temperatures to which the sherds are
exposed and to which they heated.
Textured utility ceramics in the high heat and shorter duration environment showed no
other changes. The discoloration is severe enough to affect how an archaeologist might interpret
the artifact. This level of discoloration constitutes irreversible damage.

38
Textured Utility: 900°C x 90 sec
Figure 4.4. Textured utility 900°C x 90 sec typical effects
All six textured utility sherds exposed to the 900°C x 90 seconds dose experienced
surface color change, two of which were severe enough to produce blackening. Unlike the last
test, five of these six sherds showed surface color change on the interior only and one showed
change on the interior and exterior.
As seen in the temperature graph above (Figure 4.4), the maximum artifact temperature
reached was approximately 420°C, which was recorded at the sherd surface exposed to radiant
heat (exterior surface). The maximum temperature recorded 1mm beneath the sherd’s exposed
surface was 370°C, and it reached its maximum temperature approximately 5 seconds after the
surface temperature reached its maximum. They reached their maximum as they were pulled
from the kiln, which indicates that the sherd would have continued to heat if left in the kiln
longer. The temperatures slightly plateaued immediately after being removed from heat, but then
rapidly declined in temperature and plateaued again around 80°C, even though the lab room

39
temperature was approximately 20°C (as seen on the graph prior to heating). The graph above
only represents one of the textured utility sherds, thus it does not match the temperature readings
exactly to the other five, but is representative of the trend of temperatures to which the sherds are
exposed and to which they heated.
The textured utility ceramics in the high heat and longer duration environment showed no
other changes. However, the discoloration is severe enough to affect how an archaeologist might
interpret the artifact. This level of discoloration constitutes irreversible damage.
Carbon Paint: 600°C x 60 sec
Figure 4.5. Carbon paint 600°C x 60 sec typical effects
Only one of six carbon paint sherds experienced slip color change in heat dose 600°C x
60 seconds. This change was so slight that it did not affect the contrast between the dark gray
paint and the (post-burn) light cream-colored slip. The affected surface was the interior, which
was facing up during the kiln test, exposing it to the radiant heat. No other changes were
observed.

40
As seen in the temperature graph above (Figure 4.5), the maximum artifact temperature
reached was approximately 175°C, which was recorded at the sherd surface exposed to radiant
heat (exterior surface). The maximum temperature recorded 1mm beneath the sherd’s exposed
surface was 155°C, and it reached its maximum temperature less than 5 seconds after the surface
temperature reached its maximum. They reached their maximum as they were pulled from the
kiln, which indicates that the sherd would have continued to heat if left in the kiln longer. The
temperatures slightly plateaued immediately after being removed from heat, but then rapidly
declined in temperature and plateaued again around 60°C, even though the lab room temperature
was approximately 20°C (as seen on the graph prior to heating). The graph above only represents
one of the carbon paint sherds, thus it does not match the temperature readings exactly to the
other five, but is representative of the trend of temperatures to which the sherds are exposed and
to which they heated.
The very slight discoloration to these artifacts does not reduce the ability to extract
cultural information, and thus is not considered significant enough to be labeled as damage.

41
Carbon Paint: 600°C x 90 sec
Figure 4.6. Carbon paint 600°C x 90 sec typical effects
All six carbon paint ceramics in the 600°C x 90 seconds dose experienced slip color
change, two of which were severe enough to produce blackening. The same two sherds that
blackened also displayed paint color change. All six sherds were affected on the upward-facing
surface (five of the upward faces were interior surfaces and one was an exterior surface), which
was most exposed to the radiant heat from the kiln.
As seen in the temperature graph above (Figure 4.6), the maximum artifact temperature
reached was approximately 280°C, which was recorded at the sherd surface exposed to radiant
heat (exterior surface). The maximum temperature recorded 1mm beneath the sherd’s exposed
surface was 200°C, and it reached its maximum temperature less than 5 seconds after the surface
temperature reached its maximum. They reached their maximum as they were pulled from the
kiln, which indicates that the sherd would have continued to heat if left in the kiln longer. The
temperatures slightly plateaued immediately after being removed from heat, but then rapidly

42
declined in temperature and plateaued again around 90°C, even though the lab room temperature
was approximately 20°C (as seen on the graph prior to heating). The graph above only represents
one of the carbon paint sherds, thus it does not match the temperature readings exactly to the
other five, but is representative of the trend of temperatures to which the sherds are exposed and
to which they heated.
Carbon paint ceramics in the low heat and longer duration environment showed no other
change. Unfortunately, discoloration was severe enough to potentially affect how an
archaeologist might interpret the artifact. This level of discoloration constitutes irreversible
damage.
Carbon Paint: 900°C x 60 sec
Figure 4.7. Carbon paint 900°C x 60 sec typical effects
Again, all six carbon paint sherds showed signs of slip color change and paint color
change, three of which can be classified as blackening in in the 900°C x 60 second dose. One of
the sherds that was blackened from slip color change also displayed paint color change. Five of
43
the sherds were affected on both surfaces and one was only affected on its exterior surface,
which was facing down in the sand bed during the kiln test.
As seen in the temperature graph above (Figure 4.7), the maximum artifact temperature
reached was approximately 350°C, which was recorded at the sherd surface exposed to radiant
heat (exterior surface). The maximum temperature recorded 1mm beneath the sherd’s exposed
surface was 200°C, and it reached its maximum temperature approximately 5 seconds after the
surface temperature reached its maximum. They reached their maximum as they were pulled
from the kiln, which indicates that the sherd would have continued to heat if left in the kiln
longer. The temperatures slightly plateaued immediately after being removed from heat, but then
rapidly declined in temperature and plateaued again around 110°C, even though the lab room
temperature was approximately 20°C (as seen on the graph prior to heating). The graph above
only represents one of the carbon paint sherds, thus it does not match the temperature readings
exactly to the other five, but is representative of the trend of temperatures to which the sherds are
exposed and to which they heated.
The discoloration to carbon paint ceramics caused by high heat and a short duration is
severe enough to affect how an archaeologist might interpret the artifact. No other changes were
observed, but the level of discoloration constitutes irreversible damage.

44
Carbon Paint: 900°C x 90 sec
Figure 4.8. Carbon paint 900°C x 90 sec typical effects
Four of the six carbon paint ceramics in the 900°C x 90 seconds dose experienced slip
color change. Of the four that experienced slip color change, one was blackened. Three of the
artifacts showed slip color change on both surfaces, while one was affected on the interior
surface, which was facing down during the kiln test.
As seen in the temperature graph above (Figure 4.8), the maximum artifact temperature
reached was approximately 495°C, which was recorded at the sherd surface exposed to radiant
heat (exterior surface). The maximum temperature recorded 1mm beneath the sherd’s exposed
surface was 390°C, and it reached its maximum temperature approximately 15 seconds after the
surface temperature reached its maximum. They reached their maximum as they were pulled
from the kiln, which indicates that the sherd would have continued to heat if left in the kiln
longer. The temperatures slowly declined and later plateaued around 105°C, even though the lab
room temperature was approximately 20°C (as seen on the graph prior to heating). The graph
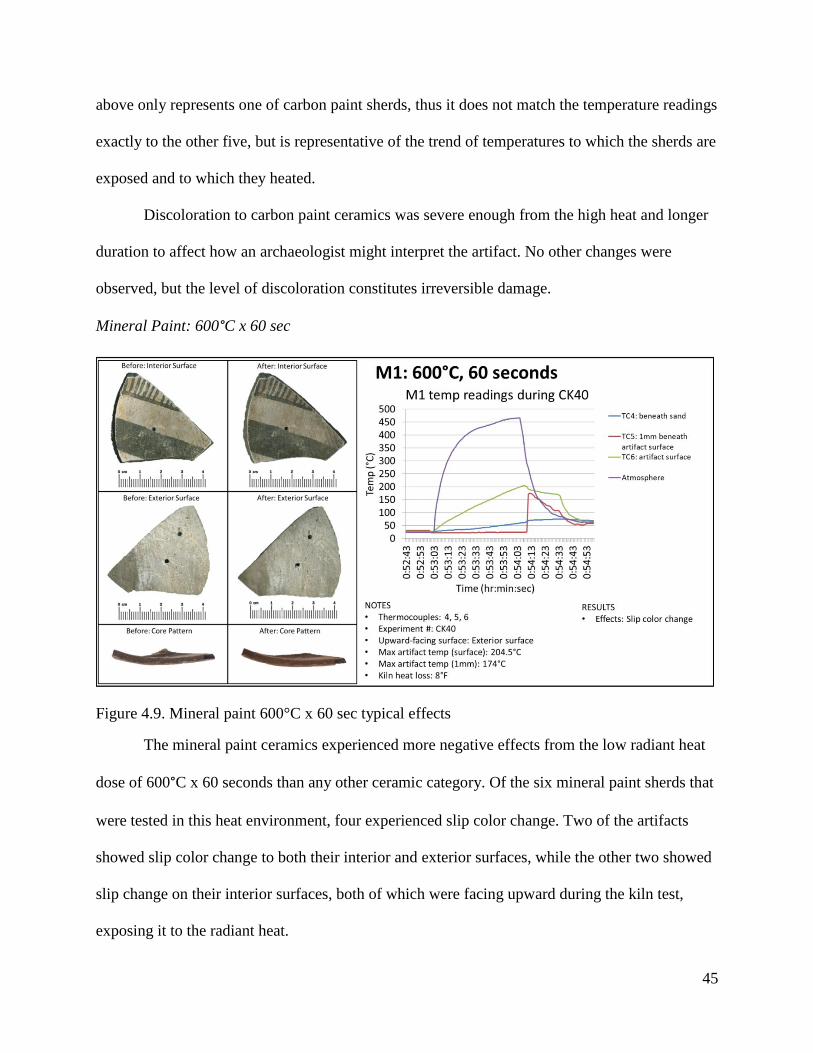
45
above only represents one of carbon paint sherds, thus it does not match the temperature readings
exactly to the other five, but is representative of the trend of temperatures to which the sherds are
exposed and to which they heated.
Discoloration to carbon paint ceramics was severe enough from the high heat and longer
duration to affect how an archaeologist might interpret the artifact. No other changes were
observed, but the level of discoloration constitutes irreversible damage.
Mineral Paint: 600°C x 60 sec
Figure 4.9. Mineral paint 600°C x 60 sec typical effects
The mineral paint ceramics experienced more negative effects from the low radiant heat
dose of 600°C x 60 seconds than any other ceramic category. Of the six mineral paint sherds that
were tested in this heat environment, four experienced slip color change. Two of the artifacts
showed slip color change to both their interior and exterior surfaces, while the other two showed
slip change on their interior surfaces, both of which were facing upward during the kiln test,
exposing it to the radiant heat.

46
As seen in the temperature graph above (Figure 4.9), the maximum artifact temperature
reached was approximately 200°C, which was recorded at the sherd surface exposed to radiant
heat (exterior surface). The maximum temperature recorded 1mm beneath the sherd’s exposed
surface was 175°C, and it reached its maximum temperature approximately 5 seconds after the
surface temperature reached its maximum. They reached their maximum as they were pulled
from the kiln, which indicates that the sherd would have continued to heat if left in the kiln
longer. The surface temperature slightly plateaued immediately after being removed from heat,
but then rapidly declined in temperature and plateaued again around 50°C, even though the lab
room temperature was approximately 20°C (as seen on the graph prior to heating). The graph
above only represents one of the mineral paint sherds, thus it does not match the temperature
readings exactly to the other five, but is representative of the trend of temperatures to which the
sherds are exposed and to which they heated.
Mineral paint ceramics in the low heat and short duration environment showed no other
changes. Then again, discoloration was severe enough to potentially affect how an archaeologist
might interpret the artifact. This level of discoloration constitutes irreversible damage.
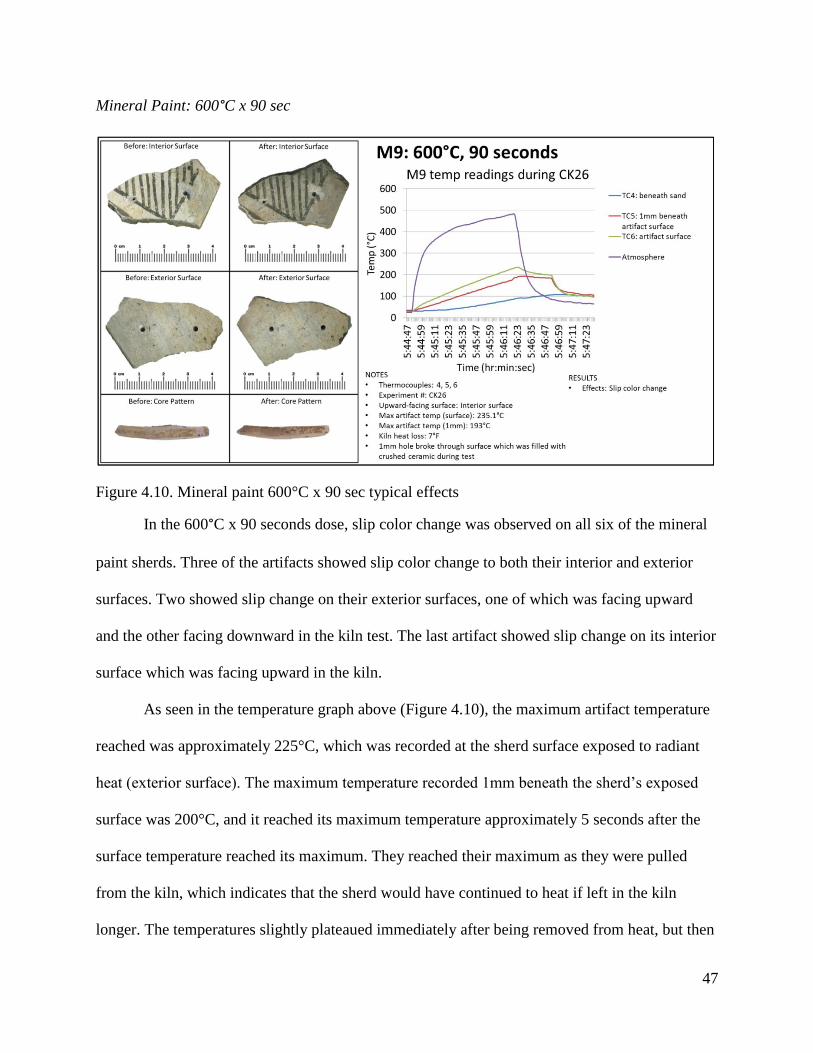
47
Mineral Paint: 600°C x 90 sec
Figure 4.10. Mineral paint 600°C x 90 sec typical effects
In the 600°C x 90 seconds dose, slip color change was observed on all six of the mineral
paint sherds. Three of the artifacts showed slip color change to both their interior and exterior
surfaces. Two showed slip change on their exterior surfaces, one of which was facing upward
and the other facing downward in the kiln test. The last artifact showed slip change on its interior
surface which was facing upward in the kiln.
As seen in the temperature graph above (Figure 4.10), the maximum artifact temperature
reached was approximately 225°C, which was recorded at the sherd surface exposed to radiant
heat (exterior surface). The maximum temperature recorded 1mm beneath the sherd’s exposed
surface was 200°C, and it reached its maximum temperature approximately 5 seconds after the
surface temperature reached its maximum. They reached their maximum as they were pulled
from the kiln, which indicates that the sherd would have continued to heat if left in the kiln
longer. The temperatures slightly plateaued immediately after being removed from heat, but then

48
rapidly declined in temperature and plateaued again around 100°C, even though the lab room
temperature was approximately 20°C (as seen on the graph prior to heating). The graph above
only represents one of the mineral paint sherds, thus it does not match the temperature readings
exactly to the other five, but is representative of the trend of temperatures to which the sherds are
exposed and to which they heated.
Mineral paint ceramics in the low heat and longer duration environment showed no other
changes. However, discoloration was severe enough to potentially affect how an archaeologist
might interpret the artifact. This level of discoloration constitutes irreversible damage.
Mineral Paint: 900°C x 60 sec
Figure 4.11. Mineral paint 900°C x 60 sec typical effects
In the 900°C x 60 second dose, all six of the mineral paint sherds showed slip color
change and blackening. All of the artifacts showed slip color change to both their interior and
exterior surfaces. Paint color change was also observed on two of the samples, one of which

49
occurred only on the interior surface, the only surface with paint, and the other paint change
occurred on both surfaces.
As seen in the temperature graph above (Figure 4.11), the maximum artifact temperature
reached was approximately 320°C, which was recorded at the sherd surface exposed to radiant
heat (exterior surface). The maximum temperature recorded 1mm beneath the sherd’s exposed
surface was 330°C, and it reached its maximum temperature approximately 5 seconds after the
surface temperature reached its maximum. They reached their maximum as they were pulled
from the kiln, which indicates that the sherd would have continued to heat if left in the kiln
longer. The temperatures plateaued immediately after being removed from heat, but then rapidly
declined in temperature and plateaued again around 150°C, even though the lab room
temperature was approximately 20°C (as seen on the graph prior to heating). The graph above
only represents one of the mineral paint sherds, thus it does not match the temperature readings
exactly to the other five, but is representative of the trend of temperatures to which the sherds are
exposed and to which they heated.
Discoloration to mineral paint ceramics was severe enough from the high heat and shorter
duration to affect how an archaeologist might interpret the artifact. No other changes were
observed, but the level of discoloration constitutes irreversible damage.
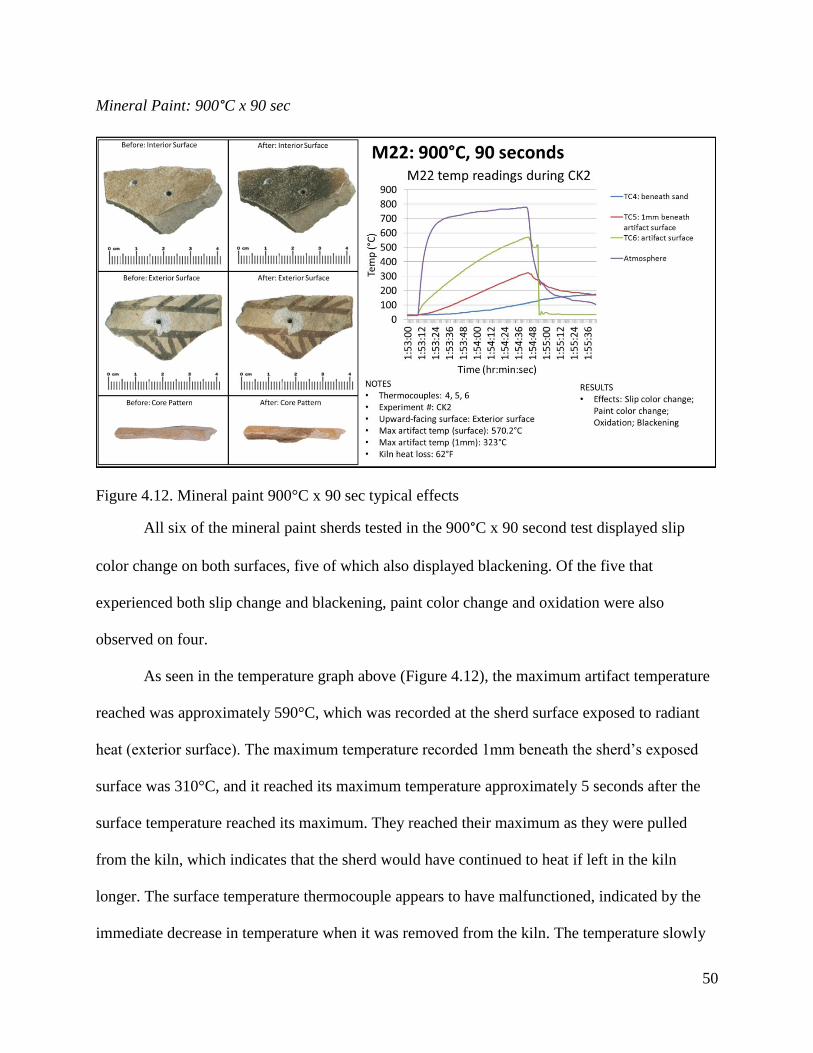
50
Mineral Paint: 900°C x 90 sec
Figure 4.12. Mineral paint 900°C x 90 sec typical effects
All six of the mineral paint sherds tested in the 900°C x 90 second test displayed slip
color change on both surfaces, five of which also displayed blackening. Of the five that
experienced both slip change and blackening, paint color change and oxidation were also
observed on four.
As seen in the temperature graph above (Figure 4.12), the maximum artifact temperature
reached was approximately 590°C, which was recorded at the sherd surface exposed to radiant
heat (exterior surface). The maximum temperature recorded 1mm beneath the sherd’s exposed
surface was 310°C, and it reached its maximum temperature approximately 5 seconds after the
surface temperature reached its maximum. They reached their maximum as they were pulled
from the kiln, which indicates that the sherd would have continued to heat if left in the kiln
longer. The surface temperature thermocouple appears to have malfunctioned, indicated by the
immediate decrease in temperature when it was removed from the kiln. The temperature slowly

51
declined and then plateaued around 190°C, even though the lab room temperature was
approximately 20°C (as seen on the graph prior to heating). The graph above only represents one
of the mineral paint sherds, thus it does not match the temperature readings exactly to the other
five, but is representative of the trend of temperatures to which the sherds are exposed and to
which they heated.
The discoloration to mineral paint ceramics caused by high heat and a longer duration is
severe enough to affect how an archaeologist might interpret the artifact. No other changes were
observed, but the level of discoloration constitutes irreversible damage.
Plain Utility: 600°C x 60 sec
Figure 4.13. Plain utility 600°C x 60 sec typical effects
The six plain utility sherds tested in the 600°C x 60 second dose did not display any
negative effects. Plain utility does not experience any damage during the event of low heat, short
duration episodes.
52
As seen in the temperature graph above (Figure 4.13), the maximum artifact temperature
reached was approximately 225°C, which was recorded at the sherd surface exposed to radiant
heat (exterior surface). The maximum temperature recorded 1mm beneath the sherd’s exposed
surface was 600°C, and it reached its maximum temperature approximately 30 seconds after the
surface temperature reached its maximum and the sand bed was pulled from the kiln. They
reached their maximum as they were pulled from the kiln, which indicates that the sherd would
have continued to heat if left in the kiln longer. The temperature slowly declined and then
plateaued around 75°C, even though the lab room temperature was approximately 20°C (as seen
on the graph prior to heating). The graph above only represents one of the plain utility sherds,
thus it does not match the temperature readings exactly to the other five, but is representative of
the trend of temperatures to which the sherds are exposed and to which they heated. Due to the
lack of damage, this environment is not considered damaging.
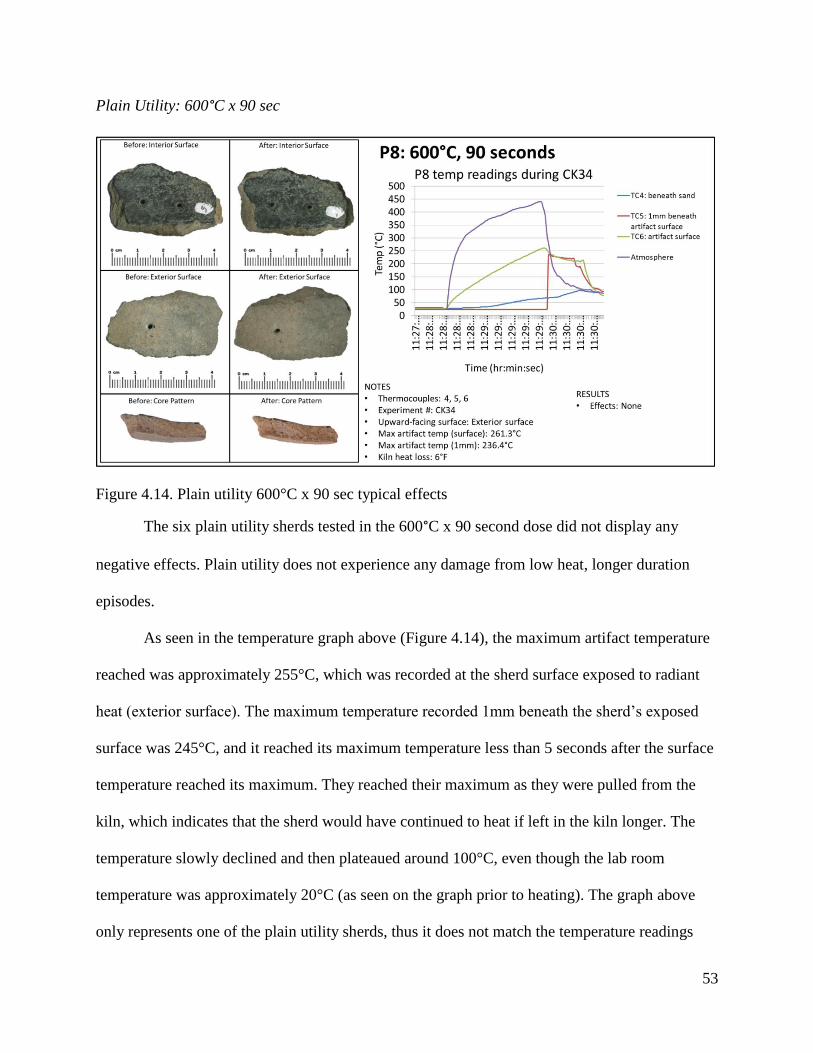
53
Plain Utility: 600°C x 90 sec
Figure 4.14. Plain utility 600°C x 90 sec typical effects
The six plain utility sherds tested in the 600°C x 90 second dose did not display any
negative effects. Plain utility does not experience any damage from low heat, longer duration
episodes.
As seen in the temperature graph above (Figure 4.14), the maximum artifact temperature
reached was approximately 255°C, which was recorded at the sherd surface exposed to radiant
heat (exterior surface). The maximum temperature recorded 1mm beneath the sherd’s exposed
surface was 245°C, and it reached its maximum temperature less than 5 seconds after the surface
temperature reached its maximum. They reached their maximum as they were pulled from the
kiln, which indicates that the sherd would have continued to heat if left in the kiln longer. The
temperature slowly declined and then plateaued around 100°C, even though the lab room
temperature was approximately 20°C (as seen on the graph prior to heating). The graph above
only represents one of the plain utility sherds, thus it does not match the temperature readings

54
exactly to the other five, but is representative of the trend of temperatures to which the sherds are
exposed and to which they heated. Due to the lack of effects, this environment is not considered
damaging.
Plain Utility: 900°C x 60 sec
Figure 4.15. Plain utility 900°C x 60 sec typical effects
All six plain utility sherds tested in the 900°C x 60 second dose experienced surface color
change. Two sherds experienced color change on both surfaces, two experienced change on the
exterior surface which was facing upward, and two experienced change on the interior surface
which was facing downward.
As seen in the temperature graph above (Figure 4.15), the maximum artifact temperature
reached was approximately 705°C, which was recorded at the sherd surface exposed to radiant
heat (exterior surface). It is important to note that this particular sherd does not have drilled
holes, so the thermocouple bead sat at the top of the artifact and the higher temperature reading is
likely due to the fact that the thermocouple was unsheathed. The maximum temperature recorded

55
beneath the artifact was 230°C, and it reached its maximum temperature approximately 20
seconds after the surface temperature reached its maximum. Again, there was not a 1mm beneath
the surface hole drilled in this sherd. In this case, the bead sat on the downward-facing surface
and this is likely the reason it is such a low temperature. The temperature slowly declined and
then plateaued around 80°C, even though the lab room temperature was approximately 20°C (as
seen on the graph prior to heating). The graph above only represents one of the plain utility
sherds, thus it does not match the temperature readings exactly to the other five, but is
representative of the trend of temperatures to which the sherds are exposed and to which they
heat. No other damages were observed, and although each sherd experienced discoloration,
these effects were so slight that it is not considered damage.
Plain Utility: 900°C x 90 sec
Figure 4.16. Plain utility 900°C x 90 sec typical effects
The six plain utility sherds tested in the 900°C x 90 second environment all experienced
surface color change. Two sherds experienced change on both surfaces, one experienced change

56
on the exterior surface which was facing upward, and three experienced change on the interior
surface which was facing downward.
As seen in the temperature graph above (Figure 4.16), the maximum artifact temperature
reached was approximately 280°C, which was recorded at the sherd surface exposed to radiant
heat (exterior surface). It is important to note that this particular sherd does not have drilled
holes, so the thermocouple bead sat at the top of the artifact and the higher temperature reading is
likely due to the fact that thermocouple bead was unsheathed. The maximum temperature
recorded beneath the artifact was 200°C, and it reached its maximum temperature less than 5
seconds after the surface temperature reached its maximum. Again, there was not a 1mm beneath
the surface hole drilled in this sherd. In this case, the bead sat on the downward-facing surface
and this is likely the reason it is such a low temperature. The temperatures slowly decreased and
then plateaued around 90°C, even though the lab room temperature was approximately 20°C (as
seen on the graph prior to heating). The graph above only represents one of the plain utility
sherds, thus it does not match the temperature readings exactly to the other five, but is
representative of the trend of temperatures to which the sherds are exposed and to which they
heat.
The discoloration to plain utility ceramics caused by high heat and a longer duration is
severe enough to affect how an archaeologist might interpret the artifact. No other changes were
observed, but the level of discoloration constitutes irreversible damage.

57
Glaze Paint: 600°C x 60 sec
Figure 4.17. Glaze paint 600°C x 60 sec typical effects
None of the six glaze paint sherds tested in the 600°C x 60 second environment displayed
any radiant heat effects. As seen in the temperature graph above (Figure 4.17), the maximum
artifact temperature reached was approximately 190°C, which was recorded at the sherd surface
exposed to radiant heat (exterior surface). The maximum temperature recorded 1mm beneath the
sherd’s exposed surface was 150°C, and it reached its maximum temperature around the same
time as the surface temperature reached its maximum. They reached their maximum as they were
pulled from the kiln, which indicates that the sherd would have continued to heat if left in the
kiln longer. The temperatures plateaued immediately after being removed from heat, but then
rapidly declined in temperature and plateaued again around 50°C, even though the lab room
temperature was approximately 20°C (as seen on the graph prior to heating). The graph above
only represents one of the glazed paint sherds, thus it does not match the temperature readings
exactly to the other five, but is representative of the trend of temperatures to which the sherds are

58
exposed and to which they heated. Due to the lack of effects, this low heat, short duration
environment is not considered damaging.
Glaze Paint: 600°C x 90sec
Figure 4.18. Glaze paint 600°C x 90 sec typical effects
In the 600°C x 90 second dose, four of the six glaze paint ceramics showed slip color
change. Three of the artifacts displayed change on their exterior surfaces, which were facing
upward in the kiln and the other showed change on both surfaces. No other effects were observed
to glaze paint ceramics in the low heat for a longer duration.
As seen in the temperature graph above (Figure 4.18), the maximum artifact temperature
reached was approximately 250°C, which was recorded at the sherd surface exposed to radiant
heat (exterior surface). The maximum temperature recorded 1mm beneath the sherd’s exposed
surface was 230°C, and it reached its maximum temperature around the same time as the surface
temperature reached its maximum. They reached their maximum as they were pulled from the
kiln, which indicates that the sherd would have continued to heat if left in the kiln longer. The

59
temperatures plateaued immediately after being removed from heat, but then rapidly declined in
temperature and plateaued again around 100°C, even though the lab room temperature was
approximately 20°C (as seen on the graph prior to heating). The graph above only represents one
of the glazed paint sherds, thus it does not match the temperature readings exactly to the other
five, but is representative of the trend of temperatures to which the sherds are exposed and to
which they heated. Although slip color change was observed on more than half of the samples,
the change was so light throughout that this environment should not be considered damaging.
Glaze Paint: 900°C x 60 sec
Figure 4.19. Glaze paint 900°C x 60 sec typical effects
Of the six glaze paint sherds that were exposed to 900°C x 60 seconds, all six
experienced slip color change, two of which were severe enough to blacken. Three of the sherds
showed change on both surfaces, while the other three showed change on only the interior
surfaces that were facing downward in the kiln. The discoloration to glaze paint ceramics caused

60
by high heat and a short duration is severe enough to affect how an archaeologist might interpret
the artifact.
As seen in the temperature graph above (4.19), the maximum artifact temperature reached
was approximately 395°C, which was recorded at the sherd surface exposed to radiant heat
(exterior surface). The maximum temperature recorded 1mm beneath the sherd’s exposed surface
was 400°C, and it reached its maximum temperature approximately 5 seconds after the surface
temperature reached its maximum. They reached their maximum as they were pulled from the
kiln, which indicates that the sherd would have continued to heat if left in the kiln longer. The
temperatures plateaued immediately after being removed from heat, but then rapidly declined in
temperature and plateaued again around 150°C, even though the lab room temperature was
approximately 20°C (as seen on the graph prior to heating). The temperature fluxuation in the
graph is abnormal, so there were likely a few glitches in these temperature readings. Also, the
graph above only represents one of the glazed paint sherds, thus it does not match the
temperature readings exactly to the other five, but is representative of the trend of temperatures
to which the sherds are exposed and to which they heated. No other changes were observed, but
the level of discoloration constitutes irreversible damage.

61
Glaze Paint: 900°C x 90 sec
Figure 4.20. Glaze paint 900°C x 90 sec typical effects
Four of the six glaze paint sherds displayed change during the 900°C x 90 second dose.
The four sherds showed slip color change, of which three were blackened. One of the blackened
and slip changed sherds also had paint color change. The discoloration to glaze paint ceramics
caused by high heat and a longer duration is severe enough to affect how an archaeologist might
interpret the artifact.
As seen in the temperature graph above (Figure 4.20), the maximum artifact temperature
reached was approximately 750°C, which was recorded at the sherd surface exposed to radiant
heat (exterior surface). It is important to note that this particular sherd does not have a hole
drilled all the way through, so the thermocouple bead sat at the top of the artifact and the higher
temperature reading is likely due to the fact that the thermocouple was unsheathed. The
maximum temperature recorded 1mm beneath the sherd’s exposed surface was 410°C, and it
reached its maximum temperature around the same time as the surface temperature reached its

62
maximum. They reached their maximum as they were pulled from the kiln, which indicates that
the sherd would have continued to heat if left in the kiln longer. The temperatures plateaued
immediately after being removed from heat, but then rapidly declined in temperature and
plateaued again around 180°C, even though the lab room temperature was approximately 20°C
(as seen on the graph prior to heating). The graph above only represents one of the glazed paint
sherds, thus it does not match the temperature readings precisely to the other five, but is
representative of the trend of temperatures to which the sherds are exposed and to which they
heated. No other changes were observed, but the level of discoloration constitutes irreversible
damage.
Table 4.1. Summary table of radiant heat effects
*Min= mineral; Glz= glaze; Carb= carbon; Text= textured; Pln= plain; SlCC= slip color change;
Bl= blackening; PCC= paint color change; SuCC= surface color change; Fractions=
#affected/#tested
600°C 900°C
Min
Paint
Glz
Paint
Carb
Paint
Text
Utility
Pln
Utility
Min
Paint
Glz
Paint
Carb
Paint
Text
Utility
Pln
Utility
60
sec
SlCC
(4/6)
None SlCC
(1/6)
SlCC
(1/6)
None SlCC
(6/6);
Bl
(6/6);
PCC
(2/6)
SlCC
(6/6);
Bl
(2/6)
SlCC
(6/6);
Bl
(3/6);
PCC
(1/6)
SuCC
(6/6);
Bl
(2/6)
SuCC
(6/6)
90
sec
SlCC
(6/6)
SlCC
(4/6)
SlCC
(6/6);
Bl
(2/6);
PCC
(2/6)
SuCC
(2/6)
None SlCC
(6/6);
Bl
(5/6);
PCC
(4/6);
Ox
(4/6)
SlCC
(6/6;
Bl
(3/6);
PCC
(1/6)
SlCC
(4/6);
Bl
(1/6)
SuCC
(6/6);
Bl
(2/6)
SuCC
(6/6)
Table 4.1 provides a summary of the visual observations of change that occurred after the
experiment. Constan’s analysis, which, as of May 2015 is in draft form, provides a more
quantitative assessment on how the ceramics discussed above reacted to radiant heat (personal

63
communication, 2015). Readers concerned with a detailed understanding of Constan’s analysis
should consult the pending final report; what follows is a brief synopsis aimed at the overall
goals of this thesis. For most sherds, there was no observed change in temper or weight before
and after heating (Table 4.2). For example, only seven of 120 sherds showed temper change, and
approximately 20% of the sherds became harder, while 18% became softer, according to Moh’s
scale before and after measurements (Table 4.3). When examining core pattern, Constan noticed
that approximately 34% of the samples exhibited change, which was observed across ceramic
categories and in most doses with the exception of plain utility at 600°C for 90 seconds and
carbon paint at 900°C for 60 seconds (Table 4.4). No cracking, fracturing, or vitrification was
observed. The effect that appeared to have had a correlation with the test variables (ceramic
category, duration, and temperature) was paint, slip and surface color change. Color change
increased with heat doses, and Constan notes that approximately 47% of sherds exposed to
600°C exhibited color change, while 80% of those exposed to 900°C exhibited color change. Of
course, the strength of these effects might change with a larger sample size.
Table 4.2. Weight (g) change table developed by Constan (personal communication, 2015)
Ceramics Category 600ºC 900ºC
Carbon Paint 0.22 0.16
Glaze Paint 0.02 0.04
Mineral Paint 0.04 0.08
Plain Utility 0.02 0.10
Textured Utility 0.02 0.14
Grand Total 0.06 0.10
Table 4.3. Hardness change, measured by Constan (personal communication, 2015)
Became Softer Same Hardness Became Harder Total
24 74 22 N= 120

64
Table 4.4. Core pattern change, measured by Constan (personal communication, 2015)
Core Pattern Stayed the Same Core Pattern Change Total
79 41 N= 120
Constan’s analysis is complimentary to the visual analysis described in this chapter.
While Constan observed and measured changes that an archaeological technician could not see
though visual analysis, like hardness and weight, they appear to be consistent across ceramic
category or heat dose. The more detailed analysis done by Constan verified the likelihood that
the primary visible effect of radiant heat on ceramics is color change, and that these are
observations archaeologists can make simply using a hand lens, suggesting that we should base
any recommendations for a mitigation guide on potential paint, slip and/or surface color change.
Chapter 5. Conclusions
Summary and Preservation Guide Development
In the Jemez Mountains of the American Southwest, archaeological sites have long been
exposed to frequent, low-severity wildfires, but in the last several decades the fire systems have
shifted to less frequent and more severe fires. If the trend toward increased severity of wildfires
continues, the likelihood for cultural resource damage will increase. For this reason,
archaeologists and land managers are looking for a way to protect archaeological resources from
fire damage.
Determining damage is important to archaeologists because cultural resources are non-
renewable and when damage occurs, it is irreversible. Previous studies have provided useful
information on how artifacts are damaged, but the results have been inconsistent (Table 1.2), and
methods have been incompletely reported. To fill this gap, a team of specialists has been
assembled in order to conduct a thorough study. Once the study is complete, the team will apply

65
those results to the problem by developing a preservation guide for fire managers and
archaeologists.
This thesis project involves the initial steps of this larger study, specifically an
experiment with ceramic artifacts in a kiln to test radiant heat, with the results reported in
Chapter 4. Based on the experimental results, damage caused by a specific temperature and
duration is dependent on the ceramic category exposed to that fire environment. For example,
textured utility, plain utility, carbon paint and glaze paints withstood the 600ºC for 60 seconds
radiant heat environment, but the mineral paints showed enough effects to be determined
damage. In fact, mineral paints experienced negative effects in all four radiant heat
environments, and all were considered damaging. Due to these results, mineral paints appears to
be the least resilient category of ceramic to radiant heat environments and should not be exposed
to radiant heat under any fuel load.
Carbon paint ceramics appear to be the second most sensitive category to radiant heat.
They are seriously damaged starting at the 600ºC x 90 second duration environment and continue
to show damage into the 900ºC for 60 seconds environment. Oddly, in the most severe heat and
duration (900ºC for 90 seconds), they showed very few effects. This inconsistency in carbon
paint damage was not expected, and the only way to better understand carbon paint ceramic
damage in radiant heat would be to conduct more tests to insure that the pattern is replicable, and
then have a chemist analyze the mechanism behind the change. Unfortunately, this is not
possible at this stage of the research. Since archaeologists prefer not to allow damage to artifacts,
the determination of which environment to start mitigating heat should be at 600ºC at 90
seconds, since damage was present.

66
The next two ceramic categories, both of which appeared to be somewhat resilient to
radiant heat, were textured utility and glaze paint. These two experienced very minor effects in
the 600ºC environments, which were not severe enough to constitute damage, but they were
more drastically affected in the 900ºC environments.
The plain utility ceramics displayed very minor effects in the 900ºC environments, but
not drastic enough to constitute damage. Thus, none of the doses were severe enough to be
considered damaging for plain utility. In this situation, the recommendation would be that there
is no need to intervene for a site whose ceramic assemblage is entirely comprised of plain utility.
Table 5.1. Determination of which kiln environments are damaging to ceramic categories
Ceramic Category Kiln Temperature
(ºC) x Duration
(seconds)
Did this dose
cause an
effect?
If so, were the effects
severe enough to be
considered damage?
Textured Utility 600 x 60 Yes No
600 x 90 Yes No
900 x 60 Yes Yes
900 x 90 Yes Yes
Carbon Paint 600 x 60 Yes No
600 x 90 Yes Yes
900 x 60 Yes Yes
900 x 90 Yes No
Mineral Paint 600 x 60 Yes Yes
600 x 90 Yes Yes
900 x 60 Yes Yes
900 x 90 Yes Yes
Plain Utility 600 x 60 No No
600 x 90 No No
900 x 60 Yes No
900 x 90 Yes No
Glaze Paint 600 x 60 No No
600 x 90 Yes No
900 x 60 Yes No
900 x 90 Yes No
Given these results, the problem with making recommendations to archaeologists and fire
managers who would be using the mitigation tool developed from these conclusions is that

67
typically assemblages contain multiple ceramic categories, and as summarized Table 5.1, the
ceramic categories have different capacities for withstanding radiant heat. In order to turn this
information into a guide that managers can use to make good and rapid judgments, we need to
consider how to protect ceramic resources as a collective group rather than how to protect them
as individual categories. The questions to address are: do we recommend that all ceramic
assemblages be protected from fuel loads that emit 600º for 60 seconds, our lowest experimental
dose, since at least one category displayed damage in said dose? Or, do we take the typical start
of damage to the ceramics in our study and recommend that fuel loads reaching levels that
translate to 900º for 60 seconds be treated? These recommendations should be based on what
archaeologists find important when they analyze sites based on surface artifact characteristics.
Although consultation with forest and cultural resource managers is ongoing, my preliminary
recommendation, based on the results, the interests of archaeologists, and the interests of fire
managers needing to manage fuel loads efficiently, is that fire events that emit 600ºC for 90
seconds or more should be prevented (either through prescribed burning to reduce fuel loads and
potential dose, or by moving/removing fuels) in order to preserve archaeological resources from
fire damage.
We can now refer back to the question in Chapter 2 on whether low, moderate or severe
fires would cause effects and/or damage. In this study, the 600°C doses were typical of moderate
intensity fires, while the 900°C doses were chosen to reflect severe intensity fires. If this holds
true in real fire environments, then we can say that ceramics experience radiant heat effects, and
sometimes damage, in moderate wildfires. In severe wildfires, ceramics would display frequent
damage. Again, the variables in fire intensity are very complex, which is why recommendations

68
based on this preliminary correlation of the experimental data with real-world situations in the
Jemez Mountains region will require review by the Arcburn Project team of specialists.
Thus, the set point for action will be further developed as the project continues to collect
data and consults with archaeologists who manage forested environments. How this
recommendation might be applied to real-world situations is displayed in Figures 5.1-5.8, a
prototype preservation guide, which focuses on providing practical recommendations in the form
of a decision tree (Figure 5.4). Clearly, the prototype preservation guide is not ready to be
applied as it stands in this thesis, which is why it does not contain any actual measures, and
instead uses vague language as a proxy. However, it helps map a direction that the ArcBurn team
can go to protect ceramics from radiant heat in real-world situations. It was created with the help
of consultants: Alexander Evans, Rachel Loehman, Jim Reardon, Faith Ann Heinsch, Megan
Friggens, Connie Constan and Bret Butler. Each of these individuals specializes in a field that is
directly related to portions of this guide.
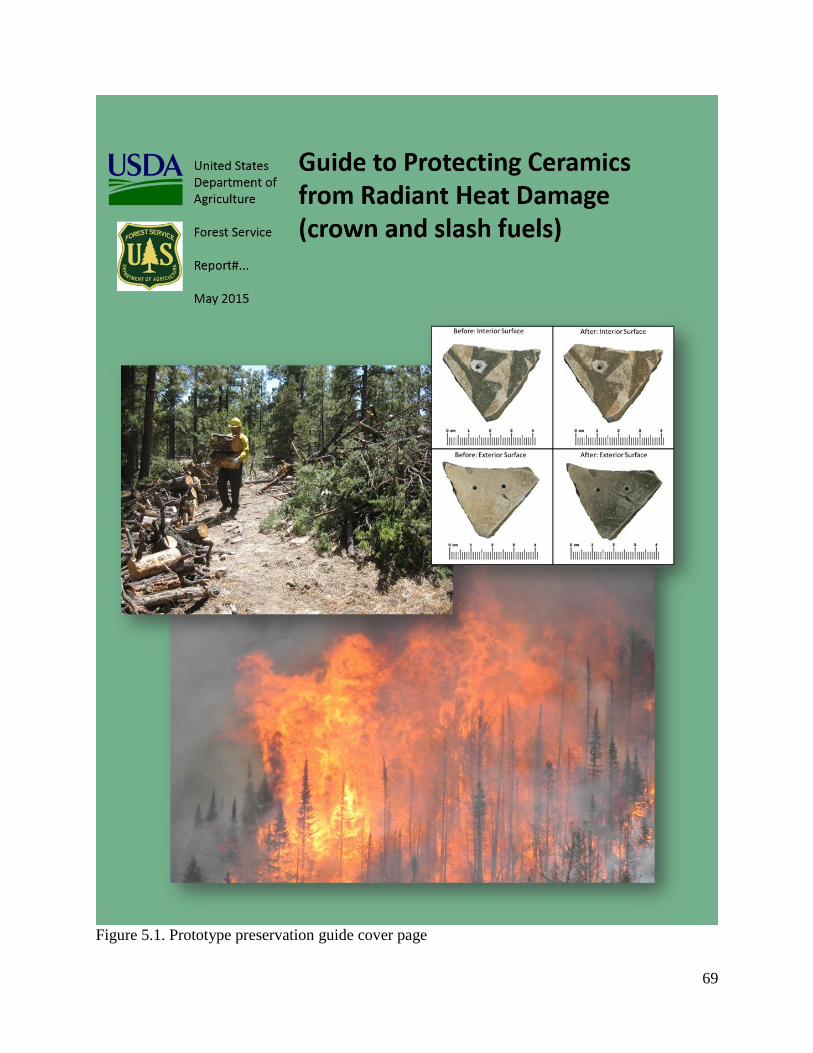
69
Figure 5.1. Prototype preservation guide cover page

70
Figure 5.2. Prototype preservation guide page 1

71
Figure 5.3. Prototype preservation guide page 2

72
Figure 5.4. Prototype preservation guide page 3

73
Figure 5.5. Prototype preservation guide page 4

74
Figure 5.6. Prototype preservation guide page 5

75
Figure 5.7. Prototype preservation guide page 6

76
Figure 5.8. Prototype preservation guide page 7
77
Future Work
This study has focused on macroscale damage, and incorporating other kinds of effects
that others have considered, would be useful to further explore. For example, Buenger
(2003:172) discovered that ceramics exposed to fire may be altered chemically, which we did not
measure. Archaeologists rely on dating methods like thermoluminesence to indicate how old an
artifact dates, which is valuable cultural information (Dunnell and Feathers 1995).
Thermoluminsecence dating is done by measuring the radiation dose, which builds since the last
time the crystalline materials in the ceramics have been exposed to light or heat (Dunnell and
Feathers 1995). Thus, determining whether a ceramic artifact has been burned in a recent fire is
very contextually important for how the archaeologist should date it. While it hasn’t been
researched, the integrity of other trace chemical and microbotantical analytical methods
conducted on ceramics might suffer as well. For example, conducting pollen, chemical residue or
DNA analysis would also likely be affected by moderate to severe heating of an artifact.
Last, there are implications this study could have on site interpretation as well as fire
history information. As an example for site interpretation, if pottery is buried in the
archaeological context and clearly has not been exposed to wildfires in the last several centuries,
but shows signs of burning, the archaeologist can determine, based on damage type, whether or
not it had been exposed to radiant heat and at what levels. This opens room for future
implications such as deliberate burning of structures and villages in the ancient past that might
profitably begin with some of the observations made in this study. Although the purpose of this
thesis is to identify the potential damage radiant heat can cause to ceramics and recommend
mitigation tactics, the identified patterns could be used in the opposite direction as well: certain

78
effects are caused by certain heat and duration levels, thus if those effects are seen on an artifact,
it’s possible to draw the connection between the two.
In the same vein, if fire managers are interested in an area’s fire history, but don’t have
historic records, the damages, or lack thereof, to ceramics may help verify presence or absence of
prehistoric or historic wildfires. Currently, fire managers are able to build fire histories with tree
cores and cookies, but to add another line of supporting data to their current methods could help
strengthen their conclusions about a region’s fire history. Although these two research lines
could be important for site interpretation and improving fire histories, their implementation lie
outside of the scope of this study.
References Cited
Adams, Charles E. and Andrew I. Duff
2004 The Prehistoric Pueblo World, A.D. 1275-1600. University of Arizona Press, Tucson.
Allen, C.D.
2001 Fire and Vegetation History of the Jemez Mountains. In, Water, Watersheds, and
LandUse in New Mexico: Impacts of Population Growth on Natural Resources, Santa Fe
Region. New Mexico Bureau of Mines and Mineral Resources, Socorro.
Bennett, Peter S. and Michael Kunzmann
1985 Effects of Heating on Artifacts: A Brief Report of Work Conducted at Western
Archaeological and Conservation Center, Tuscon. A study conducted by the National Park
Service in conjunction with University of Arizona.
Blinman, Eric
1993 Anasazi Pottery: Evolution of a Technology. Expedition 35(1):14-22.
Briggs, John M., Katherine A. Spielmann, Hoski Schaafsma, Kieth W. Kintigh, Melissa Kruse,
Kari Morehouse, and Karen Schollmeyer
2006 Why Ecology needs Archaeologists and Archaeology needs Ecologists. Front
Ecological Environment 4(4):180-188.
Bronitsky, Gordon
1986 The Use of Materials Science Techniques in the Study of Pottery Construction and Use.
Advances in Archaeological Method and Theory 9:209-276.
Bronitsky, Gordon and Robert Hamer

79
1986 Experiments in Ceramic Technology: The Effects of Various Tempering Materials on
Impact and Thermal-Shock Resistance. American Antiquity 51(1):89-101.
Buenger, Bret A.
2003 The Impact of Wildland and Prescribed Fire on Archaeological Resources. Unpublished
Ph.D. dissertation, Department of Anthropology, University of Kansas, Lawrence, KS.
Butler, B. W., J. Cohen, D. J. Latham, R. D. Schuette, P. Sopko, K. S. Shannon, D. Jimenez, and
L.S. Bradshaw
2004 Measurements of Radiant Emissive Power and Temperatures in Crown Fires. Canadian
Journal of Forest Research 34(8):1577-1587.
Cogswell, James W., Hector Niff and Michael D. Glascock
1996 The Effect of Firing Temperature on the Elemental Characterization of Pottery. Journal
of Archaeological Science 23:283-287.
Cordell, Linda
1994 Ancient Pueblo Peoples. St. Remy Press, Montreal.
1997 Archaeology of the Southwest. Academic Press, Inc., San Diego.
Crandall, W. B. and J. Ging
1955 Thermal Shock Analysis of Spherical Shapes. Journal of the American Ceramic Society
38(1):44-54.
Dobyns, Henry F.
2002 Puebloan Historic Demographic Trends. Ethnohistory 49(1):171-204.
Duke, Philip, Donna Cave and Robert Kimmick
2003 The Effects of Fire on Cultural Resources. Submitted to Department of Agriculture
U.S. Forest Service, Report no. 11021300-071. Copies available from Fort Lewis
College, Durango.
Dunnell, R.C. and J.K. Feathers
1995 Thermoluminescence Dating of Surficial Archaeological Material. In Dating in Surface
Context, edited by C. Beck, pp. 115-137. University of New Mexico Press, Albuquerque.
Farias, T.M.B., R.F. Gennari, C. Etchevarne, and S. Watanabe
2009 Thermoluminescence Dating of Brazilian Indigenous Ceramics. Radiation Protection
Dosimetry 136(1):45-49.
Graves, Michael W.
2001 Analyzing and Interpreting Ceramic Production and Disturbance in the American
Southwest. Reviews in Anthropology 29(3):253-272.
Guthe, Carl E.
80
1925 Pueblo Pottery Making: A Study at the Village of San Ildefonso. Yale University Press,
Andover.
Hangan, Margaret, Michael Lyndon, Connie Reid, Niel Weintraub, Brit Bettenson, and Chris
Ruff
2008 Wildland Fire Guidelines for Archaeologists on the Kaibab National Forest. Report
Summary, Forest Service, Kaibab National Forest, Fredonia.
Hartford, R., and W. Frandsen
1992 When It's Hot, It's Hot... Or Maybe It's Not! (Surface Flaming May Not Portend
Extensive Soil Heating). International Journal of Wildland Fire 2(3):139-144.
Keeley, Jon E.
2009 Fire Intensity, Fire Severity and Burn Severity: A Brief Review and Suggested Usage.
International Journal of Wildland Fire 18:116-126.
Lentz, Stephen C., Joan K. Gaunt, and Adisa J. Willmer
1996 Fire Effects on Archaeological Resources, Phase 1: The Henry Fire, Holiday Mesa,
Jemez Mountains, New Mexico, Submitted to U.S. Department of Agriculture Forest
Service, General Technical Report RM-GTR-273. U.S. Copies available from Rocky
Mountain Research Station, Fort Collins.
Lissoway, J.
1986 Fire and Resources Management, Unit III-C: Cultural Resources Management. In the
National Advanced Resource Technology Center Training Course, 3/17-28/86, Marana, pp.
1-23. Copies on file, Western Archaeological & Conservation Center, Tucson.
Lyneis, Margaret M.
1995 The Virgin Anasazi, Far Western Puebloans. The Journal of World Prehistory 9(2):199-
241.
MTBS
2015a 2000 New Mexico: CERRO GRANDE nm3590710632420000505. Electronic
document,
http://fsgeodata.net/MTBS_Uploads/data/2000/maps/NM3590710632420000505_map.pdf,
accessed May 1, 2015.
2015b 1996 New Mexico: DOME nm3576910637819960425. Electronic document,
http://fsgeodata.net/MTBS_Uploads/data/1996/maps/NM3576910637819960425_map.pdf,
accessed May 1, 2015.
2015c 2011 New Mexico: LAS CONCHAS nm3581210654120110626. Electronic document,
http://fsgeodata.net/MTBS_Uploads/data/2011/maps/NM3581210654120110626_map.pdf,
accessed May 1, 2015.
2015d 1998 New Mexico: OSO nm3602110631719980627. Electronic document,
http://fsgeodata.net/MTBS_Uploads/data/1998/maps/NM3602110631719980627_map.pdf,
accessed May 1, 2015.

81
2015e 2013 New Mexico: THOMPSON RIDGE nm3589210662020130531. Electronic
document,
http://fsgeodata.net/MTBS_Uploads/data/2013/maps/NM3589210662020130531_map.pdf,
accessed May 1, 2015.
Pierce, Christopher
2005 Reverse Engineering the Ceramic Cooking Pot: Cost and Performance Properties of
Plain and Textured Vessels. Journal of Archaeological Method and Theory 12(2):117-
157.
Rasmussen, Kaare L., Guillermo A. De La Fuente, Andrew D. Bond, Karsten K. Mathiesen, and
Sergio D. Vera
2012 Pottery Firing Temperatures: A New Method for Determining the Firing Temperature of
Ceramics and Burnt Clay. Journal of Archaeological Science 39:1705-1716.
Reed, William G. and Mike Bremer
2011 BAER Survey Heritage Specialist Report. Santa Fe National Forest and Valles Caldera
National Preserve: Las Conchas Fire Report. Submitted to the U.S. Forest Service.
Copies available at
Reyman, Jonathan
1993 60 Years of Southwestern Archaeology, A History of the Pecos Conference. University
of New Mexico Press, Albuquerque.
Rice, Prudence M.
1987 Pottery Analysis: A Sourcebook. The University of Chicago Press, Chicago and London.
Romme, William H., Craig D. Allen, John D. Bailey, William L. Baker, Brandon T.
Bestelmeyer, Peter M. Brown, Karen S. Eisenhart, M. Lisa Floyd, David W. Huffman, Brian F.
Jacobs, Richard F. Miller, Esteban H. Muldavin, Thomas W. Swetnam, Robin J. Tausch, and
Peter J. Weisberg
2009 Historical and Modern Disturbance Regimes, Stand Structures, and Landscape
Dynamics in Piñon-Juniper Vegetation of the Western United States. Rangeland Ecology
and Management 62(3):202-222.
Ruscavage-Barz, Samantha M.
1999 Fire in the Hole: The Effects of Fire on Subsurface Archaeological Materials.
Manuscript on file, Bandelier National Monument.
Ryan, Kevin C.
2010 Effects of Fire on Cultural Resources. Paper presented at the 6th International
Conference on Forest Fire Research, Coimbra.
Ryan, Kevin C., Ann T. Jones, Cassandra L. Koerner, Kristine M. Lee, and tech. eds.
2012 Wildland Fire in Ecosystems: Effects of Fire on Cultural Resources and Archaeology.
Submitted to Department of Agriculture U.S. Forest Service, General Technical Report

82
RMRS-GTR-42 Vol. 3. Copies available at the Rocky Mountain Research Station, Fort
Collins.
Rye, Owen S.
1981 Pottery Technology: Principles and Reconstruction. Taraxacum, Washington, D.C.
Schiffer, Michael B.
1990 The Influence of Surface Treatment on Heating Effectiveness of Ceramic Vessels.
Journal of Archaeological Science 17:373-381.
Schiffer, Michael B. and James M. Skibo
1997 The Explanation of Artifact Variability. American Antiquity 62(1):27-50.
Schiffer, Michael B., James M. Skibo, Tamara C. Boelke, Mark A. Neupert and Meredith
Aronson
1994 New Perspectives on Experimental Archaeology: Surface Treatments and Thermal
Response of the Clay Cooking Pot. American Antiquity 59(2):197-217.
Shepard, Anna O.
1956 Ceramics for the Archaeologist. Carnegie Institute of Washington, Washington, D.C.
Silvani, Xavier and Frederic Morandini
2009 Fire Spread Experiments in the Field: Temperature and heat Fluxes Measurements. Fire
Safety Journal 44:279-285.
Sinopoli, Carla M.
1991 Approaches to Archaeological Ceramics. Plenum Press, New York.
Silvani, Xavier and Frédéric Morandi
2009 Fire Spread Experiments in the Field: Temperature and Heat Fluxes Measurements. Fire
Safety Journal 44:279-285.
Sturdevant, Jay T., Rod Skalsky, and Cody L. Wienk
2009 Experimental Study of Local Fire Conditions and Effects on Surface or Near-Surface
Archaeological Resources at National Park Service Units -- Midwest Region. Submitted to
U.S. Depoartment of the Interior National Parks Service, JFSP Project Report 06-2-1-05.
Copies available at Midwest Archaeological Center, Lincoln.
Swetnam, Thomas W. and Julio L. Betancourt
1990 Fire—Southern Oscillation Relations in the Southwestern United States. Science
249(2972):1017-1020.
Touchan, Ramzi, Craig D. Allen, Thomas W. Swetnam
1996 Fire History and Climatic Patterns in Ponderosa Pine and Mixed-Conifer Forests of the
Jemez Mountains, Northern New Mexico. Proceedings of the second La Mesa Fire
symposium of 1994, Los Alamos.

83
Vale, Thomas R. (editor)
2002 Fire, Native Peoples, and the Natural Landscape. Island Press, Washington.
Van Hoose, Jonathan Eric
2006 Learning Lineages as Reflected in Ceramic Production in Early Historic Northwest New
Mexico. Ph.D. dissertation, Anthropology department, University of New Mexico,
Albuquerque.
Wendorf, Fred and Erik K. Reed
1955 A Reconstruction of Northern Rio Grande Prehistory. American Anthropologist 62:200-
227.
Wormington, H.M.
1947 Prehistoric Indians of the Southwest. The Denver Museum of Natural History, Denver.
Young, Lisa C. and Tammy Stone
1990 The Thermal Properties of Textured Ceramics: An Experimental Study. Journal of Field
Archaeology 17(2):195-203.
Appendix A: Kiln Experimental Data
Table A.1. Kneifel’s lab notes
*Art#: Artifact #; Kiln °C/sec: kiln temperature in degrees Celsius and duration in seconds; Max
Temp (1mm): maximum temperature 1mm beneath the artifact surface; Max Temp (surf):
maximum temperature at the surface of the artifact; TC #s: Thermocouple numbers attached to
artifact; Notes: Kiln heat loss in notes section is in ferenheight because the kiln read temp in °F.
Artifact
# Test #
Kiln temp °C
x Duration
(sec)
Max
Temp
(1mm)
Max
Temp
(surf) TC #s Notes
T1 CK44 600 x 60 172.5 201.3 1, 2, 3 Kiln heat loss 7°F
T2 CK43 600 x 60 155.7 167.5 1, 2, 3 Kiln heat loss 8°F
T3 CK42 600 x 60 157.2 228.2 1, 2, 3 Kiln heat loss 9°F
T4 CK41 600 x 60 167.2 192.6 1, 2, 3 Kiln heat loss 10°F
T25 CK47 600 x 60 109.8 375.9 1, 2, 3 Kiln heat loss 3°F
T26 CK48 600 x 60 115.4 365.2 1, 2, 3 Kiln heat loss 3°F
T5 CK36 600 x 90 151.3 171.1 1, 2, 3 Kiln heat loss 4°F

84
Artifact
# Test #
Kiln temp °C
x Duration
(sec)
Max
Temp
(1mm)
Max
Temp
(surf) TC #s Notes
T6 CK35 600 x 90 249.7 258 1, 2, 3 Kiln heat loss 5°F
T7 CK34 600 x 90 243.1 269.5 1, 2, 3 3 holes, one filled with
crushed ceramic during
test; Kiln heat loss 6°F
T8 CK33 600 x 90 178.8 222.7 1, 2, 3 Kiln heat loss 6°F
T11 CK32 600 x 90 171.8 259.1 1, 2, 3 3 holes, one filled with
crushed ceramic during
test; Kiln heat loss 4°F
T12 CK31 600 x 90 245.6 272 1, 2, 3 Kiln heat loss 3°F
T13 CK24 900 x 60 223.1 383 1, 2, 3 Kiln heat loss 62°F
T14 CK23 900 x 60 334.6 405.3 1, 2, 3 Kiln heat loss 64°F
T15 CK22 900 x 60 334.2 380.9 1, 2, 3 Broke during drilling;
Kiln heat loss 64°F
T16 CK21 900 x 60 323.9 385.1 1, 2, 3 Kiln heat loss 58°F
T17 CK20 900 x 60 417.6 441.5 1, 2, 3 Kiln heat loss 65°F
T18 CK19 900 x 60 313.3 406.7 1, 2, 3 Broke during drilling;
Kiln heat loss 65°F
T19 CK12 900 x 90 448.9 464.8 1, 2, 3 Kiln heat loss 66°F
T20 CK11 900 x 90 365.8 569.5 1, 2, 3 Kiln heat loss 64°F
T21 CK10 900 x 90 307.4 478.9 1, 2, 3 Kiln heat loss 63°F
T22 CK9 900 x 90 288.9 497.4 1, 2, 3 Kiln heat loss 59°F
T23 CK8 900 x 90 363.9 436 1, 2, 3 Kiln heat loss 65°F
T24 CK7 900 x 90 388.7 730 1, 2, 3 No thermocouple holes;
Broke during drilling;
Kiln heat loss 61°F
C1 CK46 600 x 60 7, 8, 9 Temp data not recorded;
Kiln heat loss 14°F
C2 CK45 600 x 60 152.4 191.3 7, 8, 9 Kiln heat loss 14°F

85
Artifact
# Test #
Kiln temp °C
x Duration
(sec)
Max
Temp
(1mm)
Max
Temp
(surf) TC #s Notes
C3 CK40 600 x 60 143.7 170.6 7, 8, 9 Kiln heat loss 8°F
C4 CK39 600 x 60 165.5 175.6 7, 8, 9 Kiln heat loss 5°F
C5 CK38 600 x 60 163.8 185.8 7, 8, 9 Kiln heat loss 6°F
C6 CK37 600 x 60 143.5 212.8 7, 8, 9 Kiln heat loss 3°F
C7 CK30 600 x 90 106.6 239.1 7, 8, 9 Kiln heat loss 3°F
C8 CK29 600 x 90 205.7 270.8 7, 8, 9 Kiln heat loss 2°F
C9 CK28 600 x 90 197.6 237.9 7, 8, 9 Kiln heat loss 4°F
C10 CK27 600 x 90 191 231.4 7, 8, 9 Kiln heat loss 3°F
C11 CK26 600 x 90 171 261.6 7, 8, 9 Kiln heat loss 7°F
C12 CK25 600 x 90 199.9 263.5 7, 8, 9 Kiln heat loss 2°F
C13 CK18 900 x 60 335.9 397 7, 8, 9 Kiln heat loss 62°F
C14 CK17 900 x 60 280.2 411.1 7, 8, 9 Kiln heat loss 63°F
C15 CK16 900 x 60 328.9 399.7 7, 8, 9 Kiln heat loss 63°F
C16 CK15 900 x 60 289.9 358 7, 8, 9 Kiln heat loss 62°F
C17 CK14 900 x 60 373.9 372.3 7, 8, 9 Kiln heat loss 64°F
C18 CK13 900 x 60 349.5 400.9 7, 8, 9 Kiln heat loss 64°F
C19 CK6 900 x 90 493.4 528.2 7, 8, 9 Kiln heat loss 63°F
C20 CK5 900 x 90 447.1 539.1 7, 8, 9 Kiln heat loss 62°F
C21 CK4 900 x 90 494.9 556.7 7, 8, 9 Kiln heat loss 58°F
C22 CK3 900 x 90 479.5 538.1 7, 8, 9 Kiln heat loss 63°F
C23 CK2 900 x 90 557.5 598.8 7, 8, 9 Kiln heat loss 62°F
C24 CK1 900 x 90 355.4 479.7 7, 8, 9 Kiln heat loss 67°F
M1 CK40 600 x 60 174 204.5 4, 5, 6 Kiln heat loss 8°F
M2 CK39 600 x 60 147 224.6 4, 5, 6 Kiln heat loss 5°F

86
Artifact
# Test #
Kiln temp °C
x Duration
(sec)
Max
Temp
(1mm)
Max
Temp
(surf) TC #s Notes
M3 CK38 600 x 60 153.7 197.7 4, 5, 6 Kiln heat loss 6°F
M4 CK37 600 x 60 185.7 212.8 4, 5, 6 Kiln heat loss 3°F
M25 CK46 600 x 60 1, 2, 3 Temp data not recorded;
Only has one hole (1mm)
due to artifact fragility;
Kiln heat loss 14°F
M26 CK45 600 x 60 142.4 397.9 1, 2, 3 Only has one hole (1mm)
due to artifact fragility;
Kiln heat loss 14°F
M5 CK30 600 x 90 220.7 198.7 4, 5, 6 Kiln heat loss 3°F
M6 CK29 600 x 90 212.5 244.3 4, 5, 6 Kiln heat loss 2°F
M7 CK28 600 x 90 234.6 271.1 4, 5, 6 Kiln heat loss 4°F
M8 CK27 600 x 90 228.1 261 4, 5, 6 Kiln heat loss 3°F
M9 CK26 600 x 90 193 235.1 4, 5, 6 Kiln heat loss 7°F
M11 CK25 600 x 90 215.1 275 4, 5, 6 Kiln heat loss 2°F
M12 CK18 900 x 60 321.3 324.6 4, 5, 6 Kiln heat loss 62°F
M13 CK17 900 x 60 351.7 395.1 4, 5, 6 Kiln heat loss 63°F
M14 CK16 900 x 60 343.4 385.2 4, 5, 6 Kiln heat loss 63°F
M15 CK15 900 x 60 409.3 388.5 4, 5, 6 Kiln heat loss 62°F
M16 CK14 900 x 60 362.6 343.3 4, 5, 6 Kiln heat loss 64°F
M17 CK13 900 x 60 341.5 322 4, 5, 6 Kiln heat loss 64°F
M18 CK6 900 x 90 510.8 729.4 4, 5, 6 Only has one hole (1mm)
due to artifact fragility;
Broke during drilling;
Kiln heat loss 63°F
M19 CK5 900 x 90 542.3 727.6 4, 5, 6 Only has one hole (1mm)
due to artifact fragility;
Broke during drilling;
Kiln heat loss 62°F
M20 CK4 900 x 90 461.5 547.1 4, 5, 6 Kiln heat loss 58°F

87
Artifact
# Test #
Kiln temp °C
x Duration
(sec)
Max
Temp
(1mm)
Max
Temp
(surf) TC #s Notes
M21 CK3 900 x 90 439.7 406.2 4, 5, 6 Kiln heat loss 63°F
M22 CK2 900 x 90 323 570.2 4, 5, 6 Kiln heat loss 62°F
M24 CK1 900 x 90 380.8 558.9 4, 5, 6 Kiln heat loss 67°F
P1 CK44 600 x 60 181 223.2 4, 5, 6 Kiln heat loss 7°F
P2 CK43 600 x 60 154 192.9 4, 5, 6 3 holes, one filled with
crushed ceramic during
test; Kiln heat loss 8°F
P3 CK42 600 x 60 164 164 4, 5, 6 Kiln heat loss 9°F
P4 CK41 600 x 60 73 224.7 4, 5, 6 Kiln heat loss 10°F
P25 CK47 600 x 60 111.4 425.6 4, 5, 6 Kiln heat loss 3°F
P26 CK48 600 x 60 135.2 416.5 4, 5, 6 Kiln heat loss 3°F
P5 CK36 600 x 90 211.1 233 4, 5, 6 Kiln heat loss 4°F
P6 CK35 600 x 90 224.7 266.3 4, 5, 6 Kiln heat loss 5°F
P8 CK34 600 x 90 236.4 261.3 4, 5, 6 Kiln heat loss 6°F
P9 CK33 600 x 90 259.4 275.9 4, 5, 6 Kiln heat loss 6°F
P10 CK32 600 x 90 239.2 264.1 4, 5, 6 Kiln heat loss 4°F
P11 CK31 600 x 90 201.9 235.6 4, 5, 6 Kiln heat loss 3°F
P12 CK24 900 x 60 373.4 445.3 4, 5, 6 Kiln heat loss 62°F
P13 CK23 900 x 60 182.3 675.6 4, 5, 6 No thermocouple holes;
Kiln heat loss 64°F
P14 CK22 900 x 60 278.9 408.2 4, 5, 6 3 holes, one filled with
crushed ceramic during
test; Kiln heat loss 64°F
P15 CK21 900 x 60 312.5 441 4, 5, 6 3 holes, one filled with
crushed ceramic during
test; Kiln heat loss 58°F
P16 CK20 900 x 60 227.4 731.7 4, 5, 6 No thermocouple holes;
Broke during drilling;
Kiln heat loss 65°F

88
Artifact
# Test #
Kiln temp °C
x Duration
(sec)
Max
Temp
(1mm)
Max
Temp
(surf) TC #s Notes
P17 CK19 900 x 60 242.7 719 4, 5, 6 No thermocouple holes;
Broke during drilling;
Kiln heat loss 65°F
P18 CK12 900 x 90 273.3 706.7 4, 5, 6 No thermocouple holes;
Kiln heat loss 66°F
P19 CK11 900 x 90 291.4 723 4, 5, 6 No thermocouple holes;
Broke during drilling;
Kiln heat loss 64°F
P20 CK10 900 x 90 279.6 750.3 4, 5, 6 No thermocouple holes;
Kiln heat loss 63°F
P21 CK9 900 x 90 347.3 549.7 4, 5, 6 Kiln heat loss 59°F
P22 CK8 900 x 90 251.5 766.2 4, 5, 6 No thermocouple holes;
Kiln heat loss 65°F
P23 CK7 900 x 90 304.8 785.4 4, 5, 6 No thermocouple holes;
Kiln heat loss 61°F
G1 CK46 600 x 60 1, 2, 3 Temp data not recorded;
Kiln heat loss 14°F
G2 CK40 600 x 60 143.7 184.2 1, 2, 3 Kiln heat loss 8°F
G3 CK39 600 x 60 143.6 187.5 1, 2, 3 Kiln heat loss 5°F
G4 CK38 600 x 60 155.4 184.1 1, 2, 3 Kiln heat loss 6°F
G5 CK37 600 x 60 153.6 206 1, 2, 3 Kiln heat loss 3°F
G25 CK45 600 x 60 159.1 216.6 4, 5, 6 Kiln heat loss 14°F
G6 CK30 600 x 90 197 242.4 1, 2, 3 Kiln heat loss 3°F
G7 CK29 600 x 90 280.6 327.8 1, 2, 3 Kiln heat loss 2°F
G8 CK28 600 x 90 182 276 1, 2, 3 Kiln heat loss 4°F
G9 CK27 600 x 90 290.9 300.7 1, 2, 3 Kiln heat loss 3°F
G11 CK26 600 x 90 236.7 231.7 1, 2, 3 Kiln heat loss 7°F
G12 CK25 600 x 90 231.9 263.5 1, 2, 3 Kiln heat loss 2°F
G13 CK18 900 x 60 353.7 390.6 1, 2, 3 Kiln heat loss 62°F

89
Artifact
# Test #
Kiln temp °C
x Duration
(sec)
Max
Temp
(1mm)
Max
Temp
(surf) TC #s Notes
G14 CK17 900 x 60 298.2 447.7 1, 2, 3 Kiln heat loss 63°F
G15 CK16 900 x 60 315.4 388.4 1, 2, 3 Kiln heat loss 63°F
G16 CK15 900 x 60 406.1 386.9 1, 2, 3 Kiln heat loss 62°F
G17 CK14 900 x 60 336.9 386.7 1, 2, 3 Kiln heat loss 64°F
G18 CK13 900 x 60 376.9 428.1 1, 2, 3 Kiln heat loss 64°F
G19 CK6 900 x 90 423.4 755.4 1, 2, 3 Only has one hole (1mm)
due to artifact fragility;
Broke during drilling;
Kiln heat loss 63°F
G20 CK5 900 x 90 434.3 529.6 1, 2, 3 Kiln heat loss 62°F
G21 CK4 900 x 90 513.9 564.6 1, 2, 3 Kiln heat loss 63°F
G22 CK3 900 x 90 356.5 446.1 1, 2, 3 Kiln heat loss 58°F
G23 CK2 900 x 90 385.8 681.7 1, 2, 3 Kiln heat loss 62°F
G24 CK1 900 x 90 487.6 1, 2, 3 Thermocouple recording
1mm below surface
temperature data stopped
working during test; Kiln
heat loss 67°F