Embed Size (px)
Citation preview
REC Market: An Overview IEX Limited, June 2018
For Public Use 1
In this Presentation
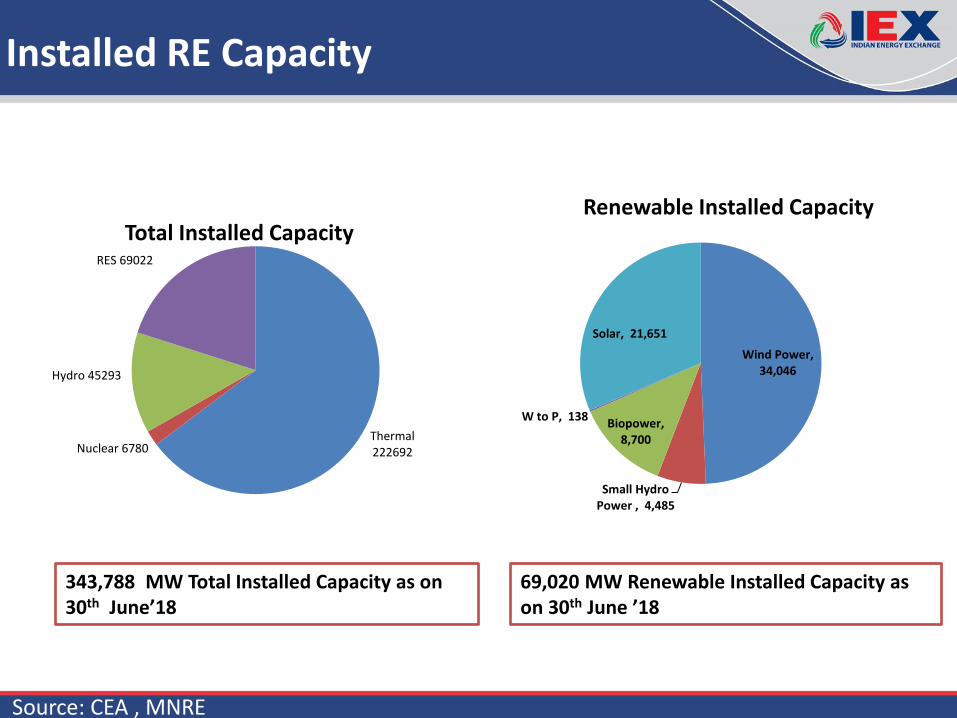
Installed RE Capacity
Source: CEA , MNRE
343,788 MW Total Installed Capacity as on 30th June’18
69,020 MW Renewable Installed Capacity as on 30th June ’18
Wind Power, 34,046
Small Hydro Power , 4,485
Biopower, 8,700
W to P, 138
Solar, 21,651
Renewable Installed Capacity
Thermal 222692 Nuclear 6780
Hydro 45293
RES 69022
Total Installed Capacity
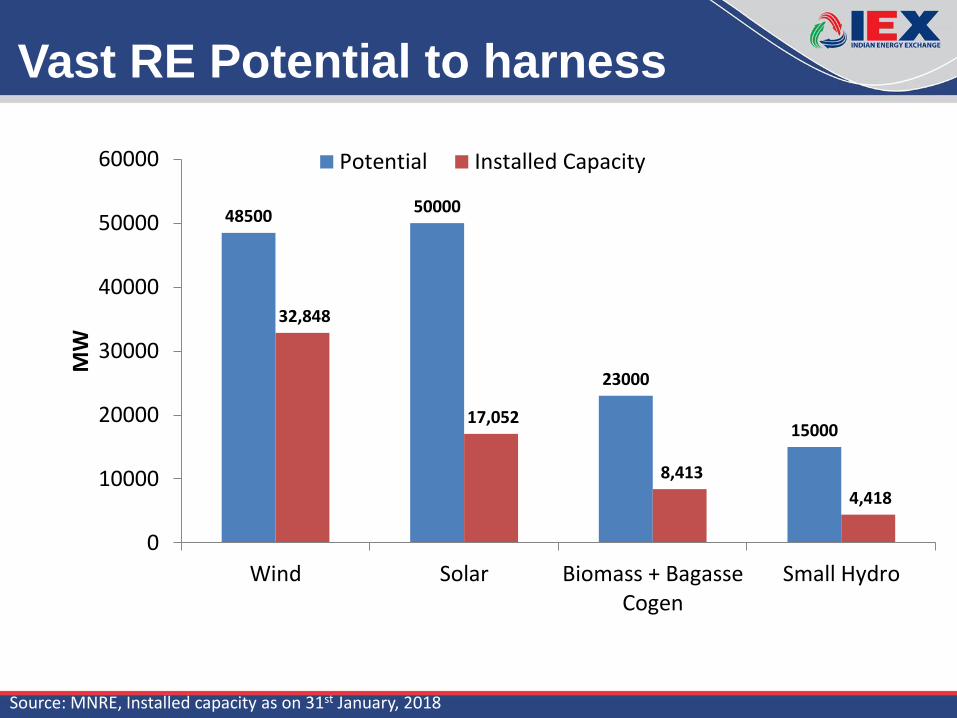
Vast RE Potential to harness
Source: MNRE, Installed capacity as on 31st January, 2018
48500 50000
23000
15000
32,848
17,052
8,413
4,418
0
10000
20000
30000
40000
50000
60000
Wind Solar Biomass + BagasseCogen
Small Hydro
MW
Potential Installed Capacity
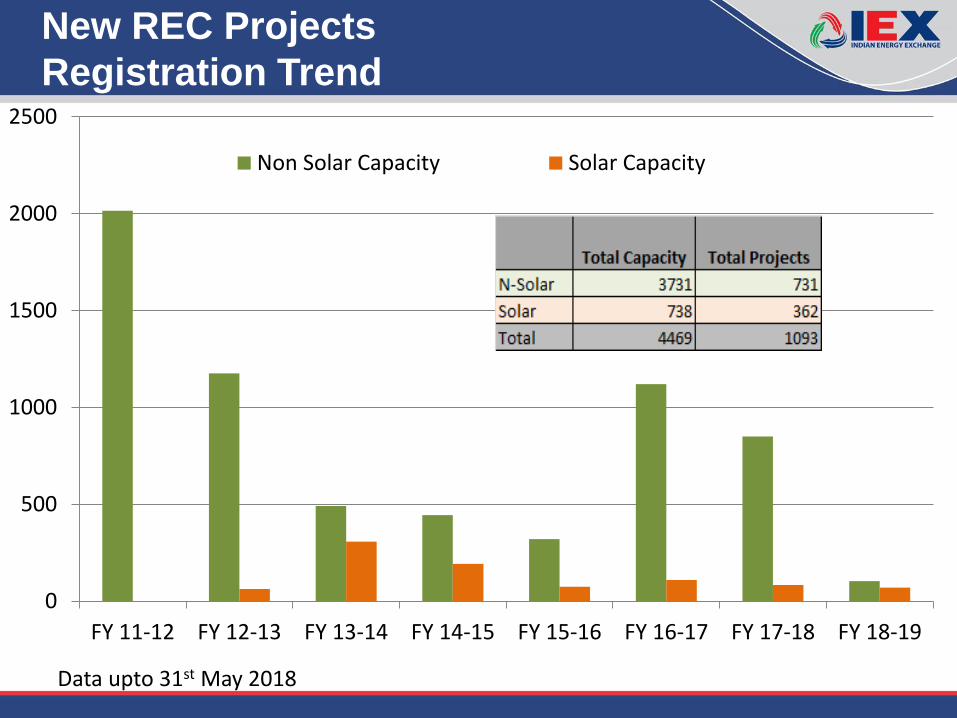
New REC Projects
Registration Trend
0
500
1000
1500
2000
2500
FY 11-12 FY 12-13 FY 13-14 FY 14-15 FY 15-16 FY 16-17 FY 17-18 FY 18-19
Non Solar Capacity Solar Capacity
Data upto 31st May 2018
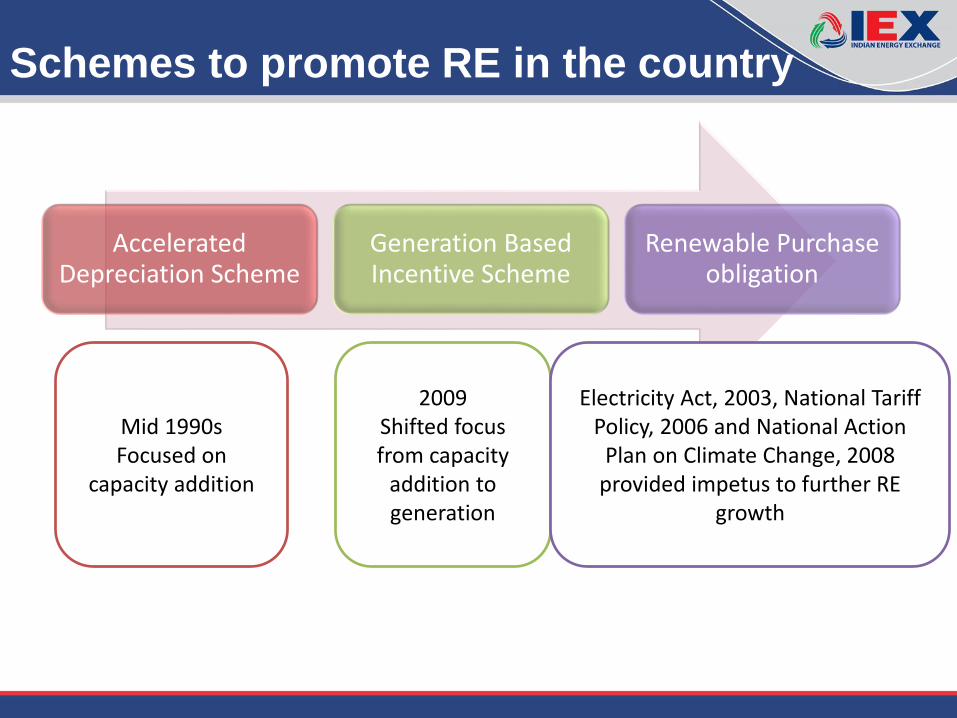
Schemes to promote RE in the country
Accelerated Depreciation Scheme
Generation Based Incentive Scheme
Renewable Purchase obligation
Mid 1990s Focused on
capacity addition
2009 Shifted focus from capacity
addition to generation
Electricity Act, 2003, National Tariff Policy, 2006 and National Action
Plan on Climate Change, 2008 provided impetus to further RE
growth
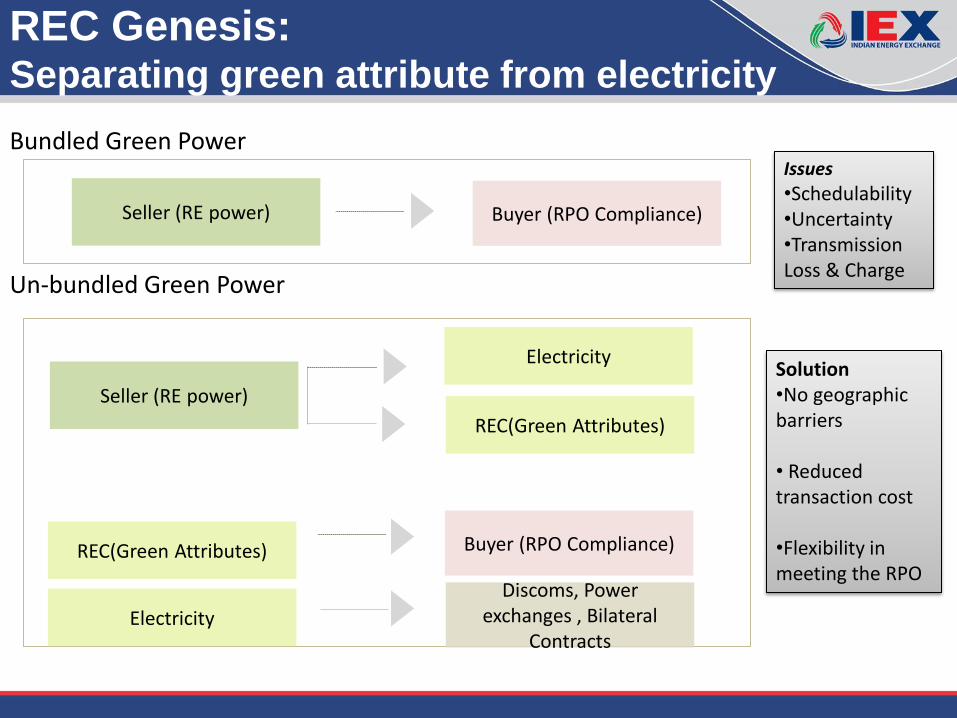
REC Genesis: Separating green attribute from electricity
Un-bundled Green Power
Seller (RE power)
REC(Green Attributes)
Electricity
REC(Green Attributes) Buyer (RPO Compliance)
Electricity
Bundled Green Power
Seller (RE power) Buyer (RPO Compliance)
Issues
•Schedulability •Uncertainty •Transmission Loss & Charge
Solution •No geographic barriers • Reduced transaction cost •Flexibility in meeting the RPO
Discoms, Power exchanges , Bilateral
Contracts
9
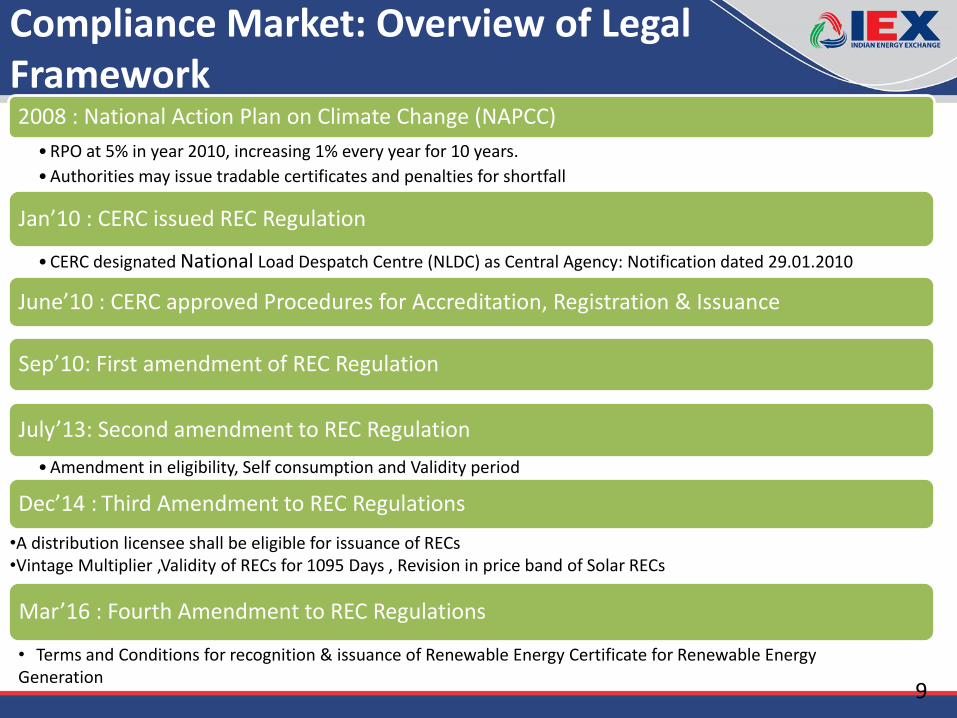
Compliance Market: Overview of Legal Framework 2008 : National Action Plan on Climate Change (NAPCC)
• RPO at 5% in year 2010, increasing 1% every year for 10 years.
• Authorities may issue tradable certificates and penalties for shortfall
Jan’10 : CERC issued REC Regulation
• CERC designated National Load Despatch Centre (NLDC) as Central Agency: Notification dated 29.01.2010
June’10 : CERC approved Procedures for Accreditation, Registration & Issuance
Sep’10: First amendment of REC Regulation
July’13: Second amendment to REC Regulation
• Amendment in eligibility, Self consumption and Validity period
Dec’14 : Third Amendment to REC Regulations
Mar’16 : Fourth Amendment to REC Regulations
•A distribution licensee shall be eligible for issuance of RECs •Vintage Multiplier ,Validity of RECs for 1095 Days , Revision in price band of Solar RECs
• Terms and Conditions for recognition & issuance of Renewable Energy Certificate for Renewable Energy Generation
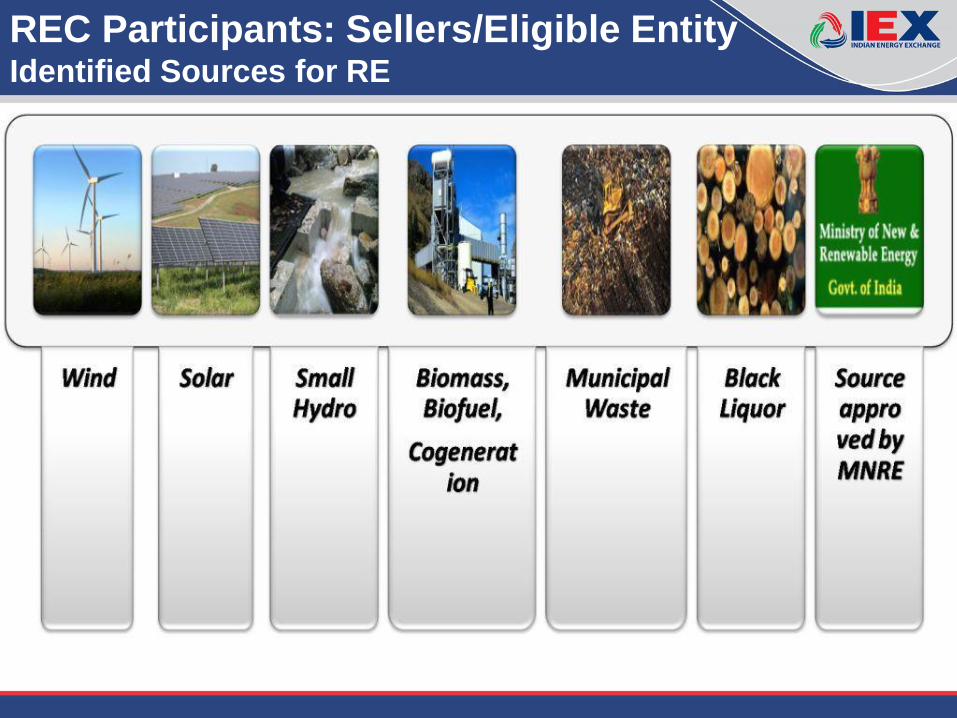
REC Participants: Sellers/Eligible Entity Identified Sources for RE
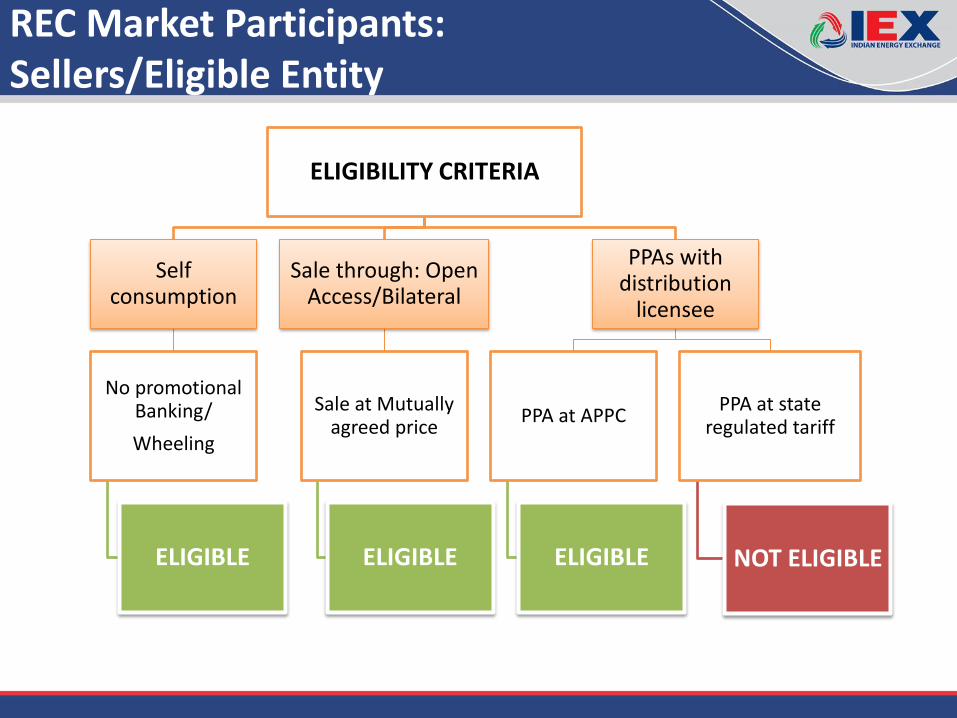
REC Market Participants: Sellers/Eligible Entity
ELIGIBILITY CRITERIA
Self consumption
No promotional Banking/
Wheeling
ELIGIBLE
Sale through: Open Access/Bilateral
Sale at Mutually agreed price
ELIGIBLE
PPAs with distribution
licensee
PPA at APPC
ELIGIBLE
PPA at state regulated tariff
NOT ELIGIBLE
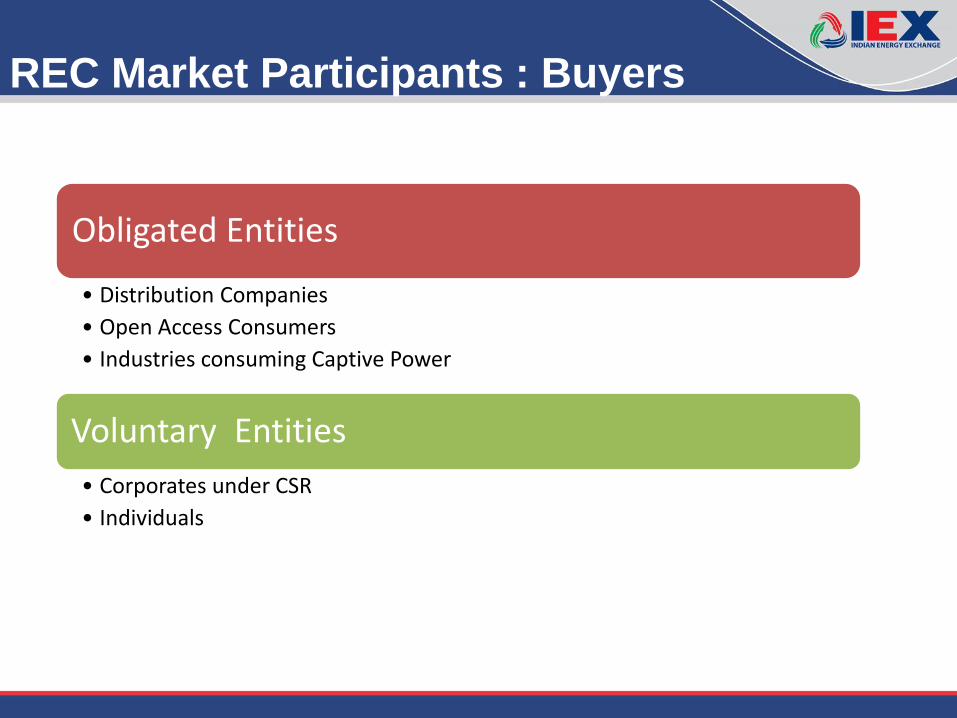
REC Market Participants : Buyers
Obligated Entities
• Distribution Companies
• Open Access Consumers
• Industries consuming Captive Power
Voluntary Entities
• Corporates under CSR
• Individuals
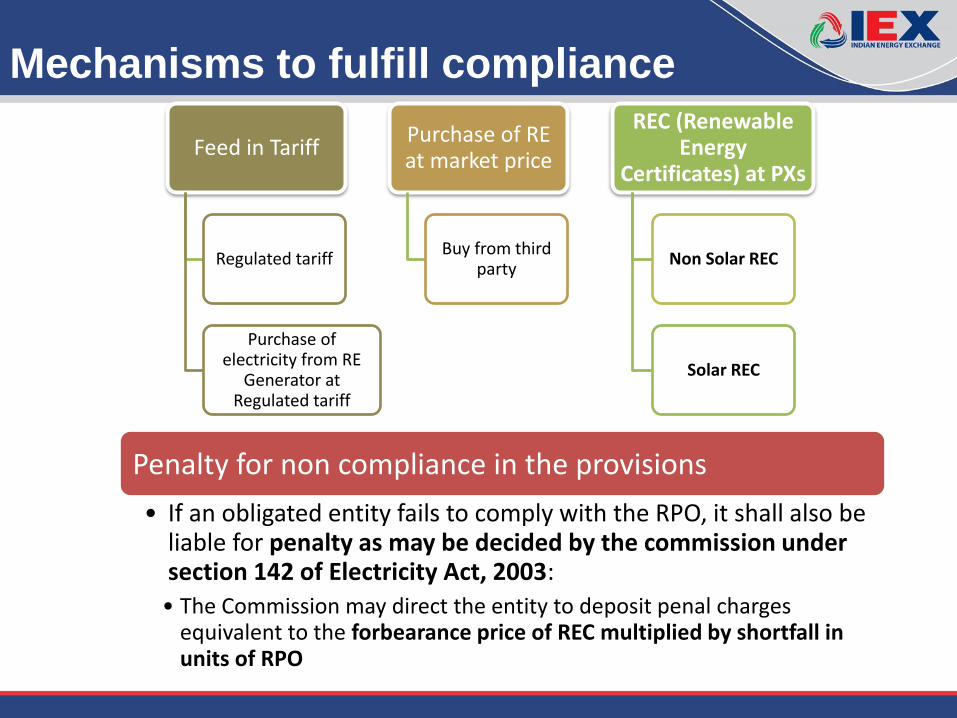
Mechanisms to fulfill compliance
Feed in Tariff
Regulated tariff
Purchase of electricity from RE
Generator at Regulated tariff
Purchase of RE at market price
Buy from third party
REC (Renewable Energy
Certificates) at PXs
Non Solar REC
Solar REC
Penalty for non compliance in the provisions
• If an obligated entity fails to comply with the RPO, it shall also be liable for penalty as may be decided by the commission under section 142 of Electricity Act, 2003:
• The Commission may direct the entity to deposit penal charges equivalent to the forbearance price of REC multiplied by shortfall in units of RPO
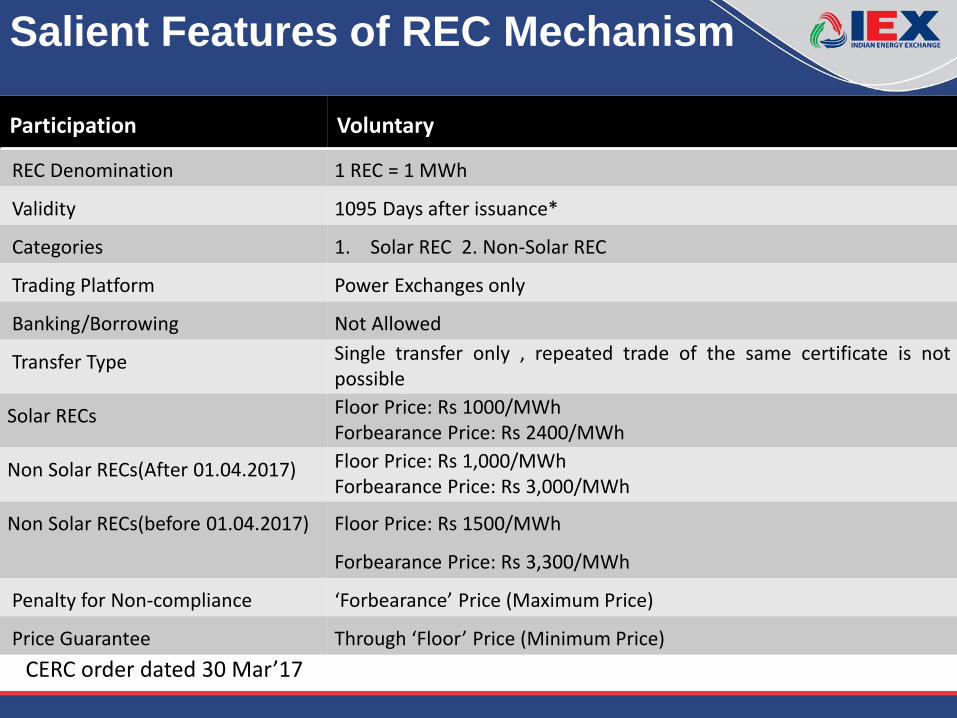
Salient Features of REC Mechanism
Participation Voluntary
REC Denomination 1 REC = 1 MWh
Validity 1095 Days after issuance*
Categories 1. Solar REC 2. Non-Solar REC
Trading Platform Power Exchanges only
Banking/Borrowing Not Allowed
Transfer Type Single transfer only , repeated trade of the same certificate is not possible
Solar RECs Floor Price: Rs 1000/MWh Forbearance Price: Rs 2400/MWh
Non Solar RECs(After 01.04.2017) Floor Price: Rs 1,000/MWh Forbearance Price: Rs 3,000/MWh
Non Solar RECs(before 01.04.2017) Floor Price: Rs 1500/MWh
Forbearance Price: Rs 3,300/MWh
Penalty for Non-compliance ‘Forbearance’ Price (Maximum Price)
Price Guarantee Through ‘Floor’ Price (Minimum Price)
CERC order dated 30 Mar’17
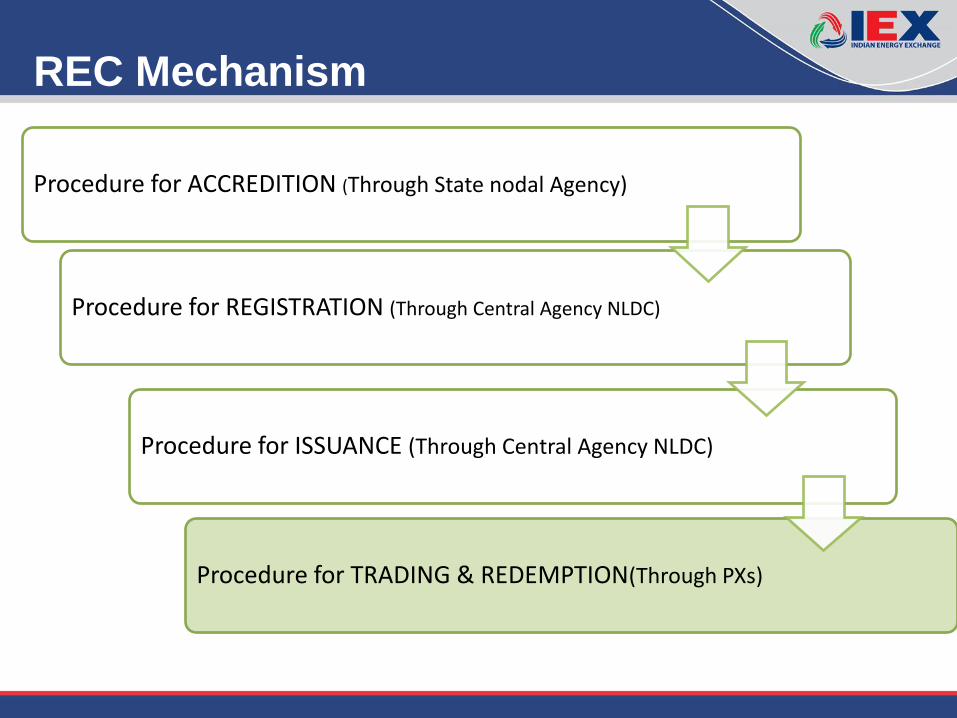
REC Mechanism
Procedure for ACCREDITION (Through State nodal Agency)
Procedure for REGISTRATION (Through Central Agency NLDC)
Procedure for ISSUANCE (Through Central Agency NLDC)
Procedure for TRADING & REDEMPTION(Through PXs)
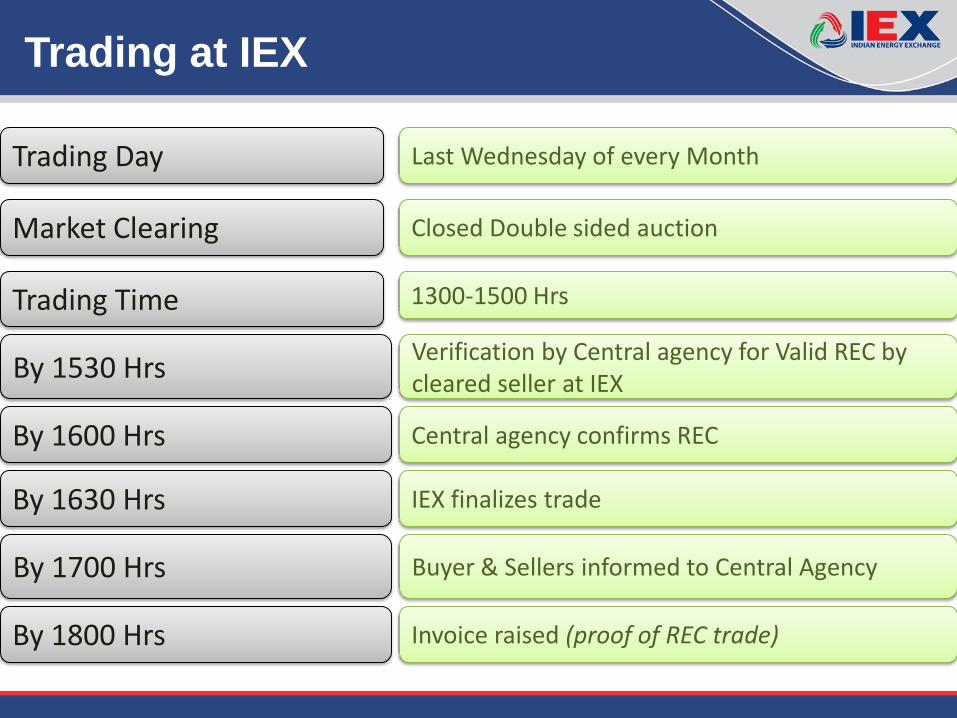
Trading at IEX
Trading Day Last Wednesday of every Month
Market Clearing Closed Double sided auction
Trading Time 1300-1500 Hrs
By 1530 Hrs Verification by Central agency for Valid REC by cleared seller at IEX
By 1600 Hrs Central agency confirms REC
By 1630 Hrs IEX finalizes trade
By 1700 Hrs Buyer & Sellers informed to Central Agency
By 1800 Hrs Invoice raised (proof of REC trade)
10
0 R
EC B
uy
@ R
s 3
30
0
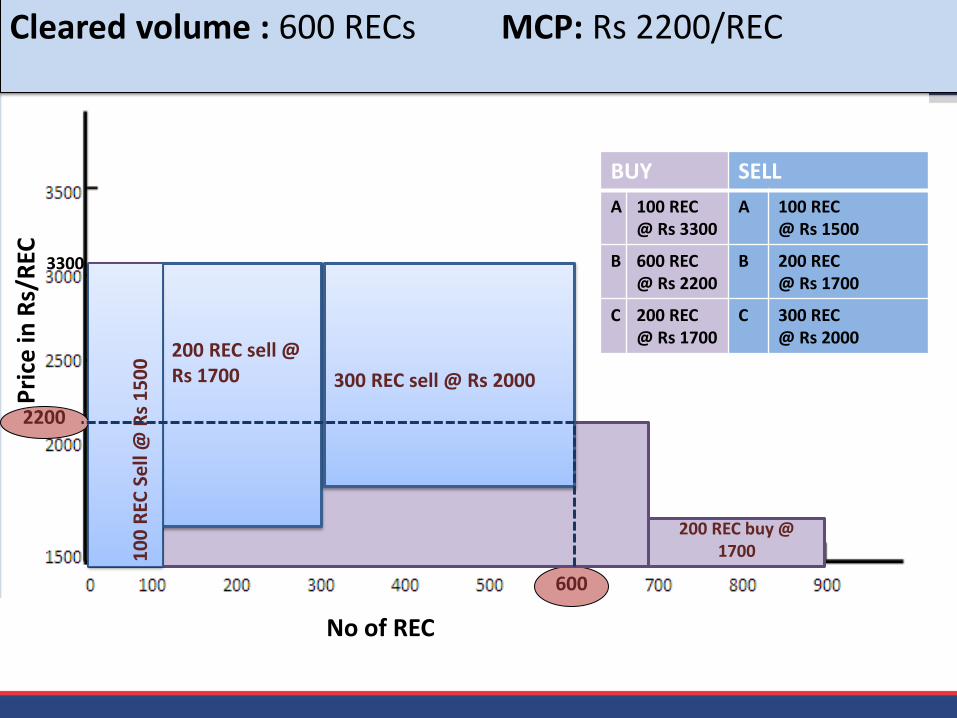
BUY SELL
A 100 REC @ Rs 3300
A 100 REC @ Rs 1500
B 600 REC @ Rs 2200
B 200 REC @ Rs 1700
C 200 REC @ Rs 1700
C 300 REC @ Rs 2000
3300
200 REC buy @ 1700
No of REC
Pri
ce in
Rs/
REC
2200
600
600 REC buy @ Rs2200
200 REC sell @ Rs 1700
300 REC sell @ Rs 2000
10
0 R
EC S
ell
@ R
s 1
50
0
Cleared volume : 600 RECs MCP: Rs 2200/REC
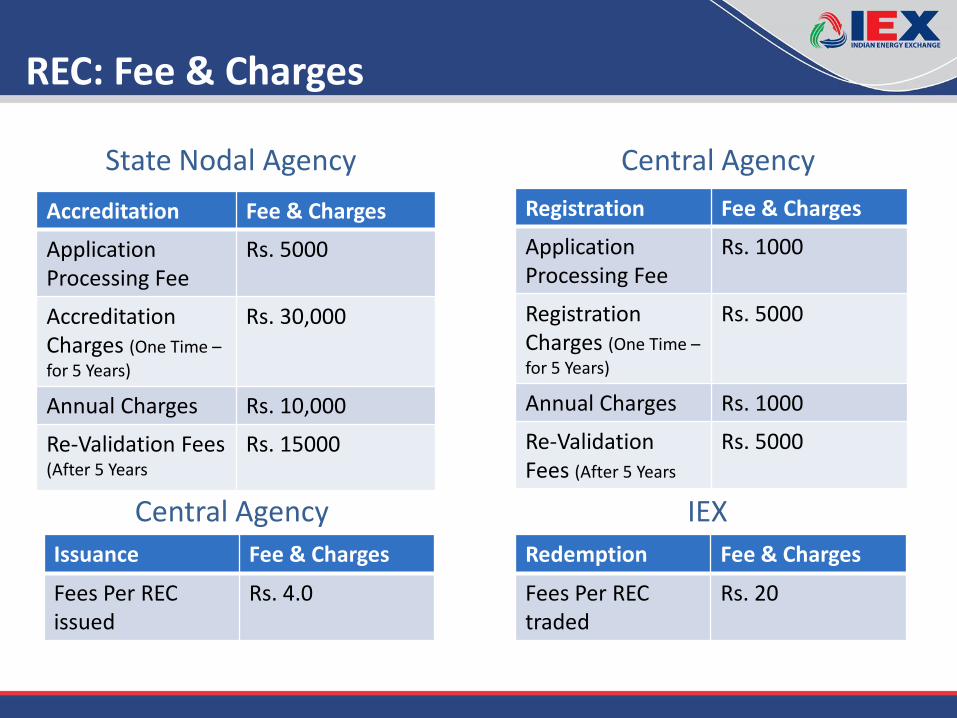
Accreditation Fee & Charges
Application Processing Fee
Rs. 5000
Accreditation Charges (One Time –
for 5 Years)
Rs. 30,000
Annual Charges Rs. 10,000
Re-Validation Fees (After 5 Years
Rs. 15000
Registration Fee & Charges
Application Processing Fee
Rs. 1000
Registration Charges (One Time –
for 5 Years)
Rs. 5000
Annual Charges Rs. 1000
Re-Validation Fees (After 5 Years
Rs. 5000
State Nodal Agency Central Agency
Issuance Fee & Charges
Fees Per REC issued
Rs. 4.0
Central Agency
REC: Fee & Charges
Redemption Fee & Charges
Fees Per REC traded
Rs. 20
IEX
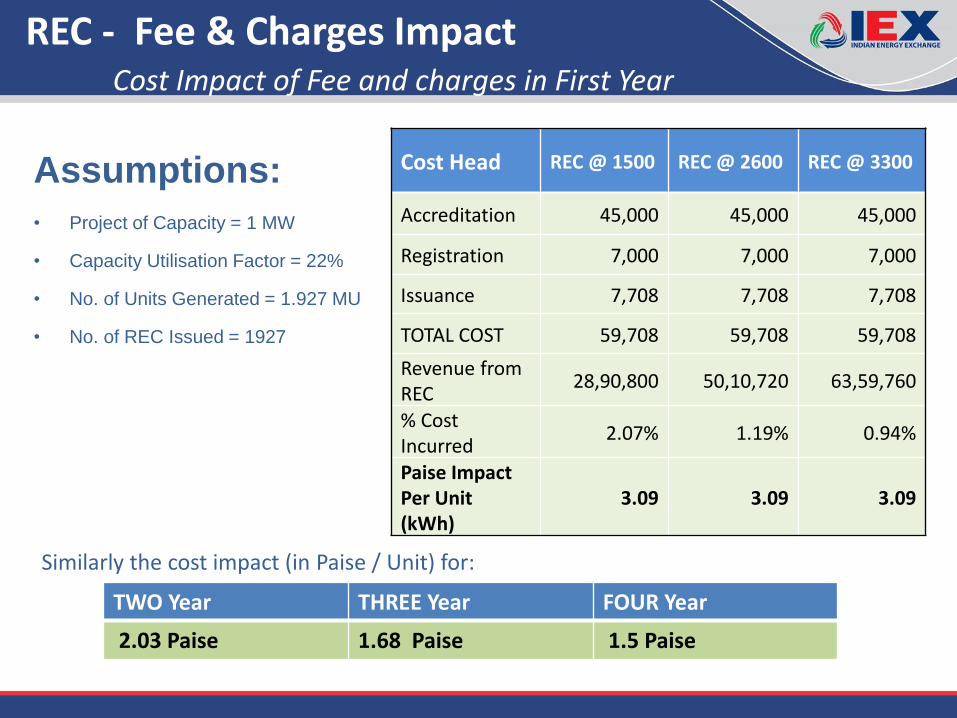
REC - Fee & Charges Impact
Assumptions:
• Project of Capacity = 1 MW
• Capacity Utilisation Factor = 22%
• No. of Units Generated = 1.927 MU
• No. of REC Issued = 1927
Cost Impact of Fee and charges in First Year
Cost Head REC @ 1500 REC @ 2600 REC @ 3300
Accreditation 45,000 45,000 45,000
Registration 7,000 7,000 7,000
Issuance 7,708 7,708 7,708
TOTAL COST 59,708 59,708 59,708
Revenue from REC
28,90,800 50,10,720 63,59,760
% Cost Incurred
2.07% 1.19% 0.94%
Paise Impact Per Unit (kWh)
3.09 3.09 3.09
Similarly the cost impact (in Paise / Unit) for:
TWO Year THREE Year FOUR Year
2.03 Paise 1.68 Paise 1.5 Paise

Market Snapshot
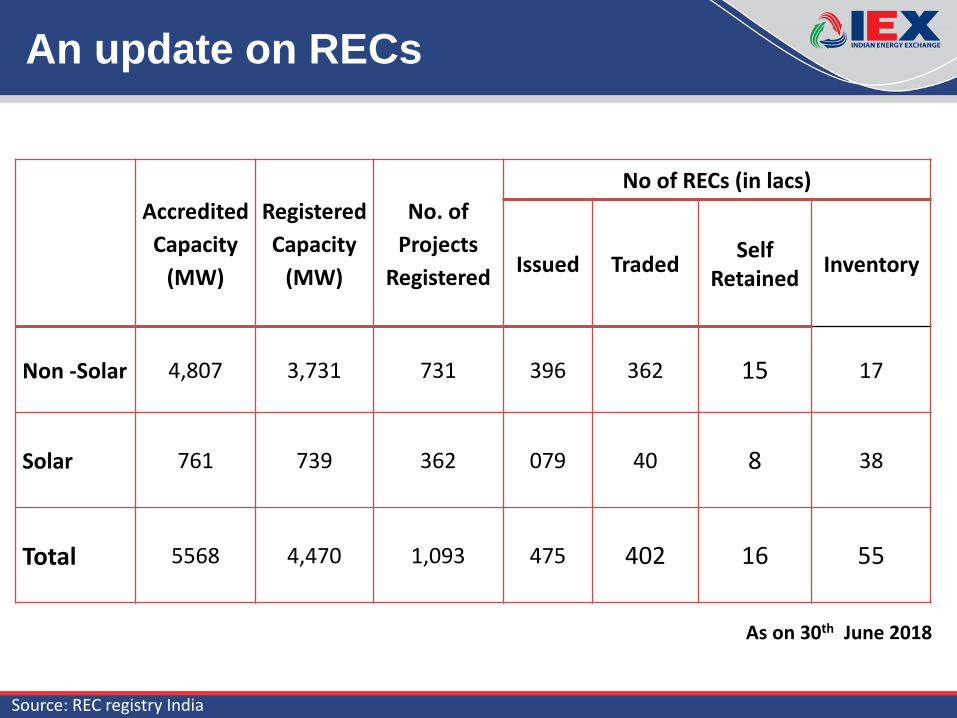
An update on RECs
Source: REC registry India
As on 30th June 2018
Accredited
Capacity
(MW)
Registered
Capacity
(MW)
No. of
Projects
Registered
No of RECs (in lacs)
Issued Traded Self
Retained Inventory
Non -Solar 4,807 3,731 731 396 362 15 17
Solar 761 739 362 079 40 8 38
Total 5568 4,470 1,093 475 402 16 55
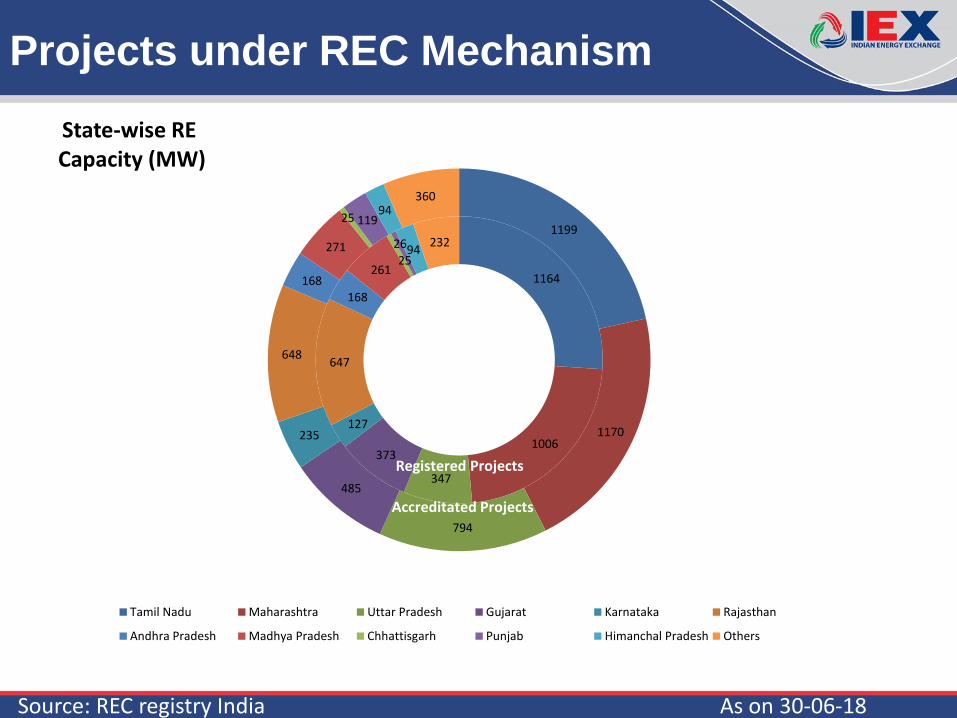
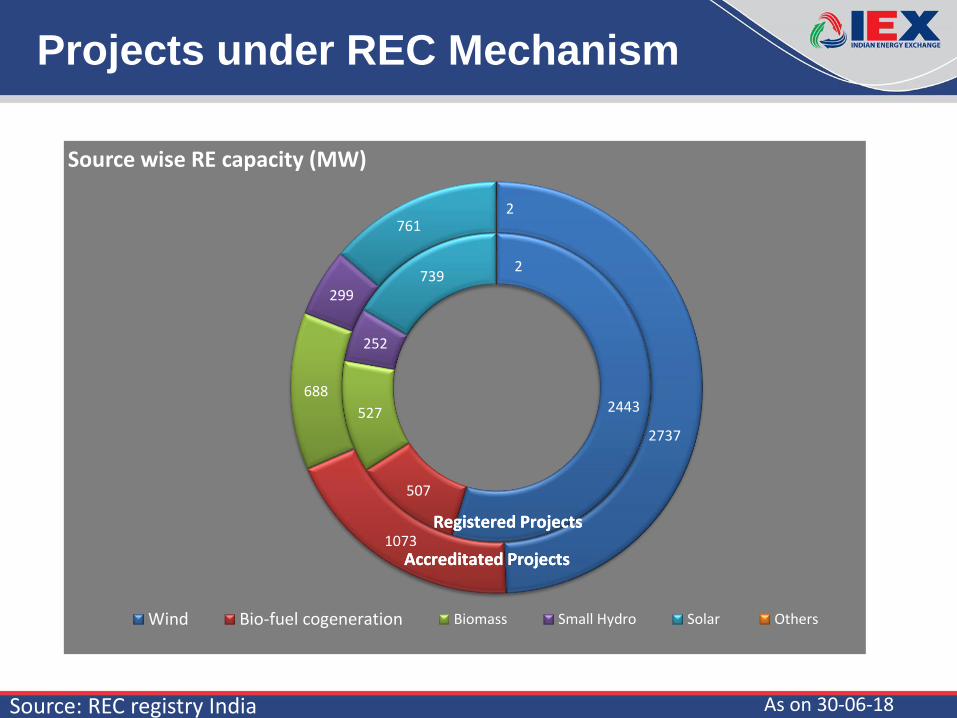
Projects under REC Mechanism
RP : 3975 MW AP : 4336 MW
As on : 4th January,2014
Source: REC registry India
As on 12th Feb ,2014
As on
As
As on 2nd July 2014 As on 11th Aug’14 As on 4th Sept’14 As on 10th Dec’14 As on 9th jan’15 As on 12th Feb’15
Registration Capacity: 4,773 MW Accreditation Capacity : 4,989 MW
Accredited Capacity : 5,056 MW Registered Capacity : 4,785 MW
As on 30-06-18
1164
1006
347
373
127
647
168
261 25
26 94 232
1199
1170
794
485
235
648
168
271
25 119 94
360
State-wise RE Capacity (MW)
Tamil Nadu Maharashtra Uttar Pradesh Gujarat Karnataka Rajasthan
Andhra Pradesh Madhya Pradesh Chhattisgarh Punjab Himanchal Pradesh Others
Registered Projects
Accreditated Projects
Projects under REC Mechanism
As on 31st October’2013
Source: REC registry India
As on 12th Feb 2014 As on 6th March ,2014
As on 7th May 2014
As on 2nd July 2014 As on 11th Aug’14 As on 4th Sept’14 As on : 14-10-14 As on 7th Nov’14 As on 10th Dec’14 As on 12th Feb’15 Accredited Capacity : 5,112 MW Registered Capacity : 4,838 MW
As on 30-06-18
2443
507
527
252
739 2
2737
1073
688
299
761 2
Source wise RE capacity (MW)
Wind Bio-fuel cogeneration Biomass Small Hydro Solar Others
Accreditated Projects
Registered Projects
Accreditated Projects
Registered Projects
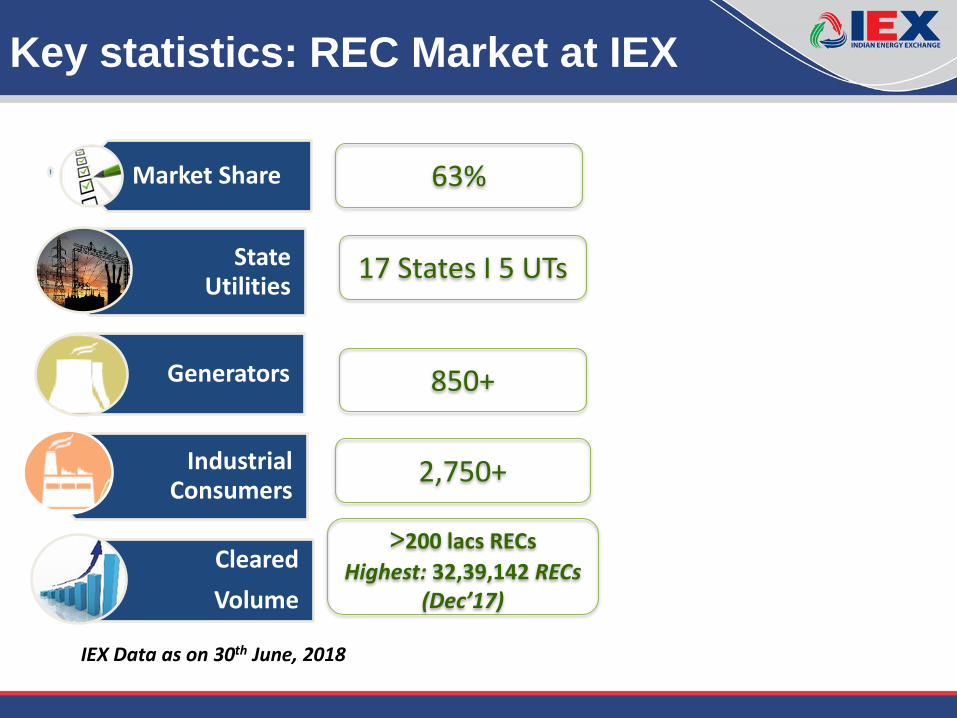
Key statistics: REC Market at IEX
Market Share
State Utilities
Generators
Industrial Consumers
Cleared
Volume
17 States I 5 UTs
850+
>200 lacs RECs
Highest: 32,39,142 RECs (Dec’17)
2,750+
IEX Data as on 30th June, 2018
63%
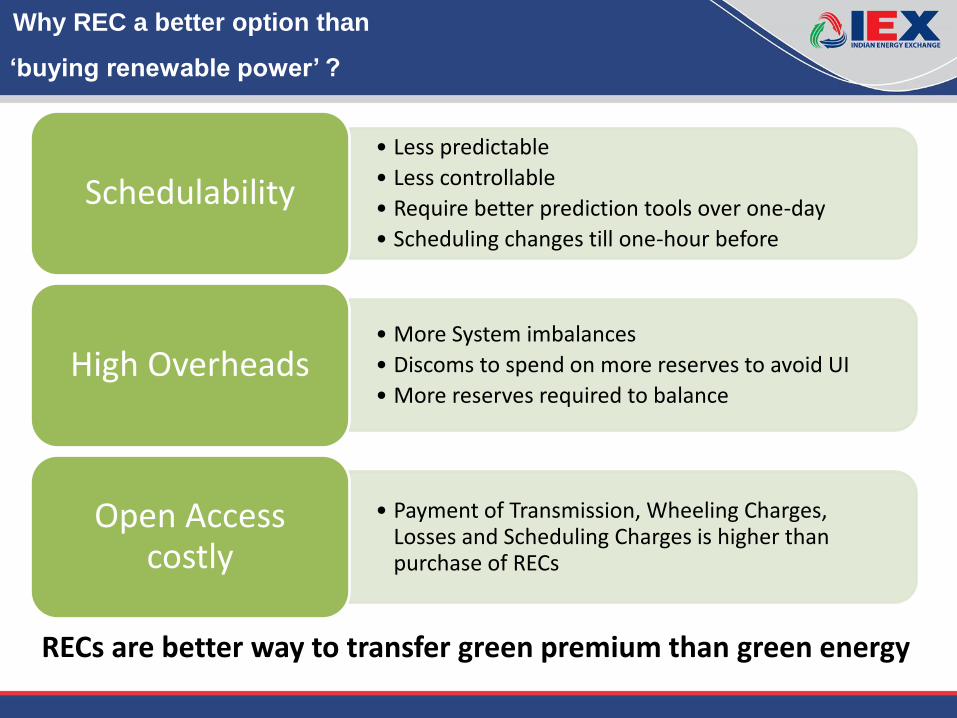
• Less predictable
• Less controllable
• Require better prediction tools over one-day
• Scheduling changes till one-hour before
Schedulability
• More System imbalances
• Discoms to spend on more reserves to avoid UI
• More reserves required to balance High Overheads
• Payment of Transmission, Wheeling Charges,
Losses and Scheduling Charges is higher than purchase of RECs
Open Access costly
Why REC a better option than
‘buying renewable power’ ?
RECs are better way to transfer green premium than green energy
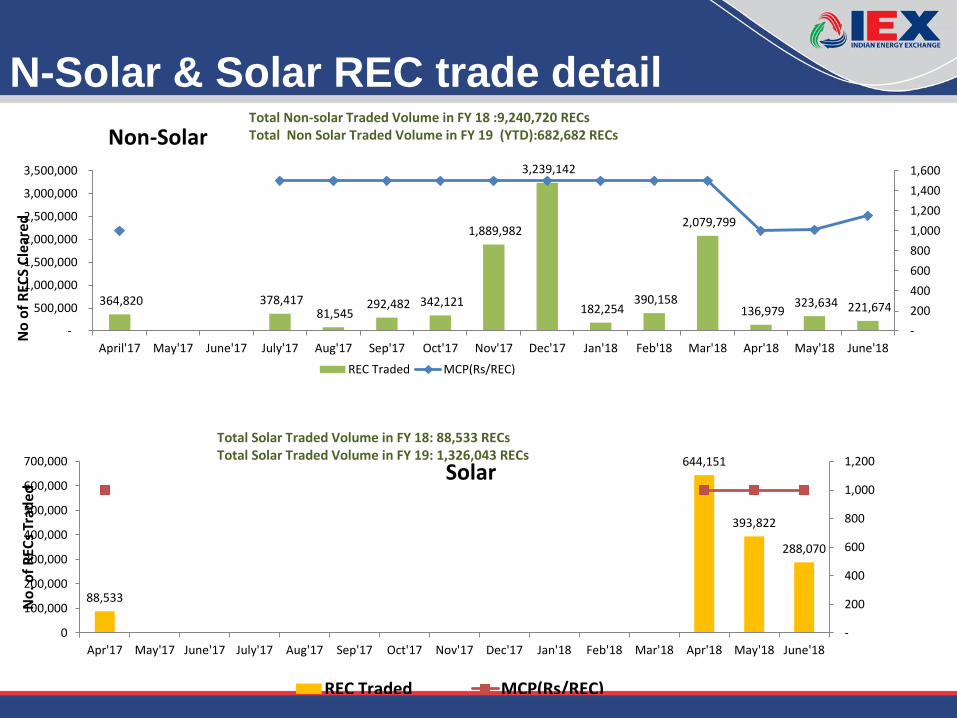
N-Solar & Solar REC trade detail
364,820 378,417 81,545
292,482 342,121
1,889,982
3,239,142
182,254 390,158
2,079,799
136,979 323,634 221,674
-
200
400
600
800
1,000
1,200
1,400
1,600
-
500,000
1,000,000
1,500,000
2,000,000
2,500,000
3,000,000
3,500,000
April'17 May'17 June'17 July'17 Aug'17 Sep'17 Oct'17 Nov'17 Dec'17 Jan'18 Feb'18 Mar'18 Apr'18 May'18 June'18
No
of
REC
S C
lear
ed
Non-Solar
REC Traded MCP(Rs/REC)
Total Non-solar Traded Volume in FY 18 :9,240,720 RECs Total Non Solar Traded Volume in FY 19 (YTD):682,682 RECs
88,533
644,151
393,822
288,070
-
200
400
600
800
1,000
1,200
Apr'17 May'17 June'17 July'17 Aug'17 Sep'17 Oct'17 Nov'17 Dec'17 Jan'18 Feb'18 Mar'18 Apr'18 May'18 June'18
0
100,000
200,000
300,000
400,000
500,000
600,000
700,000
No
. of
REC
s Tr
aded
Solar
REC Traded MCP(Rs/REC)
Total Solar Traded Volume in FY 18: 88,533 RECs Total Solar Traded Volume in FY 19: 1,326,043 RECs
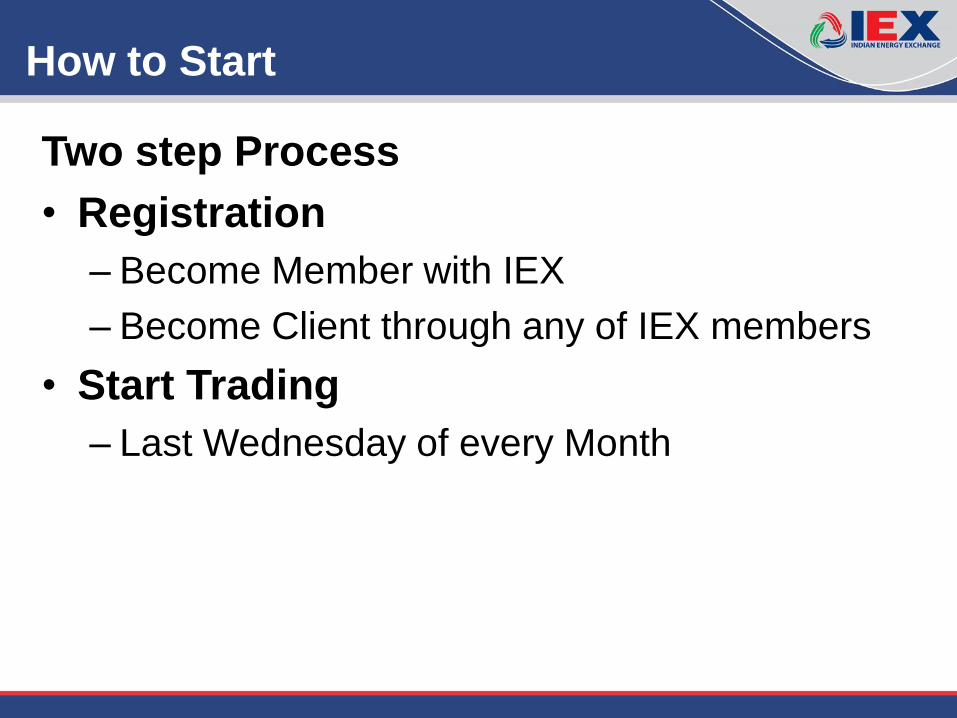
How to Start
Two step Process
• Registration
– Become Member with IEX
– Become Client through any of IEX members
• Start Trading
– Last Wednesday of every Month
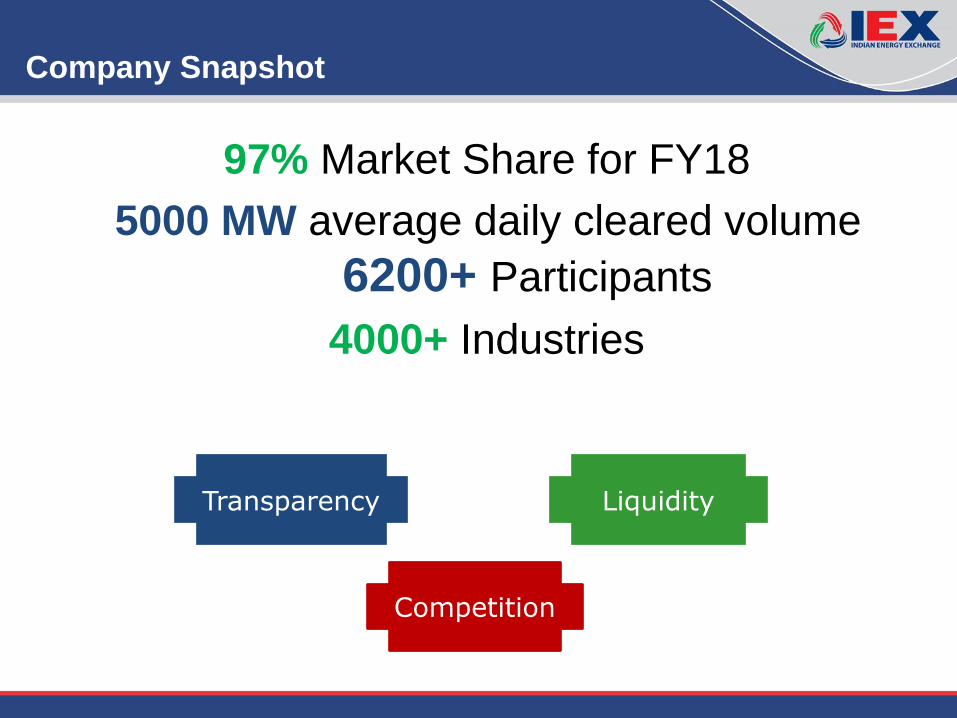
Company Snapshot
97% Market Share for FY18
5000 MW average daily cleared volume
6200+ Participants
4000+ Industries
Competition
Liquidity Transparency
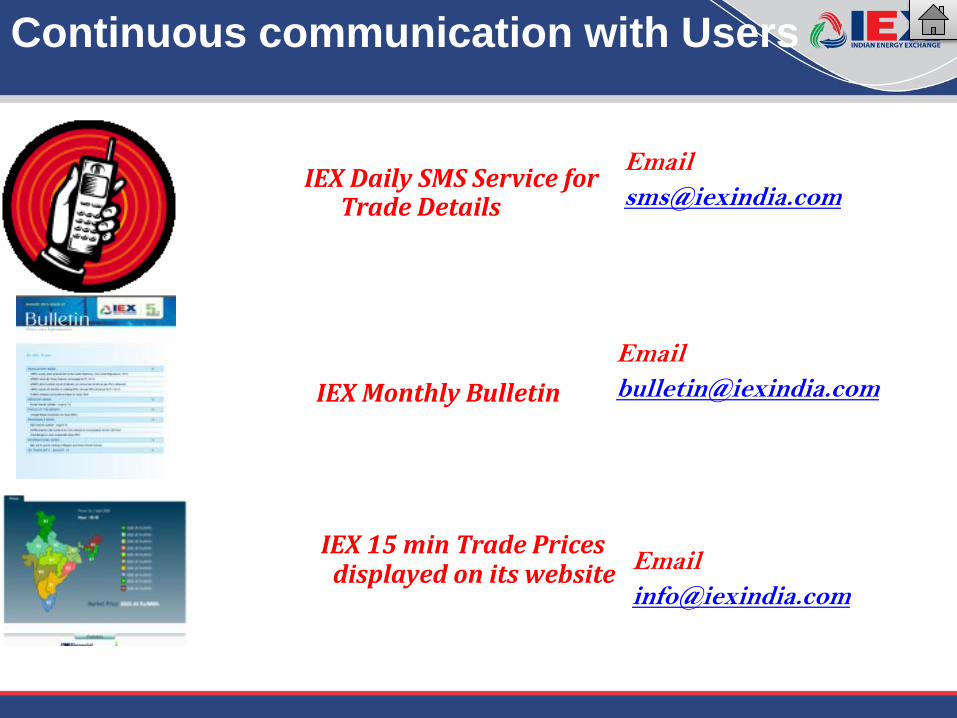
Continuous communication with Users
IEX Daily SMS Service for Trade Details
IEX Monthly Bulletin
IEX 15 min Trade Prices displayed on its website


![IEX REC Chennai [Compatibility Mode]](https://img.pdfslide.net/doc/110x75/577d2fa31a28ab4e1eb23781/iex-rec-chennai-compatibility-mode.jpg)