Embed Size (px)
Citation preview

© Polish Academy of Sciences (PAN) in Warsaw, 2018; © Institute of Technology and Life Sciences (ITP) in Falenty, 2018
© Polish Academy of Sciences (PAN), Committee on Agronomic Sciences JOURNAL OF WATER AND LAND DEVELOPMENT Section of Land Reclamation and Environmental Engineering in Agriculture, 2018 2018, No. 38 (VII–IX): 127–136 © Institute of Technology and Life Sciences (ITP), 2018 PL ISSN 1429–7426, e-ISSN 2083-4535 Available (PDF): http://www.itp.edu.pl/wydawnictwo/journal; http://www.degruyter.com/view/j/jwld
Received 07.01.2018 Reviewed 07.03.2018 Accepted 20.03.2018
A – study design B – data collection C – statistical analysis D – data interpretation E – manuscript preparation F – literature search
Effect of 2014 massive flood on well water qualities: A case study on Kelantan River basin, Malaysia
Hariz A. Ab. RAHMAN1) AB, Noor A. IBRAHIM1) BE,
Azzmer A. ABDUL HAMID2) BDF, Tengku H.T. ABDUL HAMID1) ACDEF
1) Kulliyyah of Science, International Islamic University Malaysia, Department of Biotechnology, Jalan Istana, 25200 Bandar Indera Mahkota, Kuantan, Malaysia; e-mail: [email protected]
2) University Malaysia Kelantan, Faculty of Agro-Based Industry, Jeli, Kelantan, Malaysia
For citation: Rahman H.A.Ab., Ibrahim N.A., Abdul Hamid A.A., Abdul Hamid T.H.T. 2018. Effect of 2014 massive flood on well water qualities: A case study on Kelantan River basin, Malaysia. Journal of Water and Land Development. No. 38 p. 127–136. DOI: 10.2478/jwld-2018-0049.
Abstract
The effect of physical and biological qualities of wells after submergence was assessed following December 2014 flood in Kelantan. Studies were carried out on a total of 65 wells from 13 stations around Kelantan River basin in which the wells’ water were sampled for pH, total dissolved solid (TDS), turbidity and microbial con-tamination. About 95% of the well showed to be contaminated, 7 out of 65 samples (11.1%) showed TDS values >400 µSꞏcm–1; and 19 samples (29.2%) recorded turbidity beyond 7.0 NTU. Statistical non-parametric tests car-ried out on independent groups showed that the status of well contamination was neither determined by both de-gree of submergence nor by the geographical location. Also the physico-chemical parameters are independent of flood inundation. However, TDS and turbidity values changed based on geographical location, at p < 0.05. Well from estuary recorded higher TDS (241.2 µSꞏcm–1 ±159.5 SD) and turbidity (8.04 NTU ± 6.53 SD) compared to those from inner basin (TDS at 156.3 µSꞏcm–1± 88.9 SD; turbidity at 2.90 NTU ± 2.46 SD), respectively. The flood water had played significant role in the transmission of existing contaminant, and most of the wells were unsafe for drinking. We concluded that the degree of flood submergence does not necessarily determine the se-verity of the well contamination in Kelantan, but the existing contamination may exacerbate further the potential risk during post flood period.
Key words: drinking well, flood inundation, Kelantan River basin, total coliform, water quality
INTRODUCTION
Annually, the North-East monsoon triggers major rainy season in several regions in South East Asia. Monsoon weather systems usually develops in con-junction with cold air outbreaks from Siberia which produces heavy rain causing severe floods in East coast states of the Malaysian peninsular (Kelantan, Terengganu, Pahang and East Johore) and Sarawak in the East Malaysia [CHANG et al. 2006]. At the end of
2014, Kelantan and other eastern coast states were hit by a severe and unprecedented flood whereby it was reported that more than 200,000 were affected while 21 peoples were killed in the floods [AFP 2014; DA-
VIES 2015; STEPHEN 2015]. Heavier than normal rain, excessive lodging and ‘the new moon’ phenomenon whereby the moon is the closest to the earth causing high tide were among factors speculated to have trig-gered this extraordinary flooding. Moreover, the un-expected rise in Kelantan River (Mal. Sungai Kelan-
DOI: 10.2478/jwld-2018-0049

128 H.A.AB. RAHMAN, N.A. IBRAHIM, A.A. ABDUL HAMID, T.H.T. ABDUL HAMID
© PAN in Warsaw, 2018; © ITP in Falenty, 2018; Journal of Water and Land Development. No. 38 (VII–IX)
tan) water level along with water current culminated in catastrophic damages to residential, commercial and industrial buildings; and disabling electrical power, water supply and sewage systems. In the his-torical context, the detrimental effect of severe flood brought about by monsoon rain had received consid-erable attention even during the British Colonial era [WILLIAMSON 2016]. This indicates that throughout human history there has been a prolong battle in over-coming and handling the impact of flood. There have been more than 3000 major flood events recorded between year 1985 to 2010 [KUNDZEWICZ et al. 2014]. According to studies by ASHLEY et al. [2005] on UK catchments, in year 2000, the flood risk was predicted to increase by 30 times by 2080.
The impact of human health after flood could be equally catastrophic. There was immediate concern regarding the probable release and dispersion of bio-logical contaminants such as coliform, cholera, hepa-titis, leptospirosis, malaria; and chemical contami-nants such as heavy metals and carcinogens in the flood water. Realising the potential hazards of expo-sure to pathogen or toxicant and long-term negative environmental impact from contaminated water, relia-ble samples from flood have to be immediately avail-able for accurate assessment and evaluation. This is essential in assessing the public health risks from en-vironmental threat. Faecal contamination of urban flood water was evaluated after severe flood in New Orlean, US, following hurricanes Katrina and Rita [SINIGALLIANO et al. 2007], and after Elbe flood in Germany in 2002 [ABRAHAM, WENDEROTH 2005]. Elevated level of faecal indicator bacteria and micro-bial pathogens were found in flood waters with the subsequent contamination of drinking water sources. For instance, Vibrio cholera and rotavirus have caused flood associated diarhoea in 3 consecutive floods (1988, 1998 and 2004) that occurred in Dhaka, Bangladesh [BRIAN et al. 2006]. Faecal coliform and streptococci were found to contaminate water sources in Dhaka after 2004 flood [SIRAJUL et al. 2007]; and human enteric virus, hepatitis A and adenovirus, and coliform were prevalent after an urban flood in Jakar-ta, Indonesia [PHANUWAN et al. 2006]. Other studies have included physical and mental health effect asso-ciated with severe flood [FEWTRELL, KAY 2008; OHL, TAPSELL 2000; TUNSTALL et al. 2006]. During urban floods, the combined sewer-flood water spreads the contamination and poses further health risk. In places where water supply was tremendously affected, the surface water or groundwater supplies would become an option. Well water is the main source of drinking water in developing countries. In the state of Kelantan in particular, municipal water supply is still low and inadequate. Due to this condition, an estimated 35% of population, especially in the rural area were still rely on ground water for their daily activities [IDRUS et al. 2014].
Many studies have been carried out to evaluate the microbiologcial quality of drinking well [BEN-RABAH et al. 2016; CHIRANJAY et al. 2012; MUKHO-
PADHYAY et al. 2012; PRITCHARD, O’NEILL 2007; RAMESH et al. 2015] and on the impact of flood on river water quality [DEPETRIS, STEPHAN 1990; EME-
KA, OSONDU 2016; YOUSAFZAI et al. 2013]. However, as far as our concern, there is a limited study carried out on well water quality with respect to flood event. A study on the impact of flood on well water quality was only limited to physical parameters [YOUSAF et al. 2013]. In this study, sampling strategy based on wells located in inundated and uninundated regions were used in assessing the microbial contamination and physico-chemical qualities during post flood pe-riod. The use of well as a source for analysis in this study is highly appropriate for two reasons. Firstly, unlike in many other states in Malaysia, wells are available throughout regions in Kelantan making them suitable for geospatial study; and secondly, the inundated well could represent an almost ‘real time’ sample which is likely to retain or preserve the flood water characteristic. The characteristic of well water during post food period could provide a useful geo-spatial distribution of contamination and these can be used to interpret potential outbreak [INVIK et al. 2017]. In addition, previous studies showed that the turbidity values for Kelantan River were abnormally high (268.9–672.0 NTU), due to sand mining and up-stream lodging activities [YEN, ROHASLINEY 2013]. Meanwhile, several series of waterborne disease out-breaks in Kelantan were correlated with poor water supply system [ANG et al. 2010; AZIMULLAH et al. 2016; ISA 1990; JA'AFAR et al. 2013; MALIK, MALIK 2001]. Eventhough extreme weather condition has been well accepted to have an impact on human water supply, the changes it causes to water quality is not fully elucidated. Climatic changes will result in in-crease or decrease in water flow that will inherently affect the transfer and dilution of contaminants [WHITEHEAD et al. 2009]. Due to the unpredictable nature of natural disaster, it is difficult to accurately measure the actual water flow during a disaster period. Groundwater sources such as inundated wells containing flood residues are available in some places for post flood analysis. Therefore, this study has at-tempted to find possible correlations between the well submergence, the biological contamination and the water qualities. Our prime focus is to find how the physical and biological qualities of the well vary with geographical distribution and the impact of flood in-undation. These informations could be used to formu-late some guidelines in developing better strategy in using well for drinking following Kelantan’s 2014 massive flood. In the event of future flood, regions which are prone to contamination can be identified so that the safety use of well for drinking purpose can be followed.

Effect of 2014 massive flood on well water qualities: A case study on Kelantan River basin, Malaysia 129
© PAN in Warsaw, 2018; © ITP in Falenty, 2018; Journal of Water and Land Development. No. 38 (VII–IX)
METHODS
SAMPLING STATIONS
This study was carried out on Kelantan River ba-sin which consist of Kelantan River and its main trib-utaries: Galas River and Lebir River (see Fig. 1b). Wells located in 10 districts (Mal. Jajahan) previously hit by flood i.e., Tumpat, Kota Bharu, Bachok, Gua Musang, Pasir Mas, Machang, Tanah Merah, Jeli, Kuala Krai and Pasir Puteh were selected (see Fig. 1). These stations were representative of different loca-tions along Kelantan River. In the recent 2014 flood, the main body of flood water was assumed to have originated from the upstream region i.e., Gua Musang, that flowed along Kelantan River before finally reach-ing the estuary into South China Sea (Fig. 1b, 1c).
Based on geographical location, stations Rantau Pan-jang, Tumpat, Bachok, Pasir Mas, Pantai Cahaya Bu-lan, Wakaf Baharu and Pengkalan Chepa are located within 35 km distance from the shore and these sta-tions were categorised as estuary region. Other sta-tions such as Tanah Merah, Dabong, Jeli, Temangan, Pasir Puteh and Machang are located more than 35 km away from shore were categorised into non- -estuary regions (see Fig. 1c). In 2014 December flood, stations Bachok, Tok Bali, Pasir Puteh, Ma-chang and Temangan were unsubmerged, whereby all other stations have been submerged. By definition, the relative position of submerged and unsubmerged wells during flood are indicated in Figure 2. As shown in Figure 1c, selected location of sampling stations and their submergences during flood are indi-cated on the map.
Fig. 1. Study location: a) Kelantan River basin (Kelantan River and its main tributaries – Lebir River, Galas River and others); b) relative location of Kelantan state in Malaysian peninsular, c) Kelantan inundation map during flood 2014;
stations that were submerged during 2014 flood labelled on the left of the map (Pantai Chahaya Bulan (PCB), Pengkalan Chepa, Wakaf Baharu, Rantau Panjang, Tanah Merah, Jeli, Kuala Krai and Dabong) and unsubmerged regions labelled on right side of the map (Bachok, Tok Bali, Pasir Puteh, Machang and Temangan); ‘Sg.’ stands for ‘sungai’, a Malay word for
river; source: own elaboration
Fig. 2. Schematic representation of cross section for region in Kelantan River basin showing relative position of wells, sewage and the flood submergences; source: own elaboration
Kelantan River basin

130 H.A.AB. RAHMAN, N.A. IBRAHIM, A.A. ABDUL HAMID, T.H.T. ABDUL HAMID
© PAN in Warsaw, 2018; © ITP in Falenty, 2018; Journal of Water and Land Development. No. 38 (VII–IX)
Fig. 3. Kelantan map: a) land form, b) total 7 days rainfall on December 2014; source: ALIAS et al. [2016], modified
LAND FORMS AND CLIMATIC CONDITION
Kelantan is a north-eastern state of peninsular Malaysia with a total area of 15,099 km2 (see Fig. 1a). About 80% of Kelantan state was mainly drained by Kelantan River and its tributaries with a total catch-ment area of 11,900 km2, forming Kelantan River basin. The river flows from mountainous and less-populous catchments areas in the South toward highly populous plain in the North called Kelantan Delta, through which it drains into the South China Sea (see Fig. 1b and 2a). Major cities, agricultural activities, industries were clustered in Kelantan River delta, where Kota Bharu, state administration centre is lo-cated. Annual rainfall in Kelantan was triggered by north-eastern monsoon that regularly resulted in end- -year flood in several regions especially in the delta. Kelantan experienced an extraordinary rainfall that occurred in December 2014. The maximum rainfall distribution occurred in November and December 2014 documented total rainfall distribution of 690.6 mm and 1092.6 mm, respectively [ALIAS et al. 2016]. The rainfalls were in two phases, first on 15th–19th December 2014 (daily up to 100–300 mm), and second on 20th–24th December 2014 (daily reaching up to 500 mm). Figure 3b shows the spatial distribu-tion of rainfall in Kelantan during for 7 days of the December.
PHYSICO-CHEMICAL PARAMETERS
Open dug wells from a total of 20 stations at 13 locations from 10 Kelantan’s district (see Fig. 1c) were selected and 3 water samples were collected from each well. These non-longitudinal samplings were carried out from the month of January to March 2015. Physio-chemical analyses, i.e., pH, electrical
conductivity (EC), total dissolved solid (TSS) and the turbidity were determined in situ for each water sam-ple [MOHAMMAD et al. 2007]. The sample pH was measured using portable pH meter (Lutron Electronic, Taiwan), electrical conductivity was measured using conductivity meter (Lutron) and reported in µSꞏcm–1; and the turbidity was measured using turbidity meter 2016 (Lutron) and reported in the unit of NTU. The EC value was converted into TDS based on equation TDS (mgꞏdm–3) = EC (µSꞏcm–1)ꞏ0.67. In this study, data quality was ensured through necessary standardi-zation, procedural blank measurements, spiked and duplicate samples.
MICROBIOLOGICAL ANALYSIS
For bacteriological analysis, the 0.5 dm3 samples were collected using sterile 1.0 dm3 Scott bottles. From each station, about 4–5 samples from a well and the nearby wells were collected. The bottles were tightly capped, labelled and kept on ice before being transported, as soon as possible, to laboratory at Uni-versity Malaysia Kelantan (UMK) for further analy-sis. For microbiological analyses, 0.1 dm3 of each well water sample was filtered through a sterile mem-brane filter (cellulose acetate, 0.45 µm pore size, 0.47 mm diameter) by using a vacuum pump [CHEESBROUGH 2006]. The filters were placed cen-trally on solidified MacConkey agar medium and in-cubated at 44.5°C overnight and the total viable coli-form count (TVC) were measured [EDBERG, EDBERG 1988]. The presence of bile salt and crystal violet en-abled the selective growth of Gram-negative bacteria including enteric bacilli. The formation of pinkish colonies due to lactose fermenting E. coli distin-guishes it from other Gram-negative bacteria. The average growth of coliforms in the form of colony

Effect of 2014 massive flood on well water qualities: A case study on Kelantan River basin, Malaysia 131
© PAN in Warsaw, 2018; © ITP in Falenty, 2018; Journal of Water and Land Development. No. 38 (VII–IX)
forming units per 0.1 dm3 – CFUꞏ(0.1 dm3)–1) was determined for each collected sample.
STATISTICAL ANALYSIS
Statistical analyses were carried out using statisti-cal software SPSS package version 18 (SPSS Inc. Chicago). Each sample was grouped into either sub-merged or unsubmerged, and the well location along Kelantan River (i.e., either near or far from estuary (estuary versus non-estuary). Normality tests were carried out for each independent grouping and since the sample profiles were not normally distributed, non-parametric test (Mann–Whitney) were carried out on each test in order to evaluate the association between the total viable coliform (TVC), TDS and TSS with flood submergence, and the distance from estuary.
RESULTS AND DISCUSSION
From all of the stations, the pH, TDS (EC) and turbidity data were collected. Table 1 summarizes the average value of all the physico-chemical and biolo-gical parameters collected from all locations. The pa-rameters and their respective locations were also rep-resented into plots as shown in Figure 4a–d.
The acidity or pH values of the well water sam-ples collected around Kelantan were recorded to be from 5.5 to 7.4 and these were within acceptable range for drinking water quality standard (pH 5.5–9) [ISSA 2012]. Samples at Tanah Merah recorded aver-age values of slightly acidic of 5.5 average, while samples from Machang and Pasir Puteh recorded at an average of 7.4 (see Fig. 4a). In terms of electrical conductivity (EC), about 7 out of 65 samples (11.1%) collected recorded values exceeding permissible limit of more than 400 µSꞏcm–1. The lowest values of 53 µSꞏcm–1 was recorded at one of the well in Jeli, while
the highest values were recorded for samples from Pengkalan Chepa (575 µSꞏcm–1), Jeli (439 µSꞏcm–1), Pantai Cahaya Bulan (430 µSꞏcm–1) and Bachok (447 µSꞏcm–1) (see Fig. 4d). Given the linearity assumption that relates TDS and EC; any trend observed for EC values were also reflected in changes in the TDS. Therefore, the station which recorded high EC values above will also show to have high TDS values and vice versa. The variable presence of various dissolved minerals such as manganese, iron and others contrib-ute to conductivity and TDS values [THAMER, ABDUL 2009]. A work on small number of wells in Kelantan had shown that high TDS values was due to the pres-ence of ions resulted from weathering and leaching of the sedimentary rocks, as well as from human activi-ties [HAMZAH et al. 2014]. The presence of nitrates beyond permissible level 10 mg∙dm–3 was related to high usage of fertilisers and pesticides, especially on wells located in agricultural areas in Kelantan [SHAMSUDDIN et al. 2016]. There was a report on high concentration of Mn and Fe in some wells in rural Kelantan [YAP et al. 2017]. By analyzing the ground waters from different depth aquifers in Kelan-tan, the shallow groundwater (dug well) was dominat-ed by Ca-HCO3 and Na-CO3, [SEFIE et al. 2015]. The high TDS and turbidity of the well near the coastal area were also associated with the brackish water character of groundwater in the coastal zones. About 19 out of 65 (29.2%) samples recorded turbidities beyond 7.0 NTU, with the highest values found in the most of samples from Pengkalan Chepa (from 19.2 to 20.87 NTU). These values have also exceeded 5.0 NTU limit if the drinking water standard limit is con-sidered [WHO 2011]. The higher TDS and turbidity values in the downstream regions are also contributed by the presence of slits, clays and other particulate or suspended material released due to structural damages caused by flood.
Table 1. The list of average pH, electrical conductivity (EC), total dissolved solid (TDS), turbidity and total viable count of coliform (TVC) for well water samples collected around 13 stations in Kelantan
Rainfall station pH ±ΔSD Turbidity ±ΔSD
NTU Conductivity ±ΔSD
μS cm–1 TDS± ΔSD
mg∙dm–3 Total viable count ±ΔSD
∙104 CFUꞏ(0.1 dm3)–1 Wakaf Bharu 6.3±0.18 4.61±4.88 171.2±30.81 114.7±20.64 7.14±4.10 Tanah Merah 5.5±0.65 0.34±0.09 157.4±34.24 105.5±22.94 0.45±0.63 Pengkalan Chepa 7.3±0.72 16.4±8.64 481±185.6 322.3±124.35 37.8±49.38 Kuala Krai 6.8±0.12 2.1±0.22 127.2±21.43 85.2±14.36 1.7±0.88 Pcb 7.3±0.15 6.8±3.94 295.8±83.43 198.2±55.9 6.6±13.1 Dabong 6.7±0.09 2.86±1.01 115.6±61.29 77.5±41.06 2.3±3.02 Jeli 6.1±0.09 8.24±1.58 139±167.82 93.1±112.44 1.48±0.79 Rantau Panjang 6.5±0.20 3.94±0.55 84.4±10.64 56.5±7.13 10.82±16.64 Temangan 7.1±0.06 2.35±0.25 126.4±10.81 84.7±7.24 4.46±0.61 Pasir Puteh 7.4±0.06 2.39±0.37 303.2±24.93 203.1±16.71 1.23±0.32 Bachok 6.6±0.62 3.06±1.67 279.6±114.23 187.3±76.53 0.64±0.86 Tok Bali 7.2±0.18 13.41±0.59 135.2±25.91 90.6±17.36 1.75±0. 72 Machang 7.4±0.11 2.04±1.22 125.4±4.88 84±3.27 7.5±2.47
Explanation: SD = standard deviation. Source: own study.

132 H.A.AB. RAHMAN, N.A. IBRAHIM, A.A. ABDUL HAMID, T.H.T. ABDUL HAMID
© PAN in Warsaw, 2018; © ITP in Falenty, 2018; Journal of Water and Land Development. No. 38 (VII–IX)
Fig. 4. Physical and biological parameters plotted based on their locations in Kelantan: a) pH, b) total suspended solid (TSS), c) total viable count (TVC), d) total dissolved solid (TDS); source: own study
The microbiological analysis on the total viable count (TVC) for coliform showed that coliform pre-sented in most of the samples (~103–104 CFUꞏ(0.1 dm3)–1) except for 3 samples from Tanah Merah, and a sample from Pantai Cahaya Bulan which had no visible coliform growth. Therefore, in terms TVC count, 61 out of 65 samples (93.8%) in 13 stations from Kelantan had already violated the mi-crobiology safety limit for drinking purpose according to Drinking Water Quality Standard [MOH 2005] and WHO [WHO 2011]. Pengkalan Chepa gave the high-est average TVC value of 3.78ꞏ105 CFUꞏ(0.1 dm3)–1, with a sample recorded a staggering TVC value of 7.2ꞏ105 CFUꞏ(0.1 dm3)–1. High TVC were also rec-orded from several stations such as Wakaf Baharu
(1.00ꞏ105 CFUꞏ(0.1 dm3)–1), Pantai Cahaya Bulan (3.00ꞏ105 CFUꞏ(0.1 dm3)–1), Rantau Panjang (4.00ꞏ105 CFUꞏ(0.1 dm3)–1) and Machang (1.10ꞏ105 CFUꞏ(0.1 dm3)–1). Interestingly, these stations, except Machang, were located in the estuary regions and were notorious for waterborne disease outbreak [ANG et al. 2010; ISA 1990; MALIK, MALIK 2001]. Never-theless, it was impossible to compare these data with previous studies since other studies had used different well, collection time and enumeration method. The status of groundwater contamination in Kelantan has also been previously reported, without considering the flood. For instance, a detailed study on groundwater contamination in 9 districts in Kelantan, IDRUS et al. [2014] demonstrated that 221 out of 454 (49%) wells
a) b)
c) d)
Effect of 2014 massive flood on well water qualities: A case study on Kelantan River basin, Malaysia 133
© PAN in Warsaw, 2018; © ITP in Falenty, 2018; Journal of Water and Land Development. No. 38 (VII–IX)
under Water Supply and Sanitation Program (Mal. Bekalan Air dan Kebersihan Alam Sekeliling, BAKAS) were positive for total coliform. Meanwhile, there were reports on groundwater qualities in Kelan-tan without considering biological contamination. Due to high in hardness, salinity, and concentration of iron, manganese, ammonium and fluoride, the groundwater in Kelantan is unsuitable for drinking purpose [YAP et al. 2017]. Intermediate depth aquifers located within 8 km from coastal area were unsuitable for use [SEFIE et al. 2015]. In our study, the most of the wells showed physical parameters level within WHO permissible limit in which 70.8% turbidities were less than 5 NTU, and 100% EC was less than 1000 µSꞏcm–1. However, due to the presence of TVC, these wells were considered unsafe for drinking pur-pose. Therefore, post flood study showed that TVC is an important parameters that determine the status of water quality.
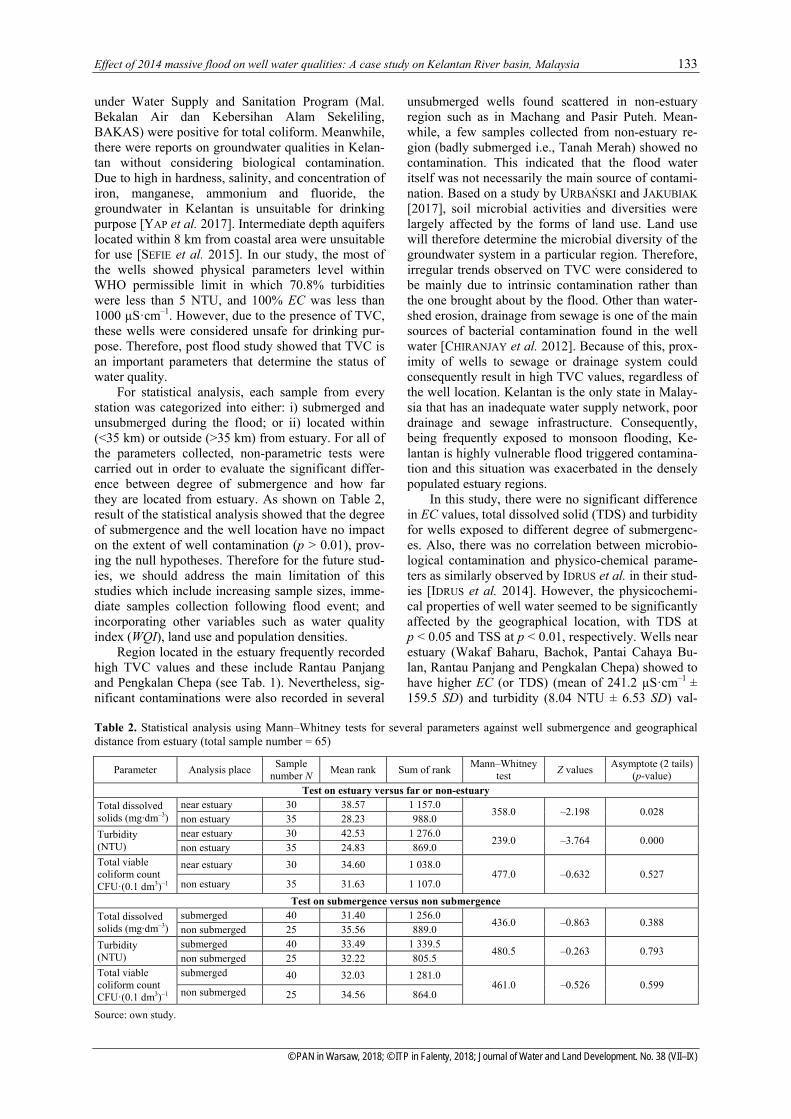
For statistical analysis, each sample from every station was categorized into either: i) submerged and unsubmerged during the flood; or ii) located within (<35 km) or outside (>35 km) from estuary. For all of the parameters collected, non-parametric tests were carried out in order to evaluate the significant differ-ence between degree of submergence and how far they are located from estuary. As shown on Table 2, result of the statistical analysis showed that the degree of submergence and the well location have no impact on the extent of well contamination (p > 0.01), prov-ing the null hypotheses. Therefore for the future stud-ies, we should address the main limitation of this studies which include increasing sample sizes, imme-diate samples collection following flood event; and incorporating other variables such as water quality index (WQI), land use and population densities.
Region located in the estuary frequently recorded high TVC values and these include Rantau Panjang and Pengkalan Chepa (see Tab. 1). Nevertheless, sig-nificant contaminations were also recorded in several
unsubmerged wells found scattered in non-estuary region such as in Machang and Pasir Puteh. Mean-while, a few samples collected from non-estuary re-gion (badly submerged i.e., Tanah Merah) showed no contamination. This indicated that the flood water itself was not necessarily the main source of contami-nation. Based on a study by URBAŃSKI and JAKUBIAK [2017], soil microbial activities and diversities were largely affected by the forms of land use. Land use will therefore determine the microbial diversity of the groundwater system in a particular region. Therefore, irregular trends observed on TVC were considered to be mainly due to intrinsic contamination rather than the one brought about by the flood. Other than water-shed erosion, drainage from sewage is one of the main sources of bacterial contamination found in the well water [CHIRANJAY et al. 2012]. Because of this, prox-imity of wells to sewage or drainage system could consequently result in high TVC values, regardless of the well location. Kelantan is the only state in Malay-sia that has an inadequate water supply network, poor drainage and sewage infrastructure. Consequently, being frequently exposed to monsoon flooding, Ke-lantan is highly vulnerable flood triggered contamina-tion and this situation was exacerbated in the densely populated estuary regions.
In this study, there were no significant difference in EC values, total dissolved solid (TDS) and turbidity for wells exposed to different degree of submergenc-es. Also, there was no correlation between microbio- logical contamination and physico-chemical parame- ters as similarly observed by IDRUS et al. in their stud-ies [IDRUS et al. 2014]. However, the physicochemi-cal properties of well water seemed to be significantly affected by the geographical location, with TDS at p < 0.05 and TSS at p < 0.01, respectively. Wells near estuary (Wakaf Baharu, Bachok, Pantai Cahaya Bu-lan, Rantau Panjang and Pengkalan Chepa) showed to have higher EC (or TDS) (mean of 241.2 µSꞏcm–1 ± 159.5 SD) and turbidity (8.04 NTU ± 6.53 SD) val-
Table 2. Statistical analysis using Mann–Whitney tests for several parameters against well submergence and geographical distance from estuary (total sample number = 65)
Parameter Analysis place Sample
number N Mean rank Sum of rank
Mann–Whitney test
Z values Asymptote (2 tails)
(p-value) Test on estuary versus far or non-estuary
Total dissolved solids (mg∙dm–3)
near estuary 30 38.57 1 157.0 358.0 –2.198 0.028
non estuary 35 28.23 988.0
Turbidity (NTU)
near estuary 30 42.53 1 276.0 239.0 –3.764 0.000
non estuary 35 24.83 869.0 Total viable coliform count CFUꞏ(0.1 dm3)–1
near estuary 30 34.60 1 038.0 477.0 –0.632 0.527
non estuary 35 31.63 1 107.0
Test on submergence versus non submergence
Total dissolved solids (mg∙dm–3)
submerged 40 31.40 1 256.0 436.0 –0.863 0.388
non submerged 25 35.56 889.0
Turbidity (NTU)
submerged 40 33.49 1 339.5 480.5 –0.263 0.793
non submerged 25 32.22 805.5 Total viable coliform count CFUꞏ(0.1 dm3)–1
submerged 40 32.03 1 281.0 461.0 –0.526 0.599
non submerged 25 34.56 864.0
Source: own study.

134 H.A.AB. RAHMAN, N.A. IBRAHIM, A.A. ABDUL HAMID, T.H.T. ABDUL HAMID
© PAN in Warsaw, 2018; © ITP in Falenty, 2018; Journal of Water and Land Development. No. 38 (VII–IX)
ues compared to those from inner basin (Jeli, Tanah Merah, Kuala Krai, Pasir Puteh, Machang and Te-mangan) with lower mean for TDS (at 156.3 µSꞏcm–1 ± 88.9 SD); and TSS (2.90 NTU ±2.46 SD). During flood, there were two underlying processes; first, the flood water exchanged its content directly with the content of the well. Second, as the flood moved downstream it washed out dissolved and suspended materials along it flow path. Gradually, the flood wa-ter will be enriched with dissolved solutes and sus-pended sediment until it approached the densely populated estuary. As shown in Figure 5, this phe-nomenon is visible especially when all of the physico- -chemical data for stations located consecutively along Kelantan River were plotted. However, an op-posite trend was observed for TDS, TSS and turbidity values for direct river water sampling [YEN, ROHAS-
LINEY 2013]. In this work, amongst 4 consecutive stations along Kelantan River, Kuala Krai (non-estu-ary) had recorded the highest values of TDS, TSS and turbidity values and this was attributed to the upstream sand mining and lodging activities. Therefore, the heavy 2014 flood has resulted in a different physico-chemical profile to the river as shown by the well wa-ter sample. This can only be compared or verified further with the available data prior to the flood event. Since these study was not conducted in longitudinal, the data on well prior to flood event were not available.
Fig. 5. Average values for total dissolved solids (TDS) and turbidity (TSS) on several stations located
consecutively in upstream-downstream direction along the Kelantan River; source: own study
CONCLUSIONS
This is one of the first few study using well water sample in evaluating the impact of flood. In this study, about 65 well water samples from 20 stations at 13 locations along Kelantan River were collected that were previously exposed to different degree submerg-ence during unprecedented 2014 flood. Most of the wells (93.8%) showed to have violated the microbio-logical safety limit for drinking purpose. Our study on
Kelantan River basin indicated that neither location nor inundation status of the well have direct impact on the degree of microbiological contaminations. Other physico-chemical parameters such TDS and turbidity were also unaffected by the flood inundation. The wells in the delta showed to have significantly higher TDS and turbidity values than that of the inner basin. The 2014 flood had caused a trend changes in the physical qualities and affecting the biological quali-ties of the well. Consequently, in terms of well water quality, a greater health risk were found clustered on the densely populated region of Kelantan River delta, regardless of well inundation. Kelantan River post flood studies showed that the status quo of existing biological contamination could determine the severity of contamination and the ultimate post flood health risk. Geographical location of well determine the physical properties of the well, and this also have to be considered in assessing the overall quality of the well following flood.
Acknowledgements Special thank dedicated to Dr. Mustafizur Rahman, Kulli-yah of Science, International Islamic University Malaysia, for assistance in the statistical part of the work, and also to Dr. Zuhairi Ahmad, Marine Science Department, Kulliyah of Science, International Islamic University Malaysia for map compilation work. The authors wish to thank Ministry of Higher Education Malaysia (MOHE) for financial assis-tances received under the grant no FRGS-15-160-0410 which was involved in completing this project.
REFERENCES
ABRAHAM W.-R., WENDEROTH D.F. 2005. Fate of faculta-tive pathogenic microorganisms during and after the flood of the Elbe and Mulde Rivers in August 2002. Ac-ta Hydrochimica et Hydrobiologica. Vol. 33. Iss. 5 p. 449–454.
AFP 2014. Flood kill 21 in Malaysia [online]. Singapore. Agence France Presse. [Access 20.03.2016] Available at: http://news.asiaone.com/news/malaysia/floods-kill-21-malays
ALIAS N.E., MOHAMAD H., CHIN W.Y., YUSOP Z. 2016. Rainfall analysis of the Kelantan big yellow flood 2014. Jurnal Teknologi. Vol. 78. Iss. 9–4 p. 83–90.
ANG G.Y., YU C.Y., BALQIS K., ELINA H.T., AZURA H., HANI M.H., YEAN C.Y. 2010. Molecular evidence of cholera outbreak caused by a toxigenic Vibrio cholerae O1 El Tor variant strain in Kelantan, Malaysia. Journal of Clinical Microbiology Vol. 48. No. 11 p. 3963–3969.
ASHLEY R.M., BALMFORTH D.J., SAUL A.J., BLANKSBY J.D. 2005. Flooding in the future – predicting climate change, risks and responses in urban areas. Water Sci-ence Technology. Vol. 52. Iss. 5 p. 265–273.
AZIMULLAH A.Z., AZIAH B.D., FAUZIAH M.N. 2016. The rise of leptospirosis in Kelantan 2014: Characteristics, geographical pattern and associated factors. Inter-national Journal of Public Health and Clinical Sciences. Vol. 3. Iss. 4 p. 52–62.
BENRABAH S., ATTOUI B., HANNOUCHE M. 2016. Character-ization of groundwater quality destined for drinking wa-ter supply of Khenchela City (eastern Algeria). Journal
0
50
100
150
200
250
300
0
1
2
3
4
5
6
7
8
Dab
ong
Kua
la K
rai
Tem
anga
n
Tan
ah M
erah
Wak
f Bah
aru
PC
B
Tur
bidi
ty,N
TU
TD
S,m
g∙dm
−3
Turbidity (NTU)
TDS (mg/L)

Effect of 2014 massive flood on well water qualities: A case study on Kelantan River basin, Malaysia 135
© PAN in Warsaw, 2018; © ITP in Falenty, 2018; Journal of Water and Land Development. No. 38 (VII–IX)
of Water and Land Development. No. 30 p. 13–20. DOI 10.1515/jwld-2016-0016.
BRIAN S., JASON B.H., ASHRAFUL I.K., REGINA C.L., DAVID A.S., MOHAMMAD A.M., ABU S.G.F., FIRDAUSI Q., STEPHEN B.C., STEPHEN P.L., EDWARD T.R. 2006. Diarrheal epidemics in Dhaka, Bangladesh, during three consecutive floods: 1988, 1998, and 2004. The Amer-ican Journal of Tropical Medicine and Hygiene. Vol. 74. Iss. 6 p. 1067–1073.
CHANG C.-P., WANG Z., HENDON H. 2006. The Asian win-ter monsoon. In: East Asia monsoon. Ed. B. Wang. Hei-delberg. Springer p. 89–127.
CHEESBROUGH M. 2006. Water-related diseases and testing of water supplies. In: District laboratory practise in trop-ical countries. P. 2. 2nd ed. Norfolk. Tropical Health Technology p. 143–157.
CHIRANJAY M., SHASHIDHAR V., VANDANA K.E., SHA-
MANTH A.S., AFRIN S. 2012. Microbial quality of well water from rural and urban households in Karnataka, India: A cross-sectional study. Journal of Infection and Public Health. Vol. 5. Iss. 16 p. 257–262.
DAVIES R. 2015. Malaysia floods – Kelantan flooding worst recorded as costs rise to RM1 billion [online]. USA. FloodList. [Access 03.01.2015]. Available at: http://floodlist.com/asia/malaysia-floods-kelantan-worst-recorded-costs#
DEPETRIS P.J., STEPHAN K. 1990. The impact of the el Niño 1982 event on the Paraná River, its discharge and car-bon transport. Global and Planetary Change. Vol. 3. Iss. 3 p. 239–244.
EDBERG S., EDBERG M.M. 1988. A defined substrate tech-nology for the enumeration of microbial indicators of environmental pollution. The Yale Journal of Biology and Medicine. Vol. 61. Iss. p. 389–399.
EMEKA U.J., OSONDU N.A. 2016. Post impact studies of the 2012 flooding on the environment and health of Oguta residents, Southeastern, Nigeria. Journal of Multidisci-plinary Engineering Science and Technology. Vol. 3. Iss. 11 p. 28–36.
FEWTRELL L., KAY D. 2008. An attempt to quantify the health impacts of flooding in the UK using an urban case study. Public Health. Vol. 122. Iss. 5 p. 446–451.
HAMZAH Z., WAN ROSDI W.N., HJ WOOD A.K., SAAT A. 2014. Determination of major ions concentrations in Kelantan well water using EDXRF and ion chromato-graphy. The Malaysian Journal of Analytical Sciences. Vol. 18. Iss. 1 p. 178–184.
IDRUS A.S., FAUZIAH M.N., HANI M.H., WAN ROHAILA
W.A., WAN MANSOR H. 2014. Status of groundwater contamination in rural area, Kelantan. IOSR Journal of Environmental Science, Toxicology and Food Techno-logy. Vol. 8. Iss. 1 p. 72–80.
INVIK J., BARKEMA H.W., MASSOLO A., NEUMANN N.F., CHECKLEY S. 2017. Total coliform and Escherichia coli contamination in rural well water: Analysis for passive surveillance. Journal of Water and Health. Vol. 15. Iss. 5 p. 729–740.
ISA A.R. 1990. Cholera outbreak in Tumpat, Kelantan. Medical Journal of Malaysia. Vol. 45 p. 187–193.
ISSA A.K.M., BADREALAM S., MUHA N.S.E., ARSHAD M.K., MARTIN J., ASFAR J., MUHAMMAD N.S., IBRAHIM N.M. 2012. A review of groundwater quality for domestic consumers’ consumption in Perlis. Jurnal Intelek (UiTM Perlis). Vol. 7. Iss. 1 p. 23–27.
JA'AFAR J.N., GOAY Y.X., ZAIDI N.F.M., LOW H.C., HUSSIN H.M., HAMZAH W.M., BHORE S.J., BALARAM P., ISMAIL A., PHUA K.K. 2013. Epidemiological analysis of ty-
phoid fever in Kelantan from a retrieved registry. Ma-laysian Journal of Microbiology. Vol. 9. Iss. 2 p. 147–151.
KUNDZEWICZ Z.W., KANAE S., SENEVIRATNE S.I., HAND-
MER J., NICHOLLS N., PEDUZZI P., MECHLER R., BOUWER L.M., ARNELL N., MACH K., MUIR-WOOD R., BRAKENRIDGE G.R., KRON W., BENITO G., HONDA Y., TAKAHASHI K., SHERSTYUKOV B. 2014. Flood risk and climate change: Global and regional perspectives. Hy-drological Sciences Journal. Vol. 59. Iss. 1 p. 1–28.
MALIK A S, MALIK R H. 2001. Typhoid fever in Malaysian children. Medical Journal of Malaysia. Vol. 56 p. 478–490.
MOH 2005. Drinking water quality surveillance programme [online]. Ministry of Health, Malaysia. [Access 14.04.2015]. Available at: http://kmam.moh.gov.my/ public-user/drinking-water-quality-standard.html
MOHAMMAD S.O., LIM E.C., IDRIS M. 2007. Water quality changes in Chini lake, Pahang, west Malaysia. Envi-ronmental Monitoring and Assessment. Vol. 131. Iss. 1 p. 279–292.
MUKHOPADHYAY C., VISHWANATH S., ESHWARA V.K., SHANKARANARAYANA S.A., SAGIR A. 2012. Microbial quality of well water from rural and urban households in Karnataka, India: A cross-sectional study. Journal of In-fection and Public Health. Vol. 5. Iss. 3 p. 257–262.
OHL C., TAPSELL S. 2000. Flooding and human health: The dangers posed are not always obvious. British Medical Journal. Vol. 321. p. 1167–1168.
PHANUWAN C., TAKIZAWA S., OGUMA K., KATAYAMA H., YUNIKA A., OHGAKI S. 2006. Monitoring of human en-teric viruses and coliform bacteria in waters after urban flood in Jakarta, Indonesia. Water Science and Techno-logy. Vol. 54. Iss. 3 p. 203–210.
PRITCHARD M.M.T., O’NEILL J.G. 2007. Biological, chemi-cal and physical drinking water quality from shallow wells in Malawi: Case study of Blantyre, Chiradzulu and Mulanje. Physics and Chemistry of the Earth. Parts A/B/C. Vol. 32. Iss. 15 p. 1167–1177.
RAMESH A., THIRUMALESH D.H., KAUSER F. 2015. A mi-crobiological study of bore well drinking water in and around Bengaluru Metro city, India. International Jour-nal Current Microbiology and Applied Science. Vol. 4. Iss. 10 p. 263–272.
SEFIE A., ARIS A.Z., SHAMSUDDIN M.K.N., TAWNIE I., SU-
RATMAN S., IDRIS A.N., SAADUDIN S.B., WAN AHMAD W.K. 2015. Hydrogeochemistry of groundwater from different aquifer in lower Kelantan basin, Kelantan, Ma-laysia. Procedia Environmental Sciences. Vol. 30 p. 151–156.
SHAMSUDDIN A.S., ISMAIL S.N.S., ABIDIN E.Z., BIN H.Y., JUAHIR H. 2016. Contamination of nitrate in groundwa-ter and evaluation of health risk in Bachok, Kelantan: A cross-sectional study. American Journal of Applied Sciences. Vol. 13. Iss. 1 p. 80–90.
SINIGALLIANO C.D., GIDLEY M.L., SHIBATA T., WHITMAN D., DIXON T.H., LAWS E., HOU A., BACHOON D., BRAND L., AMARAL-ZETTLER L., GAST R.J., STEWARD G.F., NIGRO O.D., FUJIOKA R., BETANCOURT W.Q., VITHANAGE G., MATHEWS J., FLEMING L.E., SOLO- -GABRIELE H.M. 2007. Impacts of hurricanes Katrina and Rita on the microbial landscape of the New Orleans area. Proceedings of National Acedemy of Science USA. Vol. 104. Iss. 21 p. 9029–9034.
SIRAJUL I.M., BROOKS A., KABIR M.S., JAHID I.K., SHAFIQUL I.M., GOSWAMI D., NAIR G.B., LARSON C., YUKIKO W., LUBY S. 2007. Faecal contamination of

136 H.A.AB. RAHMAN, N.A. IBRAHIM, A.A. ABDUL HAMID, T.H.T. ABDUL HAMID
© PAN in Warsaw, 2018; © ITP in Falenty, 2018; Journal of Water and Land Development. No. 38 (VII–IX)
drinking water sources of Dhaka city during the 2004 flood in Bangladesh and use of disinfectants for water treatment. Journal of Applied Microbiology. Vol. 103 Iss. 1 p. 80–87.
STEPHEN A. 2015. Floods – the consequence of human in-trusion into nature [online]. International Medical Uni-versity Malaysia (IMU). [Access 27.02.2018]. Available at: http://iejsme.imu.edu.my/openaccess/c/?rndId= 1517259763888
THAMER A.M., ABDUL H.G. 2009. Evaluation of yield and groundwater quality for selected wells in Malaysia. Per-tanika Journal of Science and Technology. Vol. 17. Iss. p. 33–42.
TUNSTALL S., TAPSELL S., GREEN C., FLOYD P., GEORGE C. 2006. The health effects of flooding: social research re-sults from England and Wales. Journal of Water and Health. Vol. 4. Iss. p. 365–380.
URBAŃSKI K., JAKUBIAK M. 2017. Impact of land use on soils microbial activity. Journal of Water and Land De-velopment. Vol. 35. Iss. 1 p. 249–257. DOI 10.1515/ jwld-2017-0091.
WHITEHEAD P.G., WILBY R. L., BATTARBEE R. W., KERNAN M., WADE A.J. 2009. A review of the potential impacts of climate change on surface water quality. Hydrologi-cal Sciences Journal. Vol. 54. Iss. 1 p. 101–123.
WHO 2011. Guidelines for drinking water quality [online]. Geneva. World Health Organisation. [Access
25.02.2016]. Available at: http://apps.who.int/iris/ bitstream/10665/44584/1/9789241548151_eng.pdf
WILLIAMSON F. 2016. The "Great flood" of 1926: Environ-mental change and post disaster management in British Malaysa [online]. Ecological Society of America. [Ac-cess 27.07.2017]. Available at: http://onlinelibrary. wiley.com/doi/10.1002/ehs2.1248/full
YAP L.L., AWENG E.R., LIYANA A.A. 2017. Performance of rambutan seed extracts as iron and manganese removal in drinking groundwater well in Tanah Merah, Kelan-tan. Journal of Tropical Resources & Sustainable Sci-ence. Vol. 5. Iss. 2. p. 79–82.
YEN T.P., ROHASLINEY H. 2013. Status of water quality subject to sand mining in the Kelantan River, Kelantan. Tropical Life Sciences Research. Vol. 24. Iss. 1 p. 19–34.
YOUSAF S., AMIR ZADA A., OWAIS M. 2013. Physico- -chemical characteristics of potable water of different sources in District Nowshera: A case study after flood – 2010. Journal of Himalayan Earth Sciences. Vol. 46. Iss. 1 p. 83–87.
YOUSAFZAI A.M., KHAN W., HASAN Z. 2013. Fresh records on water quality and ichthyodiversity of River Swat at Charsadda, Khyber Pakhtunkhwa. Pakistan Journal of Zoology. Vol. 45. Iss. 6 p. 1727–1734.
Hariz A. Ab. RAHMAN, Noor A. IBRAHIM, Azzmer A. ABDUL HAMID, Tengku H.T. ABDUL HAMID
Wpływ ekstremalnej powodzi z 2014 roku na jakość wód w studniach: Przykład basenu rzeki Kelantan w Malezji
STRESZCZENIE
Oceniano fizyczne i biologiczne właściwości wód w studniach zalanych w wyniku powodzi w grudniu 2014 r. w basenie rzeki Kelantan. Badania prowadzono łącznie w 65 studniach z 13 stanowisk w basenie rzeki. Anali-zowano pH, zawartość substancji rozpuszczonych (TDS), mętność i zanieczyszczenie mikrobiologiczne. Zanie-czyszczenia wykryto w ok. 95% studni, w 7 z 65 stwierdzono wartości TDS > 400 µSꞏcm–1, a 19 próbek (29,2%) miało mętność ponad 7,0 NTU. Statystyczne testy dla zmiennych niezależnych wykazały, że poziom zanie-czyszczeń nie zależał ani od stopnia zalania, ani od lokalizacji. Fizyczne i chemiczne parametry wody także nie były zależne od zalewu powodziowego, TDS i mętność zmieniały się wraz z położeniem geograficznym z istot-nością p < 0,05. W wodzie ze studni z estuarium rzeki wartości TDS i mętność (odpowiednio 241,2 µSꞏcm–1 ±159,5 SD i 8,04 NTU ±6,53 SD) były większe niż w wodzie ze studni w głębi basenu (TDS 156,3 µSꞏcm–1
±88,9 SD, mętność 2,90 NTU ±2,46 SD). Wody powodziowe odgrywały istotną rolę w przenoszeniu zanieczysz-czeń. Większość wód studziennych nie nadawała się do picia. Stwierdzono ostatecznie, że stopień zalania studni niekoniecznie determinuje stopień zanieczyszczenia studni, ale występujące zanieczyszczenia mogą zwiększać potencjalne ryzyko po ustąpieniu powodzi. Słowa kluczowe: bakterie typu coli, basen rzeki Kelantan, jakość wody, woda pitna, zalanie wodami powo-dziowymi