Embed Size (px)
Citation preview

© Polish Academy of Sciences (PAN) in Warsaw, 2016; © Institute of Technology and Life Sciences (ITP) in Falenty, 2016
© Polish Academy of Sciences, Committee for Land Reclamation JOURNAL OF WATER AND LAND DEVELOPMENT and Environmental Engineering in Agriculture, 2016 2016, No. 30 (VII–IX): 87–100 © Institute of Technology and Life Sciences, 2016 PL ISSN 1429–7426 Available (PDF): http://www.itp.edu.pl/wydawnictwo/journal; http://www.degruyter.com/view/j/jwld
Received 18.03.2016 Reviewed 22.04.2016 Accepted 10.05.2016 A – study design B – data collection C – statistical analysis D – data interpretation E – manuscript preparation F – literature search
Modelling of the rain–flow by hydrological modelling software system HEC-HMS – watershed’s case of wadi Cheliff-Ghrib, Algeria
El Hadj MOKHTARI1) ABCDE, Boualem REMINI2) DE, Saad Abdelamir HAMOUDI1) DF
1) University of Hassiba Ben Bouali, Faculty of Architecture and Civil Engineering, Department of Hydraulic, University Pôle Ouled Fares, N19, Chlef, Algeria; e-mail: [email protected], [email protected]
2) University of Saad Dahlab, Department of Water Sciences and Environment, Blida, Algeria; e-mail: [email protected]
For citation: Mokhtari E.H., Remini B., Hamoudi S.A. 2016. Modelling of the rain–flow by hydrological modelling soft-ware system HEC-HMS – watershed’s case of wadi Cheliff-Ghrib, Algeria. Journal of Water and Land De-velopment. No. 30 p. 87–100. DOI: 10.1515/jwld-2016-0025.
Abstract
The purpose of this study is to make a hydrologic modelling type of rain–flow on watershed of wadi Che-liff-Ghrib, by means of HEC-HMS model. Afterwards, this model is used to predict hydrologic response of the basin to the climate changes scenarios and land use. The model calibration was made in two phases; the first one is to select events, formalism of transfer function and appropriate NRCS downpour. The second is to deduce op-timised parameters set which is used in validation. By using optimised parameters set, we were able to predict impact of quantiles downpours, changes in land use due to urbanisation, deforestation and reforestation on the peak flow and on runoff volume. Towards the end, we reconfirmed that influence of land use decreases for ex-treme storms.
Key words: Algeria, HEC-HMS – watershed, modelling, rain–flow, wadi Cheliff-Ghrib
INTRODUCTION
In hydrology, a simplified mathematical repre-sentation of all or in part of hydrological cycle proc-ess is essential. Thus hydrological concepts are ex-pressed in mathematical language to represent the corresponding behaviour observed in the nature. For the user, interest of a model, resides in it capacity to provide a “satisfactory” response to the asked ques-tions about modelled object. Nowadays there are dif-ferent models types: from physical model and empiri-cal model, from distributed and overall, and each type expresses some way to design the hydrological cycle. [MOUELHI 2003]. A classification may be done on some differentiating keys according to criteria set out by CLARKE [1973] and AMBROISE [1998].
The decision-support tools can help in the best development options in order to allow human to check water, soil and potentials. A solution and reli-able approach to this challenge is use of appropriate hydrological models for efficient management of wa-tersheds and ecosystems [YENER et al. 2012], hydro-logical modelling is a tool generally used to estimate the hydrological response of the basin due to rainfall. It forecasts hydrological response at various manage-ment practices of watershed and have better impacts understanding of these practices [KADAM 2011].
It is obvious through extended review of litera-ture that studies on comparative assessment models of watershed for hydrological simulations are quite lim-ited in developing countries including India [KUMAR, BHATTACHARYA 2011]. This explains necessity to
DOI: 10.1515/jwld-2016-0025
88 E.H. MOKHTARI, B. REMINI, S.A. HAMOUDI
© PAN in Warsaw, 2016; © ITP in Falenty, 2016; Journal of Water and Land Development. No. 30 (VII–IX)
undertake study of hydrological simulation by devel-oping an appropriate model to the watershed. The hydrological modelling system of hydrological centre of technology (HEC-HMS) is a model widely used to simulate process of run-off and rainfall.
Several studies have used model of HEC-HMS in different regions (soils and different climatic condi-tions). CHU and STEINMAN [2009] have used HEC- -HMS model for event and continuous hydrological modeling in watershed of Mona lack in western Mich-igan. The HEC-HMS model has also been used to simulate rainfall-runoff process with geo-informatics and atmospheric models for flood forecasting and early detections in different regions of the world [ALI et al. 2011; AREKHI 2012; AREKHI et al. 2011; DZUBAKOVA 2010; HALWATURA, NAJJIM 2013; HU et al. 2006; KNEBL et al. 2005; MAJIDI, SHAHEDI 2012; MAJIDI, VAGHARFARD 2013; MCCOLL, AGGETT 2006; PANIGRAHI 2013, YENER et al. 2012; YUSOP et al. 2007]. Also, it has been used for management of watersheds in different regions of India [BHATT et al. 2012; KADAM 2011; CHOUDHARI et al. 2014; KUMAR, BHATTACHARYA 2011]. The model has been found précis in response’s basin in time and space at event scale and for a longue and continuous period as well as simulating various scenarios in flood forecasting and early detections. AL-AHMADI [2005] made a rainfall-runoff by HEC- -HMS, GIS and RS in three sub-basins in south- -west of Saudi Arabia.
He carried out the model with automatic method of calibration and obtained acceptable re-sults SHAGHAEGHI FAL-LAH [2001] applied the model of HEC-HMS to simulate runoff of river into the watershed of Mohammadabad (located to the North of Iran). Re-sults of simulation were reliable and valid com-pared with observations’ data. The goal of the pre-sent study is to simulate rainfall-runoff process through hydrological model of HEC-HMS in watershed of Cheliff- -Ghrib Algeria, in order to verify its feasibility in this mountainous area well known by its spatio- -temporal heterogeneity. Furthermore, we will try to predict the future hy-drological response of
this basin, due to scenarios of climatic change by quantile rain showers, and other caused by land use changes and types of soil, in order to make decision makers aware of anthropogenic actions, notably, ur-ban development and excessive deforestation at level of Cheliff-Ghrib on hydrological regime.
STUDY AREA
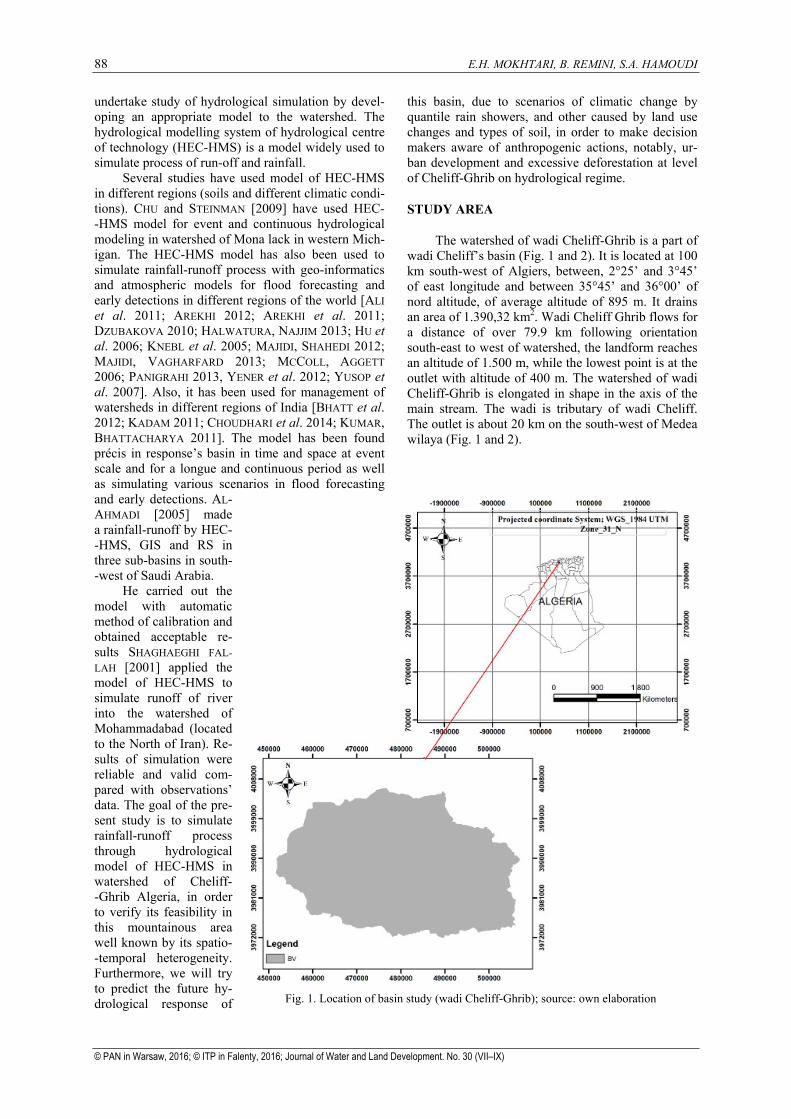
The watershed of wadi Cheliff-Ghrib is a part of wadi Cheliff’s basin (Fig. 1 and 2). It is located at 100 km south-west of Algiers, between, 2°25’ and 3°45’ of east longitude and between 35°45’ and 36°00’ of nord altitude, of average altitude of 895 m. It drains an area of 1.390,32 km2. Wadi Cheliff Ghrib flows for a distance of over 79.9 km following orientation south-east to west of watershed, the landform reaches an altitude of 1.500 m, while the lowest point is at the outlet with altitude of 400 m. The watershed of wadi Cheliff-Ghrib is elongated in shape in the axis of the main stream. The wadi is tributary of wadi Cheliff. The outlet is about 20 km on the south-west of Medea wilaya (Fig. 1 and 2).
Fig. 1. Location of basin study (wadi Cheliff-Ghrib); source: own elaboration

Modelling of the rain–flow by hydrological modelling software system HEC-HMS – watershed’s… 89
© PAN in Warsaw, 2016; © ITP in Falenty, 2016; Journal of Water and Land Development. No. 30 (VII–IX)
Fig. 2. Hydrographic network map
of wadi Cheliff-Ghrib’s basin; source: own elaboration
HEC-HMS HYDROLOGICAL MODEL
HEC-HMS is hydrologic modeling software de-veloped by the US Army Corps of Engineers- Hydro-logic Engineering Center (HEC) [FELDMAN (ed.) 2000]. It is the physically based and conceptual semi distributed model designed to simulate the rainfall-runoff processes in a wide range of geographic areas such as large river basin water supply and flood hy-drology to small urban and natural watershed runoff.
The system encompasses losses, runoff transform, open channel routing, and analysis of meteorological data, rainfall-runoff simulation and parameter estima-tion. HEC-HMS uses separate models to represent each component of the runoff process, including models that compute runoff volume, models of direct runoff, and models of base flow. Each model run combines a basin model, meteorological model and control specifications with run options to obtain re-sults.
Following methods were selected for each com-ponent of runoff process such as runoff depth, direct runoff, base-flow and channel routing in event based hydrological modeling. These methods are selected on the basis of applicability and limitations of each method, availability of data, suitability for same hy-drologic condition, well established, stable, and wide-ly acceptable, researcher recommendation etc.
INPUT DATA OF MODEL
Digital Elevation Model
Before undertaking any operation of a simula-tion file preparation HMS, it is essential to have at his disposal the DEM of the study area, where its role is fundamental in physical characterization and calcula-tion of the parameters (Fig. 3).
Fig. 3. Digital Elevation Model (DEM) and altitude map of Cheliff-Ghrib’s watershed; source: own elaboration
Land use
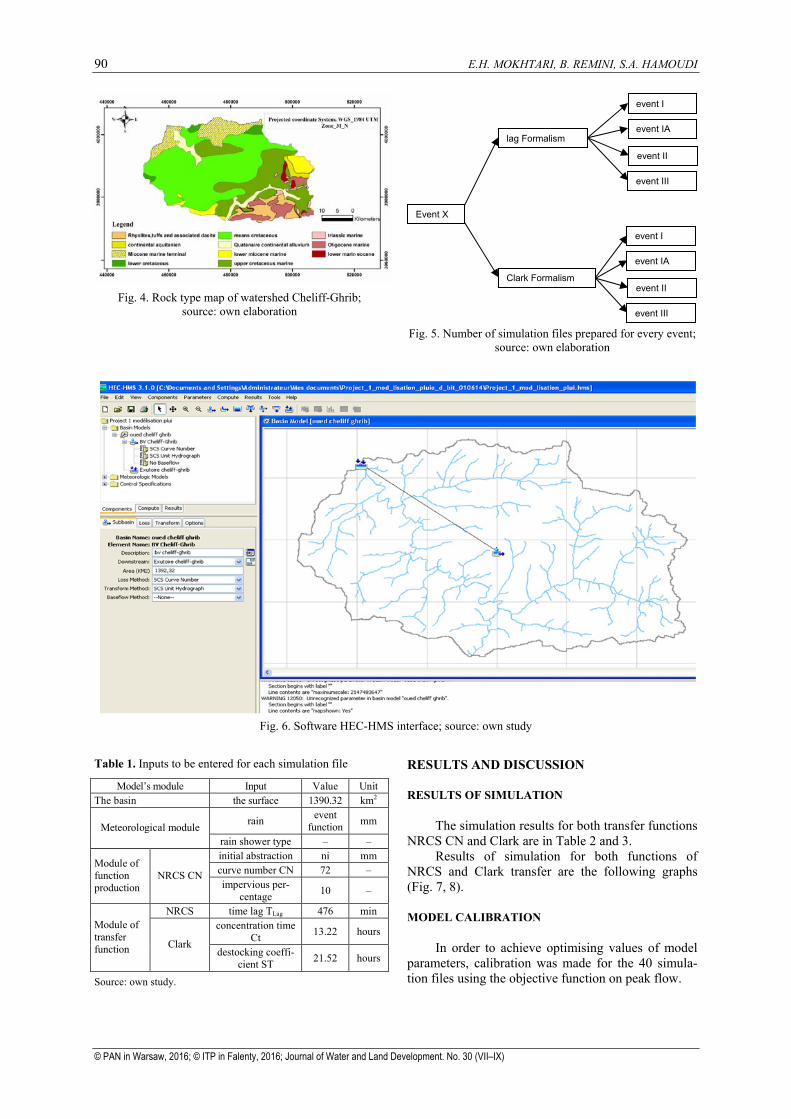
Considering particular requirements of selected modular combination, specifically the NRCS CN method as production function, producing of land use map on the whole study area was an unavoidable way. However, information supposed found in this map should be authentic to the recognised by NRCS classi-fication; consequently, we had to do connexions be-tween classes of NRCS and information gathered from all identified bibliographic data dealing this part (Fig. 4).
The rain data
For each event, rain should be regarded in the form of rainfall height fell on the watershed during the day where this event occurred, of which we asso-
ciate every time one of the four NRCS distributions [NRCS 1997]. In our case, we have been limited to period 06–09.03.1980, 18–21.04.1982, 08–12.03. 1986, 23–25.09.1993 and 23–26.09.1994.
MODEL’S DEVELOPMENT
Before to begin calibration, we prepared all sim-ulations files of the five events previously preselected, in taking into account the four rain showers of NRCS types and the two formalisms of transfer function to analyse the sensitivity of the model successively to rain showers types and to the formalisms. So, we have 40 simulation files (Fig. 5 and 6). For every simula-tion files, we will have the following data (Tab. 1).
90 E.H. MOKHTARI, B. REMINI, S.A. HAMOUDI
© PAN in Warsaw, 2016; © ITP in Falenty, 2016; Journal of Water and Land Development. No. 30 (VII–IX)
Fig. 4. Rock type map of watershed Cheliff-Ghrib;
source: own elaboration
Fig. 5. Number of simulation files prepared for every event; source: own elaboration
Fig. 6. Software HEC-HMS interface; source: own study
Table 1. Inputs to be entered for each simulation file
Model’s module Input Value Unit The basin the surface 1390.32 km2
rain event function mm Meteorological module
rain shower type – – initial abstraction ni mm curve number CN 72 – Module of
function production
NRCS CN impervious per-
centage 10 –
NRCS time lag TLag 476 min concentration time
Ct 13.22 hours Module of transfer function Clark
destocking coeffi-cient ST 21.52 hours
Source: own study.
RESULTS AND DISCUSSION
RESULTS OF SIMULATION
The simulation results for both transfer functions NRCS CN and Clark are in Table 2 and 3.
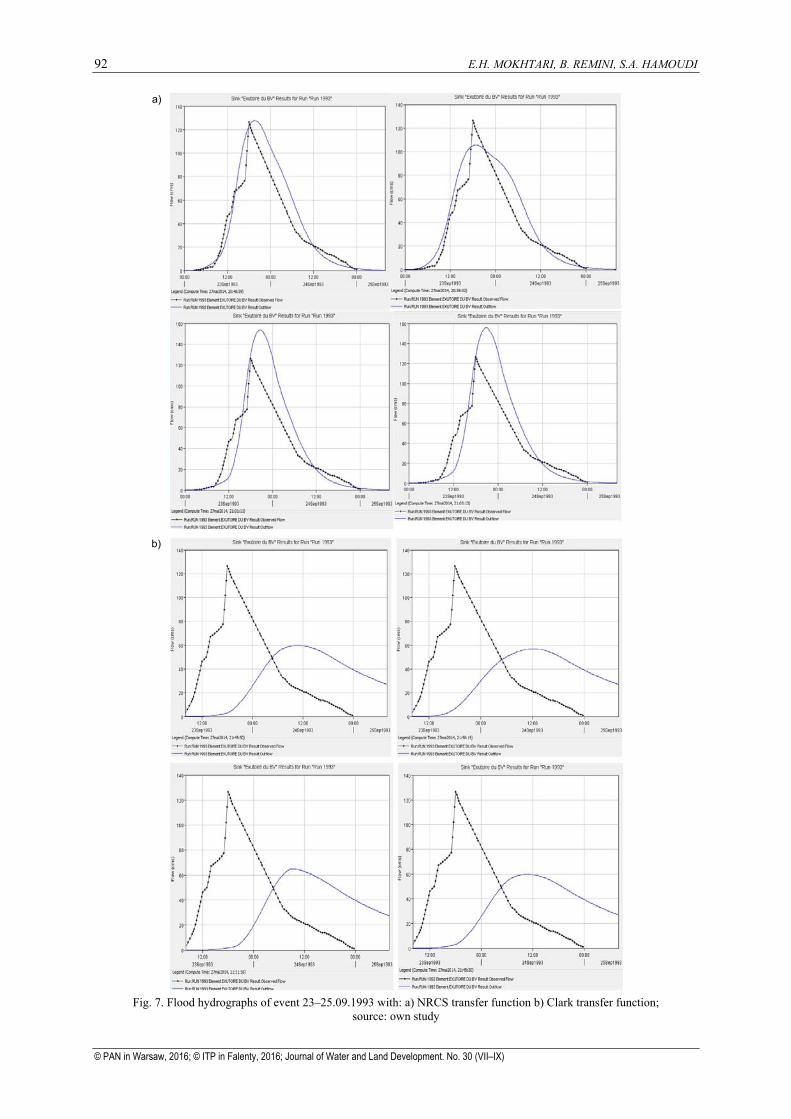
Results of simulation for both functions of NRCS and Clark transfer are the following graphs (Fig. 7, 8).
MODEL CALIBRATION
In order to achieve optimising values of model parameters, calibration was made for the 40 simula-tion files using the objective function on peak flow.
Event X
lag Formalism
Clark Formalism
event I
event IA
event II
event III
event I
event IA
event II
event III

Modelling of the rain–flow by hydrological modelling software system HEC-HMS – watershed’s… 91
© PAN in Warsaw, 2016; © ITP in Falenty, 2016; Journal of Water and Land Development. No. 30 (VII–IX)
Table 2. Simulation results: NRCS CN formalism
Model parameters Simulation results NRCS CN Qp, m3·s–1 Vr, mm Event Rain shower
Ia CN Tlag observed simulated difference % observed simulated difference
% 1 276.4 28.67 11.73 27.02
1A 228.9 13.87 11.73 27.02 2 333.4 40.80 11.75 27.15
1980
3
1 72 476 197.14
337.3 41.55
8.56
11.75 27.15 1 225.8 29.43 10.02 27.54
1A 189.3 15.83 10.02 27.54 2 274.3 41.90 10.02 27.54
1982
3
1 72 476 159.34
274.3 41.90
7.26
10.02 27.54 1 186.5 46.87 8.29 81.59
1A 85.8 75.55 8.25 81.59 2 97.0 72.36 8.25 81.59
1986
3
1 72 476 351.0
98.5 71.94
45.03
8.25 81.59 1 127.7 0.90 5.51 15.24
1A 105.8 16.50 5.51 15.24 2 154.2 17.96 5.51 15.24
1993
3
1 72 476 126.5
156.0 18.91
4.67
5.51 15.24 1 131.6 3.90 5.87 4
1A 110.3 12.81 5.87 4 2 150.4 15.89 5.87 4
1994
3
1 72 476 126.5
159.9 20.90
5.63
5.87 4
Explanations: Qp = peak flow, Vr = runoff volume, CN = curve number, Tlag = time lag. Source: own study.
Table 3. Simulation results: Clark formalism
Simulation Results NRCS CN Clark Qp, m3·s–1
Vr, mm Event Rain shower
Ia CN tc h
St h observed simulated difference
% observed simulated difference %
1 128.9 34.61 11.28 24.11 1A 122.9 37.65 11.48 25.44 2 139.9 29.03 11.47 25.37
1980
3
1 72 13.22 21.52 197.14
141.3 28.32
8.56
11.47 25.37 1 108.7 31.78 9.17 19.74
1A 103.7 34.92 9.17 19.74 2 117.3 26.38 9.16 19.65
1982
3
1 72 13.22 21.52 159.34
119.1 25.25
7.36
9.15 19.56 1 89.8 74.42 8.25 81.62
1A 85.8 75.56 8.25 81.62 2 97.0 72.36 8.25 81.62
1986
3
1 72 13.22 21.52 351.0
98.5 71.94
45.03
8.25 81.62 1 63.5 71.15 5.72 18.36
1A 60.6 52.09 5.72 18.36 2 68.6 45.77 5.72 18.36
1993
3
1 72 13.22 21.52 126.5
69.6 44.98
4.67
5.72 18.36 1 59.8 52.72 4.03 28.42
1A 57.0 54.94 4.04 28.42 2 65.0 48.62 4.01 28.77
1994
3
1 72 13.22 21.52 126.5
63.5 49.80
5.63
5.72 1.60
Explanations: Qp, V, CN, Tlag as in Tab. 2, tc = concentration time, St = storage time. Source: own study.
From calibration results, we can generally see that value of objective function; optimised values of parameters, peak flows and simulated volume vary all in function of the event, of the selected rain shower type and the chosen formalism for transfer function. Results of model calibration are found in the follow-ing graphs (Fig. 8).
In effect, by carefully searching results, we can clearly note that: in the case of NRCS formalism choice, the objective function is null for the four rain shower types of events 18–21.04.1982, 23–25.09. 1993 and 23–26.09.1994. For other events 06–09.03.1980 and 08–12.03.1986 objective function takes null values for rain showers 1.2 and 3 and values
92 E.H. MOKHTARI, B. REMINI, S.A. HAMOUDI
© PAN in Warsaw, 2016; © ITP in Falenty, 2016; Journal of Water and Land Development. No. 30 (VII–IX)
Fig. 7. Flood hydrographs of event 23–25.09.1993 with: a) NRCS transfer function b) Clark transfer function;
source: own study
a)
b)

Modelling of the rain–flow by hydrological modelling software system HEC-HMS – watershed’s… 93
© PAN in Warsaw, 2016; © ITP in Falenty, 2016; Journal of Water and Land Development. No. 30 (VII–IX)
14.2 and 11.9 for rain showers type 1A. This finding is valid for peaks flows, where they are better recov-ered when using of rain showers 1.2, and 3. For simu-lated volumes, they are well estimated for event of 06–09.03.1980, 18–21.04.1982, 23–25.09.1993 and 23–26.09.1994 and are underestimated for event of 08–12.03.1986 and whatever is the rain shower type. Concerning optimised values of parameters, we note that these parameters change by passing from event to the other; and they are less variable within the same event. These parameters sets can serve to validate the model since they are close to events 23–25.09.1993 and 23–26.09.1994.
In the case of choice of Clark formalism, the ob-jective function is null for the four rain showers types of all events. As for flood volumes, we note that prob-lem of the excessive overestimate is still persisting, subject which is well understood because the transfer function has no effect on the flood volume, but it is rather on the movement of this volume that it inter-venes.
According to this first calibration, we were able to highlight some conclusions which are going to al-low us to limit simulation number from which we deduce the optimal parameter set, these conclusions are: the formalism of the unitary hydrograph of NRCS is much more adapted to our study context that of Clark, thus, research of optimal parameters values had to be concentrated in its results, detailed in Table 2.
By use simplified results presented in Table 4, we have made several approaches to reach the optimal parameters set, in this case: – method 1: use of the average parameters values of
the 5 events; – method 2: use of the maximum parameters values
of the 5 events; – method 3: use of the minimum parameters values
of the 5 events. These approaches were carried out on the both
rain shower types 1 and 2 in order to detect that one which allows, with its parameters set, to converge towards a model validation.
Rain shower type 1: the percentage difference between the peak flow observed and simulated varies of 0.74 (method 2, event 1980) until 56.83 (method 1. event 1982). As for efficiency on volume, it appears that it has a different behaviour according to the method and to the event, for instance it fell for event 1986 whichever the method, it increased for event 1993 and 1994. Generally, the problem of overesti-mating volumes still endures which require checking hypothesis stated previously.
Rain shower type 2: the validation results for the different methods are much the same to those of rain shower 1.
This first test of validation allowed qualifying the method of the average values as the one that gives the best results, this is justified in part of the fact that the model is closely linked to the surface state of the basin, namely that if we consider that land use of Che-
liff-Ghrib varies intensely on short periods of time, thus optimal parameter sets of events will never be stable since every one of them occurs during a differ-ent surface state. However, we cannot talk about a model validation basing on this first test on the one hand because we have not enough events in each year, and on the other hand, the lack of efficiency observed during validation cannot be linked only to the change in land use, but we also need to check the above hy-pothesis quoted at the beginning of this part, notably: – choice of the objective function, – percentage estimation of impervious, – the daily rainfall distribution.
MODEL VALIDATION
By applying parameter set defined in Table 5 to events, we reach the following results:
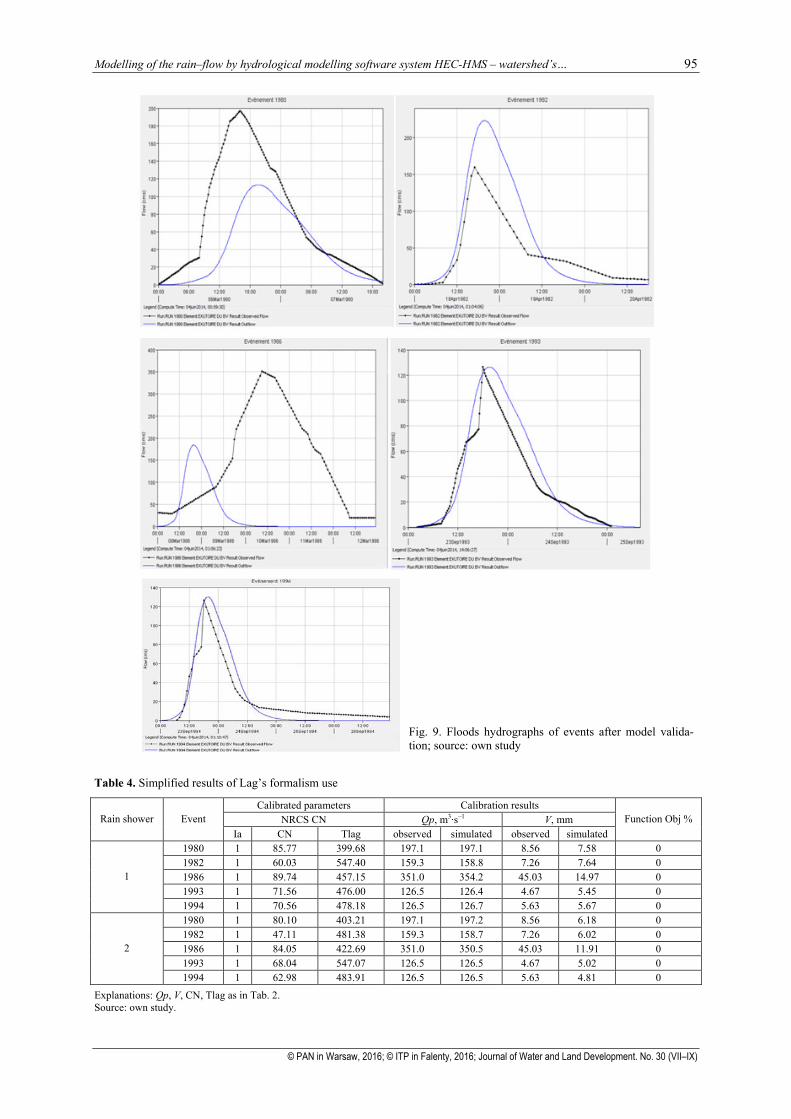
This optimised parameter set is composed of ac-cepted and realistic parameters values such as case of concentration time equal with which we have calcu-lated by method of Giandothi, and CN value very close of that estimated by land use map and soil type. Graphs of flood hydrograph for different events are as follow (Fig. 9).
The Table 5 shows that with the new optimised parameter set, model was able to reproduce the peak flow in a fair way for event 23–26.09.1994, as for the rest, we realize a flow underestimation for event of 06–09.03.1980 and for 08–12.03.1986 and overesti-mation for event 18–21.04.1982.
Simulated volumes for their part, they vary be-tween 26.74% for event 18–21.04.1982 and 81.79% for 08–12.03.1986.
The overestimated volumes are essentially caused by use of project NRCS rain showers in place of ac-quired temporal distributions from rainfall recorders as we have demonstrated it in the calibration part.
In order to quantify level of achievement of these different objectives, the performance criterion used is the NASH one [NASH SUTCLIFE 1970]. This latter one gives an overall appreciation of flood reconstitution.
Criterion formula of NASH is as follows:
∑∑
−
−
−−=
2
2
)(
)(1
obsobs
obssim
QQNASH (1)
This criterion is true for 100% for a perfect re-constitution of the flood and is cancelled for model “called at every hour”, the computed flow is equal to average flow of the flood. So, it shows that if simula-tion which comes through the model is better than estimation which would give an average flow throughout the calibration period.
As it uses squared deviations, it is sensitive to the reconstitution of heavy flows. We consider as bad a NASH below 80%. Validation criterion of NASH model = 88%. Statistically, the NASH criterion shows that the model is validated.

94 E.H. MOKHTARI, B. REMINI, S.A. HAMOUDI
© PAN in Warsaw, 2016; © ITP in Falenty, 2016; Journal of Water and Land Development. No. 30 (VII–IX)
Fig. 8. Flood hydrographs of event 18–21.04.1982 after calibration by: a) NRCS transfer function,
b) Clark transfer function; source: own study
a)
b)
Modelling of the rain–flow by hydrological modelling software system HEC-HMS – watershed’s… 95
© PAN in Warsaw, 2016; © ITP in Falenty, 2016; Journal of Water and Land Development. No. 30 (VII–IX)
Table 4. Simplified results of Lag’s formalism use
Calibrated parameters Calibration results NRCS CN Qp, m3·s–1 V, mm Rain shower Event
Ia CN Tlag observed simulated observed simulated Function Obj %
1980 1 85.77 399.68 197.1 197.1 8.56 7.58 0 1982 1 60.03 547.40 159.3 158.8 7.26 7.64 0 1986 1 89.74 457.15 351.0 354.2 45.03 14.97 0 1993 1 71.56 476.00 126.5 126.4 4.67 5.45 0
1
1994 1 70.56 478.18 126.5 126.7 5.63 5.67 0 1980 1 80.10 403.21 197.1 197.2 8.56 6.18 0 1982 1 47.11 481.38 159.3 158.7 7.26 6.02 0 1986 1 84.05 422.69 351.0 350.5 45.03 11.91 0 1993 1 68.04 547.07 126.5 126.5 4.67 5.02 0
2
1994 1 62.98 483.91 126.5 126.5 5.63 4.81 0
Explanations: Qp, V, CN, Tlag as in Tab. 2. Source: own study.
Fig. 9. Floods hydrographs of events after model valida-tion; source: own study

96 E.H. MOKHTARI, B. REMINI, S.A. HAMOUDI
© PAN in Warsaw, 2016; © ITP in Falenty, 2016; Journal of Water and Land Development. No. 30 (VII–IX)
Table 5. Optimised parameter set used for HEC-HMS mod-el validation on Cheliff-Ghrib’s basin
Parameters Ia mm CN Tlag
Imper-viousness
Rain shower type
Optimised values 1 71.56 476 10 1
Explanations: CN, Tlag as in Tab. 2. Source: own study.
Table 6. Results of model validation
Qp, m3·s–1 V, mm Event ob-
served simu-lated
Differ-ence %
ob-served
simu-lated
Differ-ence %
06–09.03.1980 197.14 113.2 42.58 8.56 4.85 43.34 18–21.04.1982 159.34 223.3 28.64 7.26 9.91 2674 08–12.03.1986 351.0 184.4 47.46 45.03 8.20 81.79 23–25.09.1993 126.5 126.4 0 4.67 5.45 14.31 23–26.09.1994 126.5 130.1 2.76 5.63 5.80 2.93
Explanations: Qp and V as in Tab. 2. Source: own study.
PREDICTION OF THE FUTURE BEHAVIOUR OF CHELIFF-GHRIB
INTRODUCTION
Nobody can deny effect of climatic changes and land use on hydrological processes and disturbance of the natural environment of runoff. Consequently, planners and decision-makers are supposed knowing which will be the impacts downstream of their an-thropic actions undertaken in upstream of watershed, such as urban development, deforestation and refores-tation.
Based on this, the present part tries to reuse the HEC-HMS model adjusted to the watershed of Che-liff-Ghrib to predict its response to the positive and negative scenarios by taking into consideration, changes at climatic level by exploitation of predeter-mined quantile rain showers, and other relating land use. All these scenarios will be implemented on event of 23–26.09.1994 of which model was able to resti-tute the peak flow. As for flood volume, it will be compared to that simulated by model and afterwards to the one actually observed at the outlet station.
SCENARIO 1: THE QUANTILES RAIN SHOWERS
This first scenario simulates effect of rain show-ers of different return periods on flow’s hydrograph at station of Ghrib. So, we have replaced the average rain height of the event by estimated heights by the statistical laws.
Input data
The following table summarises the estimated rain values for return periods which will be used in simulations (Tab. 7).
Each rainfall height will be added to optimised parameters set defined in Table 5 to configure a file of
Table 7. The estimated of rainfall-heights of basin Cheliff- -Ghrib for different return periods
Return period, year Estimated value, mm 10 63.43 25 75.79 50 84.95
100 94.05 200 103.11
1 000 124.11
Source: own study.
distinct simulation. Consequently, we have to com-pare six simulation files, in addition of the simulated and observed results for event of 23–26.09.1994.
Simulation results
Simulated results in Table 5 and graphs in Fig-ure 10 present expected values by HEC-HMS model in watershed of Cheliff-Ghrib in terms of hydro-graphs’ peak and of runoff volume They show amongst other, a linear correlation of R = 0.99 for both variables with the rain. These results impose to responsible to strengthening the protection of measur-ing equipment of flow to the outlet in order it would not be dragged by anticipated flood, and to implement structural measures that can support the huge simu-lated volumes (Tab. 8).
SCENARIO 2: CHANGE IN LAND USE IN A NEGATIVE SENSE
Input data
In this scenario, we try simulating effect of de-forestation and urbanisation on flows and on flood volumes at Ghrib’s station. But due to the raisons linked essentially to absence of information and to global character of the model, we have opted for gen-eral changes on land use and soil type. These changes being made to the map, mainly affects: – surface expansion of the urbanised area; – disappearance of forest cover where density is low
(light juniper, light oak and clear forest); – percentage growth of bare lands favouring defor-
ested land; – percentage growth of impervious due to urbanisa-
tion. From these changes, we have recomputed the
new CN composite of the basin passing to 71.56 to 77. Impervious percentage is evaluated to 15%.
These CN values and impervious percentage will replace the old ones in the optimised parameters’ set, and then we launch the simulation.
Simulation results
The following table shows peak flow values and volume obtained for the scenario studied, then results by associating it to quantiles rain showers (Tab. 9).
We can clearly see that peak flow has increased about 22% knowing we have used a rain height simi-

Modelling of the rain–flow by hydrological modelling software system HEC-HMS – watershed’s… 97
© PAN in Warsaw, 2016; © ITP in Falenty, 2016; Journal of Water and Land Development. No. 30 (VII–IX)
Fig. 10. Flood hydrographs for different events and different return period; source: own study

98 E.H. MOKHTARI, B. REMINI, S.A. HAMOUDI
© PAN in Warsaw, 2016; © ITP in Falenty, 2016; Journal of Water and Land Development. No. 30 (VII–IX)
Table 8. Predicted values of peak flow Qp and volume V at Ghrib’s station for scenario 1
Parameter Observed Simulated T = 10 T = 25 T = 50 T = 100 T = 200 T = 1 000 Qp, m3·s–1 126.5 130.1 635.2 830.5 983.8 1 142.0 1 304.7 1 700.5 V, 1000 m3 7 827.50 8 063.85 38 669.4 50 364.6 59 505.4 68 922.4 78 586.0 101 897.2
Explanations: T = return period. Source: own study.
Table 9. Predicted values of the peak flow Qp and volume V at Ghrib’s station for scenario 2
Parameter Observed Simulated Scenario T = 10 T = 25 T = 50 T = 100 T = 200 T = 1 000 Qp, m3·s–1 126.5 130.1 167.1 750.4 968.3 1 137.6 1 311.2 1 488.6 1 914.1 V, 1000 m3 7 827.5 8 063.8 10 326.5 45 518.9 58 452.8 68 451.0 78 670.3 89 086.0 113 975.4
Explanations: Qp = peak flow, V = volume, T = return period. Source: own study.
Table 10. Comparison between results of scenario 1 and 2
Return period, year Parameter T = 10 T = 25 T = 50 T = 100 T = 200 T = 1 000
Qp scenario 1, m3·s–1 635.2 830.5 983.8 1 142.0 1 304.7 1 700.5 Qp scenario 2, m3·s–1 750.4 968.3 1 137.6 1 311.2 1 488.6 1 914.1 Difference, % 15.36 14.23 13.52 12.90 12.35 11.16 V scenario 1, 1000 m3 38 669.4 50 364.6 59 505.4 68 922.4 78 586.0 101 897.2 V scenario 2, 1000 m3 45 518.9 58 452.8 68 451.0 78 670.3 89 086.0 113 975.4 Difference, in % 15.05 13.83 13.07 12.39 11.79 10.59
Explanations: V and T as in Tab. 9. Source: own study.
lar to that recorded during event. If we compare peaks flows during the six return periods with their homo-logues of the first scenario (Tab. 9), we note that as large is the return period as this percentage of 22% decreases, in other words, for heavy downpours, in-fluence of land use on the flows decreases, this find-ing has been demonstrated in other contexts [JENÍČEK 2007]. Also are volumes behaving in identical way, that is to say as frequency of rain shower is small less will be the effect of surface state on the streamed vol-ume (Tab. 10).
SCENARIO 3: CHANGE IN LAND USE IN A POSITIVE SENSE
Input data
As for this third scenario, action is put on evalu-ation of an urbanisation impact of the basin with the
same scale of that of scenario 2, but in parallel, we undertake actions of bare soils reforestation and strengthening of forest cover with low density, so: – bare soils will become a clear forest; – clear density will become average; – urbanised area is similar to that of scenario 2.
From these changes, we have recomputed the new CN composite of the basin that is equal to 65. The impervious percentage is evaluated to 15%.
This value will replace that of optimised parame-ters set, then we launch simulations.
Simulations results
In the following, are represented results obtained for this scenario, which is the peak flow and volume coming from scenario simulation and those arising by rain substitution of event 23–26.09.1994 by rain at distinct return periods (Tab. 11).
Table 11. The expected values of the peak flow and volume at Ghrib’s station for scenario 3
Parameter Observed Simulated Scenario T = 10 T = 25 T = 50 T = 100 T = 200 T = 1 000 Qp, m3·s–1 126.5 130.1 135.1 592.7 769.7 909.0 1 053.8 1 053.8 1 568.9 V, 1000 m3 7 827.5 8 063.8 8 347.9 36 350.6 47 051.0 47 051.0 47 051.4 47 051.0 94 803.5
Explanations as in Tab. 9. Source: own study.
We realize that the addition of 5% of impervious surface compared to the initial state has generated an increase of 4% for the flow and 3.4% in volume term, even though CN decreased from 71.56 to 65. We can thus understand the negative effect of imperviousness of watershed surfaces, through urbanisation for in-stance, on its hydrological regime. In addition, we note that both variables flow and volume show less
high values than the case of scenario 2, this proves that reforestations although modest, influence on pre-vious urbanisation effects. Finally, influence diminu-tion of land use on flows and volumes for heavy downpour is also valid for this scenario.
From the foregoing, we arrive to recognize the positive and negative effect of some situations which might occur on the ground in the next decades and
Modelling of the rain–flow by hydrological modelling software system HEC-HMS – watershed’s… 99
© PAN in Warsaw, 2016; © ITP in Falenty, 2016; Journal of Water and Land Development. No. 30 (VII–IX)
that the authorities responsible are expected to take into consideration in their land-use planning of Che-liff-Ghrib basin. Furthermore, we have been able to reconfirm that the causal relationship between change of land use on the one hand, and flows and volumes on the other hand, is less and less narrow than down-pour are extreme.
CONCLUSIONS
Through these results, it clearly appears that simulations done by HEC HMS model are encourag-ing. They show that modelling of rivers is complex, requiring a good knowledge of the field and flows; it also requires collection of important data base in spa-tio-temporal, multi sources and multi-disciplines.
The rainfall-runoff models are tools which allow simulating flows in a given point of a stream from knowledge of rain over the corresponding watershed. This modelling is made at the scale of the watershed, characteristic entity of flows concentration, and al-lows thus to simulate transformation which carries out the basin on the rains to generate flows.
Applications of rainfall-runoff models are multi-ple: flood simulation at short term, low flows forecast, floods predetermination and sizing of structures, high-lighted of non-stationarity of hydrologic behavior un-der climatic change effect or of land use evolution. In addition, the rainfall-runoff models allow spreading the forecasting deadlines compared to models flow-flow. After having completely validated the HEC-HMS model on the watershed of Cheliff-Ghrib, we can use it for protection against floods, by using which we call modelling in real time based on recon-stitution principle of the flow to outlet for each time-step for which the given rain is measured, conse-quently, we can progressively reconstitute hydrograph of a flood with recording of rain height. This alarm system proves to be more efficient than one basing on water height measure upstream in the river watershed.
At the end of this work, we can say that applica-tion of HEC-HMS model to watershed data of wadi Cheliff-Ghrib provides very satisfactory results.
REFERENCES
ALI M., KHAN S.J., ASLAM I., KHAN Z. 2011. Simulation of the impacts of landuse change on surface runoff of Lai Nullah Basin in Islamabad, Pakistan. Landscape and Urban Planning. Vol. 102 p. 271–279.
AMBROISE B. 1998. The dynamics of the water cycle in a process watershed factors model. Bucarest. HGA pp. 200.
AREKHI S. 2012. Runoff modeling by HEC-HMS model (Case study: Kan watershed, Iran). International Journal of Agriculture and Crop Sciences. Vol. 4. Iss. 23 p. 1807–1811.
AREKHI S., ROSTAMIZAD G., ROSTAMI N. 2011. Evaluation of HEC-HMS methods I in surface runoff simulation (Case study: Kan Watershed, Iran). Advances in Envi-ronmental Biology. Vol. 5. Iss. 6 p. 1316–1321.
AL-AHMADI F.S. 2005. Rainfall-runoff modelling in arid regions using geographic information systems and re-mote sensing (Case study: Western region of Saudi Arabia). Jeddah. King Ab-dulaziz University. Depart-ment of Hydrology and Water Resources Management pp. 441.
BHATT A., YADAV H.L., KUMAR D. 2012. Estimation of infiltration parameter for Tehri Garhwal Catchment. In-ternational Journal of Engineering Research and Tech-nology. Vol. 1. Iss. 7 p. 1–6.
CHOUDHARI K., PANIRAGHI B., PAUL J.CH. 2014. Simulation of rainfall-runoff process using HEC-HMS model for Balijore Nala watershed, Odisha, India. International Journal of Geomatics and Geosciences.Vol. 5. No. 2 p. 253–265.
CHU X., STEINMAN A. 2009. Event and continuous hydro-logic modeling with HEC-HMS. Journal of Irrigation and Drainage Engineering. Vol. 135. Iss. 1 p. 119–124.
CLARKE R.T. 1973. A review of some mathematical models used in hydrology, with observations on their calibration and use. Journal of Hydrology. Vol. 19 p. 1–20.
DZUBAKOVA K. 2010. Rainfall-runoff modeling: Its devel-opment, classification and possible applications. ACTA Geographical Univerciti Comenianae. Vol. 54. No. 2 p. 173–181.
FELDMAN A.D. (ed.) 2000. Hydrologic Modeling System HEC-HMS: Technical Reference Manual March 2000. Davies, CA. U.S. Army Corps of Engineers, Hydrologic Engineering Center pp. 149.
HALWATURA D., NAJJIM M.M.M. 2013. Application of the HEC-HMS model for runoff simulation in a tropical catchment. Environmental Modeling and Software. Vol. 46 p. 155–162.
HU H.H., KREYMBORG L.R., DOEING B.J., BARON K.S., JUTILA S.A. 2006. Gridded snowmelt and rainfall-runoff CWMS hydrologic modeling of the Red River of the North Basin. Journal of Hydrologic Engineering. Vol. 1 p. 91–100.
JENÍČEK M. 2007. Rainfall-runoff modelling in small and middle-large catchments – an overview. Geografie – Sborník Č GS. Vol. 111. No 3 p. 305–313.
KADAM A.S. 2011. Event based rainfall-runoff simulation using HEC-HMS model. Unpublished P.G. thesis sub-mitted to Dept. of Soil and Water Conservation Eng. CAET, Dr. PDKV, Akola.
KNEBL M.R., YANG Z.L., HUTCHISON K., MAIDMENT D. R. 2005. Regional scale flood modeling using NEXRAD rainfall, GIS, and HEC-HMS/RAS: a case study for the San Antonio River Basin Summer 2002 storm event. Journal of Environmental Management. Vol. 75. Iss. 4 p. 325–336.
KUMAR D., BHATTACHARYA R. 2011. Distributed rainfall runoff modeling. International Journal of Earth Sciences and Engineering. Vol. 4. Iss. 6 SPL p. 270–275.
MAJIDI A., SHAHEDI K. 2012. Simulation of rainfall-runoff process using Green-Ampt method and HEC-HMS model (Case study: Abnama Watershed, Iran). Interna-tional Journal of Hydraulic Engineering. Vol. 1. Iss. 1 p. 5–9.
MAJIDI A., VAGHARFARD H. 2013. Surface run-off simula-tion with two methods using HEC-HMS model (Case study: Abnama Watershed, Iran). Current Advances in Environmental Science. Vol. 1. Iss. 1 p. 7–11.
MCCOLL C., AGGETT G. 2006. Land use forecasting and hydrologic model integration for improved land use de-cision support. Journal of Environmental Management. Vol. 84. Iss. 4 p. 494–512.

100 E.H. MOKHTARI, B. REMINI, S.A. HAMOUDI
© PAN in Warsaw, 2016; © ITP in Falenty, 2016; Journal of Water and Land Development. No. 30 (VII–IX)
MOUELHI S. 2003. Vers une chaîne cohérente de modèles pluie-débit conceptuels globaux aux pas de temps plu-riannuel, annuel, mensuel et journalier [Towards a coherent chain of lumped conceptual rainfall-runoff models with no multi-year time annual, monthly and daily]. PhD thesis. Paris. ENGREF pp. 323.
NASH J.E., SUTCLIFE J.V. 1970. River flow forecasting through conceptual models. Part 1. A discussion of principles. Journal of Hydrology. Vol. 10 p. 282–290.
NRCS 1997. National Engineering Handbook. Part 630. Hydrology. Washington, DC. USDA pp. 762.
PANIGRAHI B. 2013. A handbook on irrigation and drainage. New Delhi. New Indian Publishing Agency. ISBN 9789351305637 pp. 600.
SHAGHAEGHI FALLAH R. 2001. Simulation of maximum peak discharge in river tributaries using HEC-HMS model (Case study: Mohammadabad watershed, Go-lestan province). Thesis of M.Sc. Natural Resources Faculty, University of Gorgan pp. 155.
YENER M.K., SORMAN A.U., SORMAN A.A., SENSOY A., GEZGIN T. 2012. Modeling studies with HEC-HMS and runoff scenarios in Yuvacik Basin, Turkiye. Internatio-nal Congress on River Basin Management p. 621–634.
YUSOP Z., CHAN C.H., KATIMON A. 2007. Runoff character-istics and application of HEC-HMS for modelling stormflow hydrograph in an oil palm catchment. Water Science and Technology. Vol. 56. Iss. 8 p. 41–48.
El Hadj MOKHTARI, Boualem REMINI, Saad Abdelamir HAMOUDI
Modelowanie relacji opad–przepływ przy użyciu systemu modelowania hydrologicznego HEC-HMS na przykładzie rzeki Cheliff-Ghrib w Algerii
STRESZCZENIE
Celem przedstawionych badań było utworzenie hydrologicznego modelu typu opad-przepływ w zlewni rzeki Cheliff-Ghrib za pomocą systemu HEC-HMS. Następnie model ten użyto do przewidywania reakcji hydro-logicznej zlewni na różne scenariusze zmian klimatycznych i zmian użytkowania ziemi. Model kalibrowano w dwóch etapach. Pierwszy polegał na doborze zdarzeń, sformalizowaniu funkcji przejścia i doborze odpowied-niego opadu. Drugim etapem było określenie optymalnego zestawu parametrów użytych do walidacji modelu. Stosując zoptymalizowany zestaw parametrów, można było przewidzieć wpływ opadu i zmian użytkowania ziemi w związku z urbanizacją, wylesianiem i powtórnym zalesianiem na maksymalny przepływ oraz odpływ wody. Potwierdzono, że wpływ użytkowania ziemi maleje w sytuacji ekstremalnych opadów burzowych.
Słowa kluczowe: Algeria, Ghrib, HEC-HMS – zlewnia, modelowanie, opad–przepływ