Embed Size (px)
Citation preview
Proceedings CIGMAT-2007 Conference & Exhibition
Recent Advances in Designing, Monitoring, Modeling and Testing Deep Foundations in North
America
C. Vipulanandan, Ph.D., P.E. P
P Chairman, Professor and Director of Center for Innovative Grouting Materials and
Technology (CIGMAT), Department of Civil and Environmental Engineering, University of Houston, Houston, Texas, 77204. Email: [email protected]
ABSTRACT Based on the challenges in supporting structures on difficult ground conditions and advancement in various technologies, deep foundation engineering has seen rapid advances in designing, monitoring, modeling and testing in recent years. Full-scale tests coupled with innovative monitoring and numerical modeling has helped to better understand the behavior of deep foundations in difficult soils and rocks. Static and dynamic loading systems have been used to load relatively larger diameter single and group pile foundations and monitor the performances in various ground conditions. Construction and monitoring techniques have been improved to ensure the quality of augered cast-in-place piles. Osterberg load cell with better instrumentation have been used to understand the behavior of rock socketed drilled shafts in soft rocks. Tools are being developed to better characterize condition in the borehole of a drilled shaft using downhole penetrometer and laser based roughness profiler. Numerical methods are being used to model the behavior of single and group piles. There is increased interest in understanding the lateral behavior of piles under dynamic loading conditions. Nondestructive test methods are being used to investigate the integrity and bearing capacity of the piles. Load and Resistance Factor Design concept is used more and more in designing deep foundations. INTRODUCTION In recent years, studies have focused on understanding the behavior of driven piles, drilled shafts, augered cast-in-place (ACIP) piles and micropiles designed to carry much higher vertical and lateral static and dynamic loads with limited deflection in various geological conditions. Noteworthy improvement in recent times in north America include better understanding of the soil-pile interaction under static and dynamic conditions, development of computer codes to deal with complex loading and geological conditions, design methods and innovative instrumentation and monitoring systems used during construction and service conditions. Plastic composites and self consolidating concrete have been used in the construction of driven piles and drilled shafts respectively. With the complexity of the problems encountered in the field, it is critical that numerical methods must be used and this is particularly true when nonlinear soil models are used. More attention is paid to better quantify the load-settlement behavior of piles in addition to the bearing capacity.
1
Proceedings CIGMAT-2007 Conference & Exhibition
Non-displacement augered cast-in-place (ACIP) piles are being increasingly used for supporting building, bridges, sound barrier walls and many other structures around the world because they can be installed relatively rapidly with minimum environmental impact and have the flexibility to quickly adjust pile length for varying soil conditions as compared to the other deep foundation systems. Due to lack of understanding of ACIP pile behavior, in many instances, the design capacity of the ACIP pile must be verified by performing one or more full-scale load test on site before installing the production ACIP piles. Hence there is a need to better quantify the performance of ACIP piles in various soil conditions. . Compared to the drilled shafts and driven piles of equivalent size, augered cast in place (ACIP) piles can be installed more rapidly with relatively less disturbance to the surroundings in favorable geological conditions. Hence the installation procedure and the quality of the material used in the construction have significant effects on the behavior of the ACIP piles. Construction quality can be monitored using the automated monitoring system where the volume of grout pumped and the pressures are monitored with depth. Also the maximum and minimum pressure required to advance the auger was monitored with time. All these data can be used to control the quality of the pile installation. The grout used in the construction of ACIP piles is rich in cement and it is critical to monitor the curing of the pile with time in order to determine the development of residual strains in the pile and to determine the appropriate time for load testing the pile.
A fair number of theoretical and empirical methods for analyzing load-displacement behavior have been proposed for the various types of deep foundations. These methods, however, seem not to be widely used in engineering practice mainly because the input data required is difficult to determine from the results of common site investigations. Since number of design procedures limit the deflection in deep foundation supporting load bearing structures, it is essential to predict the load-displacement behavior of piles based on the simple relationship of in-situ soil properties and dimensions of the pile. Drilled shafts are used increasingly as foundations to support bridges and other transportation structures in many geographical areas in the U.S., where rock lies near the ground surface. Drilled shafts are constructed by excavating into the rock, forming a cylindrical socket, and constructing the socket with reinforced concrete. In general, clay shale rocks can be cemented, uncemented and/or with seams of bentonite or calcareous materials. Designing of the drilled shafts socketed in uncemented clay shale and weakly cemented sandstone is a challenge partly because only limited information is available in the literature on the ultimate unit side resistance and ultimate unit end bearing in soft rocks.
Recent advances in deep foundation engineering in North America are as follows:
• Full-scale testing, instrumentation (including Osterberg cell) and long-term monitoring of large diameter piles and pile groups (Rollins et al. 2004, Moon 2004, Paikowsky et al. 2005, Vipulanandan et al. 2005c, Fellenius, B.H. 2006, Vipulanandan et al. 2007a)
2
Proceedings CIGMAT-2007 Conference & Exhibition
• Modeling the load-displacement behavior of piles (Kulhawy & Chen 2005, Vipulanandan et al. 2005a)
• Lateral behavior of piles and pile groups under static and seismic loading conditions (Rollins, 2003. Anderson et al. 2003, Ashour & Norris 2003, Ashour et al. 2004, Rollins et al. 2004)
• Behavior of rock socketed drilled shafts and augered cast-in-place piles (Kulhawy et al. 2005, Vipulanandan et al. 2005b, Vipulanandan et al. 2007b)
• Correlation between piles parameters and in-situ test methods (Samtani and Liu 2005, Vipulanandan & Kaulgud 2005a)
• Construction monitoring and pile materials (Iskander et al. 2001, Brown 2005; Brettmann & NeSmith 2005, Vipulanandan et al. 2007a)
• Nondestructive evaluation of piles (Hussain & Liking 2005) • Reliability based design for piles (Kulhawy & Phoon 2002) • Numerical modeling of pile and pile group behavior (Duncan et al. 2005,
Sellountou et al. 2005, Tand & Vipulanandan 2005) The overall objective of this paper was to highlight some of the advances in deep foundations in North America in recent years. ACIP PILES ACIP piles are becoming popular in both private and public sectors due to their rapid construction and environmentally friendly installation. Due to lack of design methods it was important to load test selected number of piles to verify the designed capacity and deflection in the pile. In recent years over 50 load tests have be performed on ACIP piles, as documented in the literature, with diameters in the range of 300 to 760 mm. Pile Instrumentation
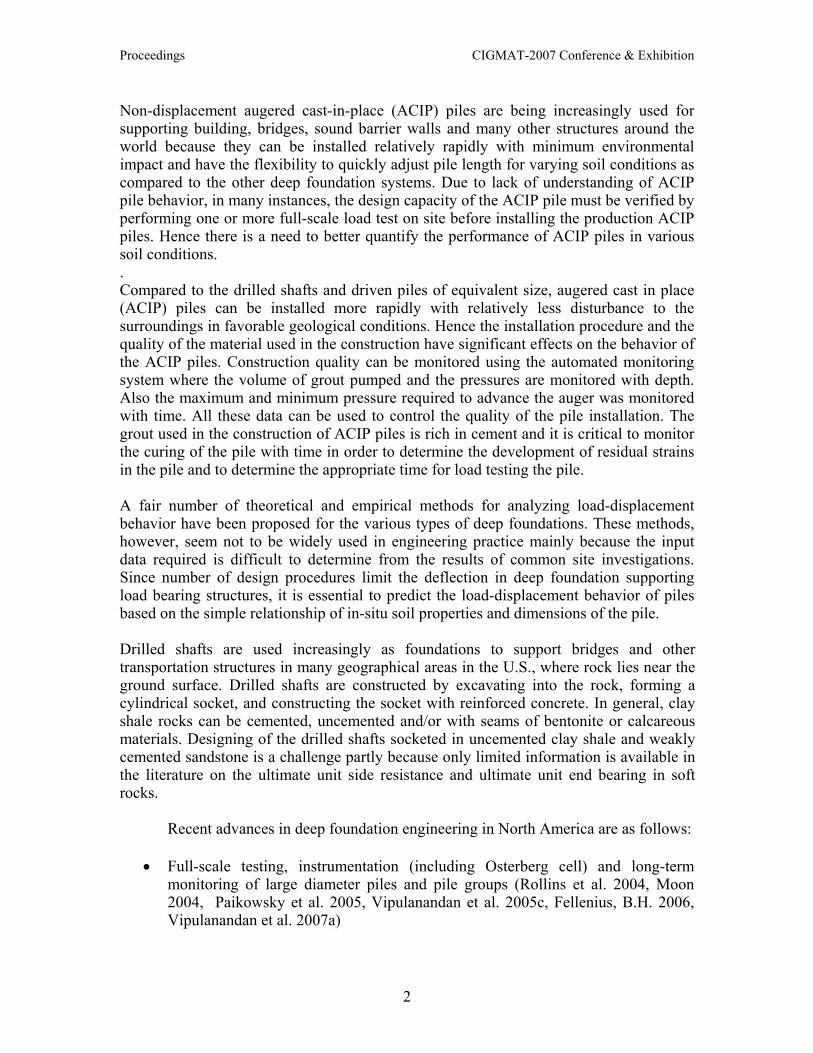
In a recent study in central Texas, two 760 mm diameter ACIP piles, one socketed into very dense sand and the socketed into very hard clay, were instrumented to investigate the curing process and load distribution in the pile during the static load tests (Vipulanandan et al. 2007a). The monitoring of the grout curing process was important determine the earliest time for the static load test the ACIP piles. The vibrating wire strain gages were attached to the steel reinforcing cage and lowered into the grout filled bore hole to measure the temperature and strains at various locations in the pile. Total of 10 gages were installed axially at four different levels along the pile. Besides this, 2 strain gages were installed horizontally at two different locations. Because the strain gages had their sensors at the center of the vibrating wire strain gages, readings taken from these gages were from the center of the pile cross section. Instrumentation used in this pile can be seen in Figure 1 (Vipulanandan et al. 2007a).
.
3
Proceedings CIGMAT-2007 Conference & Exhibition
TCP
(Level 1)
(Top Hor.)
(Level 2)
(Level 3)
(Bott. Hor.)
(Level 4)
Figure 1. Instrumentation used in an ACIP pile and the geotechnical profile.
4
Proceedings CIGMAT-2007 Conference & Exhibition
Construction Monitoring
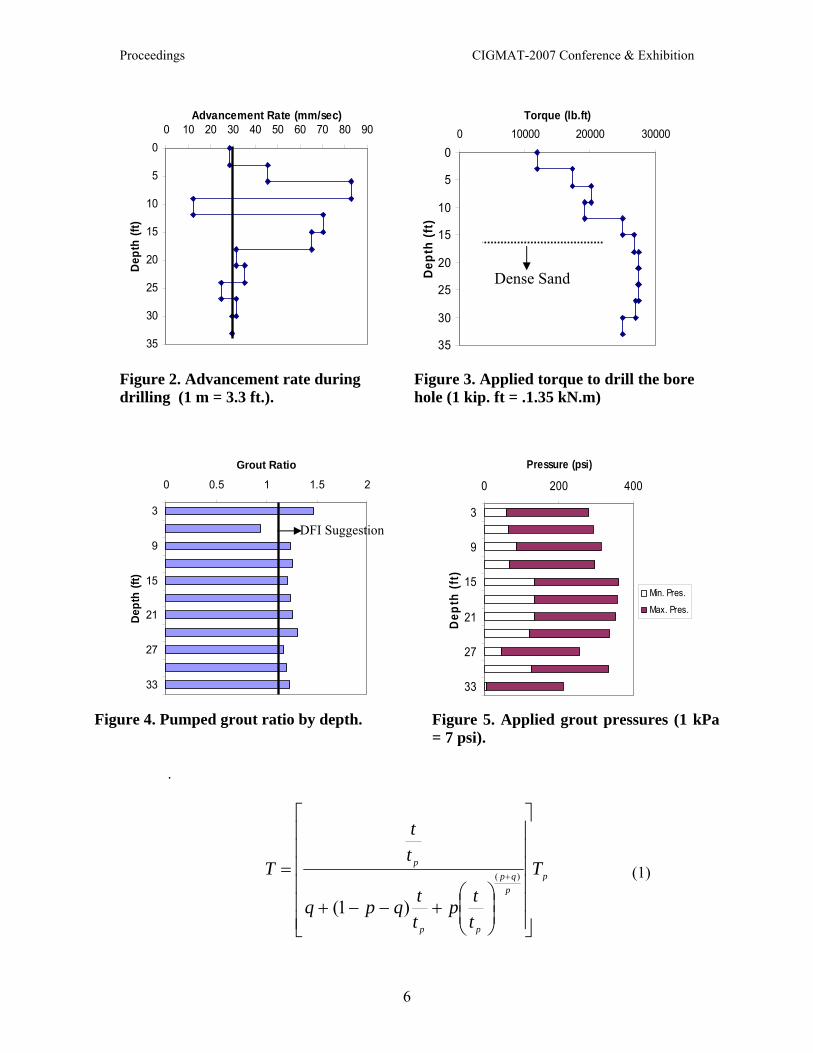
One of the key concerns when using ACIP (also known as Continuous Flight Auger -CFA) piles is that the soil surrounding the pile not be decompressed during drilling. If the velocity of penetration is less than the critical velocity, decompression can occur. In fact, decompression can occur even if the above condition is satisfied, if the soil being excavated is water-bearing sand with sufficient ground-water head to force the cuttings up the auger. A contractor must provide a drilling rig with sufficient torque and crowd to obtain the required velocity of penetration. This critical rate of penetration of the auger used was found to be 30 mm/sec with an auger revolution of 5 rpm which was held nearly constant during the drilling and the critical velocity is shown in Figure 2, and this condition was satisfied (Vipulanandan et al. 2007a). The drill rig used was capable to drill loose to very dense sand layers (Manufacturer’s specification). Drill rig gearbox had a maximum torque of 50 kN.m (36,000 ft-lb.) and 4.45 kN (5000 lb.) total crowd. It can be observed (Figure 3) that the required torque for deepest layer augured was more than twice the top layer. It can be concluded that the TCP test data (TxDOT Geotechnical Manual, 2000) are in good agreement with the required torque values in terms of penetration resistance of the soil layers. Required torque to drill the soil increased significantly at approximately 4.6 m (15 ft) depth which was also the starting depth for the dense sand according to the TCP test.
Pile integrity may be the most important aspect of the quality control item in a ACIP pile installation. It can directly affect the structural capacity of the pile or the soil resistance around the pile. The ratio of the actual volume of grout pumped to the theoretical volume of the pile is defined as the grout ratio. Minimum ratio suggested by the Deep foundation Institute is 1.15 (DFI 1994) which means 15 % extra volume is required in addition to the nominal volume of the borehole. Pumped grout volume was measured for every 1m (3 ft) withdrawal which was considered accurate enough to assure pile integrity. Figure 4 shows that the 1.15 grout ratio condition was satisfied at every depth except between 1-2 m (3-6 ft.) Grout ratio was 0.94 at this interval and not considered a problem since about 2.5 m (8 ft.) of grout head was used in the bore hole. The successfully performed pile load test after 7 days also proved that this was not a problem. Figure 5 shows the minimum and maximum grouting pressure measured during the grouting phase. The grout pressure level is important to prevent any soil collapse during the withdrawal of the auger. Maximum grout pressure was held almost constant and was around 1380 kN/mP
2P (200 psi). Minimum grout pressure was fluctuating along
the depth. The average minimum pressure was higher at deeper levels due to the higher soil confinement.
Curing
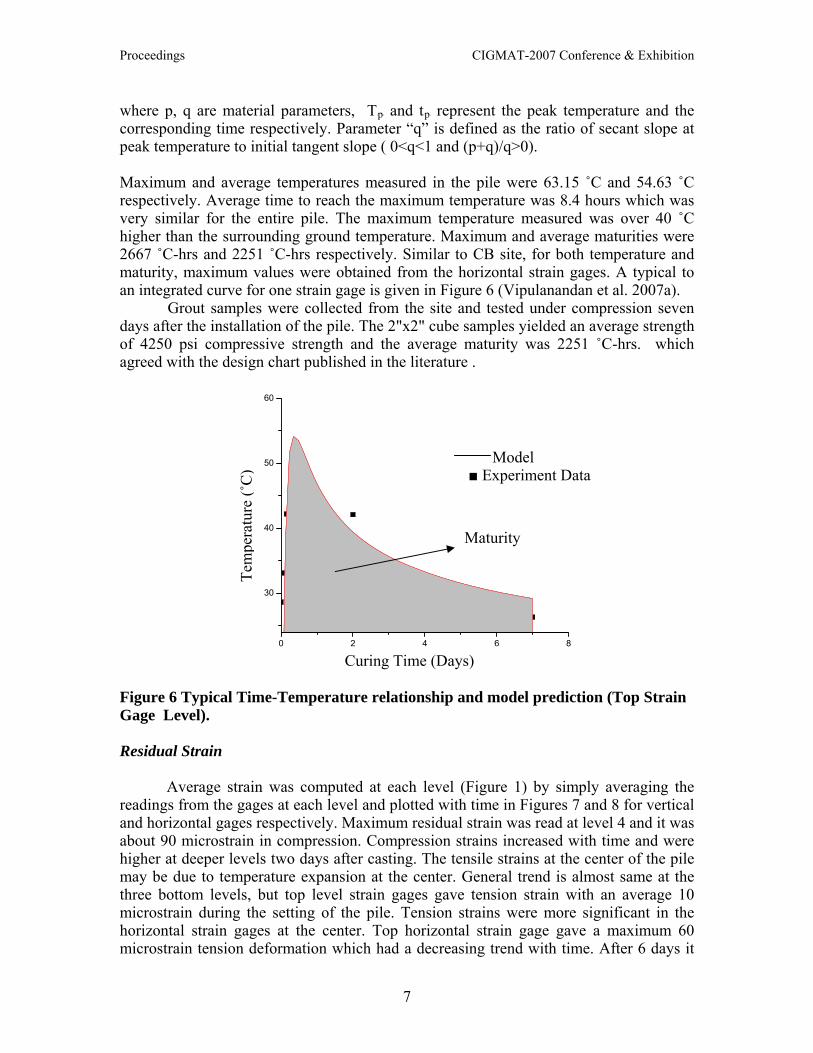
The Temperature readings with time are used to evaluate the strength gain of the grout. This technique is called the maturity method assumes that the strength is dependent both on temperature and time. In this study the temperature was measured four times over a period of 7 days. Hence a nonlinear relationship was used to best approximate the temperature-time relationship (Eqn. 1). Integration the temperature-time relationship will give the maturity. A typical integrated curve for a vibrating strain gage is given in Figure 6.
5
Proceedings CIGMAT-2007 Conference & Exhibition
0
5
10
15
20
25
30
35
0 10 20 30 40 50 60 70 80 90Advancement Rate (mm/sec)
Dept
h (ft
)
Figure 2. Advancement rate during drilling (1 m = 3.3 ft.).
0
5
10
15
20
25
30
35
0 10000 20000 30000Torque (lb.ft)
Dep
th (f
t)
Figure 3. Applied torque to drill the bore hole (1 kip. ft = .1.35 kN.m)
0 0.5 1 1.5 2
3
9
15
21
27
33
Dept
h (ft
)
Grout Ratio
Figure 4. Pumped grout ratio by depth.
0 200 400
3
9
15
21
27
33
Dep
th (f
t)Pressure (psi)
Min. Pres.
Max. Pres.
Figure 5. Applied grout pressures (1 kPa = 7 psi).
.
pp
qp
pp
p T
ttp
ttqpq
tt
T
⎥⎥⎥⎥⎥⎥
⎦
⎤
⎢⎢⎢⎢⎢⎢
⎣
⎡
⎟⎟⎠
⎞⎜⎜⎝
⎛+−−+
= + )(
)1(
DFI Suggestion
(1)
Dense Sand
6
Proceedings CIGMAT-2007 Conference & Exhibition
where p, q are material parameters, TBpB and tBpB represent the peak temperature and the corresponding time respectively. Parameter “q” is defined as the ratio of secant slope at peak temperature to initial tangent slope ( 0<q<1 and (p+q)/q>0). Maximum and average temperatures measured in the pile were 63.15 ˚C and 54.63 ˚C respectively. Average time to reach the maximum temperature was 8.4 hours which was very similar for the entire pile. The maximum temperature measured was over 40 ˚C higher than the surrounding ground temperature. Maximum and average maturities were 2667 ˚C-hrs and 2251 ˚C-hrs respectively. Similar to CB site, for both temperature and maturity, maximum values were obtained from the horizontal strain gages. A typical to an integrated curve for one strain gage is given in Figure 6 (Vipulanandan et al. 2007a).
Grout samples were collected from the site and tested under compression seven days after the installation of the pile. The 2"x2" cube samples yielded an average strength of 4250 psi compressive strength and the average maturity was 2251 ˚C-hrs. which agreed with the design chart published in the literature .
0 2 4 6
30
40
50
60
8
Model ■ Experiment Data
Tem
pera
ture
Tem
pera
ture
(˚C
)
Time (days)
Maturity
Curing Time (Days)
Figure 6 Typical Time-Temperature relationship and model prediction (Top Strain Gage Level).
Residual Strain
Average strain was computed at each level (Figure 1) by simply averaging the readings from the gages at each level and plotted with time in Figures 7 and 8 for vertical and horizontal gages respectively. Maximum residual strain was read at level 4 and it was about 90 microstrain in compression. Compression strains increased with time and were higher at deeper levels two days after casting. The tensile strains at the center of the pile may be due to temperature expansion at the center. General trend is almost same at the three bottom levels, but top level strain gages gave tension strain with an average 10 microstrain during the setting of the pile. Tension strains were more significant in the horizontal strain gages at the center. Top horizontal strain gage gave a maximum 60 microstrain tension deformation which had a decreasing trend with time. After 6 days it
7

Proceedings CIGMAT-2007 Conference & Exhibition
showed lower compression strains. Bottom horizontal strain gage behavior was more like top level vertical strain gages which were tension strain in the first two days then compression with a maximum value of 40 microstrain at the end of the seven days. The residual vertical strain in the pile after 7 days of curing was compressive and increased with depth from 40 to 80 microstrains.
-100
-80
-60
-40
-20
0
20
0 1 2 3 4 5 6 7 8
Curing Time (Days)
Mic
rost
rain Level 1
Level 2Level 3Level 4
Figure 7. Variation of vertical strain at different levels with time.
-60
-40
-20
0
20
40
60
80
0 1 2 3 4 5 6 7 8
Curing Time (Days)
Mic
rost
rain Top Hor.
Bott. Hor.
Figure 8. Variation of horizontal strain at different levels with time.
Grout Tests Quality of the grout was evaluated in the field using the flow cone method and flow cylinder method.Some grout mixes had problem with the flow cone method sine the opening was limited to 19 mm. Cube and cylindrical samples were collected to mesure the strength at specified tme periods (Vipiulanandan et al. 2007a). Load Test
8
Proceedings CIGMAT-2007 Conference & Exhibition
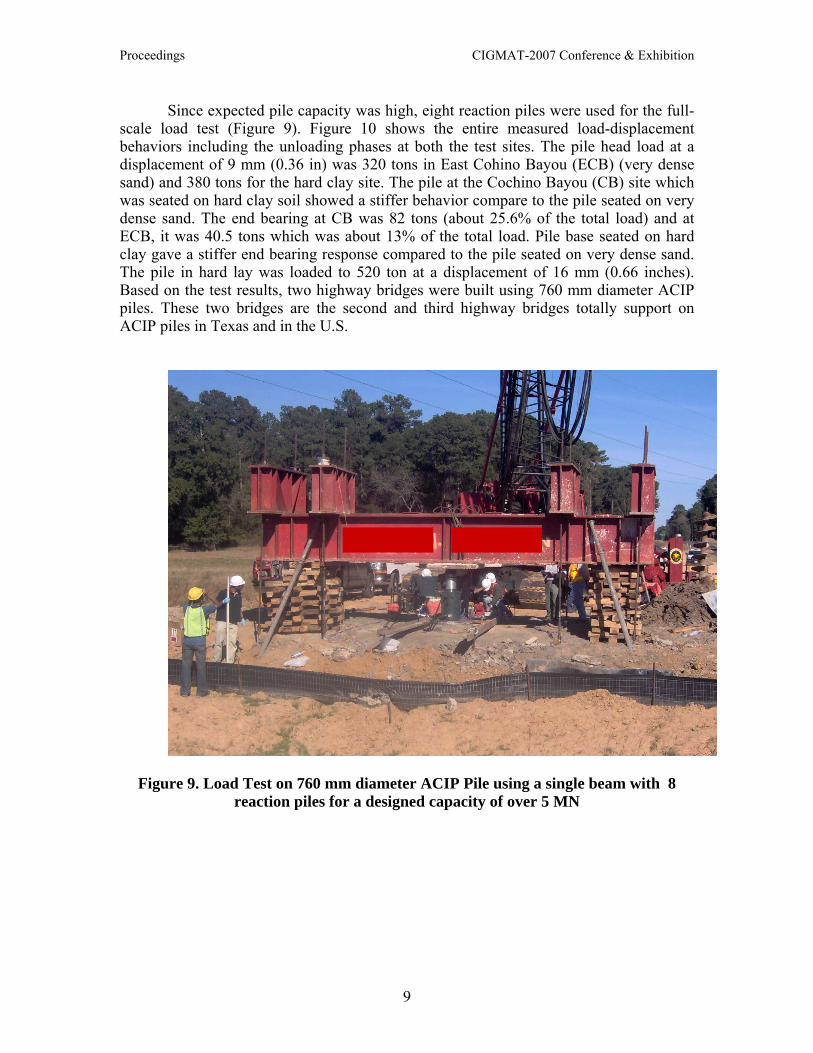
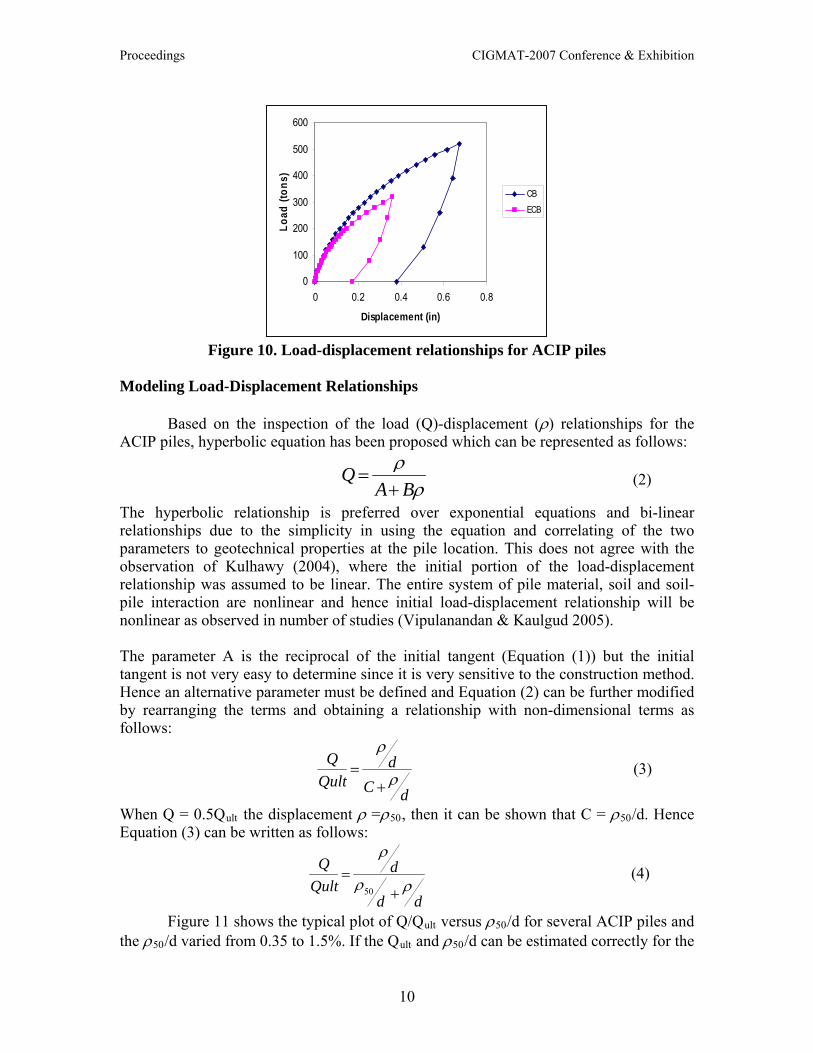
Since expected pile capacity was high, eight reaction piles were used for the full-scale load test (Figure 9). Figure 10 shows the entire measured load-displacement behaviors including the unloading phases at both the test sites. The pile head load at a displacement of 9 mm (0.36 in) was 320 tons in East Cohino Bayou (ECB) (very dense sand) and 380 tons for the hard clay site. The pile at the Cochino Bayou (CB) site which was seated on hard clay soil showed a stiffer behavior compare to the pile seated on very dense sand. The end bearing at CB was 82 tons (about 25.6% of the total load) and at ECB, it was 40.5 tons which was about 13% of the total load. Pile base seated on hard clay gave a stiffer end bearing response compared to the pile seated on very dense sand. The pile in hard lay was loaded to 520 ton at a displacement of 16 mm (0.66 inches). Based on the test results, two highway bridges were built using 760 mm diameter ACIP piles. These two bridges are the second and third highway bridges totally support on ACIP piles in Texas and in the U.S.
Figure 9. Load Test on 760 mm diameter ACIP Pile using a single beam with 8 reaction piles for a designed capacity of over 5 MN
9
Proceedings CIGMAT-2007 Conference & Exhibition
0
100
200
300
400
500
600
0 0.2 0.4 0.6 0.8
Displacement (in)
Load
(ton
s)
CB
ECB
Figure 10. Load-displacement relationships for ACIP piles
Modeling Load-Displacement Relationships Based on the inspection of the load (Q)-displacement (ρ) relationships for the ACIP piles, hyperbolic equation has been proposed which can be represented as follows:
ρρBA
Q+
= (2)
The hyperbolic relationship is preferred over exponential equations and bi-linear relationships due to the simplicity in using the equation and correlating of the two parameters to geotechnical properties at the pile location. This does not agree with the observation of Kulhawy (2004), where the initial portion of the load-displacement relationship was assumed to be linear. The entire system of pile material, soil and soil-pile interaction are nonlinear and hence initial load-displacement relationship will be nonlinear as observed in number of studies (Vipulanandan & Kaulgud 2005). The parameter A is the reciprocal of the initial tangent (Equation (1)) but the initial tangent is not very easy to determine since it is very sensitive to the construction method. Hence an alternative parameter must be defined and Equation (2) can be further modified by rearranging the terms and obtaining a relationship with non-dimensional terms as follows:
dCd
QultQ
ρ
ρ
+= (3)
When Q = 0.5QBultB the displacement ρ =ρB50B, then it can be shown that C = ρB50B/d. Hence Equation (3) can be written as follows:
dd
dQult
Qρρ
ρ
+=
50
(4)
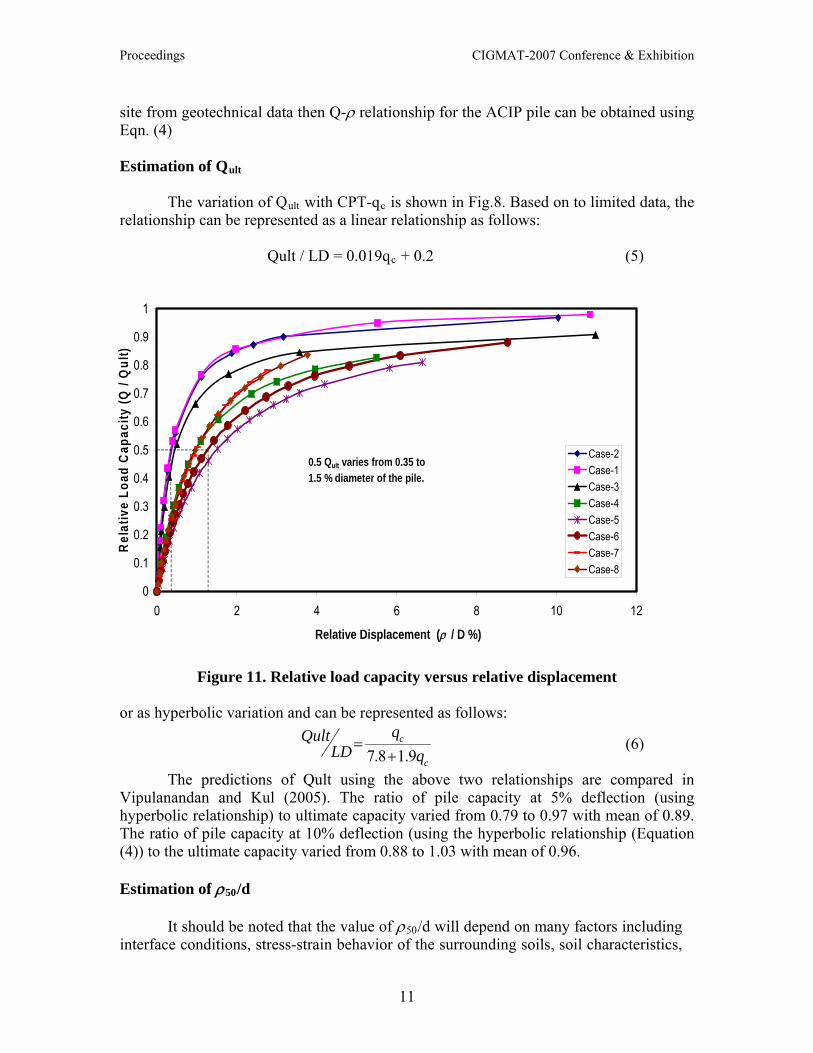
Figure 11 shows the typical plot of Q/QBultB versus ρB50B/d for several ACIP piles and the ρB50B/d varied from 0.35 to 1.5%. If the QBultB and ρB50B/d can be estimated correctly for the
10
Proceedings CIGMAT-2007 Conference & Exhibition
site from geotechnical data then Q-ρ relationship for the ACIP pile can be obtained using Eqn. (4)
Estimation of QBultB
The variation of QBultB with CPT-qBcB is shown in Fig.8. Based on to limited data, the relationship can be represented as a linear relationship as follows: Qult / LD = 0.019qBcB + 0.2 (5)
0
0.1
0.2
0.3
0.4
0.5
0.6
0.7
0.8
0.9
1
0 2 4 6 8 10
Relative Displacement (ρ / D %)
Rel
ativ
e Lo
ad C
apac
ity (Q
/ Q
ult)
12
Case-2Case-1Case-3Case-4Case-5Case-6Case-7Case-8
0.5 Qult varies from 0.35 to 1.5 % diameter of the pile.
Figure 11. Relative load capacity versus relative displacement
or as hyperbolic variation and can be represented as follows:
c
c
LDQult
9.18.7 += (6)
The predictions of Qult using the above two relationships are compared in Vipulanandan and Kul (2005). The ratio of pile capacity at 5% deflection (using hyperbolic relationship) to ultimate capacity varied from 0.79 to 0.97 with mean of 0.89. The ratio of pile capacity at 10% deflection (using the hyperbolic relationship (Equation (4)) to the ultimate capacity varied from 0.88 to 1.03 with mean of 0.96. Estimation of ρB50B/d It should be noted that the value of ρB50B/d will depend on many factors including interface conditions, stress-strain behavior of the surrounding soils, soil characteristics,
11
Proceedings CIGMAT-2007 Conference & Exhibition
in-situ stresses in the ground, construction methods and loading procedures. For the ACIP piles investigated in this study, ρB50B/d varied from 0.35% to 1.5%. The variation of ρB50B/d with CPT-qBcB and friction ratio was investigated. Of the two CPT parameters investigated, better correlation was observed with friction ratio and the relationship is as follows:
c
sq
fd015.0%50 =ρ (7)
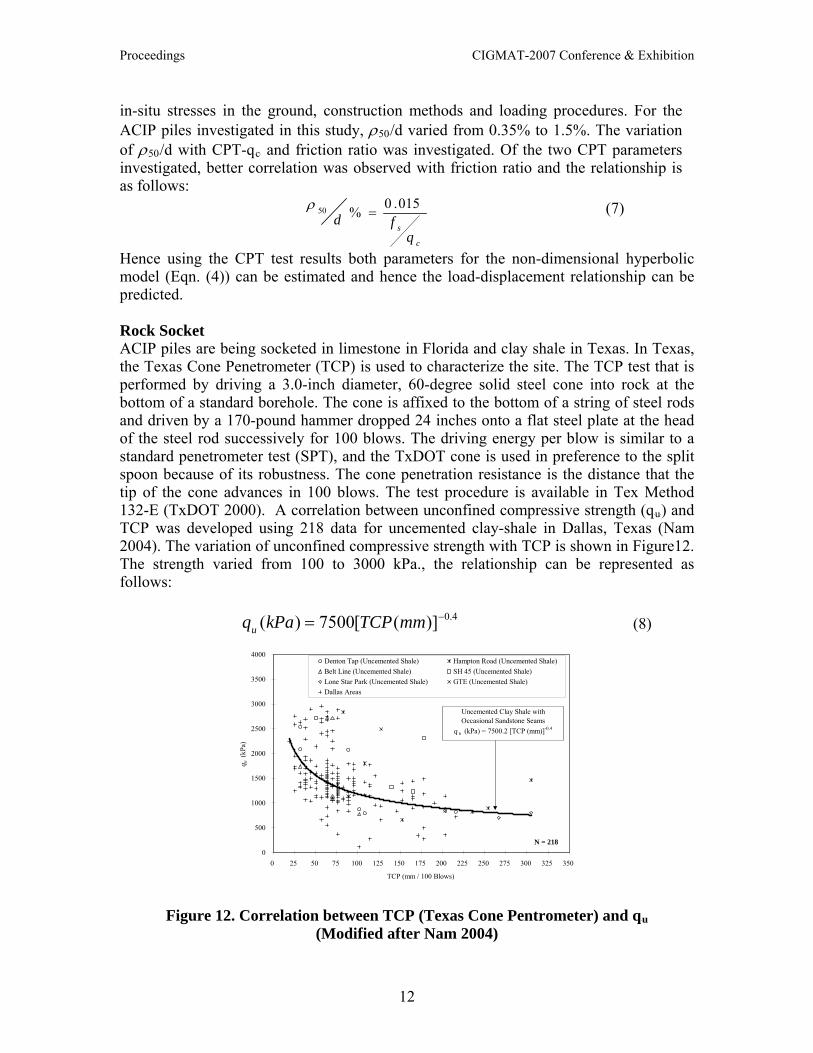
Hence using the CPT test results both parameters for the non-dimensional hyperbolic model (Eqn. (4)) can be estimated and hence the load-displacement relationship can be predicted. Rock Socket ACIP piles are being socketed in limestone in Florida and clay shale in Texas. In Texas, the Texas Cone Penetrometer (TCP) is used to characterize the site. The TCP test that is performed by driving a 3.0-inch diameter, 60-degree solid steel cone into rock at the bottom of a standard borehole. The cone is affixed to the bottom of a string of steel rods and driven by a 170-pound hammer dropped 24 inches onto a flat steel plate at the head of the steel rod successively for 100 blows. The driving energy per blow is similar to a standard penetrometer test (SPT), and the TxDOT cone is used in preference to the split spoon because of its robustness. The cone penetration resistance is the distance that the tip of the cone advances in 100 blows. The test procedure is available in Tex Method 132-E (TxDOT 2000). A correlation between unconfined compressive strength (qBuB) and TCP was developed using 218 data for uncemented clay-shale in Dallas, Texas (Nam 2004). The variation of unconfined compressive strength with TCP is shown in Figure12. The strength varied from 100 to 3000 kPa., the relationship can be represented as follows: (8) 4.0)]([7500)( −= mmTCPkPaqu
0
500
1000
1500
2000
2500
3000
3500
4000
0 25 50 75 100 125 150 175 200 225 250 275 300 325 350
TCP (mm / 100 Blows)
q u (k
Pa)
Denton Tap (Uncemented Shale) Hampton Road (Uncemented Shale)Belt Line (Uncemented Shale) SH 45 (Uncemented Shale)Lone Star Park (Uncemented Shale) GTE (Uncemented Shale)Dallas Areas
Uncemented Clay Shale with Occasional Sandstone Seams
q u (kPa) = 7500.2 [TCP (mm)]-0.4
N = 218
Figure 12. Correlation between TCP (Texas Cone Pentrometer) and qBu
(Modified after Nam 2004)
12
Proceedings CIGMAT-2007 Conference & Exhibition
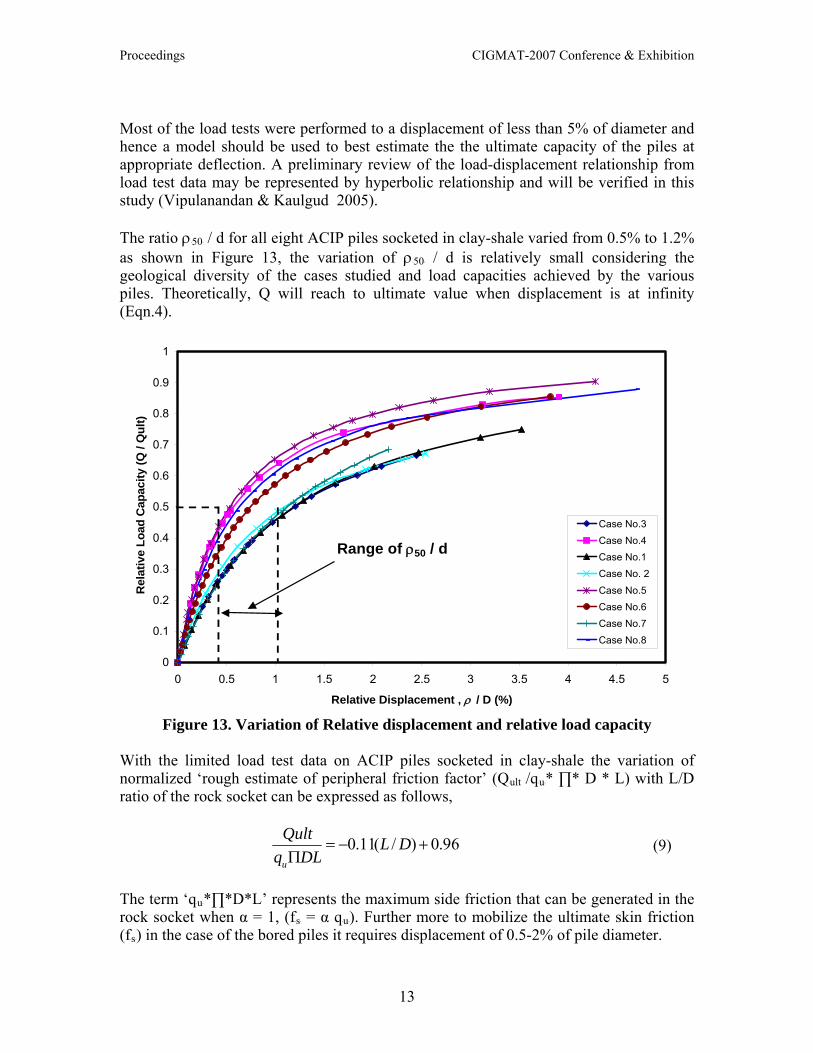
Most of the load tests were performed to a displacement of less than 5% of diameter and hence a model should be used to best estimate the the ultimate capacity of the piles at appropriate deflection. A preliminary review of the load-displacement relationship from load test data may be represented by hyperbolic relationship and will be verified in this study (Vipulanandan & Kaulgud 2005). The ratio ρB50B / d for all eight ACIP piles socketed in clay-shale varied from 0.5% to 1.2% as shown in Figure 13, the variation of ρB50B / d is relatively small considering the geological diversity of the cases studied and load capacities achieved by the various piles. Theoretically, Q will reach to ultimate value when displacement is at infinity (Eqn.4).
0
0.1
0.2
0.3
0.4
0.5
0.6
0.7
0.8
0.9
1
0 0.5 1 1.5 2 2.5 3 3.5 4 4.5 5
Relative Displacement , ρ / D (%)
Rel
ativ
e Lo
ad C
apac
ity (Q
/ Q
ult)
Case No.3Case No.4Case No.1Case No. 2
Case No.5Case No.6Case No.7Case No.8
Range of ρ50 / d
Figure 13. Variation of Relative displacement and relative load capacity With the limited load test data on ACIP piles socketed in clay-shale the variation of normalized ‘rough estimate of peripheral friction factor’ (QBult B/qBuB* ∏* D * L) with L/D ratio of the rock socket can be expressed as follows,
96.0)/(11.0 +−=Π
DLDLq
Qult
u
(9)
The term ‘qBuB*∏*D*L’ represents the maximum side friction that can be generated in the rock socket when α = 1, (fBsB = α qBuB). Further more to mobilize the ultimate skin friction (fBsB) in the case of the bored piles it requires displacement of 0.5-2% of pile diameter.
13
Proceedings CIGMAT-2007 Conference & Exhibition
The variation of Qult with TCP can be represented as follows,
TCPLD
Qult 99216= (10)
By knowing in-situ TCP penetration resistance (per 100 blows) and assuming the length and diameter of pile, Eqn. 10 can be used to determine the Qult. The variation of ρB50B/d with qBu Bcan be expressed as follows,
Atm
uP
qd
1
508.15/ =ρ (11)
Hence both parameters for the non-dimensional hyperbolic model can be estimated from the rock strength, TCP and pile dimensions. DRILLED SHAFTS
Rock Socket
In order to understand the load transfer within the rock socket, studies are being performed using Osterberg Load cell and other instruments. During a load test, the strain distribution along the socket was measured using the sister bars. The Osterberg Cell was used to measure the load. Forty-eight (48) days after constructing the test sockets, axial load was applied to the rock socketed drilled shaft in 11.2-ton increments every five minutes until the plunging failure was observed. It was clear that both the test and reaction sockets reached plunging failure at a load of 303.5 tons. The maximum load for the test socket was determined to be about 281 tons at the upward movement of 0.4 inches and downward movement of 2.4 inches by taking double tangent lines. Based on the test data, load transfer distributions were obtained along the shaft and socket.
From this information the distribution of maximum side resistance and base
resistance were
14

Proceedings CIGMAT-2007 Conference & Exhibition
Figure 14. Osterberg Cell used in rock socket test
determined using the measured qualities. The corresponding side and base deflections were measured at the top plate and bottom plate of the Osterberg Cell.. Also, the unit side load transfer curves, the so-called “f-w” curves, were developed according to the O’Neill and Reese method (1999). The locations for developing the f-w curves were at the middle of the test and reaction shafts. The local displacement w at the middle of the shafts was determined by subtracting the elastic shaft shortening from the measured displacement at the Osterberg Cell (Moon 2004).
-6
-4
-2
0
2
4
0 120 240 360
Upward MovementDownward Movement
Osterberg Cell Load (tons)
Mov
emen
ts (i
nche
s)
Dow
nwar
dU
pwar
d
Figure 15. Upward and Downward Movements versus Load (Osterberg
Cell ) at the Test Site ( 1 ton = 10 MN; 1 inch = 25 mm)
15
Proceedings CIGMAT-2007 Conference & Exhibition
Bearing Capacity in Soft Rock
Drilled shafts are frequently used as foundations to support bridges and other transportation structures in many geographical areas around the world, where rock lies near the ground surface. Drilled shafts are constructed by excavating into the very soft rock, forming a cylindrical socket, and constructing the socket with reinforced concrete. Designing of drilled shafts socketed in soft rock (compressive strength less than 2.5 MPa) is a challenge partly because only limited information is available in the literature on the ultimate unit end bearing in soft rocks.
A total of 21 documented cases were used to develop the relationship between the ultimate unit end bearing (qBultB) and the unconfined compressive strength of soft rock (qBuB, unconfined compressive strength less than 2.5 MPa. The CASES are summarized in Table 1, with information on test location, type of rock, date of test, shaft geometry, rock strength and ultimate unit end bearing capacity. (i) Ultimate Unit End Resistance ( qBultB)
The unconfined compressive strength of soft rocks in which the load tests were performed varied from 1.44 tsf (0.14 MPa) to 26 tsf (2.5 MPa).the ultimate unit end bearing varied from 10 tsf (0.96 MPa) to 96 tsf (9.2 MPa).The ratio of B BqBultB-to-qBuB varied from 2.39 to 19.82 with an average of 5.71.
Past studies have investigated the relationship betweenB BqBultB and unconfined compressive strength (qBuB) of soft rocks. The relationship generally used is as follows:
qBultB = αBqB (qBuB)P
mP (12)
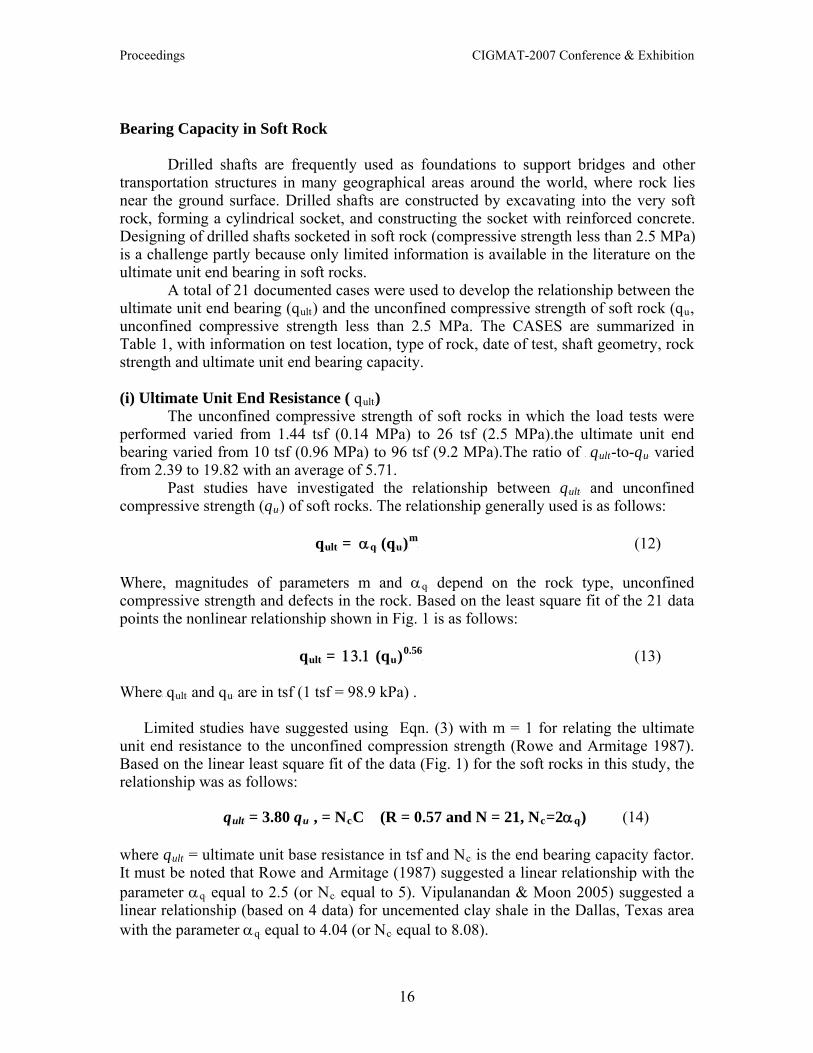
Where, magnitudes of parameters m and αBqB depend on the rock type, unconfined compressive strength and defects in the rock. Based on the least square fit of the 21 data points the nonlinear relationship shown in Fig. 1 is as follows:
qBultB = 13.1 (qBuB)P
0.56P (13)
WhereB BqBultB and qBuB are in tsf (1 tsf = 98.9 kPa) .
Limited studies have suggested using Eqn. (3) with m = 1 for relating the ultimate
unit end resistance to the unconfined compression strength (Rowe and Armitage 1987). Based on the linear least square fit of the data (Fig. 1) for the soft rocks in this study, the relationship was as follows:
qBultB = 3.80 qBuB , = NBcBC (R = 0.57 and N = 21, NBcB=2αBqB) (14)
where qBultB = ultimate unit base resistance in tsf and NBcB is the end bearing capacity factor. It must be noted that Rowe and Armitage (1987) suggested a linear relationship with the parameter αBqB equal to 2.5 (or NBcB equal to 5). Vipulanandan & Moon 2005) suggested a linear relationship (based on 4 data) for uncemented clay shale in the Dallas, Texas area with the parameter αBqB equal to 4.04 (or NBcB equal to 8.08).
16
Proceedings CIGMAT-2007 Conference & Exhibition
Field Data vs. PLAXIS estimation
qult= 3.56qu
(PLAXIS)
qult = 3.8qu
(Field Data)
qult = 15.25qu0.51
(Zhang et. al.)
qult = 13.1qu0.56
(21 Field Data, Power fit)
0
20
40
60
80
100
120
0 10 20 30 40Unconfined compressive strength,qu (tsf)
Ulti
mat
e un
it en
d be
arin
g ca
paci
ty
q ult (
tsf)
Denton Tap, TX
Montopolis, TX
Montopolis, TX
Montopolis, TX
Dallas, TX
I-225, CO
County Line, CO
Mt. Pleasant, SC
Mt. Pleasant, SC
Leake County, SC
additional data
PLAXIS Result(E=2160 tsf, )Power, Zhang et. al.,1998
Figure 16. Experimental and numerical analyses relationships between qBultB and qBuB for soft rocks.
Core Hole Effect
Due to uncertainty in characterizing the soft rock below the bottom of the bore hole a number of states including Alabama, Colorado, Connecticut, Florida, Georgia, Hawaii Kansas and Texas require a core-hole length of 1.7 m (5 ft) beyond the bottom of the shaft. It is of interest to note that a few SDOTs such as Arizona and New York don’t have any recommendation regarding core-holes. Also no diameter for the core holes are specified, but in practice diameter of 50 mm (2 inch) or higher are used. A commercially available geotechnical finite element program (PLAXIS) was used to develop the FEM models (Vipulanandan et al. 2007b).
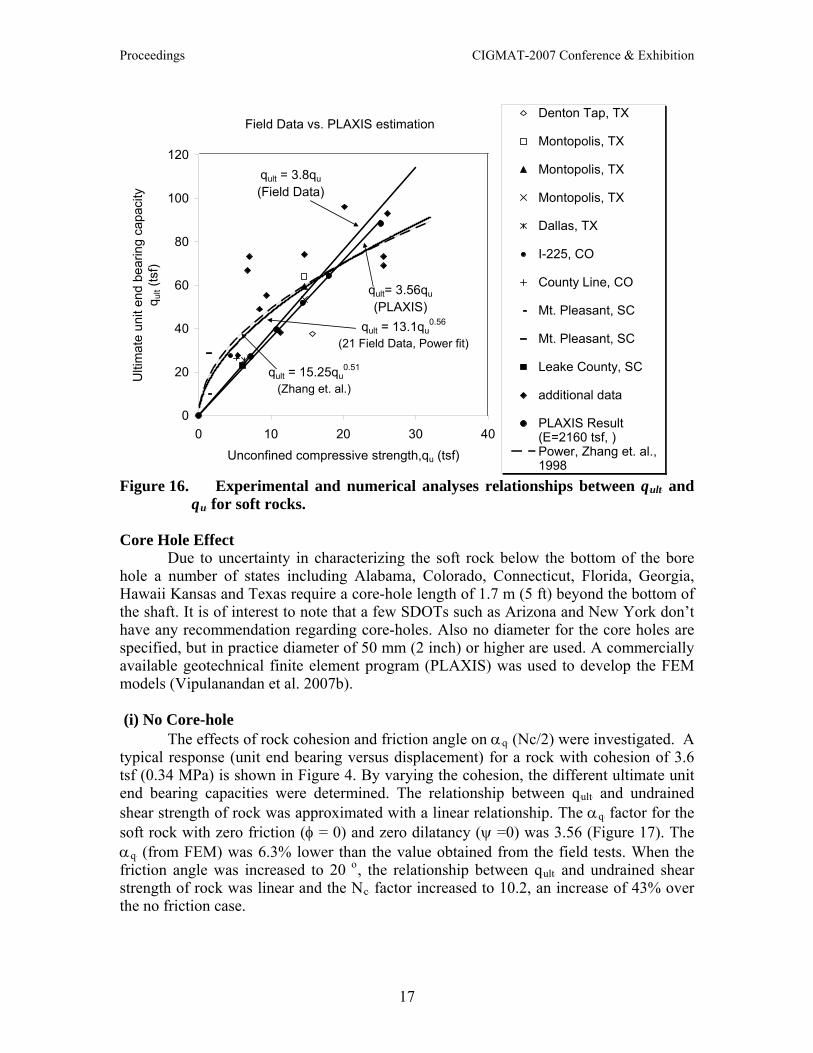
(i) No Core-hole The effects of rock cohesion and friction angle on αBqB (Nc/2) were investigated. A typical response (unit end bearing versus displacement) for a rock with cohesion of 3.6 tsf (0.34 MPa) is shown in Figure 4. By varying the cohesion, the different ultimate unit end bearing capacities were determined. The relationship between qBultB and undrained shear strength of rock was approximated with a linear relationship. The αBqB factor for the soft rock with zero friction (φ = 0) and zero dilatancy (ψ =0) was 3.56 (Figure 17). The αBqB (from FEM) was 6.3% lower than the value obtained from the field tests. When the friction angle was increased to 20P
oP, the relationship between qBultB and undrained shear
strength of rock was linear and the NBcB factor increased to 10.2, an increase of 43% over the no friction case.
17
Proceedings CIGMAT-2007 Conference & Exhibition
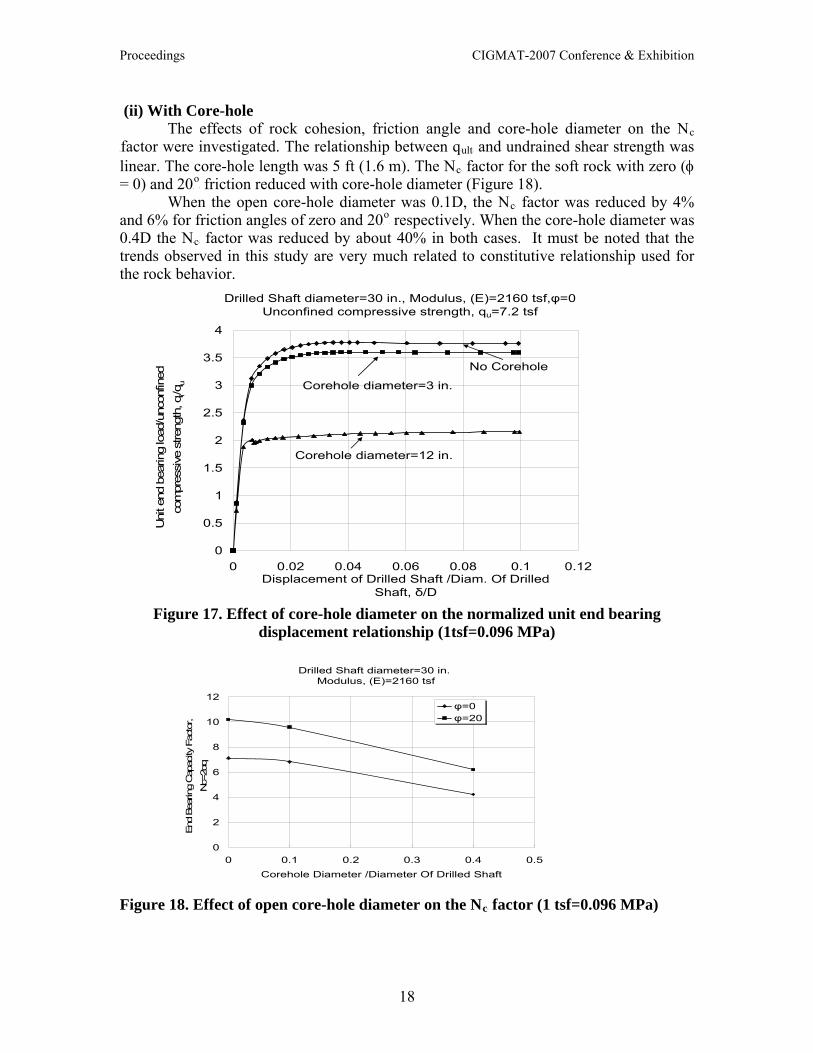
(ii) With Core-hole The effects of rock cohesion, friction angle and core-hole diameter on the NBc
Bfactor were investigated. The relationship between qBultB and undrained shear strength was linear. The core-hole length was 5 ft (1.6 m). The NBcB factor for the soft rock with zero (φ = 0) and 20P
oP friction reduced with core-hole diameter (Figure 18).
When the open core-hole diameter was 0.1D, the NBcB factor was reduced by 4% and 6% for friction angles of zero and 20P
oP respectively. When the core-hole diameter was
0.4D the NBcB factor was reduced by about 40% in both cases. It must be noted that the trends observed in this study are very much related to constitutive relationship used for the rock behavior.
Drilled Shaft diameter=30 in., Modulus, (E)=2160 tsf,φ=0 Unconfined compressive strength, qu=7.2 tsf
0
0.5
1
1.5
2
2.5
3
3.5
4
0 0.02 0.04 0.06 0.08 0.1 0.12Displacement of Drilled Shaft /Diam. Of Drilled
Shaft, δ/D
Uni
t end
bea
ring
load
/unc
onfin
ed
com
pres
sive
stre
ngth
, qi/q
u
Corehole diameter=12 in.
Corehole diameter=3 in.
No Corehole
Figure 17. Effect of core-hole diameter on the normalized unit end bearing displacement relationship (1tsf=0.096 MPa)
Drilled Shaft diameter=30 in.
Modulus, (E)=2160 tsf
0
2
4
6
8
10
12
0 0.1 0.2 0.3 0.4 0.5Corehole Diameter /Diameter Of Drilled Shaft
End
Bea
ring
Cap
acity
Fac
tor,
Nc=
2αq
φ=0φ=20
Figure 18. Effect of open core-hole diameter on the NBcB factor (1 tsf=0.096 MPa)
18
Proceedings CIGMAT-2007 Conference & Exhibition
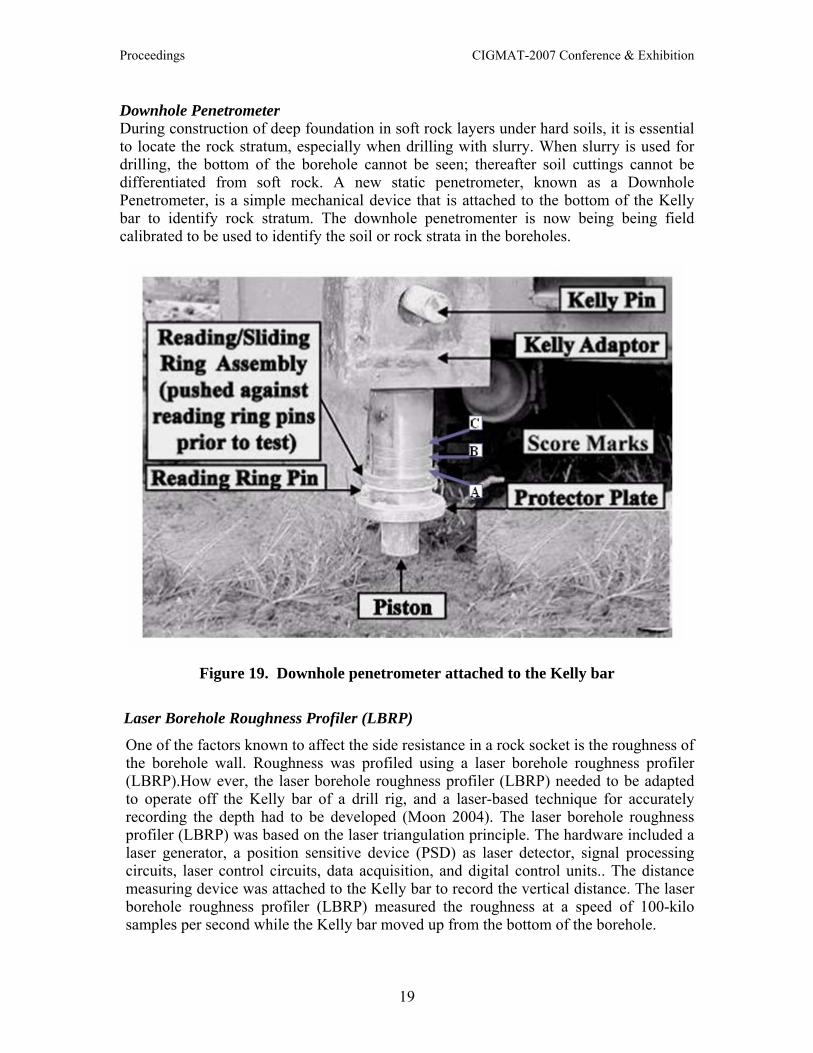
Downhole Penetrometer During construction of deep foundation in soft rock layers under hard soils, it is essential to locate the rock stratum, especially when drilling with slurry. When slurry is used for drilling, the bottom of the borehole cannot be seen; thereafter soil cuttings cannot be differentiated from soft rock. A new static penetrometer, known as a Downhole Penetrometer, is a simple mechanical device that is attached to the bottom of the Kelly bar to identify rock stratum. The downhole penetromenter is now being being field calibrated to be used to identify the soil or rock strata in the boreholes.
Figure 19. Downhole penetrometer attached to the Kelly bar
Laser Borehole Roughness Profiler (LBRP)
One of the factors known to affect the side resistance in a rock socket is the roughness of the borehole wall. Roughness was profiled using a laser borehole roughness profiler (LBRP).How ever, the laser borehole roughness profiler (LBRP) needed to be adapted to operate off the Kelly bar of a drill rig, and a laser-based technique for accurately recording the depth had to be developed (Moon 2004). The laser borehole roughness profiler (LBRP) was based on the laser triangulation principle. The hardware included a laser generator, a position sensitive device (PSD) as laser detector, signal processing circuits, laser control circuits, data acquisition, and digital control units.. The distance measuring device was attached to the Kelly bar to record the vertical distance. The laser borehole roughness profiler (LBRP) measured the roughness at a speed of 100-kilo samples per second while the Kelly bar moved up from the bottom of the borehole.
19

Proceedings CIGMAT-2007 Conference & Exhibition
Depth Encoder
Power Outlet
Laser Device
Data Acquisition Computer
Kelly Bar
Connection Box
Rocks or
IGM
Figure 20. Physical Arrangement of Laser Borehole Profiling System Hardware
The system was calibrated in the laboratory and found to have an accuracy of approximately 0.01 inches on both vertical distance and interface roughness (radial distance). It was then tested under field conditions and found to provide reasonable roughness profiles of a borehole. DRIVEN PILES Lateral Load Test on Pile Groups To improve the understanding of lateral resistance of pile group, a series of lateral load tests were performed on a full-scale pile group using static and dynamic loads. In the cyclic static pile group test, 9 steel pipe piles (610 mm diameter) spaced 3.0 pile diameters on centers, were placed in clay. The load was applied using two 1.3 MN hydraulic jacks. During the static test, load was cycled fifteen times to evaluate the drop in capacity under repeated loading and the formation of gap. The peak load typically reduced by 15% from the initial cycle to the final cycle. There was significant drop in resistance in the trailing row compared to the leading row. The dynamic load was applied using the Statnamic system which produced a lateral force up to 3.5 MN (345 tons) in about 15 seconds. Several combinations of static and dynamic loading conditions were investigated. When the dynamic loading followed the static loading,
20

Proceedings CIGMAT-2007 Conference & Exhibition
the dynamic lateral resistance was the same as the static resistance. In the cases when dynamic loading was applied before the static loading, the dynamic resistance was 30 to 60% higher than the static resistance. The group loading reduction effect were not significant during the dynamic loading as they were for the static loading (Rollins et al. 2004). Fiber-Reinforce Plastic (FRP) Piles The durability of concrete and corrosion of steel are serious hinderence in constructing in aggressive soil and waterfront environments. Composite piles are being used for waterfront barriers and bearing piles for light structures. Most composite piles are made of high density polyethylene with glass or steel reinforcement. Fiber-reinforced polymer (FRP) composite represents and alternative material without many of the durability disadvantages of traditional materials.But the driving of the piles can become a challenge because of the mechanical properties of the pile (Iskander et al. 2001). The recycled FRP piles can be a solution to the sustainable engineering concept that is becoming a popular approach. NONDESTRUCTIVE TESTS The quality of the deep foundations must be evaluated through various stages of construction and also monitored during it service life. Standardized nondestructive methods are being used more widely in evaluating the structural integrity and load capacity of ACIP piles, concrete piles, concrete filled steel pipe piles, steel piles and timber piles. The ASTM standards that are of relevance are as follows: ASTM D-5882 - Low-strain integrity testing; ASTM D-6760 – Cross-hole sonic logging; and ASTM D-4945 – Dynamic load testing. Extension of the basic methods is being investigated with improved instrumentation and time-dependent computational tools (Hussein and Likins 2005). Also wireless methods are being used for collecting and transmitting data. RELIABILITY DESIGN Load and Resistance Factor Design (LRFD) is being considered as an alternative design for the working or allowable stress design (WSD/ASD). The LRFD requires that all limit states to be checked using specific multiplier-factor format involving load and resistance factors. The LRFD is similar to the “Limit State Design” in Canada and the partial factor approach used in Europe, although a different multiple-factor format involving factored soil parameters is used. All these approaches primarily redistribute the original global factor of safety into separate load and resistance factors (or soil parameter partial factor). There is increasing interest in introducing more reliability based factors for loads, soil parameters, calculation models and factors of safety (Kulhawy and Phoon 2002)
21
Proceedings CIGMAT-2007 Conference & Exhibition
NUMERICAL MODELING Construction and Performance Construction processes are being modeled to better understand the changes in the ground stress conditions and its effect on the ultimate bearing capacity of ACIP piles (Sellountou et al. 2005). Load-displacement behavior of drilled shafts in slickenside clays were investigated using the finite element method. In this modeling, suction effect, slickenside clay behavior, soil strength, permeability and in-situ stress conditions were investigated (Tand and Vipulanandan, 2005). Laterally Loaded Group Piles Although p-y method, elastic continuum and finite element analysis are used for analysis of laterally loaded pile behavior new models are being developed to handle more complex ground conditions such as layered soils. The current version of Strain Wedge Method (SWM) programs allow consideration of the behavior of piles and shafts and the pile or shaft cap in layered soil taking into account the nonlinear material behavior of the pile as well as the soil and the development of the associated p-y curves including partial or full liquefaction in sand layers. AASHTO now recognizes SWM as an alternative to traditional p-y curve solutions (Ashour et al. 2004, Ashour & Norris 2003). Effect of pile head fixity on the behavior of laterally loaded piles has been investigated (Duncan et al. 2005). CONCLUSIONS Due to increasing demand for deep foundations to support larger and larger loads in unfavorable ground conditions there has been notable amount of growth in many areas has resulted in growth in many areas. Based on the information collected on the recent development in deep foundations in North America, following conclusions can be advanced: (1) Full-scale load tests are not only used to verify the load-displacement relationships
for various types of piles but also help understand the load transfer mechanisms based on the type of construction. Osterberg Load cells are increasingly used for load tests.
(2) Monitoring the important parameters (torque, rate of advance, grout pressure and volume and curing temperature) during the installation of the ACIP pile is critical to ensure quality. Flow cylinder and flow cone are being used to quantify the flow properties of the grout. Cubic and cylindrical specimens are used to determine the compressive strength of grout used in ACIP piles.
(3) Hyperbolic relationship can be used to represent the load-displacement behavior of ACIP piles in soils and in the rock socket. Model parameters have been related to the in-situ test parameters.
(4) Nondestructive tests methods are being increasingly used in determining the integrity and capacity of the piles.
(5) Numerical methods coupled with different concepts are being used model the behavior of piles and pile groups in complex ground conditions. Strain wedge models the behavior of laterally loaded piles in layered soils.
22
Proceedings CIGMAT-2007 Conference & Exhibition
(6) Load and Resistance Factor Design (LRFD) are being used in designing deep foundations.
(7) Downhole penetrometer and laser borehole roughness device can become very helpful tools to better quantify the condition in the bore-hole base and side wall before concreting.
ACKNOWLEDGEMENT
The study was supported by the Center for Innovative Grouting Materials and Technology (CIGMAT) at the University of Houston, Houston Texas. The sponsor is not responsible for any of the findings in this study.
REFERENCES Abu-Hejleh, N. & Attwooll, W. J. 2005. Colorado’s Axial Load Tests on Drilled Shafts
Socketed in Weak Rocks: Synthesis and Future Needs, Report # CDOT-DTD-R-2005-4, Colorado Department of Transportation Research Branch, July, Denver, CO.
Anderson, J.B., Townsend, F. C., & Grajales, B. 2003. Case Histories Evaluation of Laterally Loaded Piles. Journal of Geotechnical & Geoenvironmental EngineeringU,U ASCE, Vol 129. No. 3, pp187-196.
Ashour, M., Pilling, P. & Norris, G. 2004. Lateral Behavior of Pile Groups in Layered Soils. Journal of Geotechnical & Geoenvironmental EngineeringU,U ASCE, Vol 130. No. 6, pp.580-592.
Ashour, M. & Norris, G. 2004. Lateral Behavior of Pile Groups in Layered Soils. Journal of Geotechnical & Geoenvironmental EngineeringU,U ASCE, Vol 129. No. 6, pp.404-414.
Brown, D. A. 2005. Practical Considerations in the Selection and Use of Continuous Flight Auger and Drilled displacement Piles. C. Vipulanandan & F. Townsend (eds), GSP 132, Advances In Deep Foundations, ASCE. (CD-ROM).
Brettmann, T. and NeSmith, W. 2005. Advances in Auger Pressure Grouted Piles: Design, Construction and Testing. C. Vipulanandan & F. Townsend (eds), GSP 129, Advances In Deep Foundations: Construction, Design, And Testing-In Memory of Michael W. O’Neill, ASCE. pp. 290-307.
DFI 1994. Augered Cast-in-Place Manual, Deep Foundation Institute, Sparata, NJ, 29 pp. Duncan, M. Robinette, M. & Mokwa R. L. 2005. Advances in Auger Pressure Grouted
Piles: Design, Construction and Testing. C. Vipulanandan & F. Townsend (eds), GSP 129, Advances In Deep Foundations: Construction, Design, And Testing-In Memory of Michael W. O’Neill, ASCE. pp. 235-250.
Fellenius, B. H. 2006. Results from long-term Measurement in Piles of Drag Load and downdrag. Canadian Geotechnical Journal, Vol. 43, No. 4. pp. 409-430.
Frizzi, R.P. & Meyer, M.E., 2000. “Augercast Piles – South Florida Experience”, New Technological and Design Developments in Deep Foundations, Proceedings of sessions of Geo-Denver 2000 held in Denver, Colorado, August 5-8, 2000, edited by Norman Dennis, Jr., Ray Castelli and Michael W. O’Neill. pp. 382- 395.
Hussein, M. H. & Liking, G. 2005. Deep Foundations Quality Control and Quality Assurance Testing Methods. Journal of Florida Engineering Society, March, pp.12-16.
23
Proceedings CIGMAT-2007 Conference & Exhibition
Iskander, M., Hanna, S. and Stachla, A. 2001. Drivability of FRP Composite Piling. Journal of Geotechnical and Geoenvironmental Engineering, Vol. 127, No. 2, pp.169-176.
Kulhawy, F. H. & Phoon, K. K. 2002. Observations on Geotechnical Reliability-Based Design Development in North America. Fndn. Design Codes & Soil Investigation in View of Intl. Harmonization & Performance Based Design, Ed. Y Honjo, O Kusakabe, K Matsui, M Kouda & G Pokharel, Balkema, Lisse-Netherlands, 31-48.
Kulhawy, F.H. 2004. On the Axial Behavior of Drilled Foundations", GeoSupport 2004: Drilled Shafts, Micropiling, Deep Mixing, Remedial Methods, & Specialty Foundation Systems (GSP 124), Ed. JP Turner & PW Mayne, ASCE, Reston, 34-51.
Kulhawy, F. H., Prakoso, W. A. & Akbas, S.O. 2005. "Evaluation of Capacity of Rock Foundation Sockets", Alaska Rocks 2005 (Proc., 40th US Symp. Rock Mech.), Ed. G Chen, S Huang, W Zhou & J Tinucci, Anchorage, Alaska, Paper 05-767, 8 p. (CD-ROM)
Moon, N. S., O’Neill, M. W. & Vipulanandan, C. 2004. Correlation between Texas Cone Penetrometer (TCP) Values and the Compressive Strength of Clay Shale in Texas. Proceeding. CIGMAT 2004 Conference and Exhibition, Houston, Texas (HTUhttp://www2.egr.uh.edu/-civeb1/CIGMAT/04-poster/12.pdfUTH).
Moon, N. S. 2004. Improved Design for Drilled Shafts in Rocks. Ph.D. Dissertation, Department of Civil and Environmental Engineering, University of Houston, Houston, Texas.
O'Neill, M. W., and Reese, L. C. 1999. Drilled Shafts: Construction Procedures and Design Methods. FHWA Publication No. FHWA-IF-99-025. Department of Transportation, Federal Highway Administration, Office of Implementation, McLean, VA.
O’Neill, M. W., Vipulanandan, C., Ata, A. and Tan, F. 1999. Axial Performance of Continuous Flight Auger Piles for Bearing, Project Report No. 7-3940-2, Texas Department of Transportation, Austin, Texas, 253 pp.
O’Neill, M. W., Ata, A., Vipulanandan, C. and Yin, S. 2002. Axial Performance of ACIP Piles in Texas Coastal Soils. Deep Foundation Congress 2002, GSP 116, ASCE, pp. 1290-1304.
Paikowsky, S.G, Hajduk, E. L. & Hart, L. J. 2005. . Comparison Between Model and Full Scale Pile Capacity Gain in Boston Area. C. Vipulanandan & F. Townsend (eds), GSP 132, Advances In Deep Foundations, ASCE. (CD-ROM).
Rollins, K. M., Olsen, R. J., Garrett, B. H. & Broderick, R. D. 2004. Dynamic Lateral Load Behavior of a Full-Scale Pile Group. SDEE/ICEGE.
Rollins, K. M. 2003. Response, Analysis and Design of Pile Groups Subjected to Static and Dynamic Lateral Loads, Final Project Report, Utah Department of Transportation 350 p.
Rowe, R.K. and Armitage, H.H. (1987), “A Design Method For Drilled Piers in Soft Rock. Canadian Geotechnical Journal, Vol. 24, pp.126-142.
Sellountou, E. A., O’Neill, M. W. & Vipulanandan, C.. 2005. Construction effects on ACIP Pile Behavior in Texas Coastal Soils. C. Vipulanandan & F. Townsend (eds), GSP 132, Advances In Deep Foundations, ASCE. (CD-ROM).
Tand, K. & Vipulanandan, C. 2005. Modeling the Load-Displacement Behavior of Underreamed Footings in Jointed Clays Using FEM. C. Vipulanandan & F.
24
Proceedings CIGMAT-2007 Conference & Exhibition
Townsend (eds) GSP 129, Advances In Deep Foundations: Construction, Design, And Testing-In Memory of Michael W. O’Neill. pp. 290-307.
TXDOT 2000. Geotechnical manual (online version), Texas Dept. of Transportation, Bridge Division, Austin, Texas.
Vipulanandan, C., O’Neill, M. W., and Weng, Y., 2000. Mechanical Properties and Chemical Resistance of Auger Grout, Geotechnical Special Publication, No. 100, ASCE, pp. 433-446.
Vipulanandan, C., Kim, M. G., & O’Neill, M. W. 2004. Axial Performance of Continuous Flight Auger Piles for Bearing, Project Report No. 7-3940-2, Texas Department of Transportation, Austin, Texas, 253 pp.
Vipulanandan, C., Kim, M. G., & O’Neill, M. W. 2004 Axial Performance of Continuous Flight Auger Piles for Bearing, Project Report, CIGMAT 2004-6, 253 pp. http://cigmat.cive.uh.edu.
Vipulanandan, C., Tand, K. & Kaulgud, S. 2005a. Axial Load-Displacement Relationship and CPT Correlation for ACIP Piles In Texas Gulf Coast Soils. C. Vipulanandan & F. Townsend (eds), GSP 132, Advances In Deep Foundations: Construction, Design, And Testing, ASCE. (CD-ROM).
Vipulanandan, C.& Kaulgud, S. 2005b. Behavior of ACIP Piles Socketed in Clay Shale. C. Vipulanandan & F. Townsend (eds), GSP 129, Advances In Deep Foundations: Construction, Design, And Testing-In Memory of Michael W. O’Neill, (CD-ROM).
Vipulanandan, C. & Moon, N. 2005c. Case Studies on Testing Drilled Shafts Socketed In Uncemented Clay Shales in Texas, Proceedings, GeoP
3P, ADSC, Dallas, Texas,
pp. 259-270. Vipulanandan, C. Liu, R. & Moon, N. S. 2005c. Improved Design for Drilled Shafts in
Rocks, Final Report 0-4372, Texas Department of Transportation, Austin, Texas (under review).
Vipulanandan, C., Guvene, O. & McClelland, M. 2007a. Monitoring the Installation and Curing of a Large Diameter ACIP Pile in Very Dense Sand. .Proceedings GeoDenver 2007, ASCE. (CD-ROM).
Vipulanandan, C., Hussain A. & Usluogulari, O. 2007b. Parametric Study of Open Core-hole on the Behavior of Drilled of Shafts Socketed in Soft Rock..Proceedings GeoDenver 2007, ASCE. (CD-ROM).
25


![Designing Posters Towards a Seamless Integration in Urban ... › wp-content › uploads › 2020 › 06 › ... · services [10,16]. However, technological and social advances during](https://img.pdfslide.net/doc/110x75/5f0dd3467e708231d43c461b/designing-posters-towards-a-seamless-integration-in-urban-a-wp-content-a.jpg)