Embed Size (px)
Citation preview
R E C E N T A D VA N C E S I N S E I S M I C A N D I N F R A S O N I C A N A LY S E S O F V O L C A N I C E R U P T I O N S A N D P O T E N T I A L F O R U S I N G E A RT H S C O P E D ATA
1
D AV I D F E E W I L S O N A L A S K A T E C H N I C A L C E N T E R , A L A S K A V O L C A N O O B S E RVAT O RY G E O P H Y S I C A L I N S T I T U T E , U N I V E R S I T Y O F A L A S K A FA I R B A N K S
R O B I N M AT O Z A D E PA RT M E N T O F E A RT H S C I E N C E A N D E A RT H R E S E A R C H I N S T I T U T E U C S A N TA B A R B A R A
M AT T H A N E Y U . S . G E O L O G I C A L S U RV E Y, A L A S K A V O L C A N O O B S E RVAT O RY
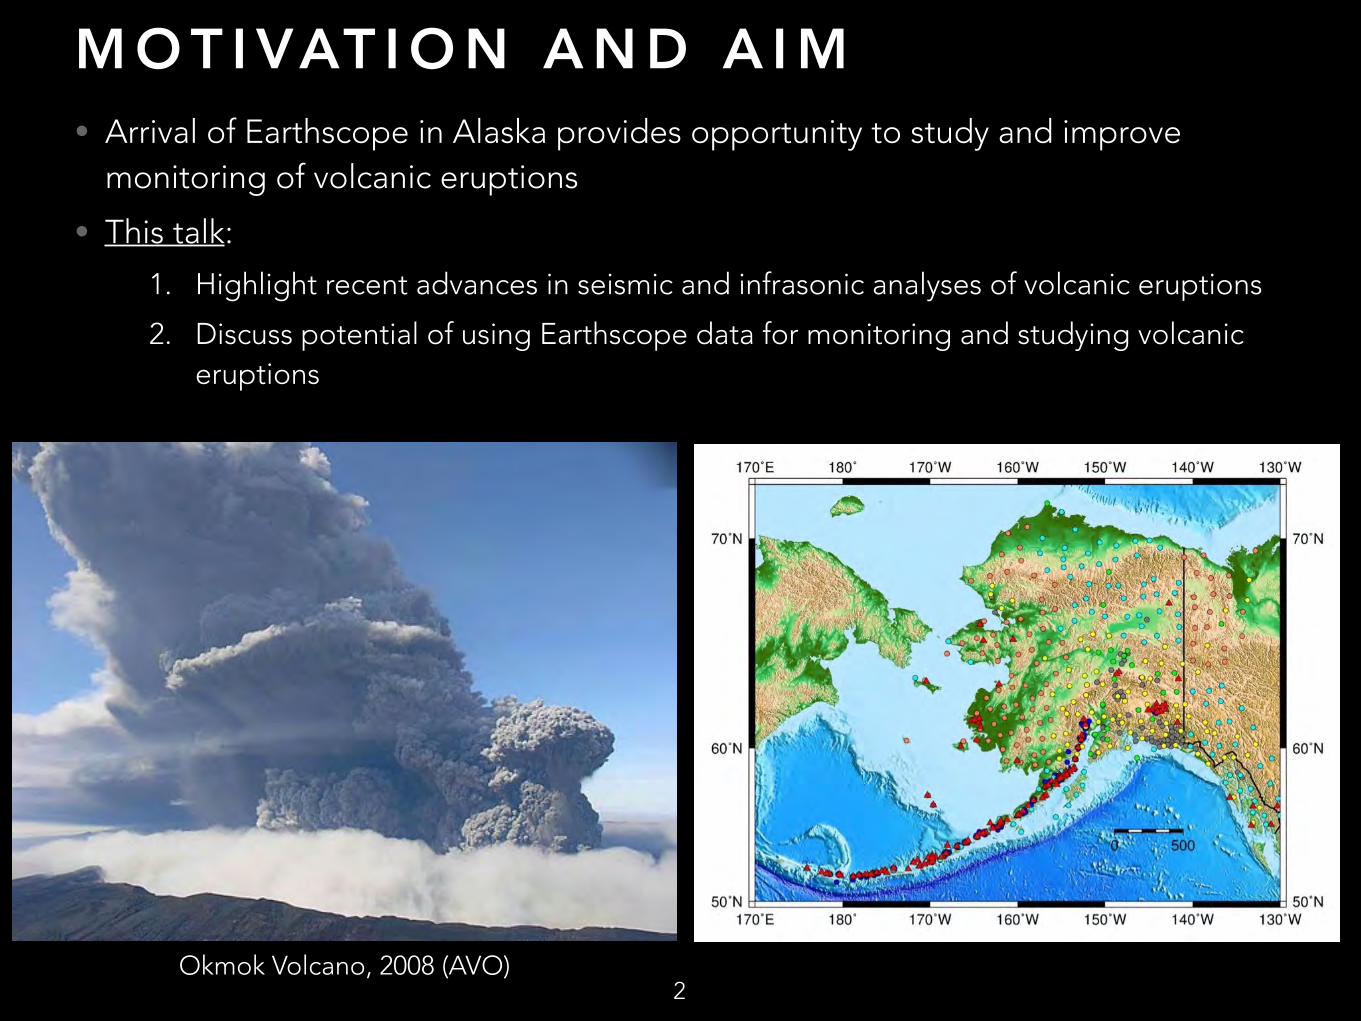
M O T I VAT I O N A N D A I M• Arrival of Earthscope in Alaska provides opportunity to study and improve
monitoring of volcanic eruptions
• This talk:
1. Highlight recent advances in seismic and infrasonic analyses of volcanic eruptions
2. Discuss potential of using Earthscope data for monitoring and studying volcanic eruptions
2Okmok Volcano, 2008 (AVO)
P O T E N T I A L V O L C A N I C H A Z A R D R E L AT E D U S E S O F E A RT H S C O P E S E I S M I C A N D I N F R A S O U N D D ATA
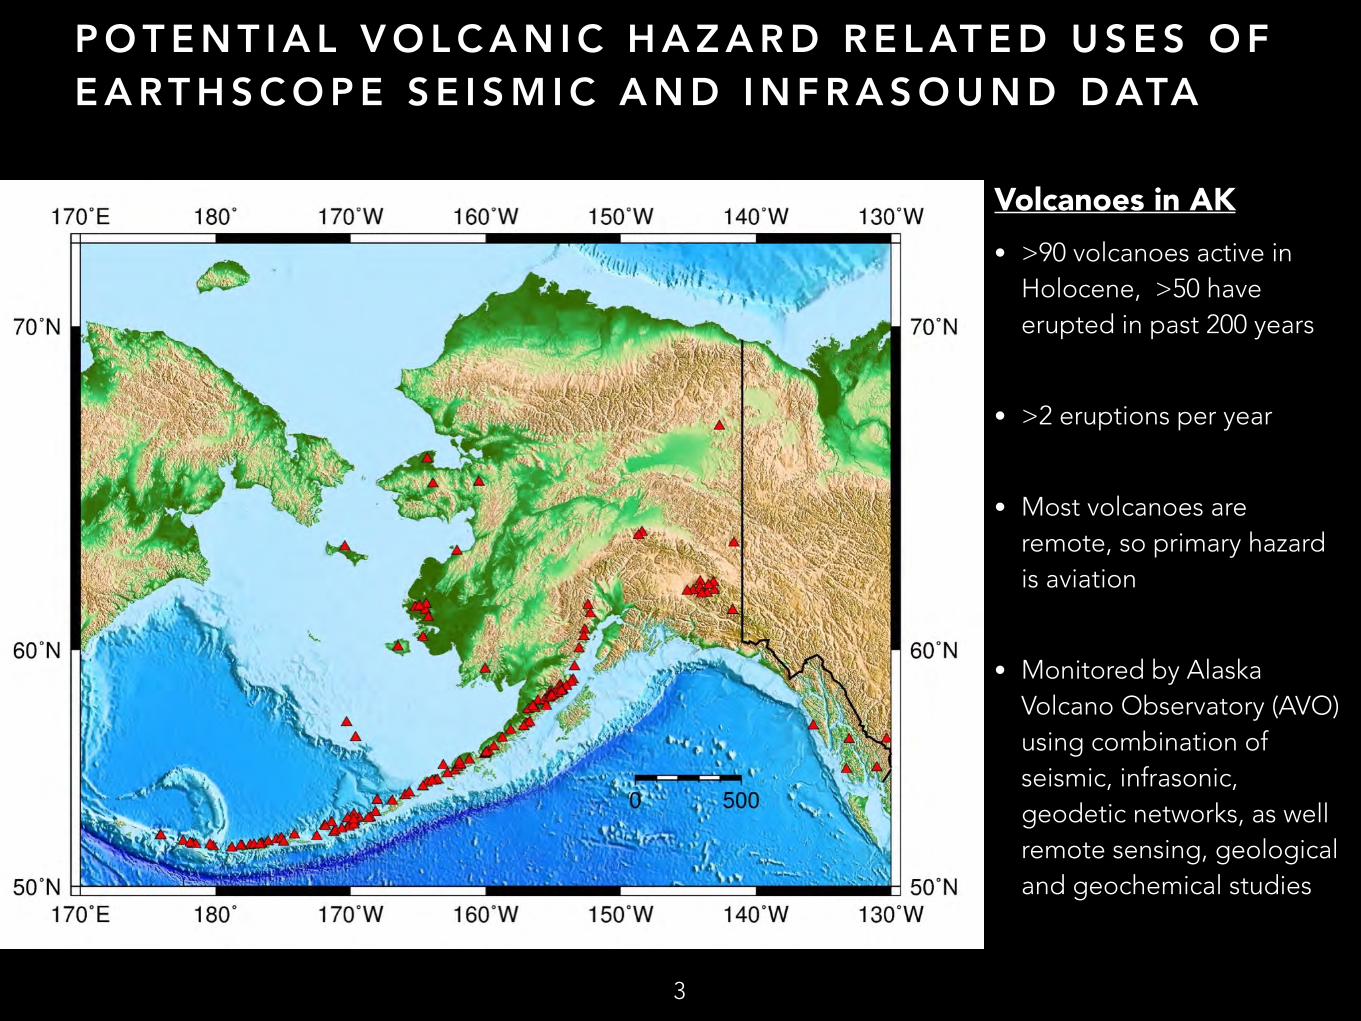
Volcanoes in AK • >90 volcanoes active in
Holocene, >50 have erupted in past 200 years
• >2 eruptions per year
• Most volcanoes are remote, so primary hazard is aviation
• Monitored by Alaska Volcano Observatory (AVO) using combination of seismic, infrasonic, geodetic networks, as well remote sensing, geological and geochemical studies
3
P O T E N T I A L V O L C A N I C H A Z A R D R E L AT E D U S E S O F E A RT H S C O P E S E I S M I C A N D I N F R A S O U N D D ATA
4
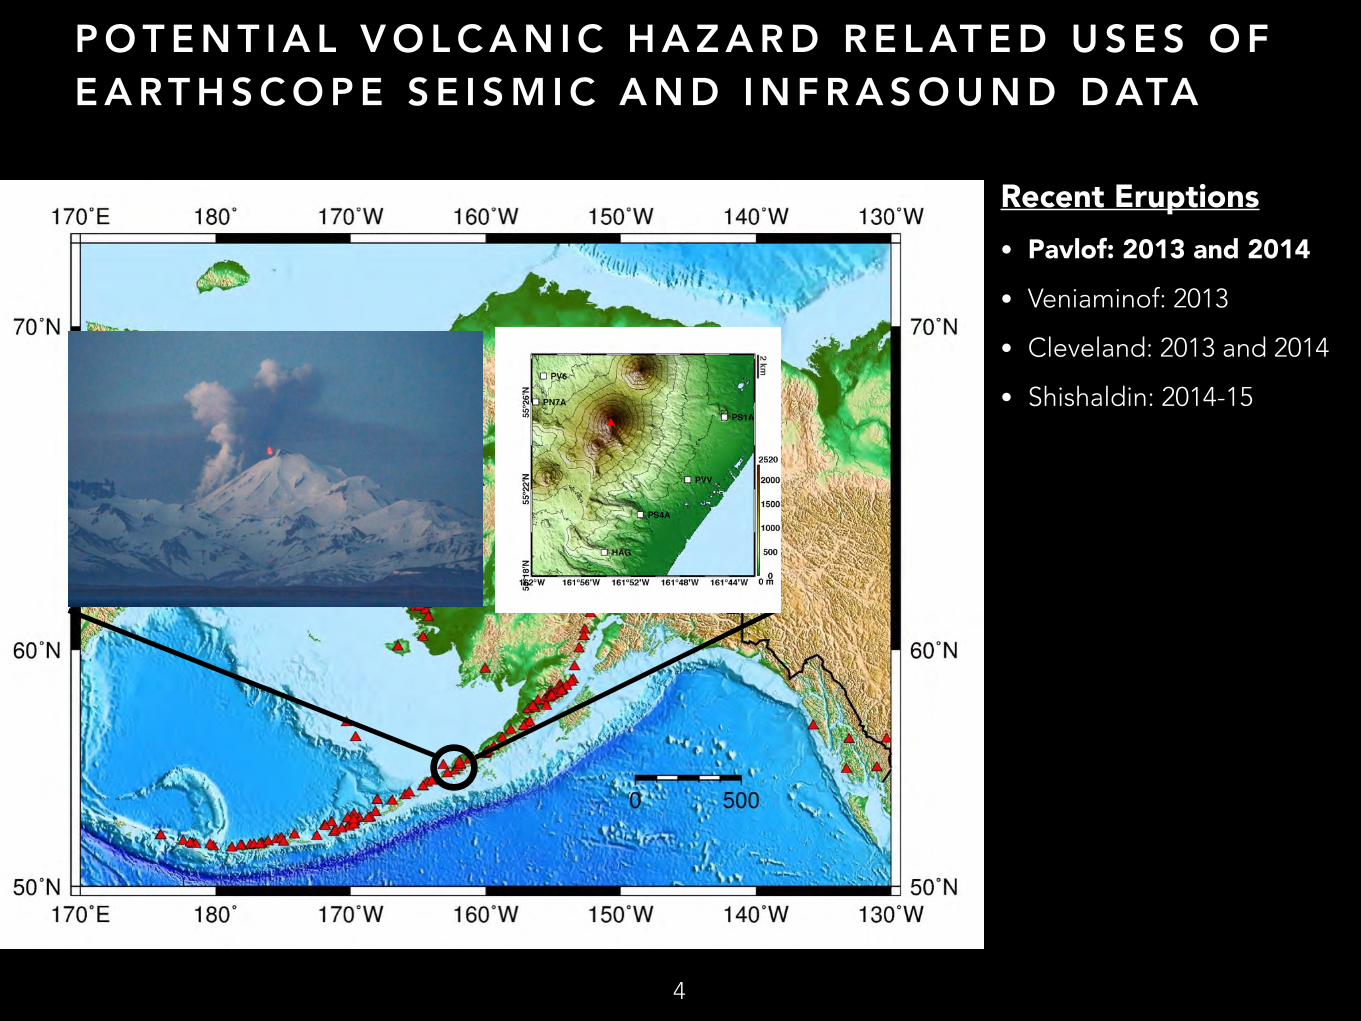
Recent Eruptions • Pavlof: 2013 and 2014
• Veniaminof: 2013
• Cleveland: 2013 and 2014
• Shishaldin: 2014-15
P O T E N T I A L V O L C A N I C H A Z A R D R E L AT E D U S E S O F E A RT H S C O P E S E I S M I C A N D I N F R A S O U N D D ATA
5
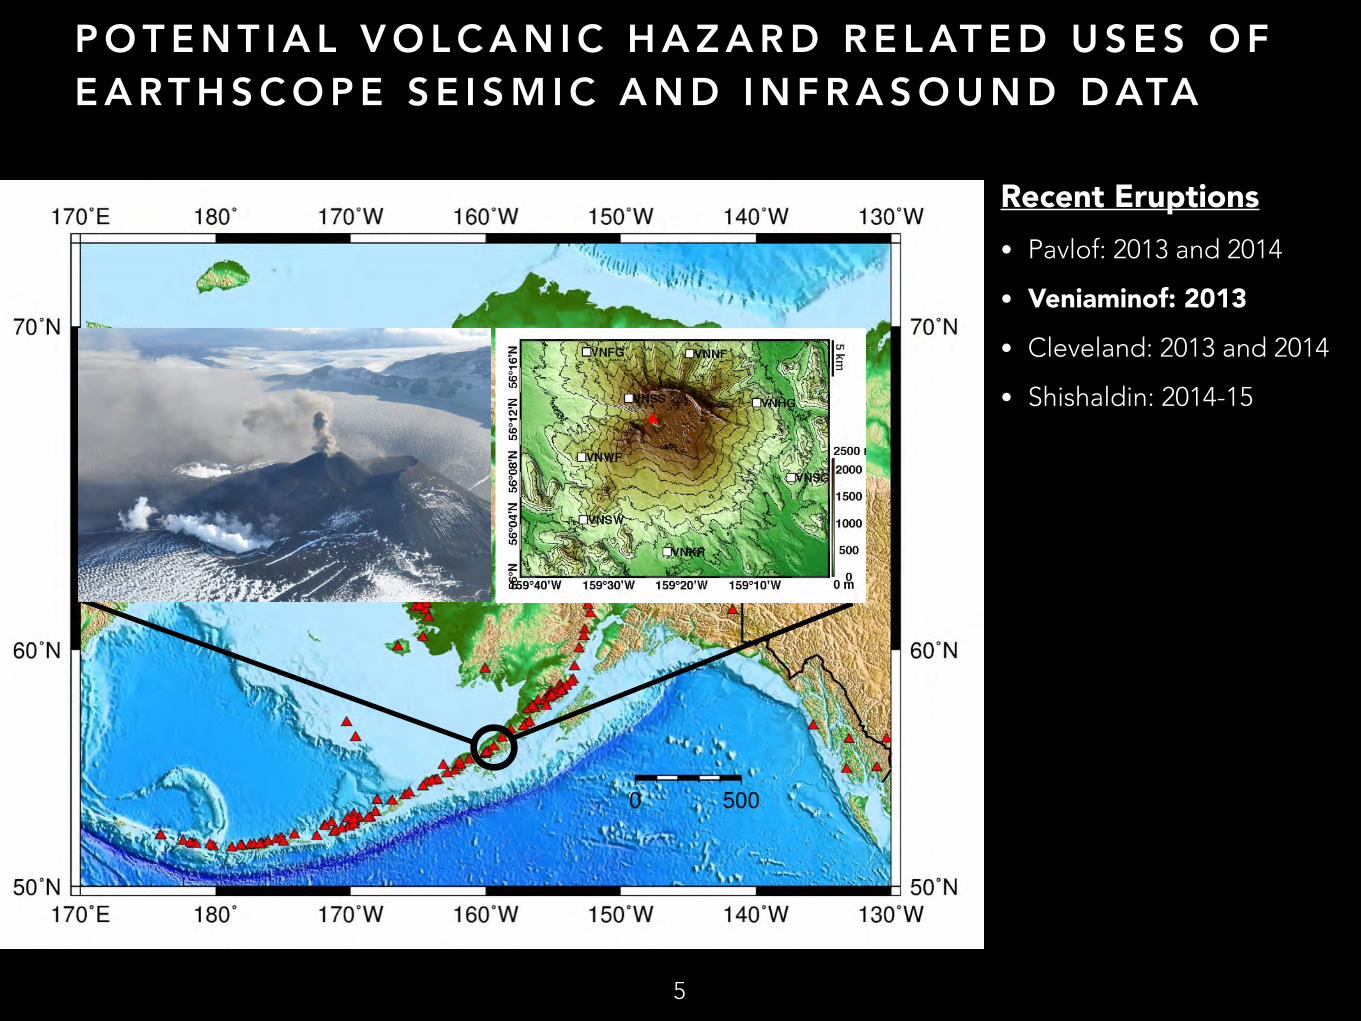
Recent Eruptions • Pavlof: 2013 and 2014
• Veniaminof: 2013
• Cleveland: 2013 and 2014
• Shishaldin: 2014-15
P O T E N T I A L V O L C A N I C H A Z A R D R E L AT E D U S E S O F E A RT H S C O P E S E I S M I C A N D I N F R A S O U N D D ATA
Recent Eruptions • Pavlof: 2013 and 2014
• Veniaminof: 2013
• Cleveland: 2013 and 2014
• Shishaldin: 2014-15
6
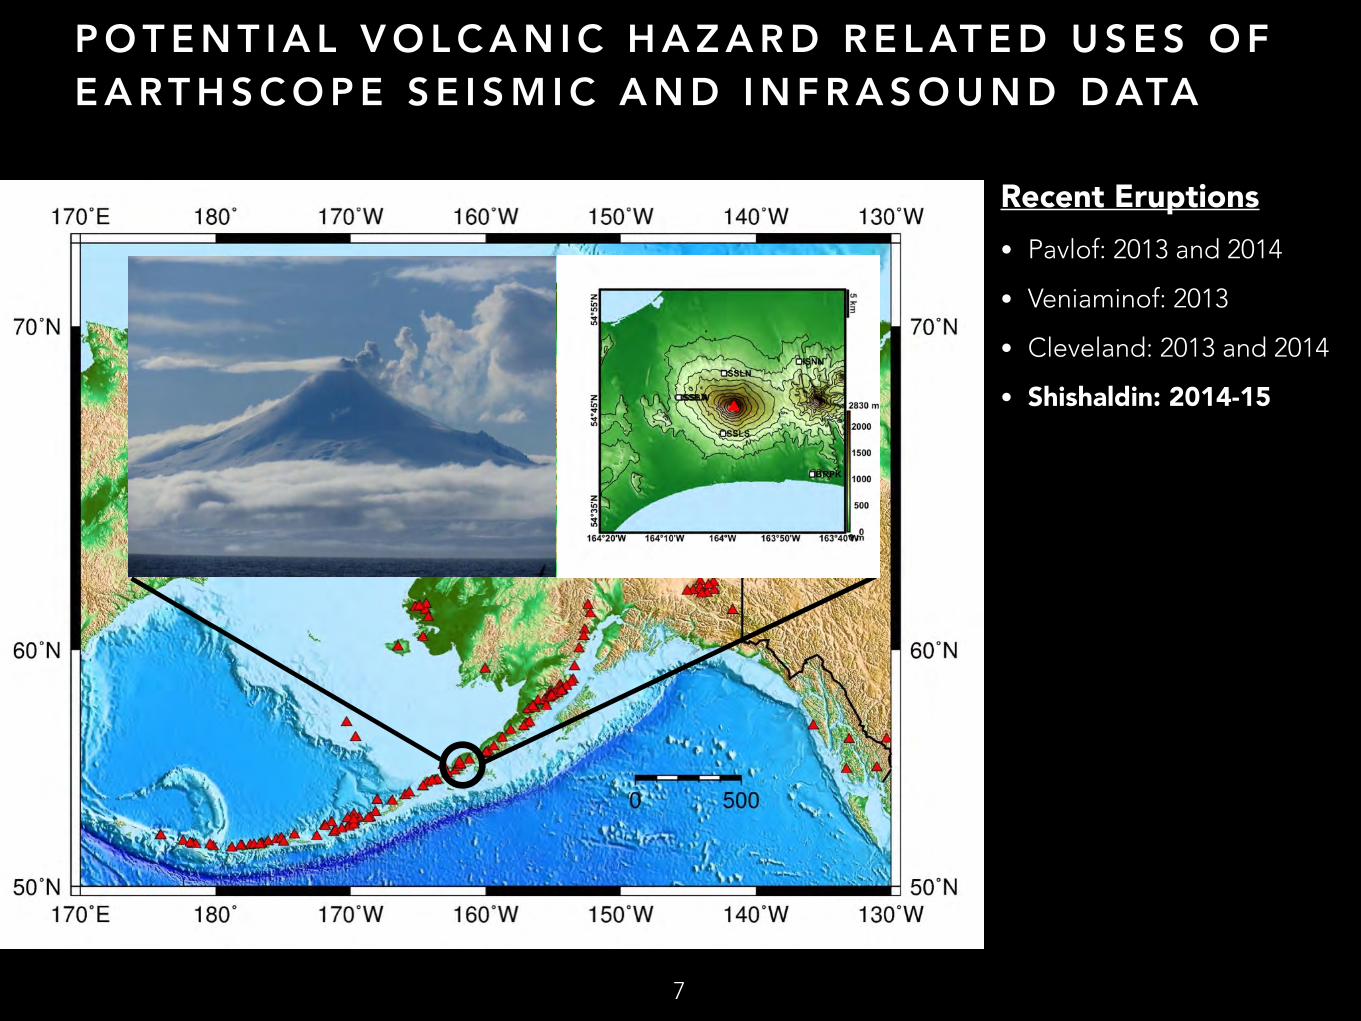
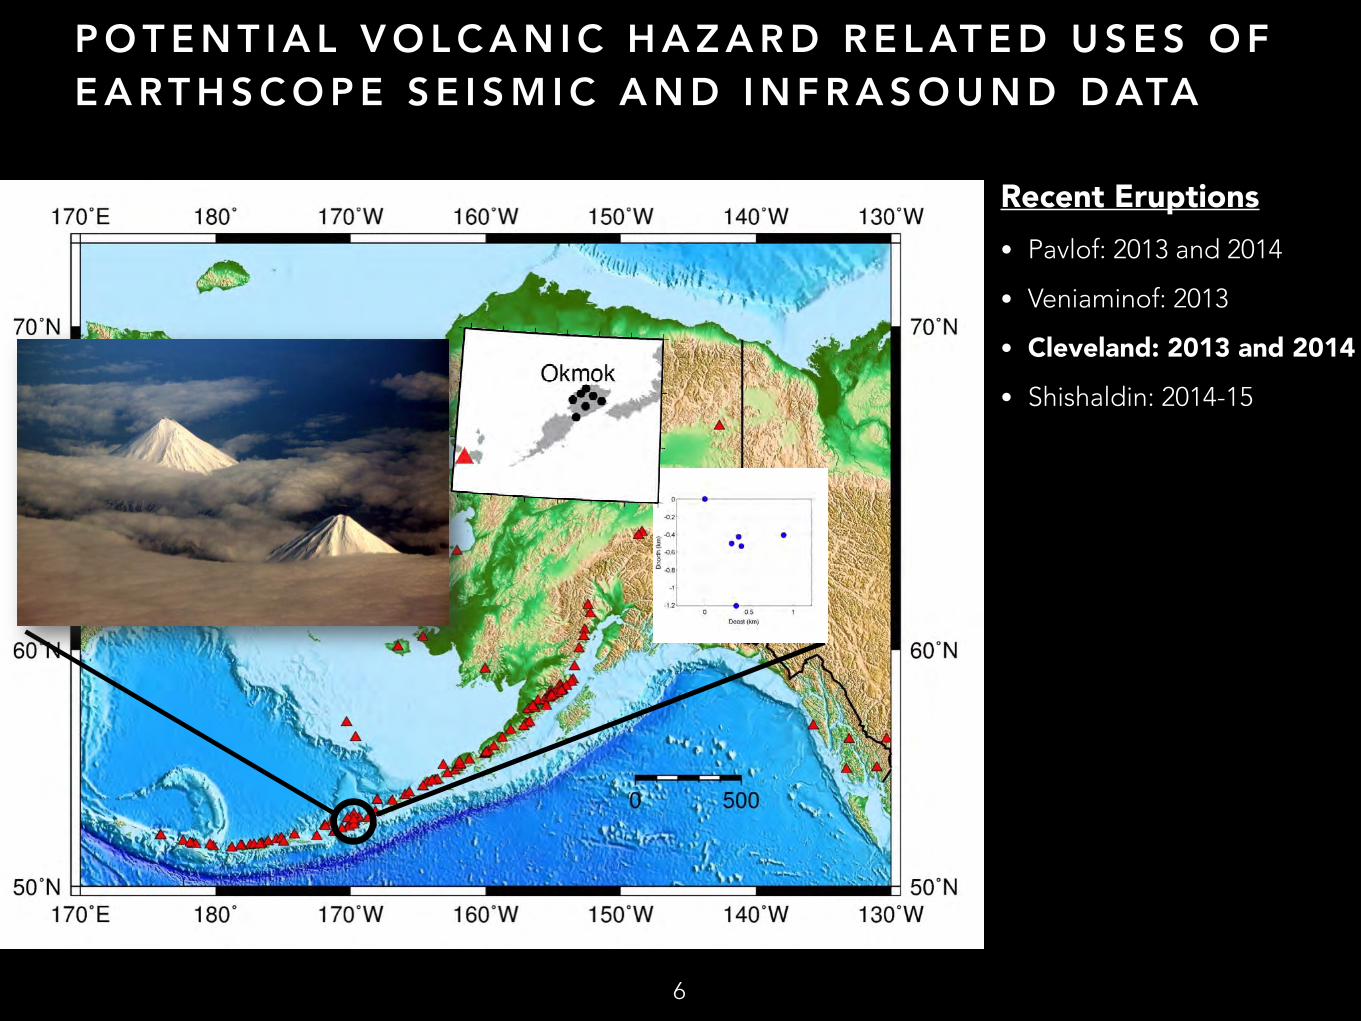
P O T E N T I A L V O L C A N I C H A Z A R D R E L AT E D U S E S O F E A RT H S C O P E S E I S M I C A N D I N F R A S O U N D D ATA
Recent Eruptions • Pavlof: 2013 and 2014
• Veniaminof: 2013
• Cleveland: 2013 and 2014
• Shishaldin: 2014-15
7
A L A S K A : AV O A N D A E C N E T W O R K S
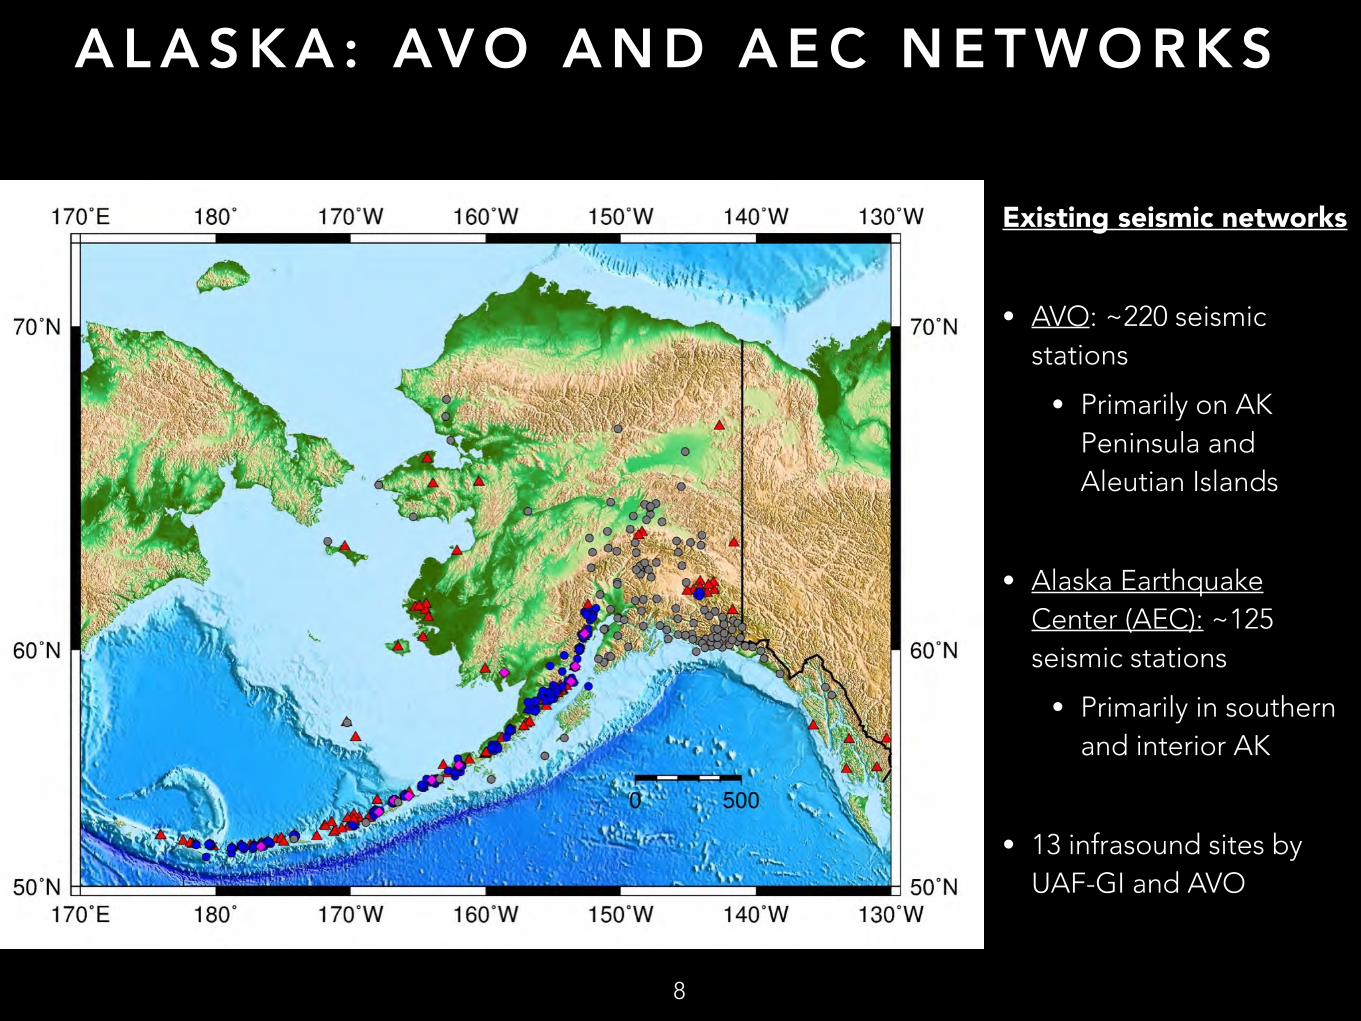
Existing seismic networks
• AVO: ~220 seismic stations
• Primarily on AK Peninsula and Aleutian Islands
• Alaska Earthquake Center (AEC): ~125 seismic stations
• Primarily in southern and interior AK
• 13 infrasound sites by UAF-GI and AVO
8
A L A S K A : 2 0 1 4
9
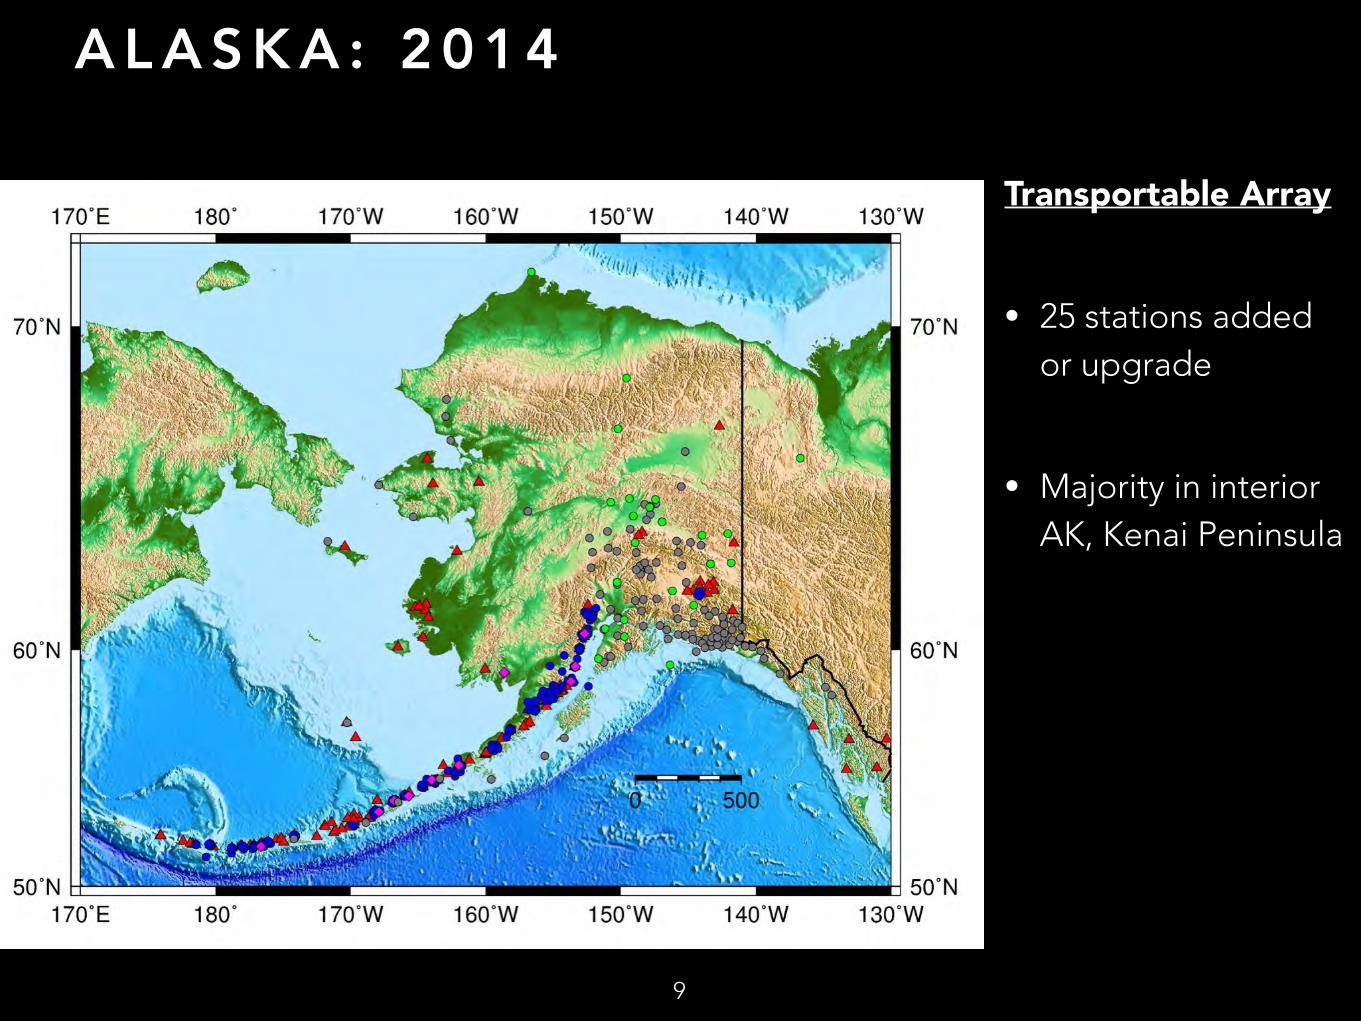
Transportable Array
• 25 stations added or upgrade
• Majority in interior AK, Kenai Peninsula
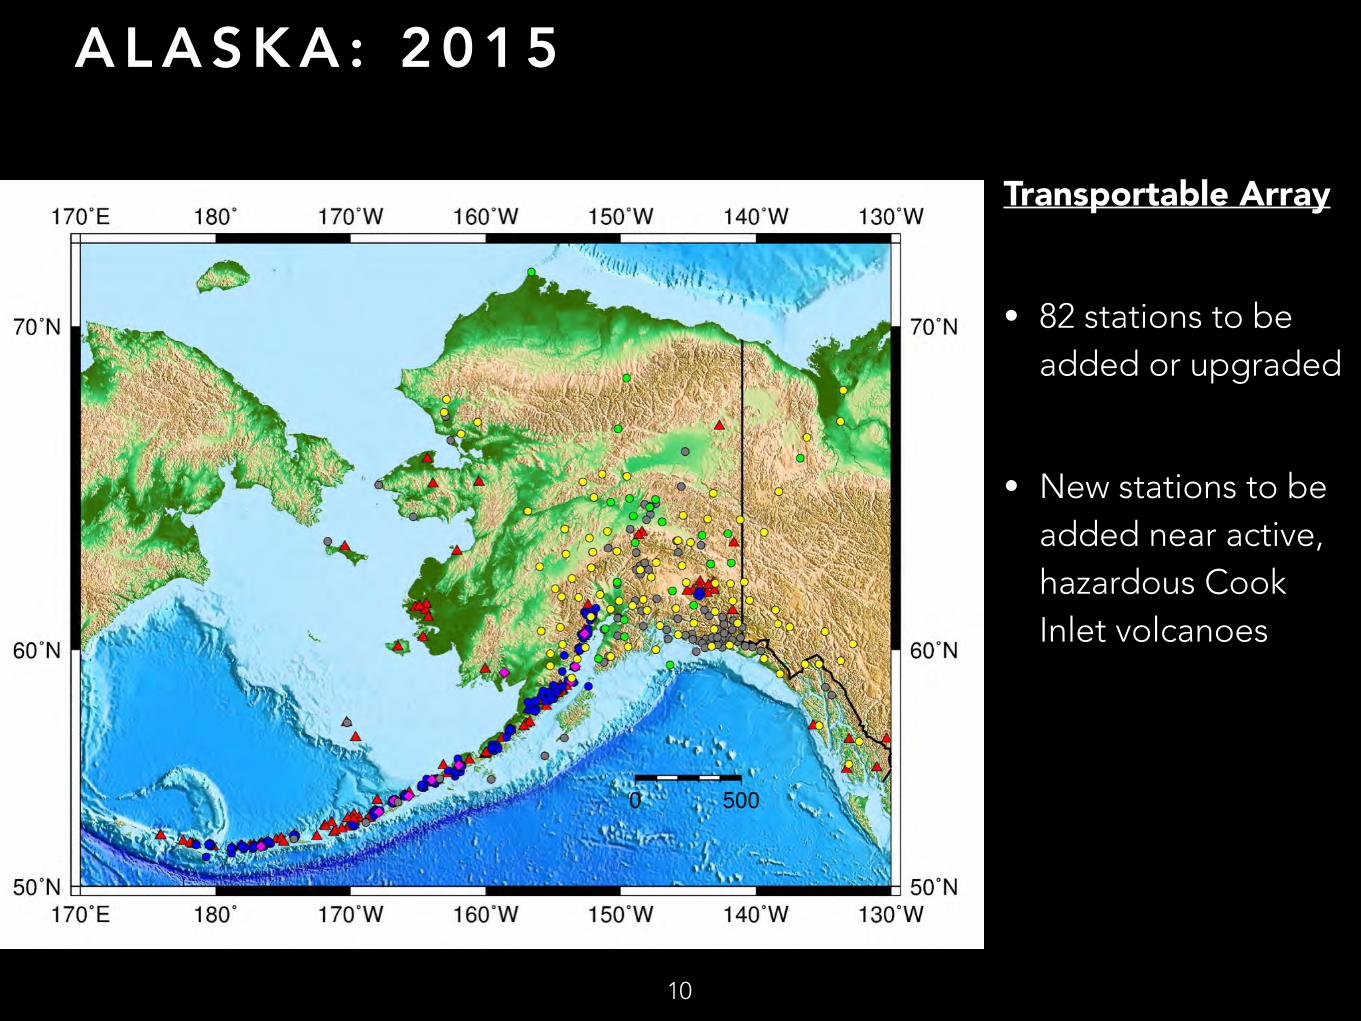
A L A S K A : 2 0 1 5
10
Transportable Array
• 82 stations to be added or upgraded
• New stations to be added near active, hazardous Cook Inlet volcanoes
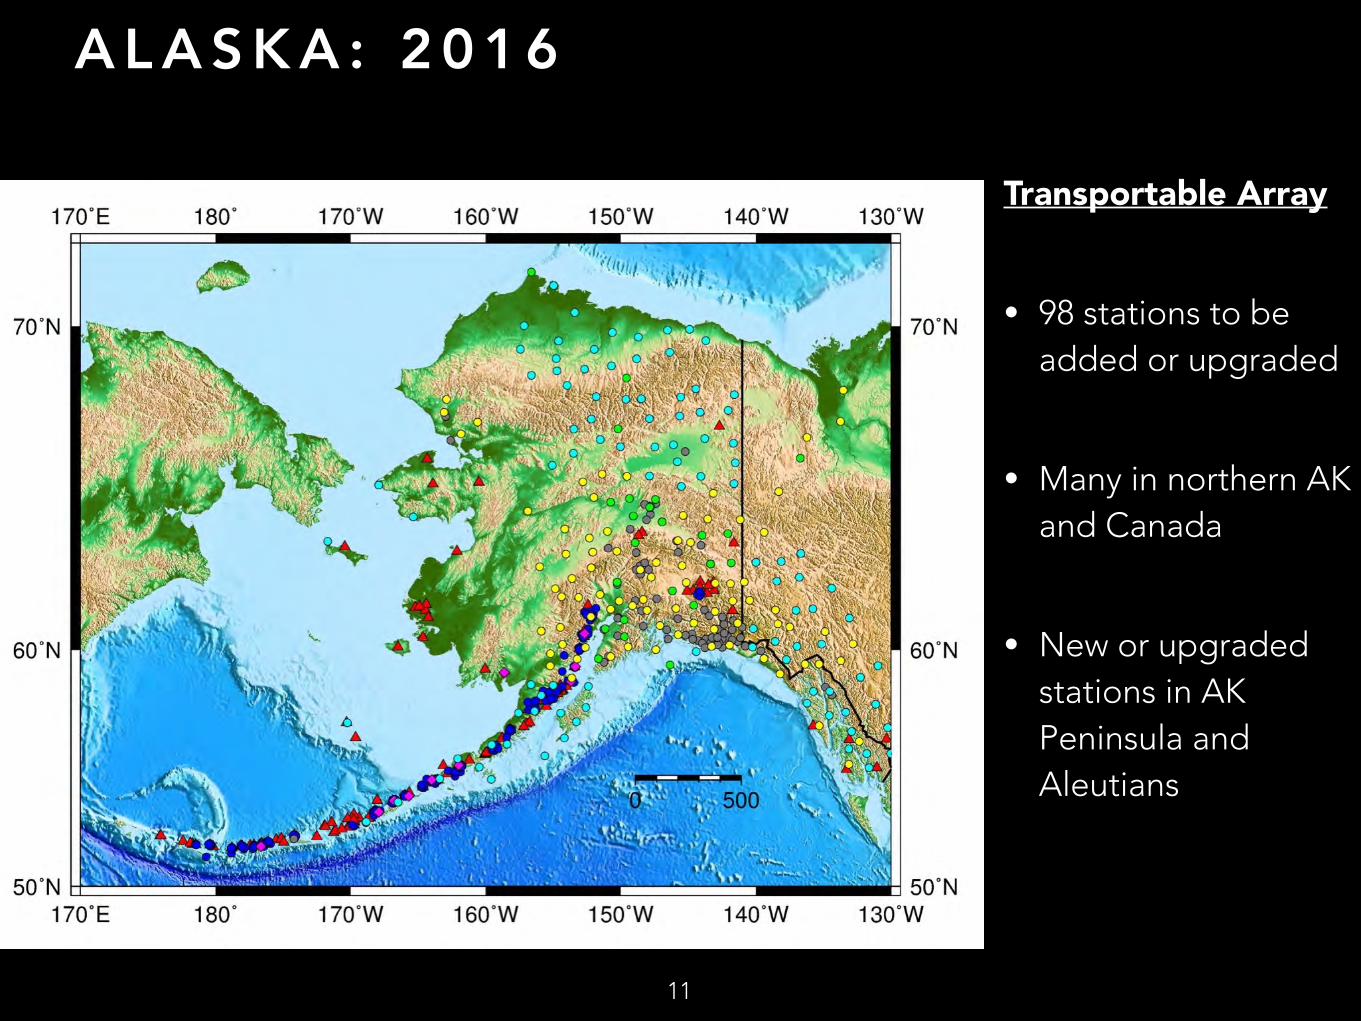
A L A S K A : 2 0 1 6
11
Transportable Array
• 98 stations to be added or upgraded
• Many in northern AK and Canada
• New or upgraded stations in AK Peninsula and Aleutians
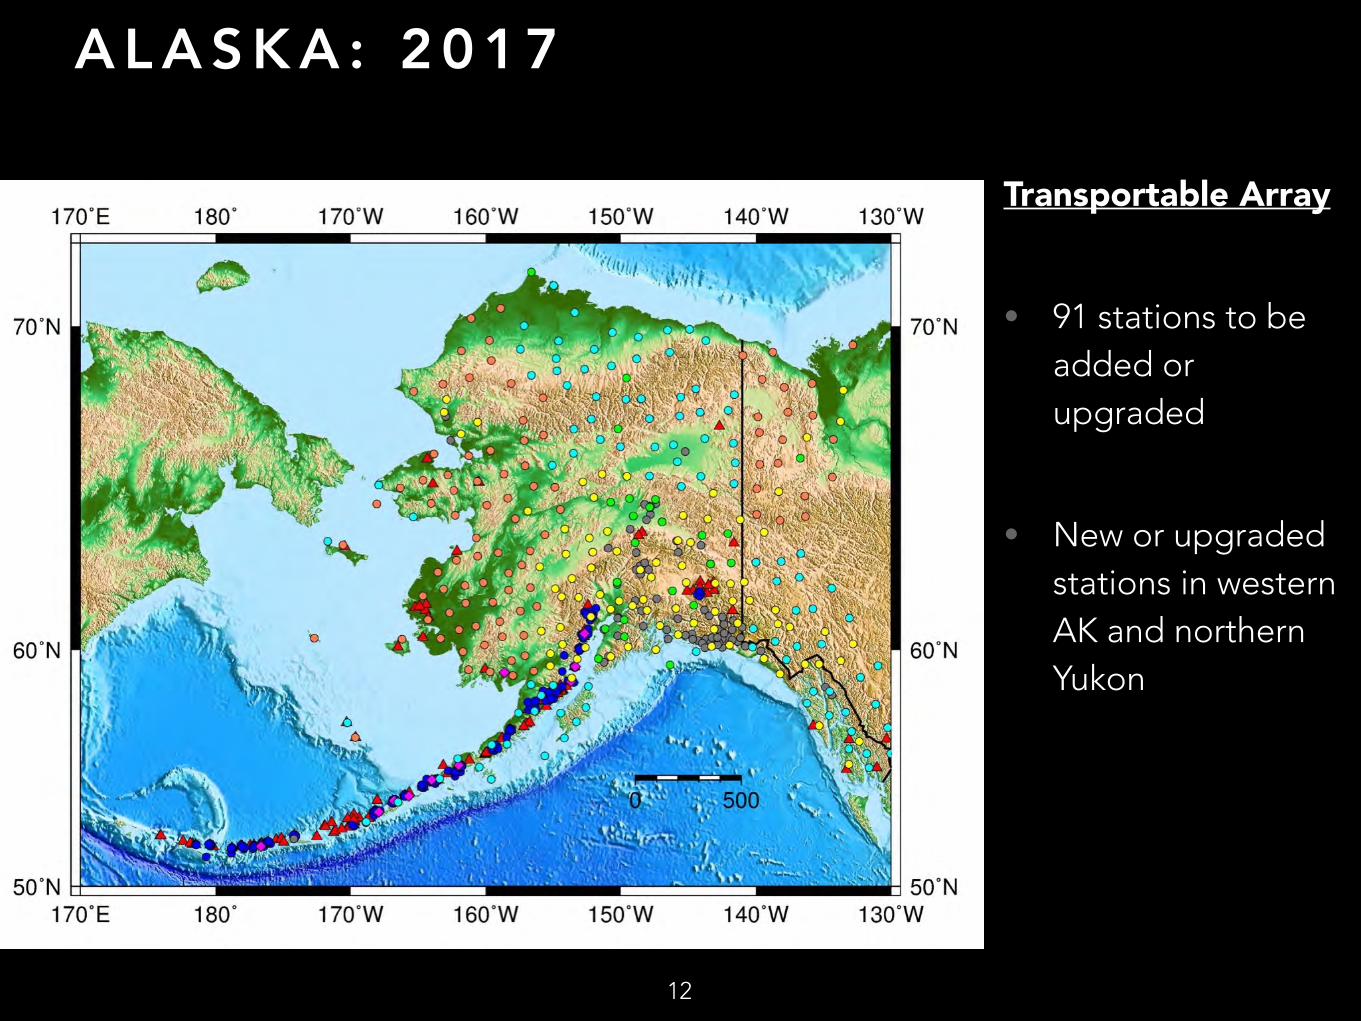
A L A S K A : 2 0 1 7
12
Transportable Array
• 91 stations to be added or upgraded
• New or upgraded stations in western AK and northern Yukon
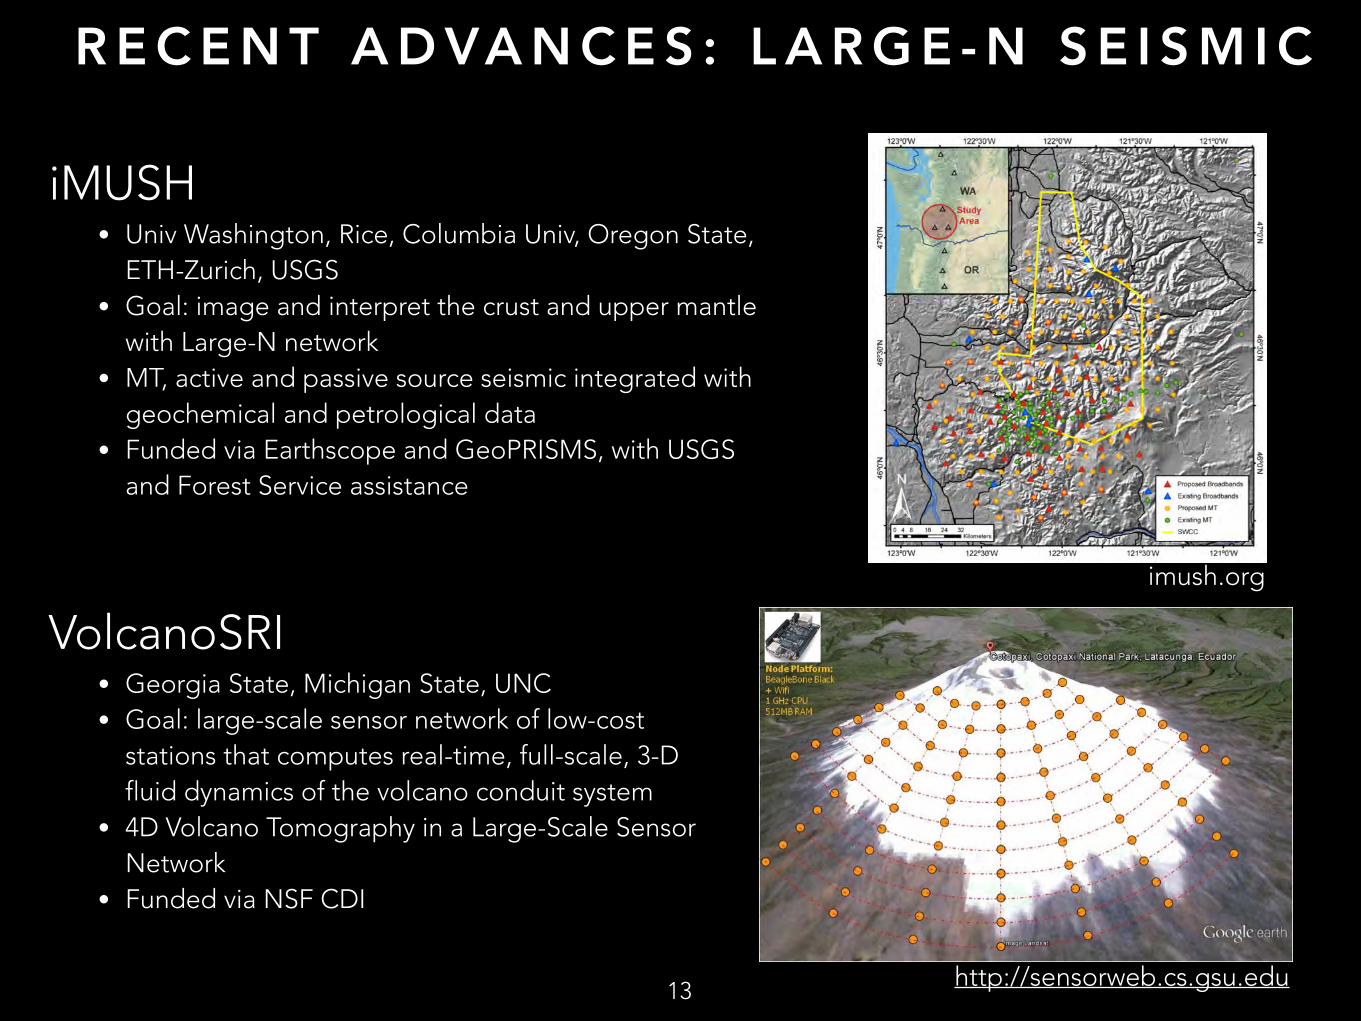
R E C E N T A D VA N C E S : L A R G E - N S E I S M I C
iMUSH • Univ Washington, Rice, Columbia Univ, Oregon State,
ETH-Zurich, USGS • Goal: image and interpret the crust and upper mantle
with Large-N network • MT, active and passive source seismic integrated with
geochemical and petrological data • Funded via Earthscope and GeoPRISMS, with USGS
and Forest Service assistance
13
imush.org
VolcanoSRI • Georgia State, Michigan State, UNC • Goal: large-scale sensor network of low-cost
stations that computes real-time, full-scale, 3-D fluid dynamics of the volcano conduit system
• 4D Volcano Tomography in a Large-Scale Sensor Network
• Funded via NSF CDI
http://sensorweb.cs.gsu.edu
C U R R E N T V O L C A N O S E I S M I C P R O J E C T S I N A L A S K A
14
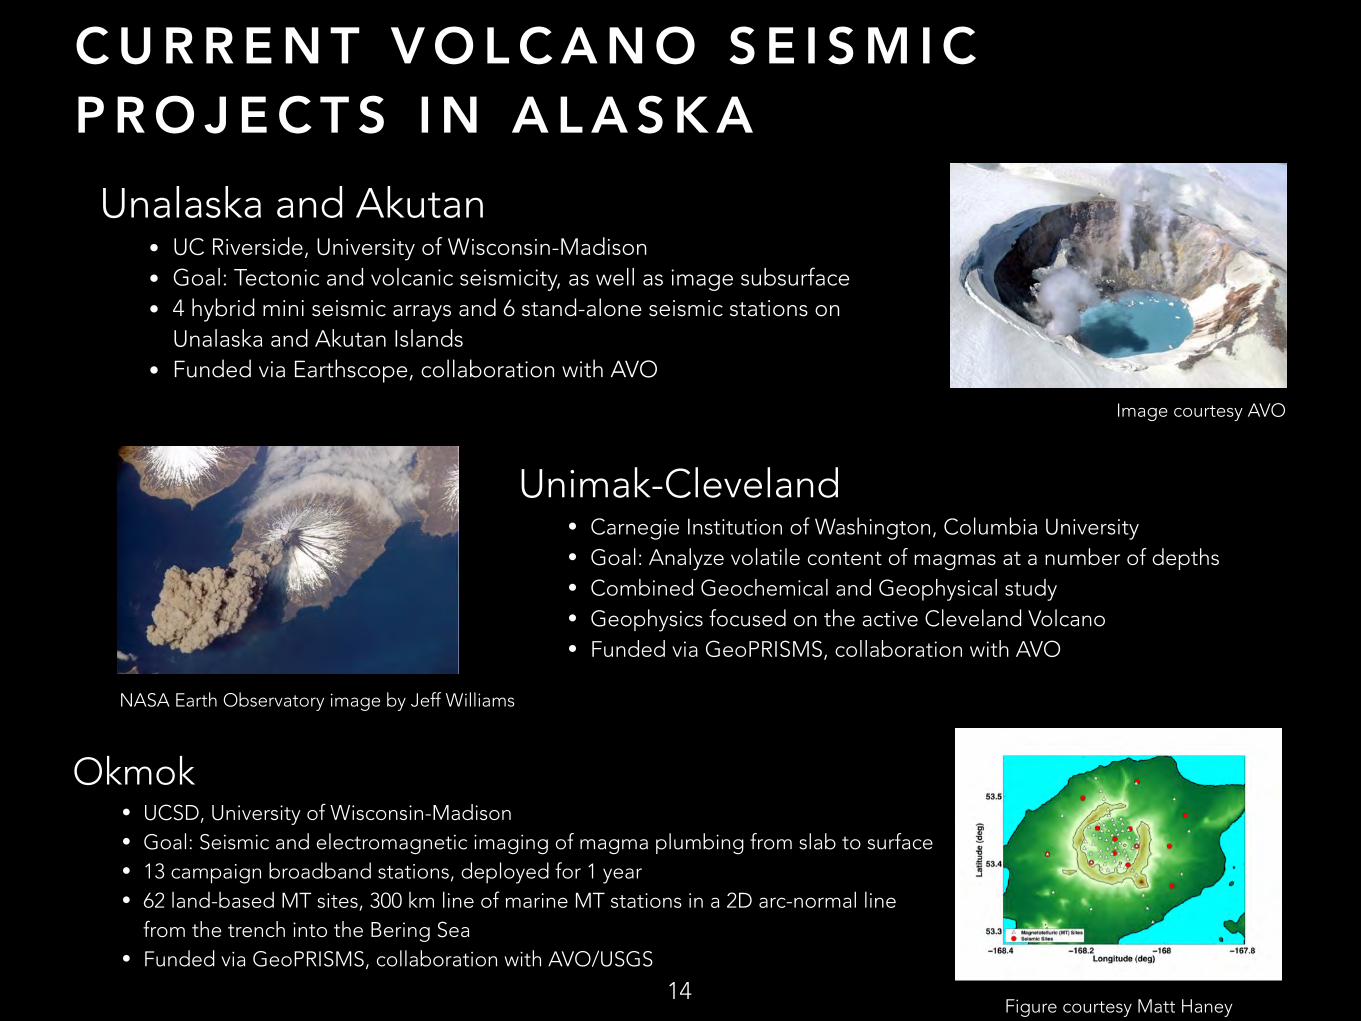
Unalaska and Akutan • UC Riverside, University of Wisconsin-Madison • Goal: Tectonic and volcanic seismicity, as well as image subsurface • 4 hybrid mini seismic arrays and 6 stand-alone seismic stations on
Unalaska and Akutan Islands • Funded via Earthscope, collaboration with AVO
Image courtesy AVO
Unimak-Cleveland • Carnegie Institution of Washington, Columbia University • Goal: Analyze volatile content of magmas at a number of depths • Combined Geochemical and Geophysical study • Geophysics focused on the active Cleveland Volcano • Funded via GeoPRISMS, collaboration with AVO
Okmok • UCSD, University of Wisconsin-Madison • Goal: Seismic and electromagnetic imaging of magma plumbing from slab to surface • 13 campaign broadband stations, deployed for 1 year • 62 land-based MT sites, 300 km line of marine MT stations in a 2D arc-normal line
from the trench into the Bering Sea • Funded via GeoPRISMS, collaboration with AVO/USGS
Figure courtesy Matt Haney
NASA Earth Observatory image by Jeff Williams
S E I S M I C T O M O G R A P H Y
15
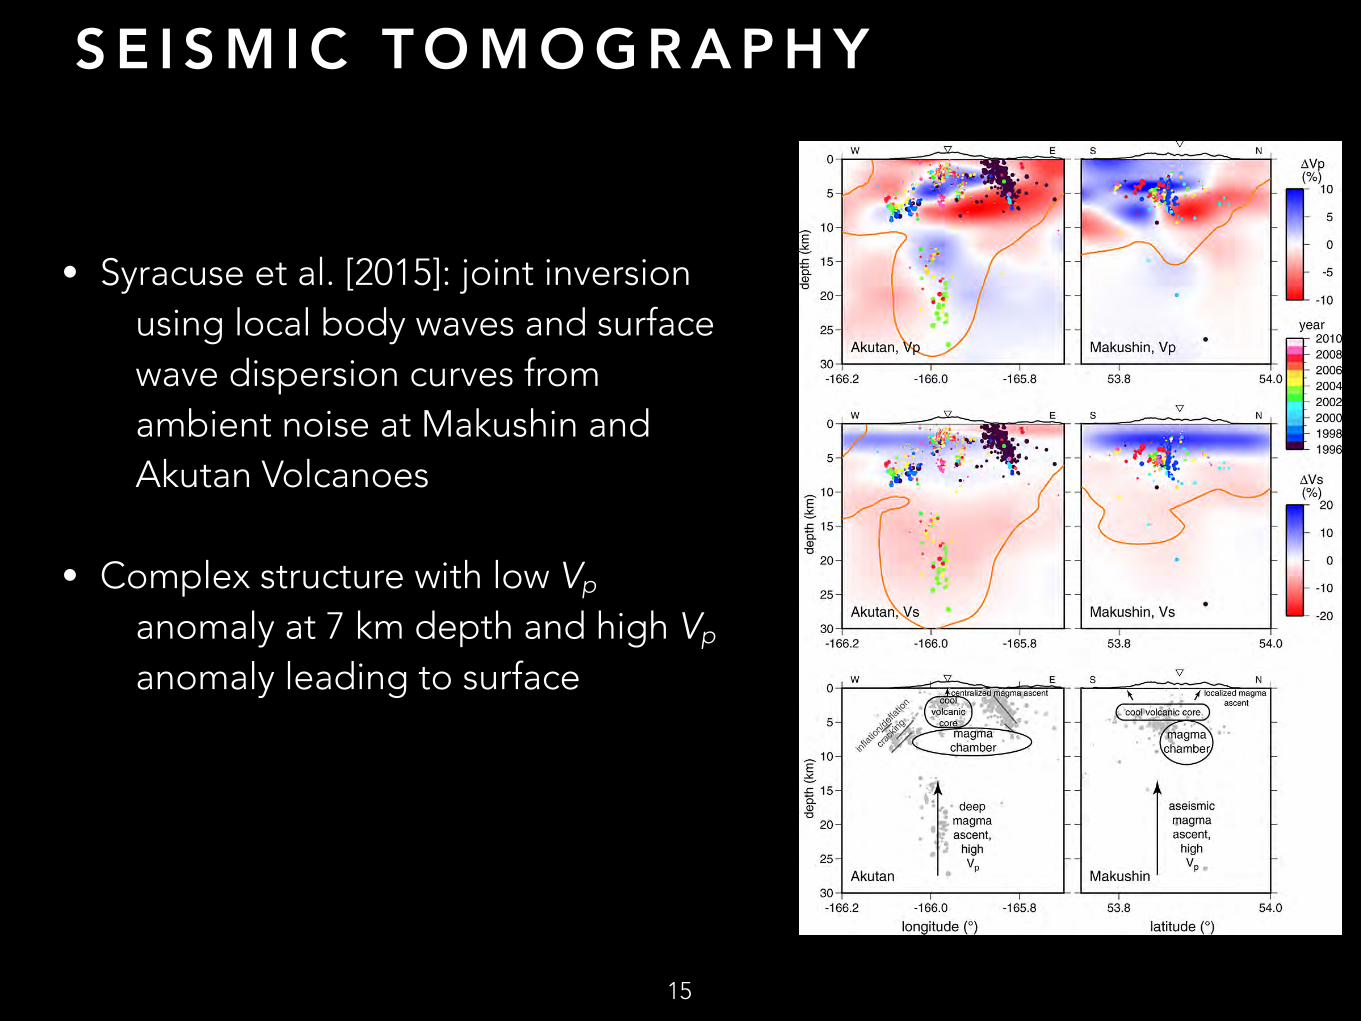
• Syracuse et al. [2015]: joint inversion using local body waves and surface wave dispersion curves from ambient noise at Makushin and Akutan Volcanoes
• Complex structure with low Vp anomaly at 7 km depth and high Vp anomaly leading to surface
O K M O K V O L C A N I C T R E M O R
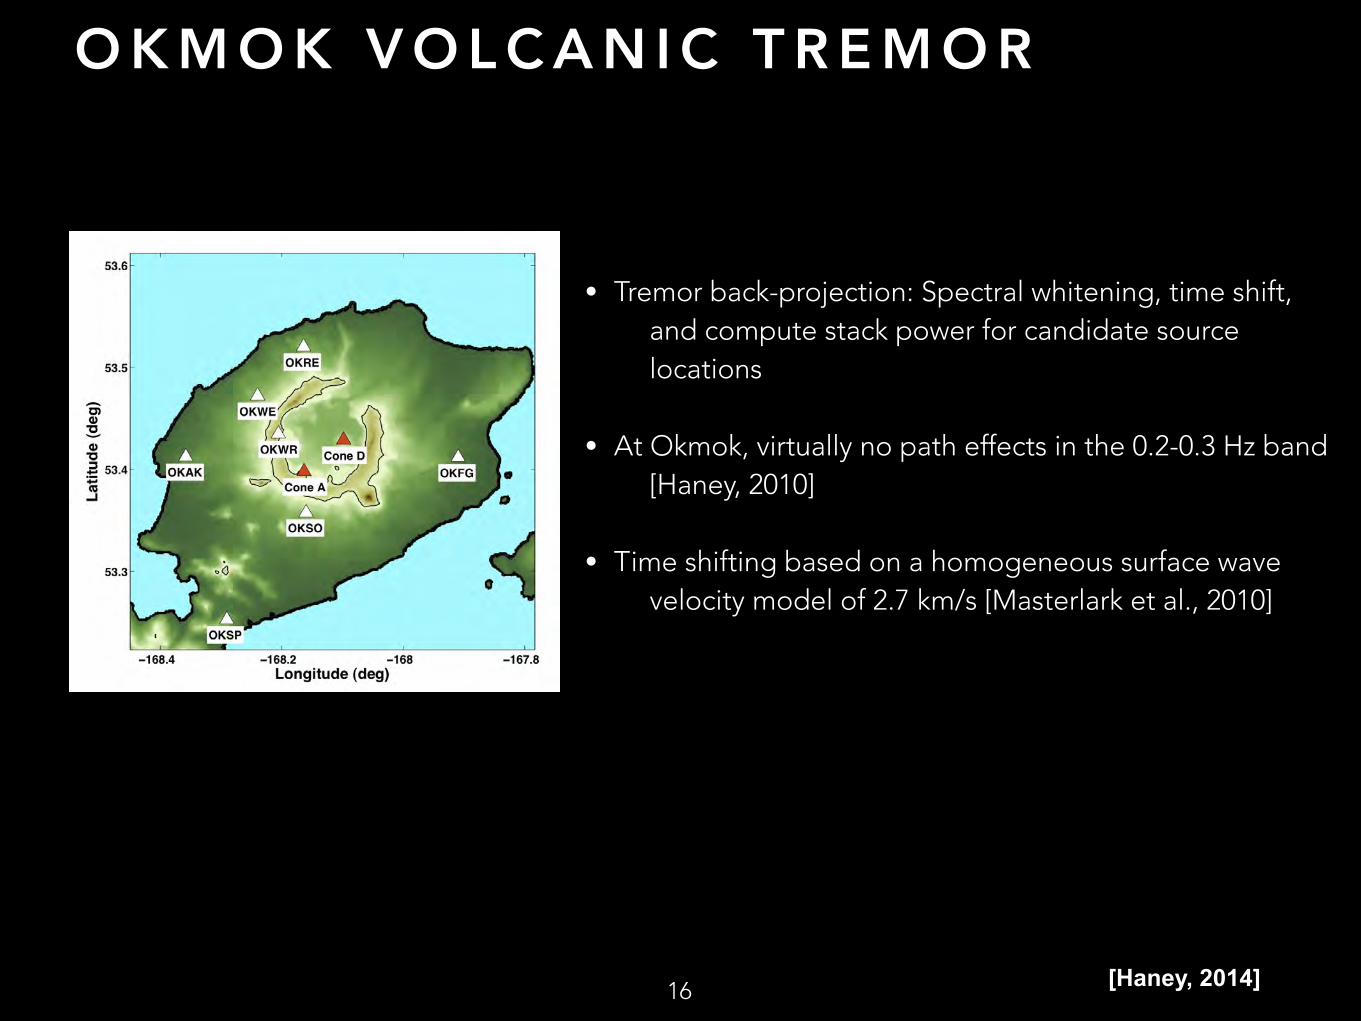
• Tremor back-projection: Spectral whitening, time shift, and compute stack power for candidate source locations
• At Okmok, virtually no path effects in the 0.2-0.3 Hz band [Haney, 2010]
• Time shifting based on a homogeneous surface wave velocity model of 2.7 km/s [Masterlark et al., 2010]
16 [Haney, 2014]
O K M O K V O L C A N I C T R E M O R
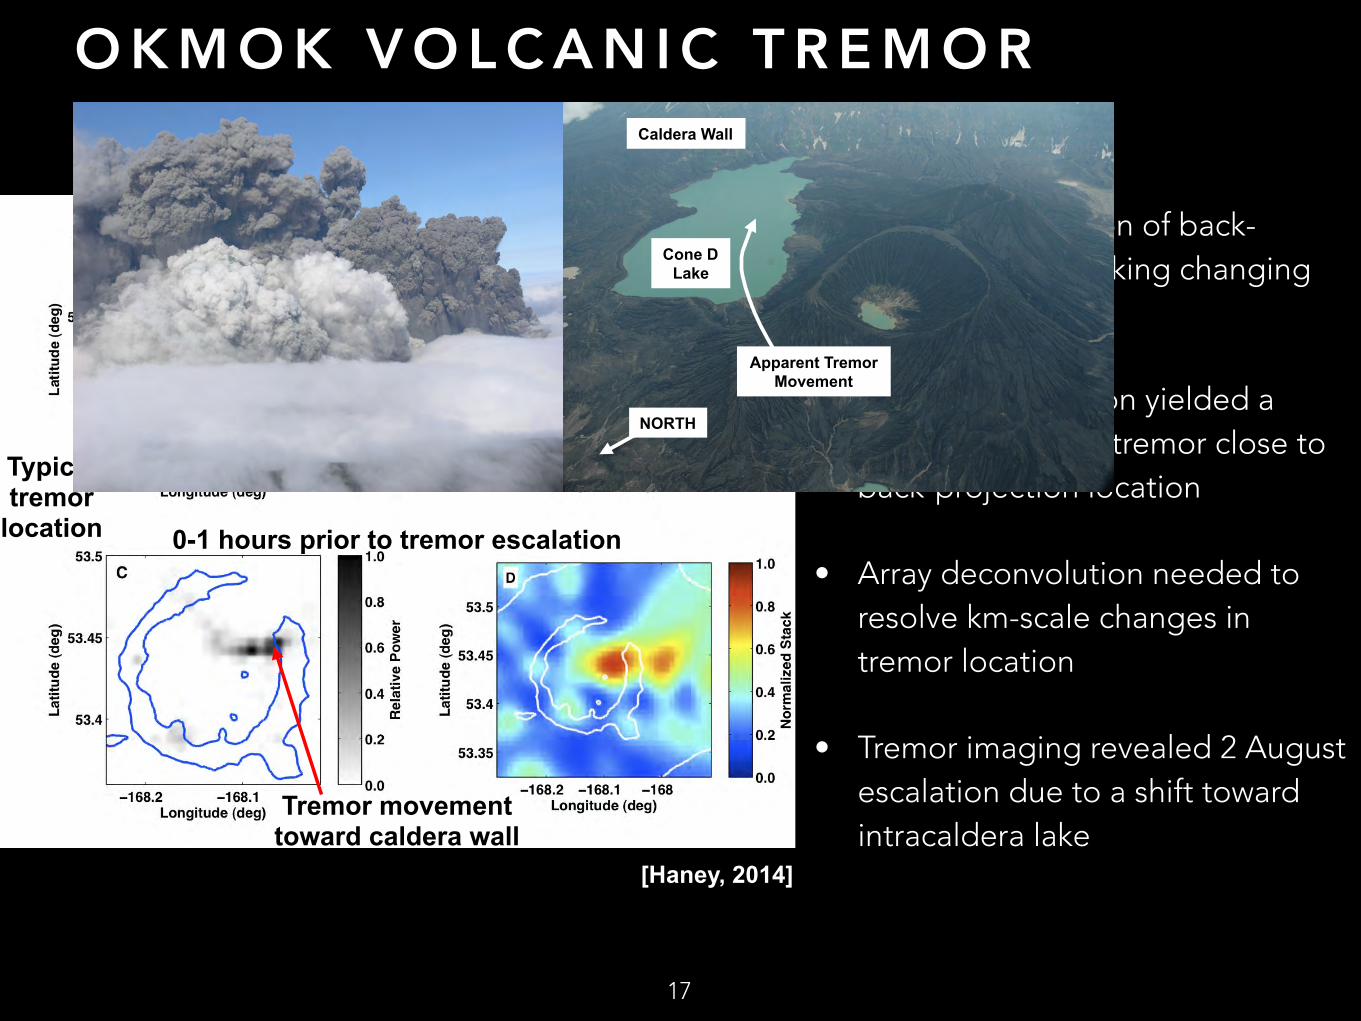
• First demonstration of back-projection for tracking changing volcanic tremor
• Waveform inversion yielded a shallow depth for tremor close to back-projection location
• Array deconvolution needed to resolve km-scale changes in tremor location
• Tremor imaging revealed 2 August escalation due to a shift toward intracaldera lake
17
1-2 hours prior to tremor escalation
0-1 hours prior to tremor escalation
Typical tremor
location
Tremor movement toward caldera wall
[Haney, 2014]
Apparent Tremor Movement
Cone D Lake
Caldera Wall
NORTH
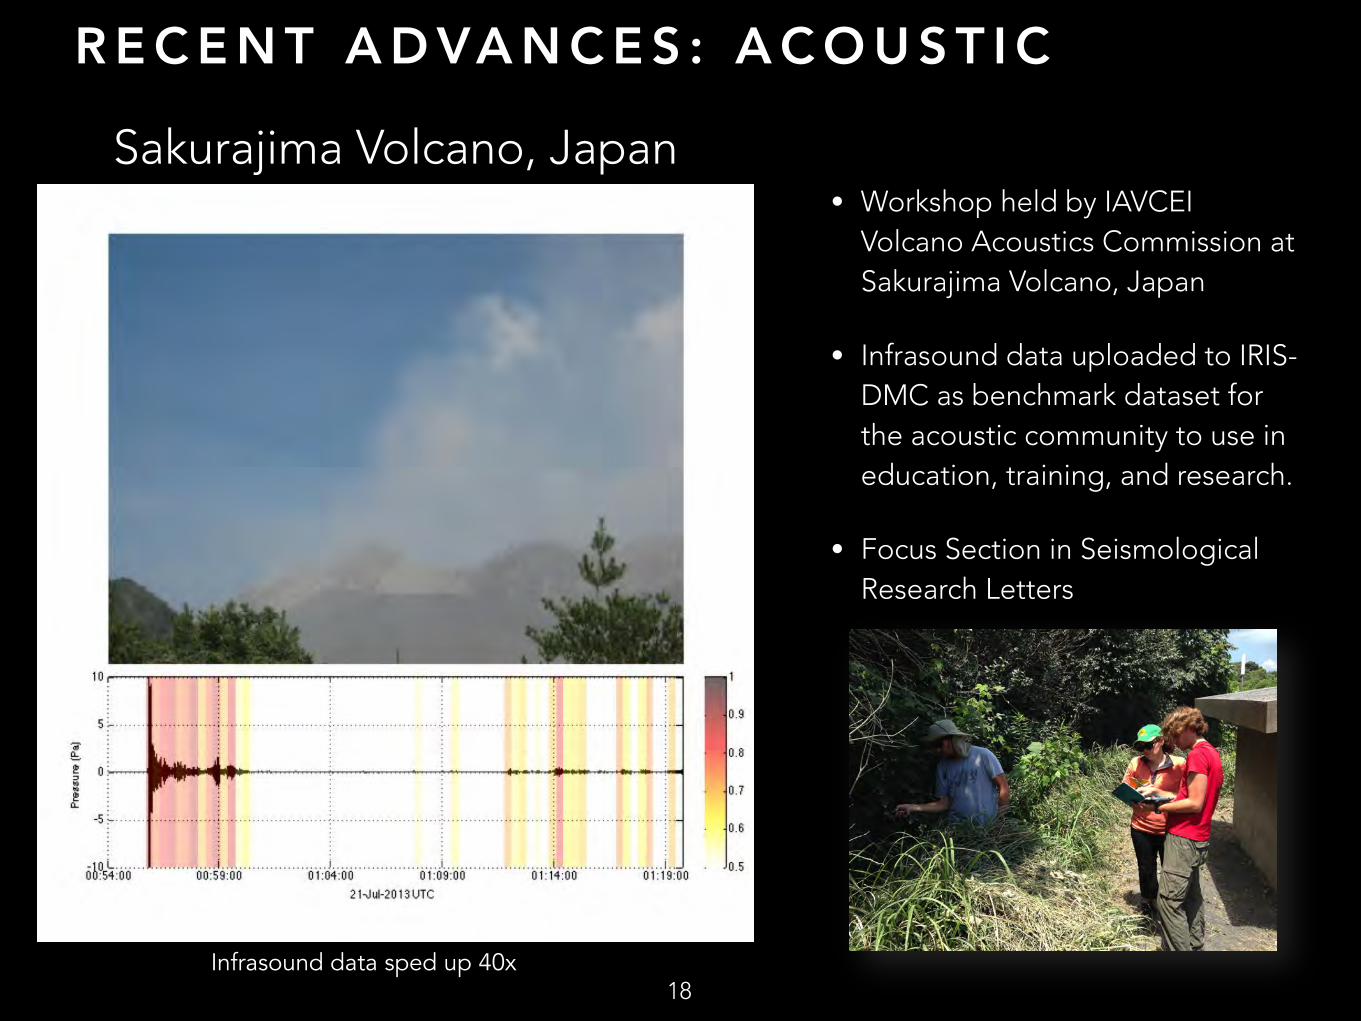
R E C E N T A D VA N C E S : A C O U S T I C
• Workshop held by IAVCEI Volcano Acoustics Commission at Sakurajima Volcano, Japan
• Infrasound data uploaded to IRIS-DMC as benchmark dataset for the acoustic community to use in education, training, and research.
• Focus Section in Seismological Research Letters
18Infrasound data sped up 40x
Sakurajima Volcano, Japan
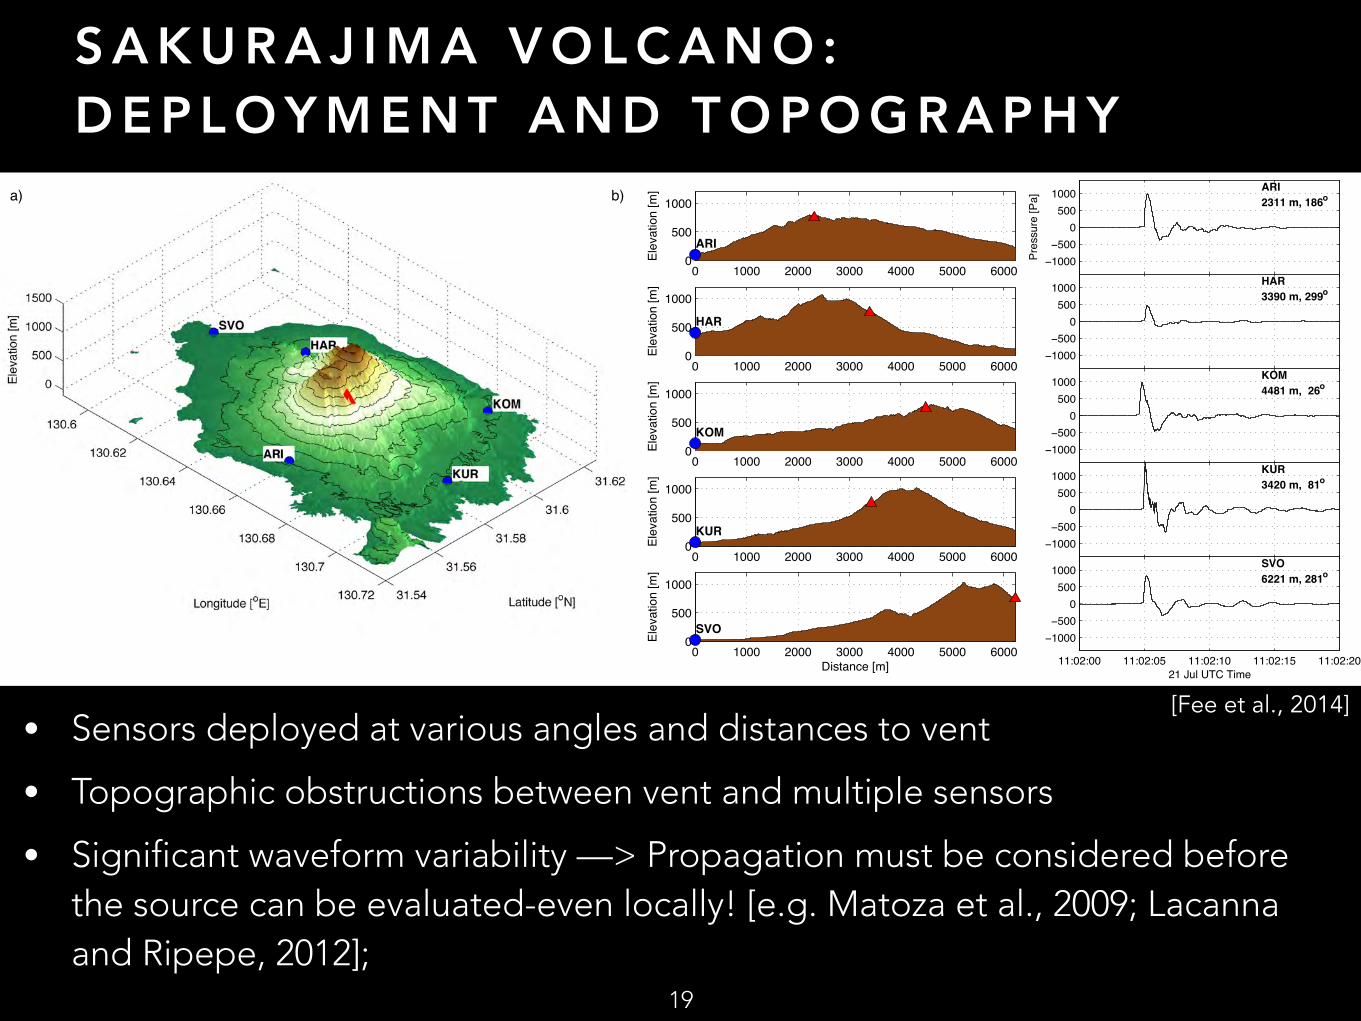
S A K U R A J I M A V O L C A N O : D E P L O Y M E N T A N D T O P O G R A P H Y
• Sensors deployed at various angles and distances to vent
• Topographic obstructions between vent and multiple sensors
• Significant waveform variability —> Propagation must be considered before the source can be evaluated-even locally! [e.g. Matoza et al., 2009; Lacanna and Ripepe, 2012];
19
a) b)
0 1000 2000 3000 4000 5000 60000
500
1000
Elev
atio
n [m
]
ARI
0 1000 2000 3000 4000 5000 60000
500
1000
Elev
atio
n [m
]
HAR
0 1000 2000 3000 4000 5000 60000
500
1000
Elev
atio
n [m
]
KOM
0 1000 2000 3000 4000 5000 60000
500
1000
Elev
atio
n [m
]
KUR
0 1000 2000 3000 4000 5000 60000
500
1000
Elev
atio
n [m
]
SVO
Distance [m]
−1000−500
0500
1000 ARI2311 m, 186o
Pres
sure
[Pa]
−1000−500
0500
1000 HAR3390 m, 299o
−1000−500
0500
1000 KOM4481 m, 26o
−1000−500
0500
1000 KUR3420 m, 81o
11:02:00 11:02:05 11:02:10 11:02:15 11:02:20
−1000−500
0500
1000 SVO6221 m, 281o
21 Jul UTC Time
[Fee et al., 2014]
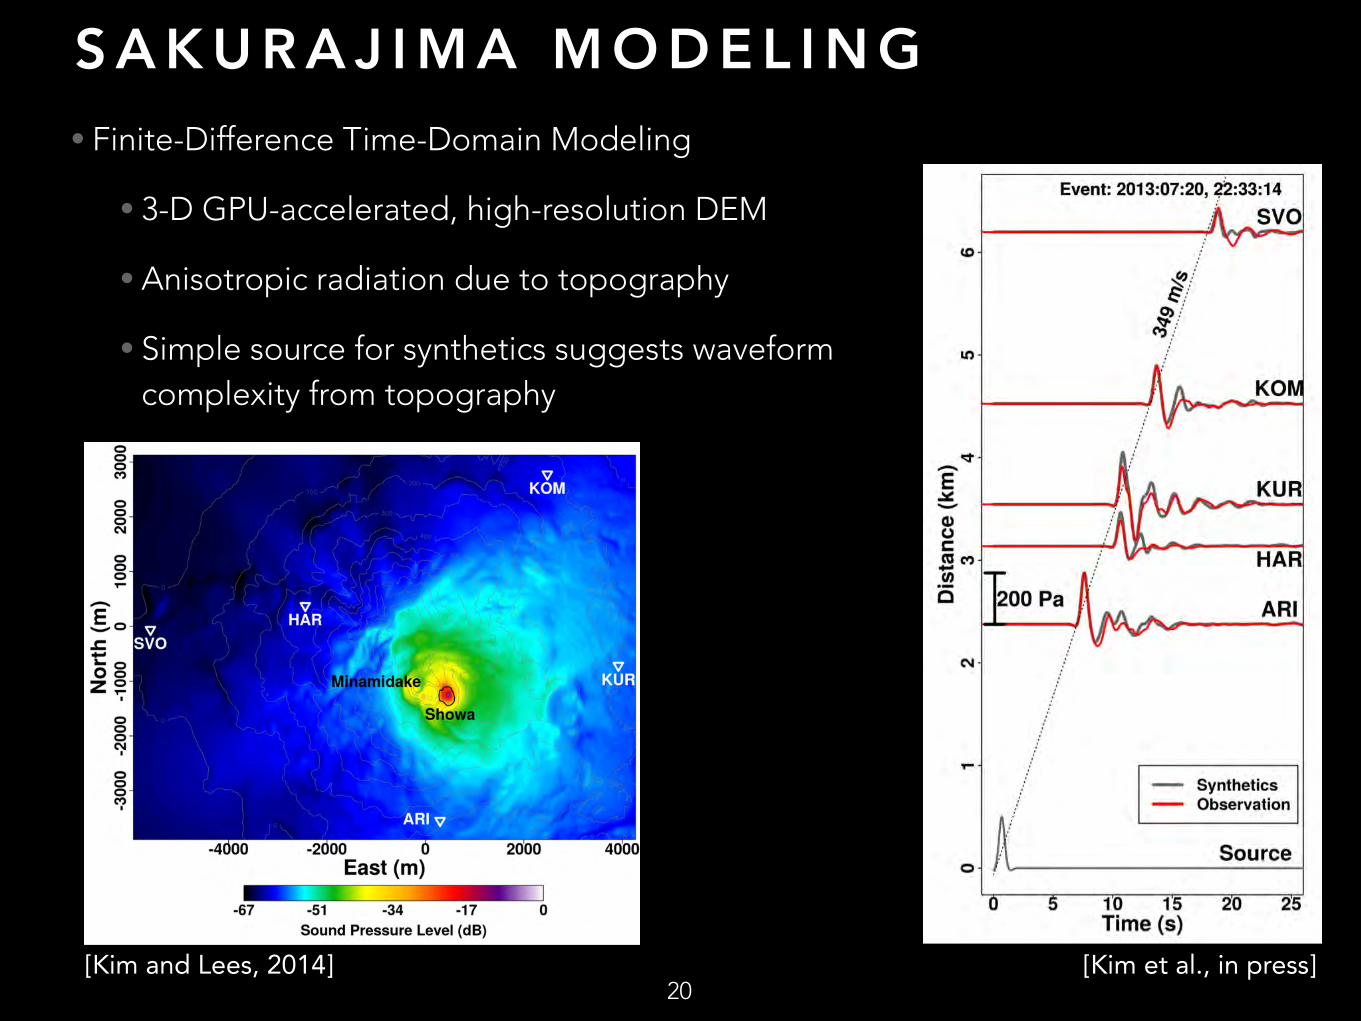
S A K U R A J I M A M O D E L I N G• Finite-Difference Time-Domain Modeling
• 3-D GPU-accelerated, high-resolution DEM
• Anisotropic radiation due to topography
• Simple source for synthetics suggests waveform complexity from topography
20[Kim et al., in press][Kim and Lees, 2014]
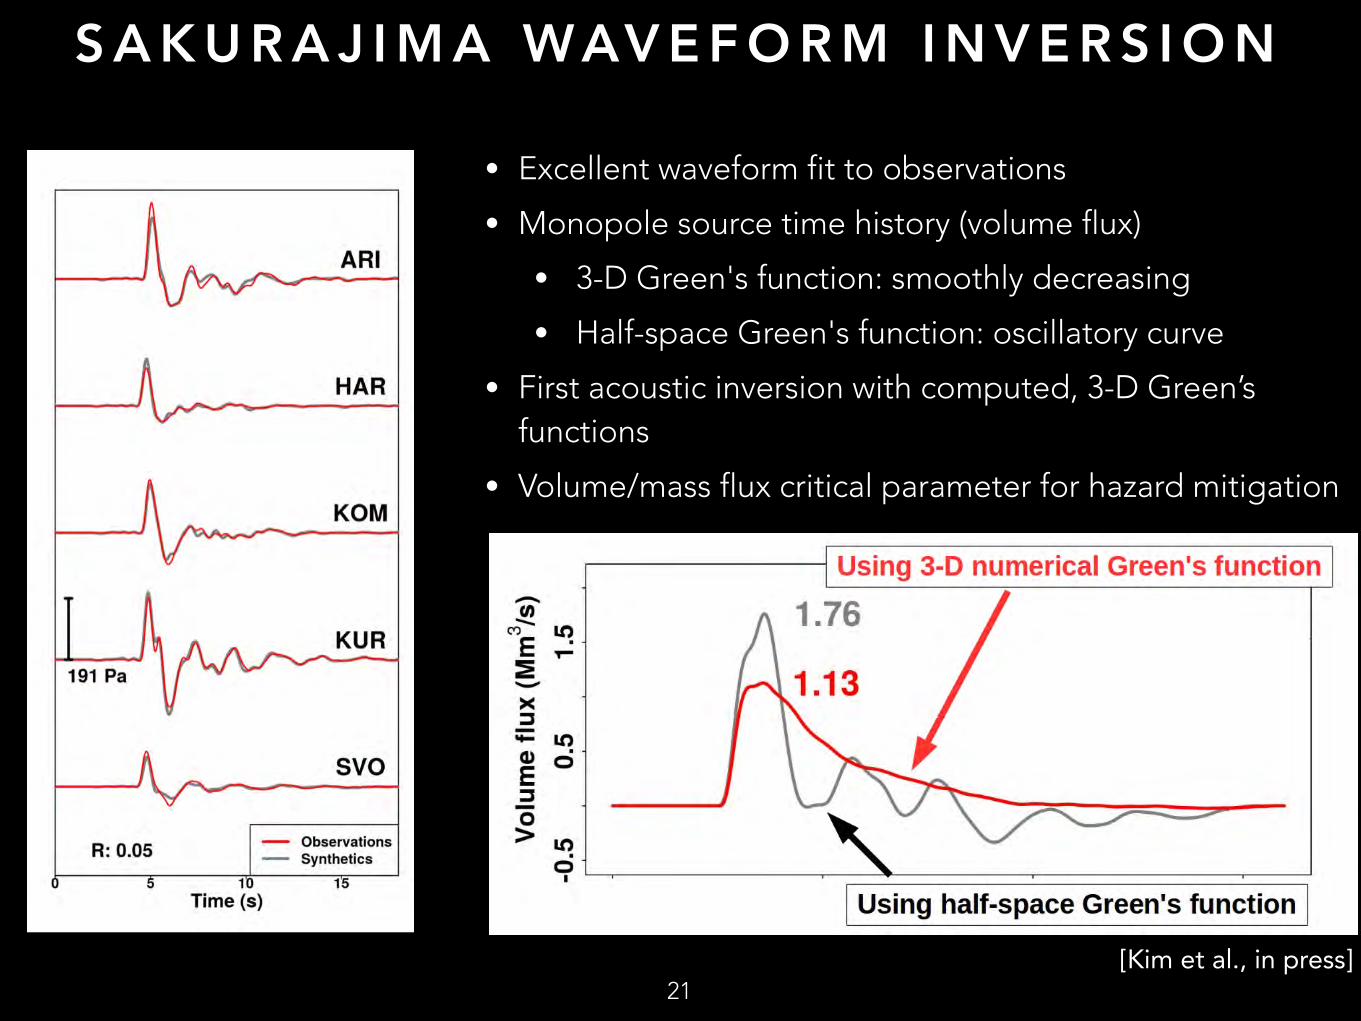
S A K U R A J I M A WAV E F O R M I N V E R S I O N
• Excellent waveform fit to observations
• Monopole source time history (volume flux)
• 3-D Green's function: smoothly decreasing
• Half-space Green's function: oscillatory curve
• First acoustic inversion with computed, 3-D Green’s functions
• Volume/mass flux critical parameter for hazard mitigation
21[Kim et al., in press]
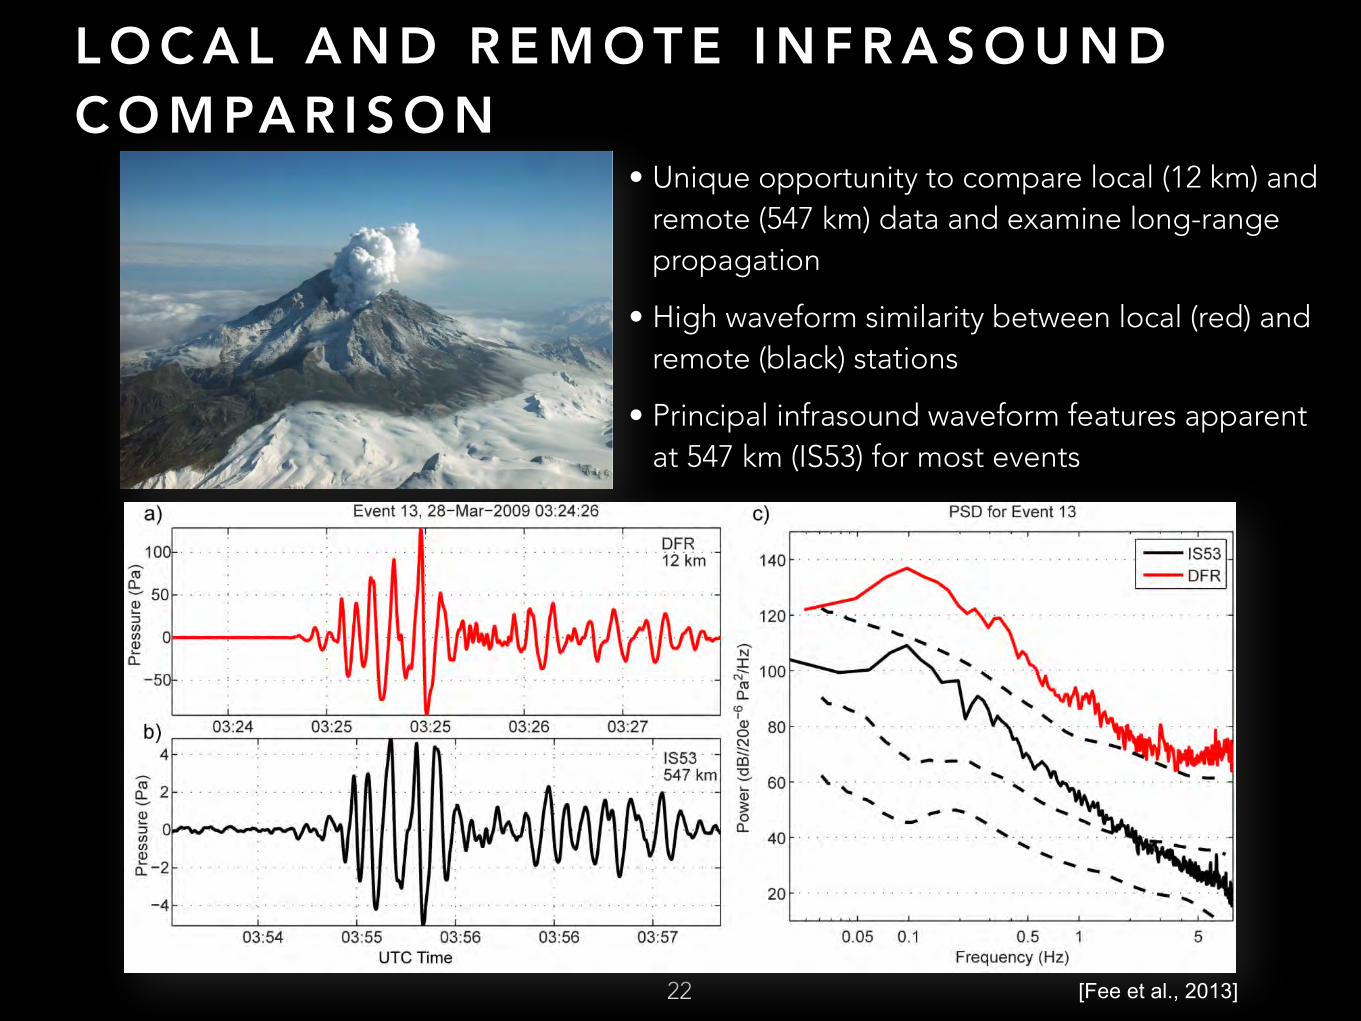
L O C A L A N D R E M O T E I N F R A S O U N D C O M PA R I S O N
22
• Unique opportunity to compare local (12 km) and remote (547 km) data and examine long-range propagation
• High waveform similarity between local (red) and remote (black) stations
• Principal infrasound waveform features apparent at 547 km (IS53) for most events
[Fee et al., 2013]
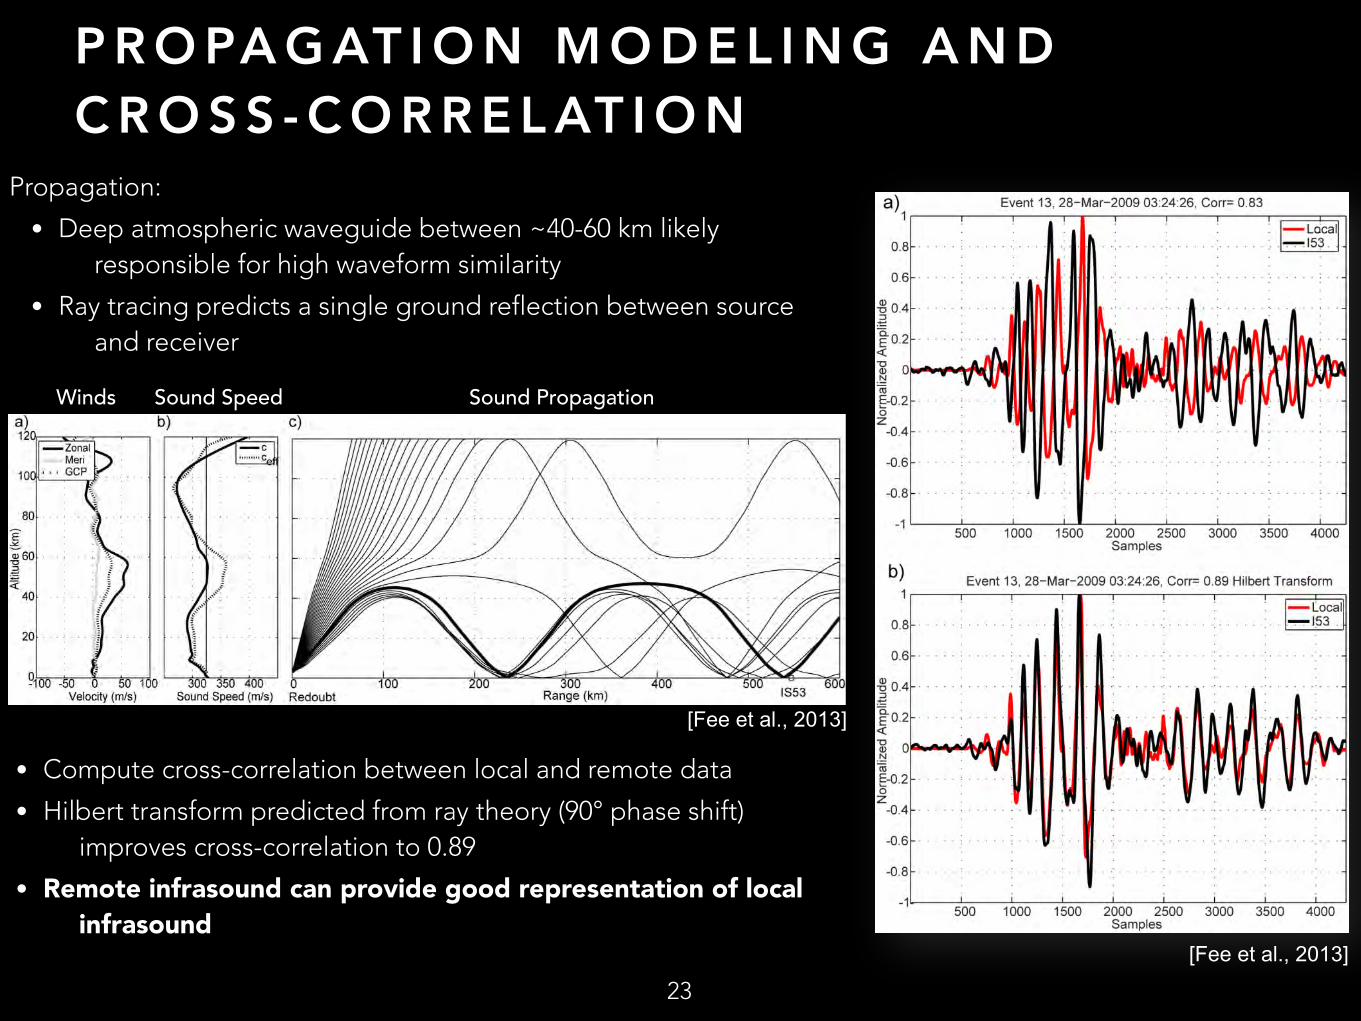
P R O PA G AT I O N M O D E L I N G A N D C R O S S - C O R R E L AT I O N
• Propagation:
• Deep atmospheric waveguide between ~40-60 km likely responsible for high waveform similarity
• Ray tracing predicts a single ground reflection between source and receiver
[Fee et al., 2013]
23
[Fee et al., 2013]
Winds Sound Speed Sound Propagation
• Compute cross-correlation between local and remote data
• Hilbert transform predicted from ray theory (90° phase shift) improves cross-correlation to 0.89
• Remote infrasound can provide good representation of local infrasound
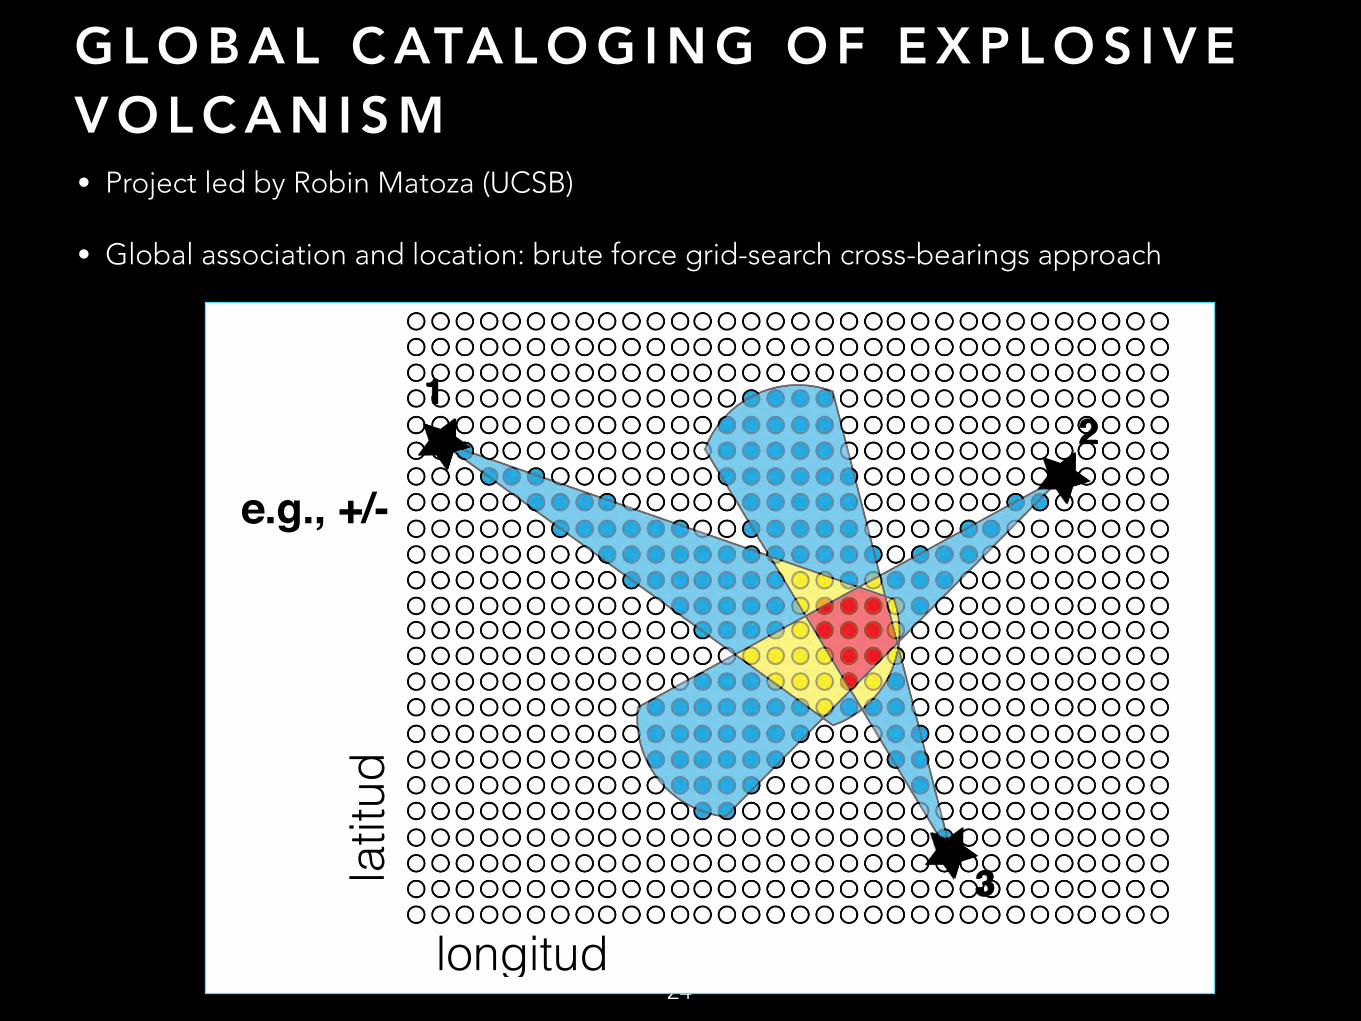
G L O B A L C ATA L O G I N G O F E X P L O S I V E V O L C A N I S M• Project led by Robin Matoza (UCSB)
• Global association and location: brute force grid-search cross-bearings approach
24
e.g., +/-
longitud
latitud
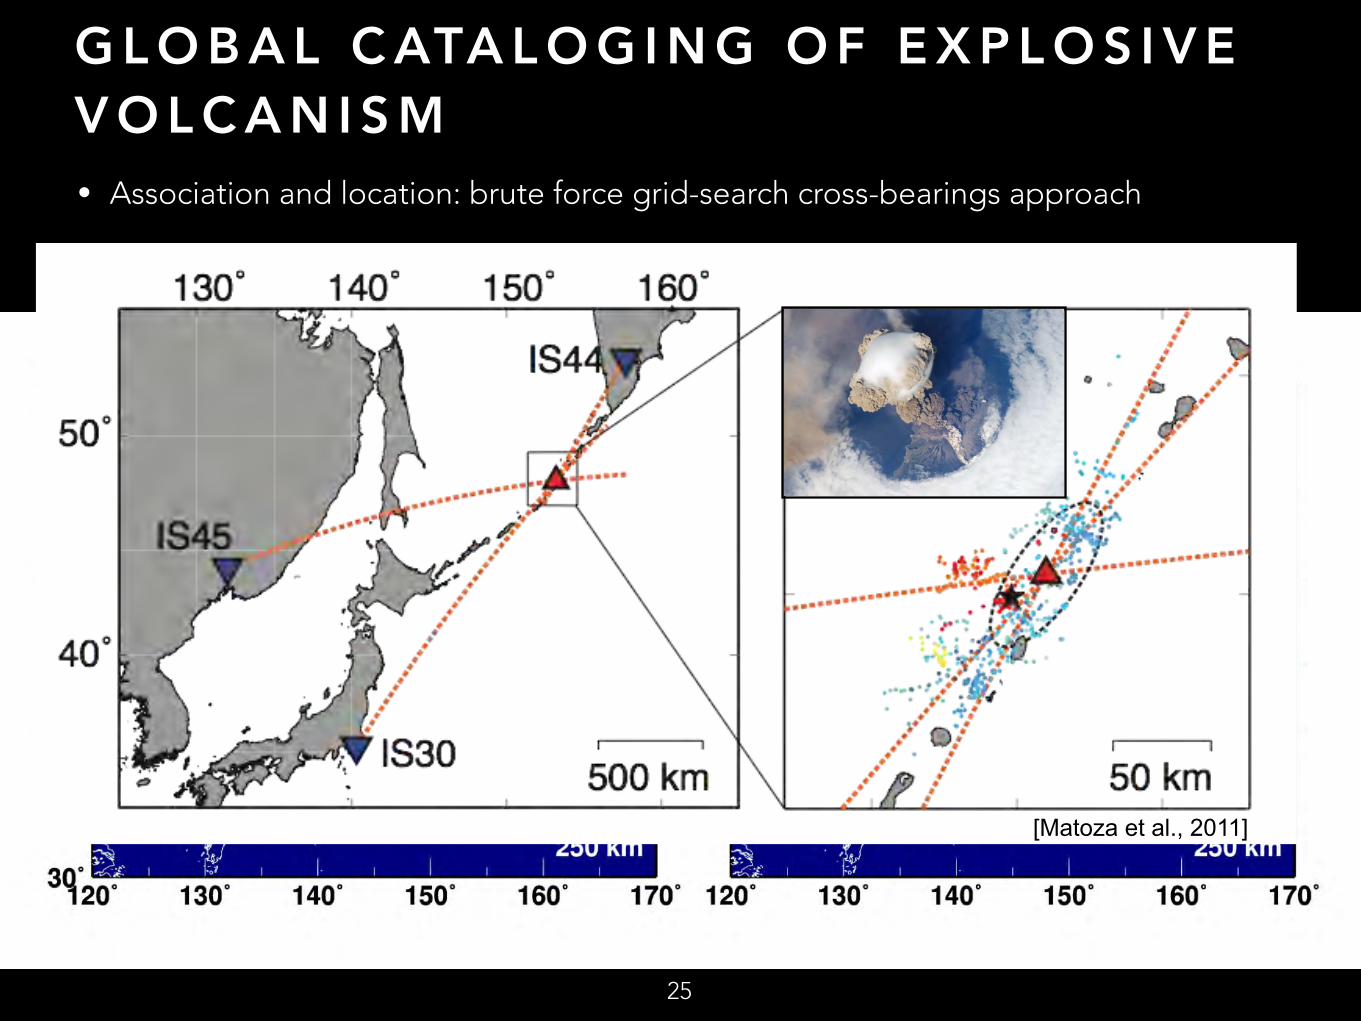
G L O B A L C ATA L O G I N G O F E X P L O S I V E V O L C A N I S M• Association and location: brute force grid-search cross-bearings approach
• Example: Sarychev Peak, 2009
25
[Matoza et al., 2011]
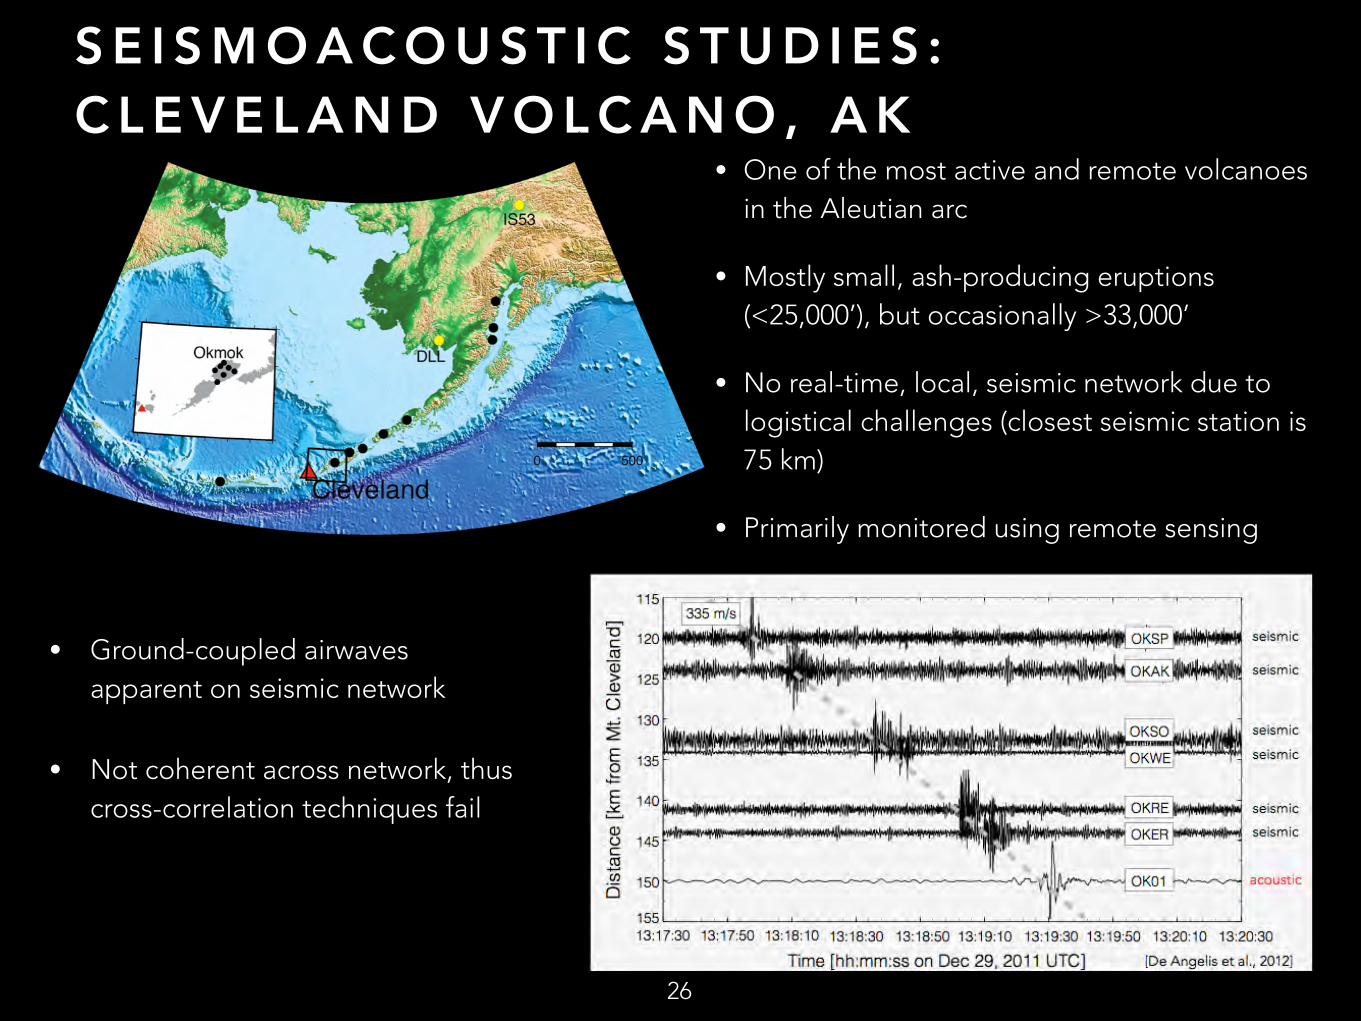
S E I S M O A C O U S T I C S T U D I E S : C L E V E L A N D V O L C A N O , A K
• One of the most active and remote volcanoes in the Aleutian arc
• Mostly small, ash-producing eruptions (<25,000’), but occasionally >33,000’
• No real-time, local, seismic network due to logistical challenges (closest seismic station is 75 km)
• Primarily monitored using remote sensing
OKAKS
26
• Ground-coupled airwaves apparent on seismic network
• Not coherent across network, thus cross-correlation techniques fail
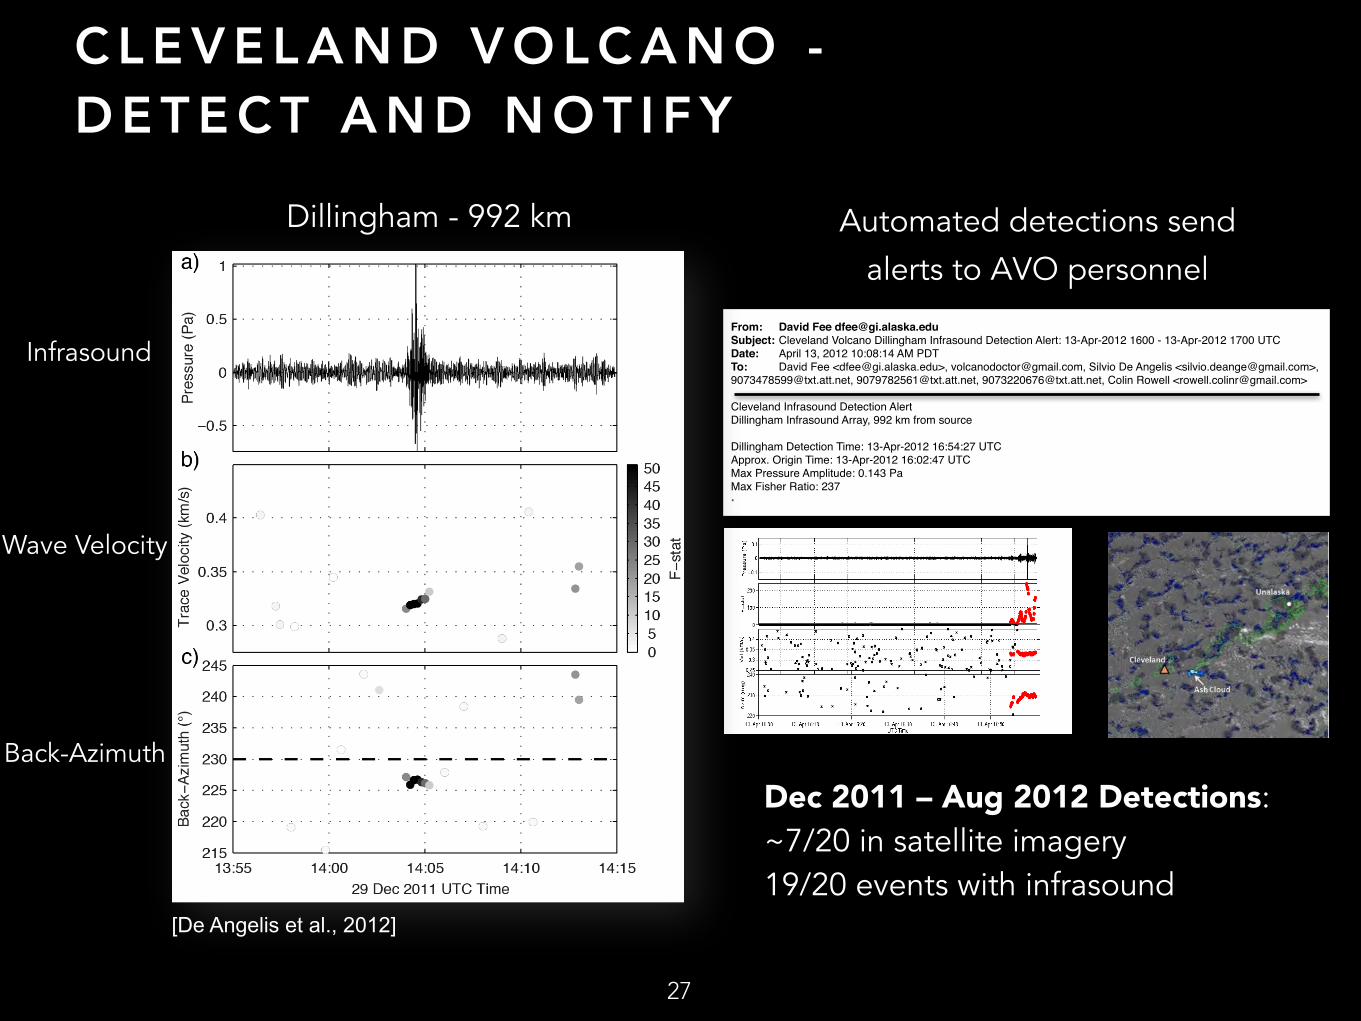
C L E V E L A N D V O L C A N O - D E T E C T A N D N O T I F Y
From: David Fee [email protected]: Cleveland Volcano Dillingham Infrasound Detection Alert: 13-Apr-2012 1600 - 13-Apr-2012 1700 UTCDate: April 13, 2012 10:08:14 AM PDTTo: David Fee <[email protected]>, [email protected], Silvio De Angelis <[email protected]>, [email protected], [email protected], [email protected], Colin Rowell <[email protected]> Cleveland Infrasound Detection AlertDillingham Infrasound Array, 992 km from source
Dillingham Detection Time: 13-Apr-2012 16:54:27 UTCApprox. Origin Time: 13-Apr-2012 16:02:47 UTCMax Pressure Amplitude: 0.143 PaMax Fisher Ratio: 237•
27
Dillingham - 992 km
Infrasound
Wave Velocity
Back-Azimuth
Automated detections send alerts to AVO personnel
Dec 2011 – Aug 2012 Detections: ~7/20 in satellite imagery 19/20 events with infrasound
[De Angelis et al., 2012]
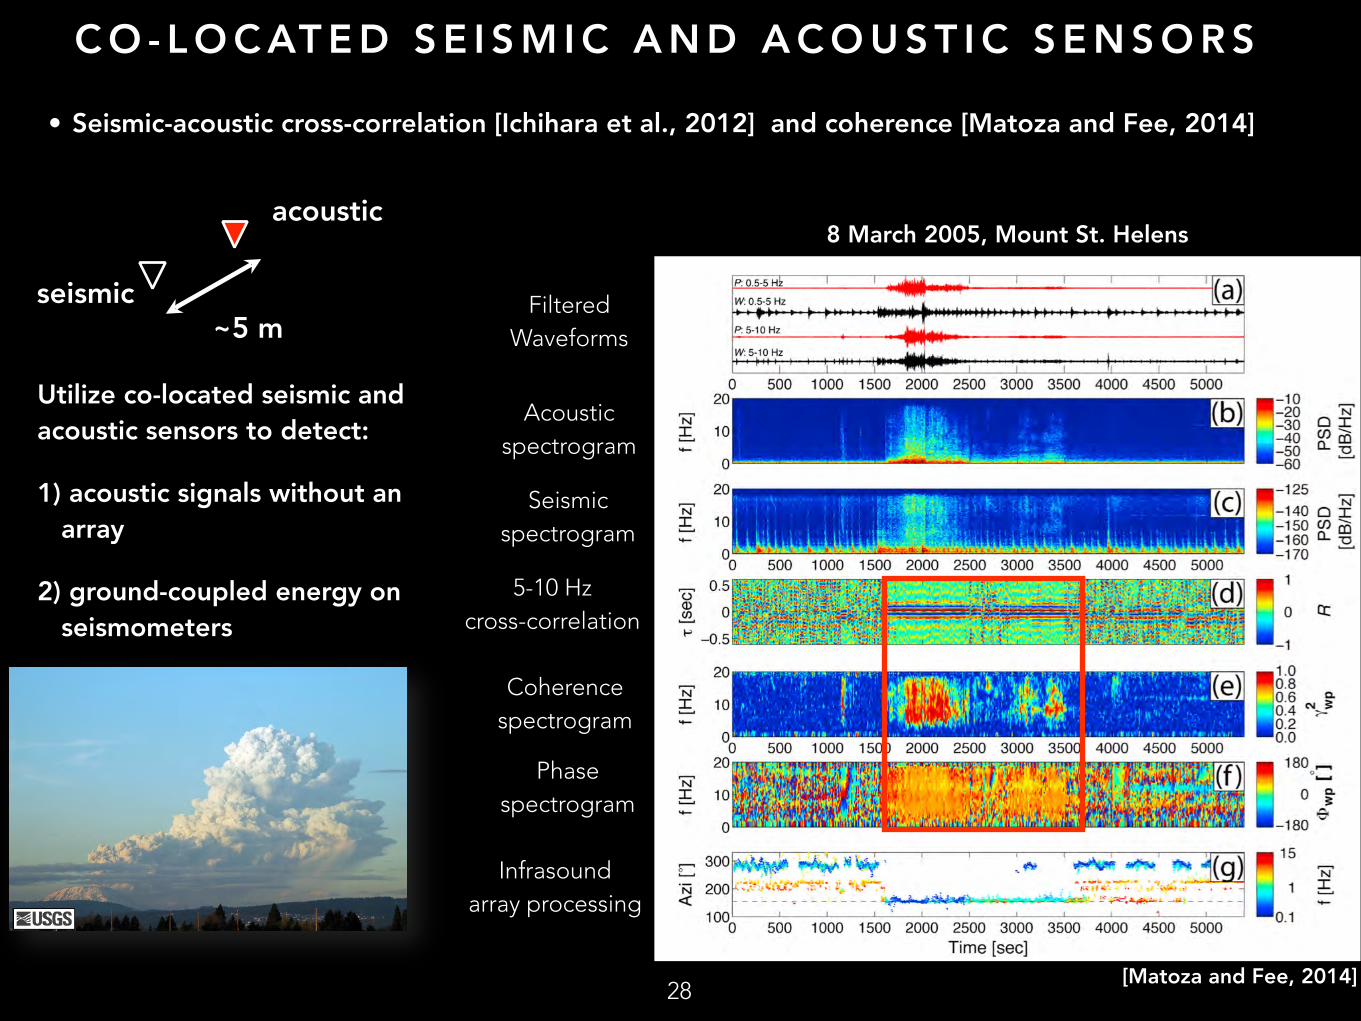
C O - L O C AT E D S E I S M I C A N D A C O U S T I C S E N S O R S
Filtered Waveforms
Acoustic spectrogram
Seismic spectrogram
5-10 Hz cross-correlation
Coherence spectrogram
Phase spectrogram
Infrasound array processing
28
~5 m
acoustic
seismic
[Matoza and Fee, 2014]
• Seismic-acoustic cross-correlation [Ichihara et al., 2012] and coherence [Matoza and Fee, 2014]
Utilize co-located seismic and acoustic sensors to detect:
1) acoustic signals without an array
2) ground-coupled energy on seismometers
8 March 2005, Mount St. Helens
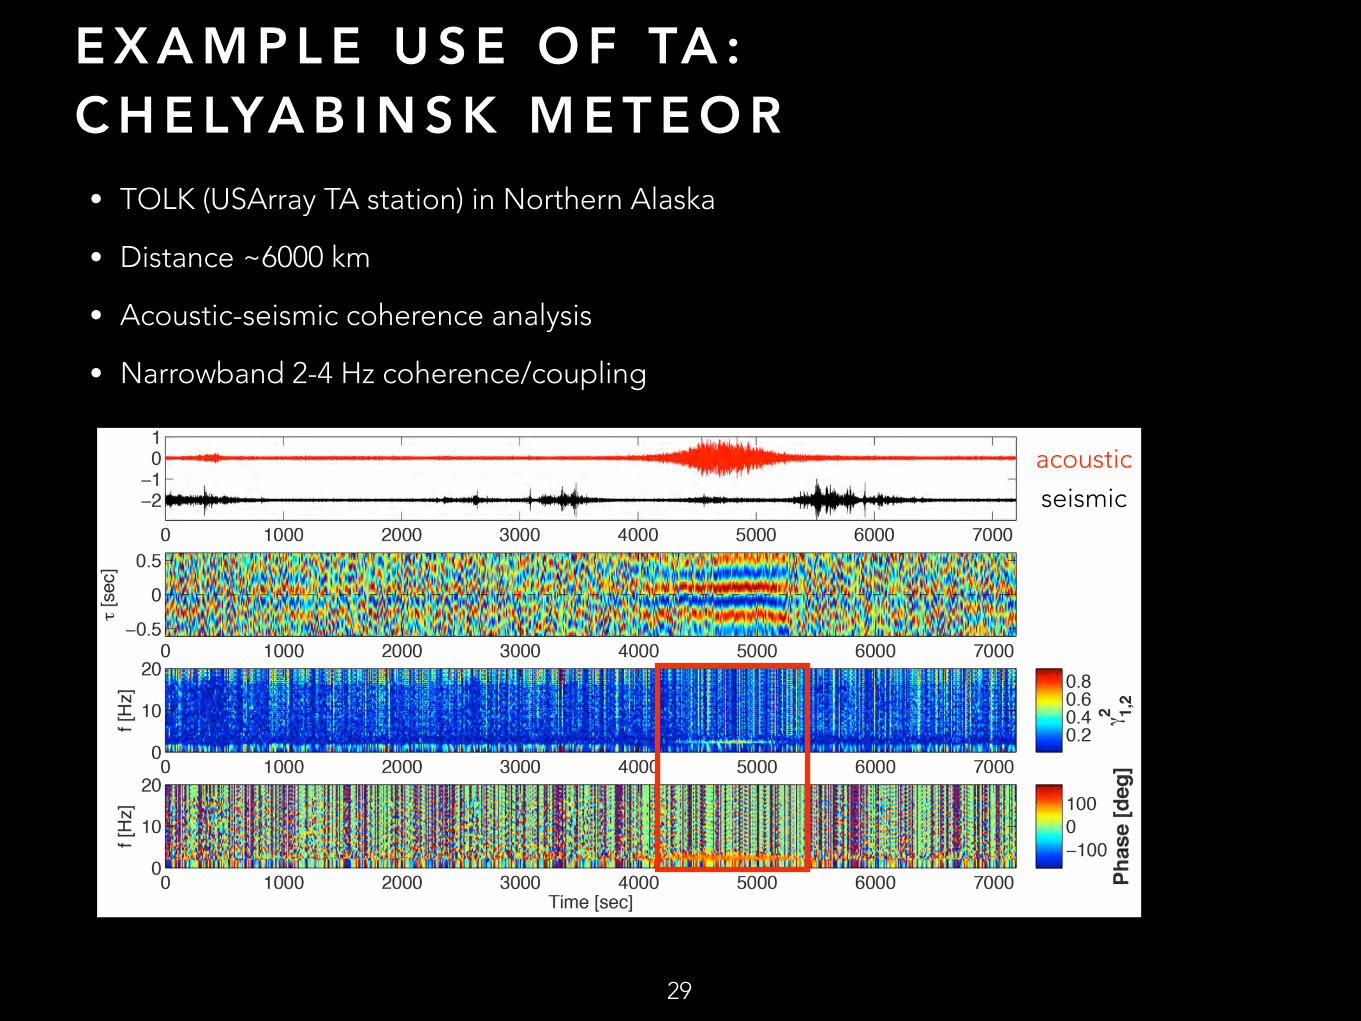
E X A M P L E U S E O F TA : C H E LYA B I N S K M E T E O R
• TOLK (USArray TA station) in Northern Alaska
• Distance ~6000 km
• Acoustic-seismic coherence analysis
• Narrowband 2-4 Hz coherence/coupling
29
acousticseismic
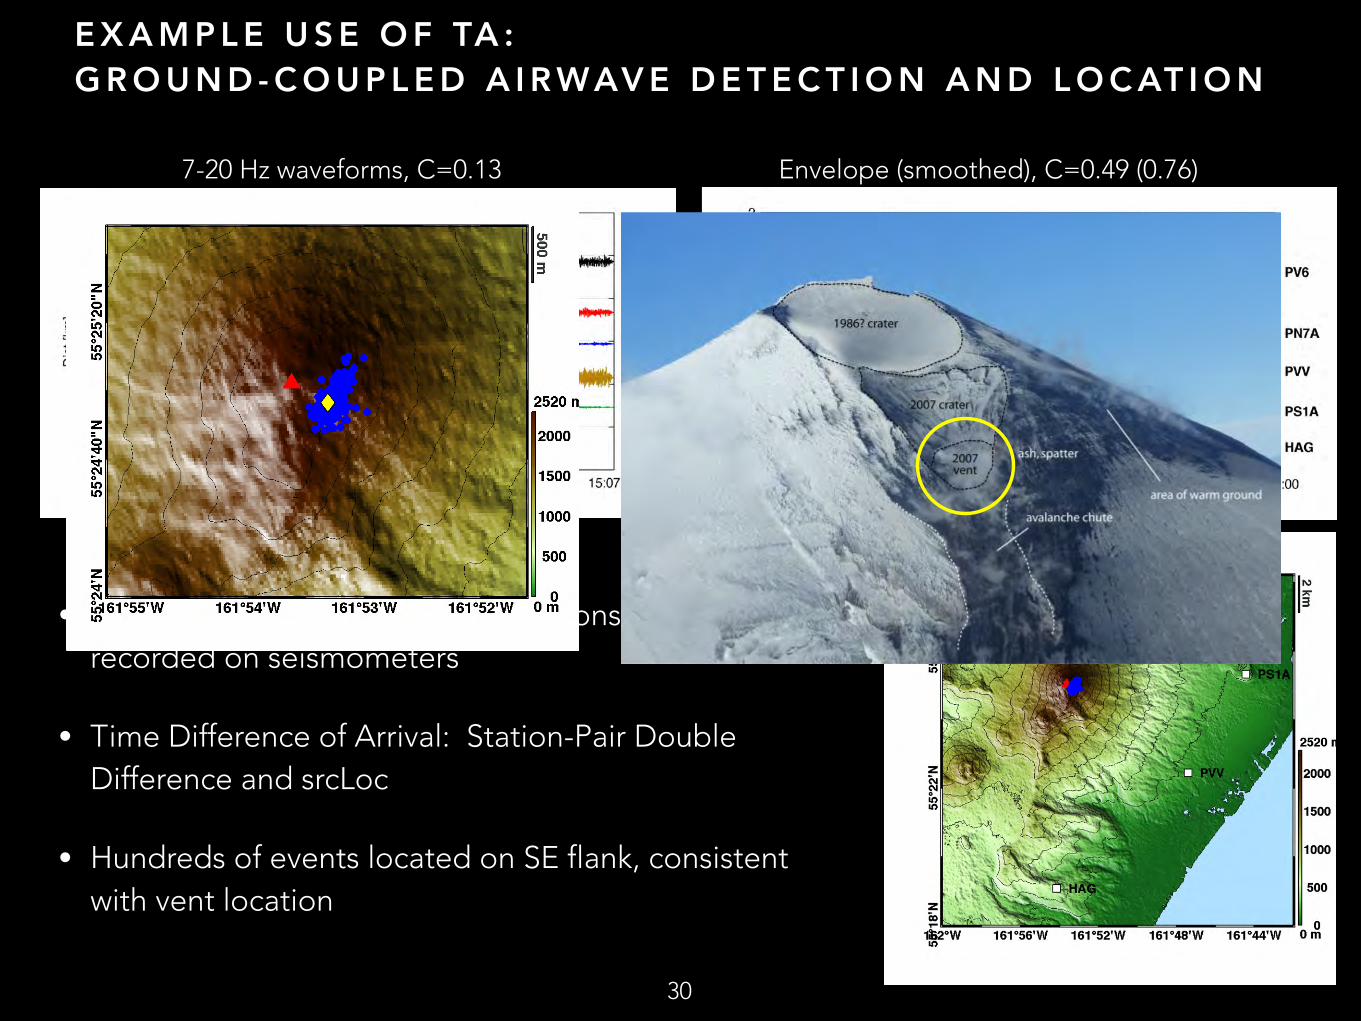
E X A M P L E U S E O F TA : G R O U N D - C O U P L E D A I R WAV E D E T E C T I O N A N D L O C AT I O N
• Pavlof: acoustic waves from explosions commonly recorded on seismometers
• Time Difference of Arrival: Station-Pair Double Difference and srcLoc
• Hundreds of events located on SE flank, consistent with vent location
30
7-20 Hz waveforms, C=0.13 Envelope (smoothed), C=0.49 (0.76)
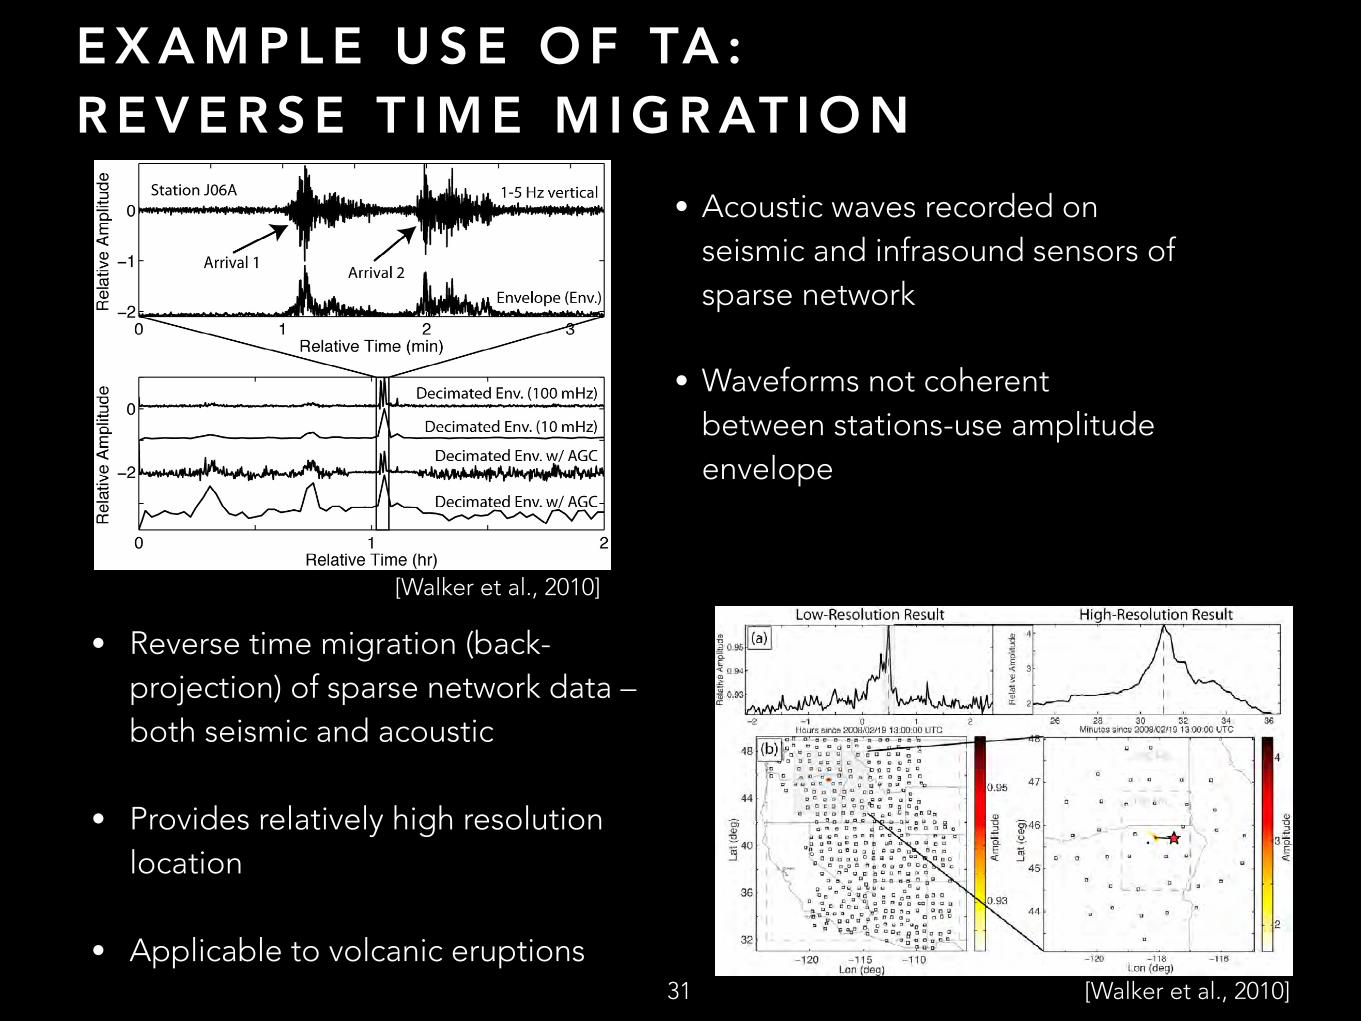
E X A M P L E U S E O F TA : R E V E R S E T I M E M I G R AT I O N
31
• Acoustic waves recorded on seismic and infrasound sensors of sparse network
• Waveforms not coherent between stations-use amplitude envelope
• Reverse time migration (back-projection) of sparse network data – both seismic and acoustic
• Provides relatively high resolution location
• Applicable to volcanic eruptions
[Walker et al., 2010]
[Walker et al., 2010]
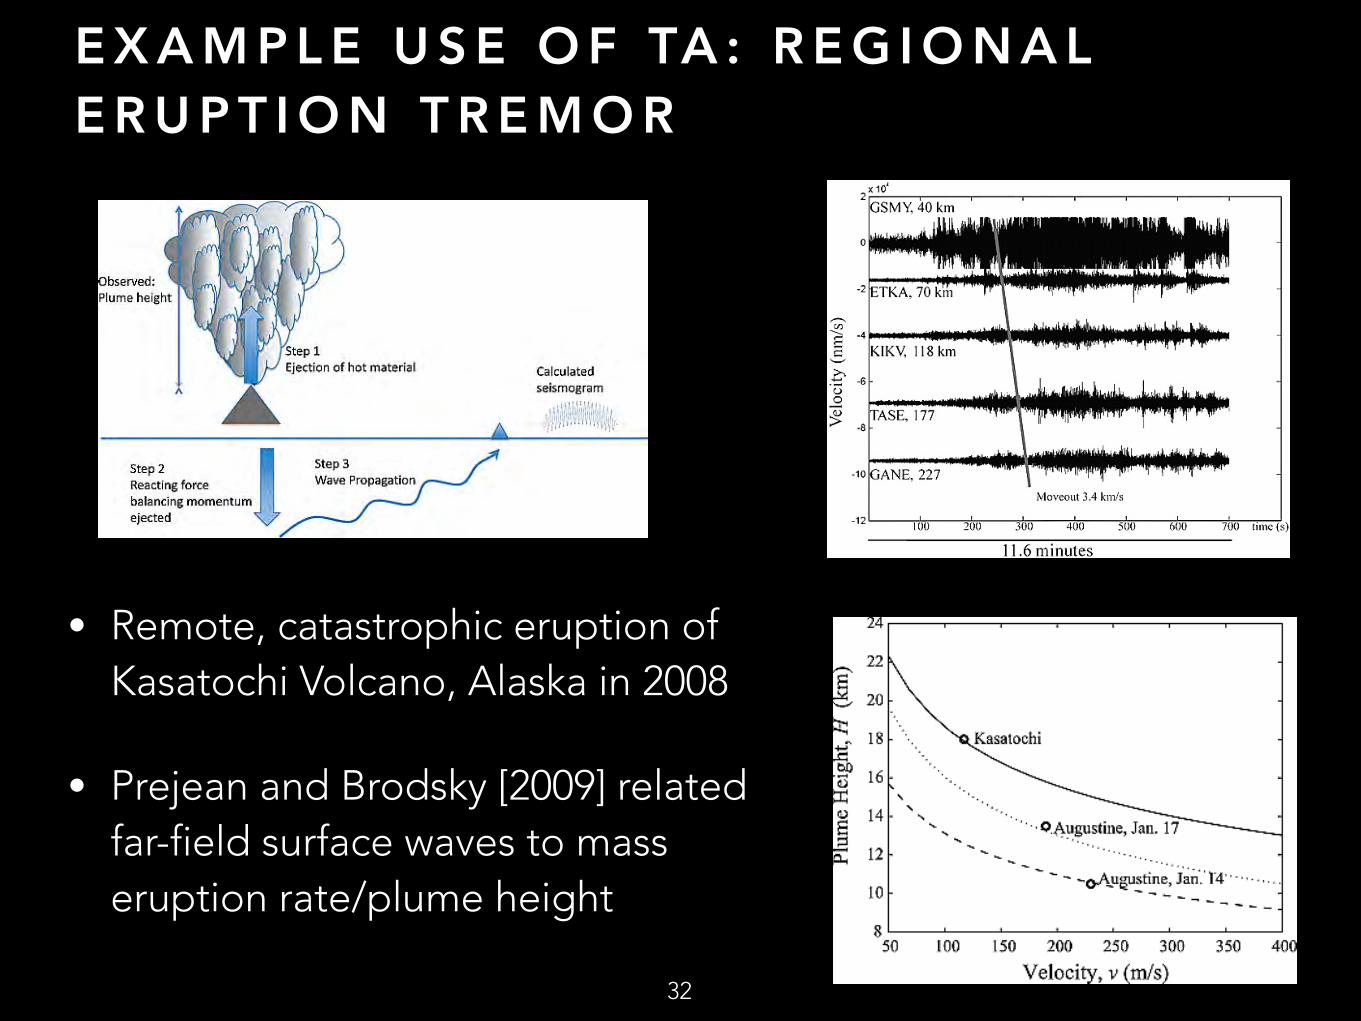
E X A M P L E U S E O F TA : R E G I O N A L E R U P T I O N T R E M O R
32
• Remote, catastrophic eruption of Kasatochi Volcano, Alaska in 2008
• Prejean and Brodsky [2009] related far-field surface waves to mass eruption rate/plume height
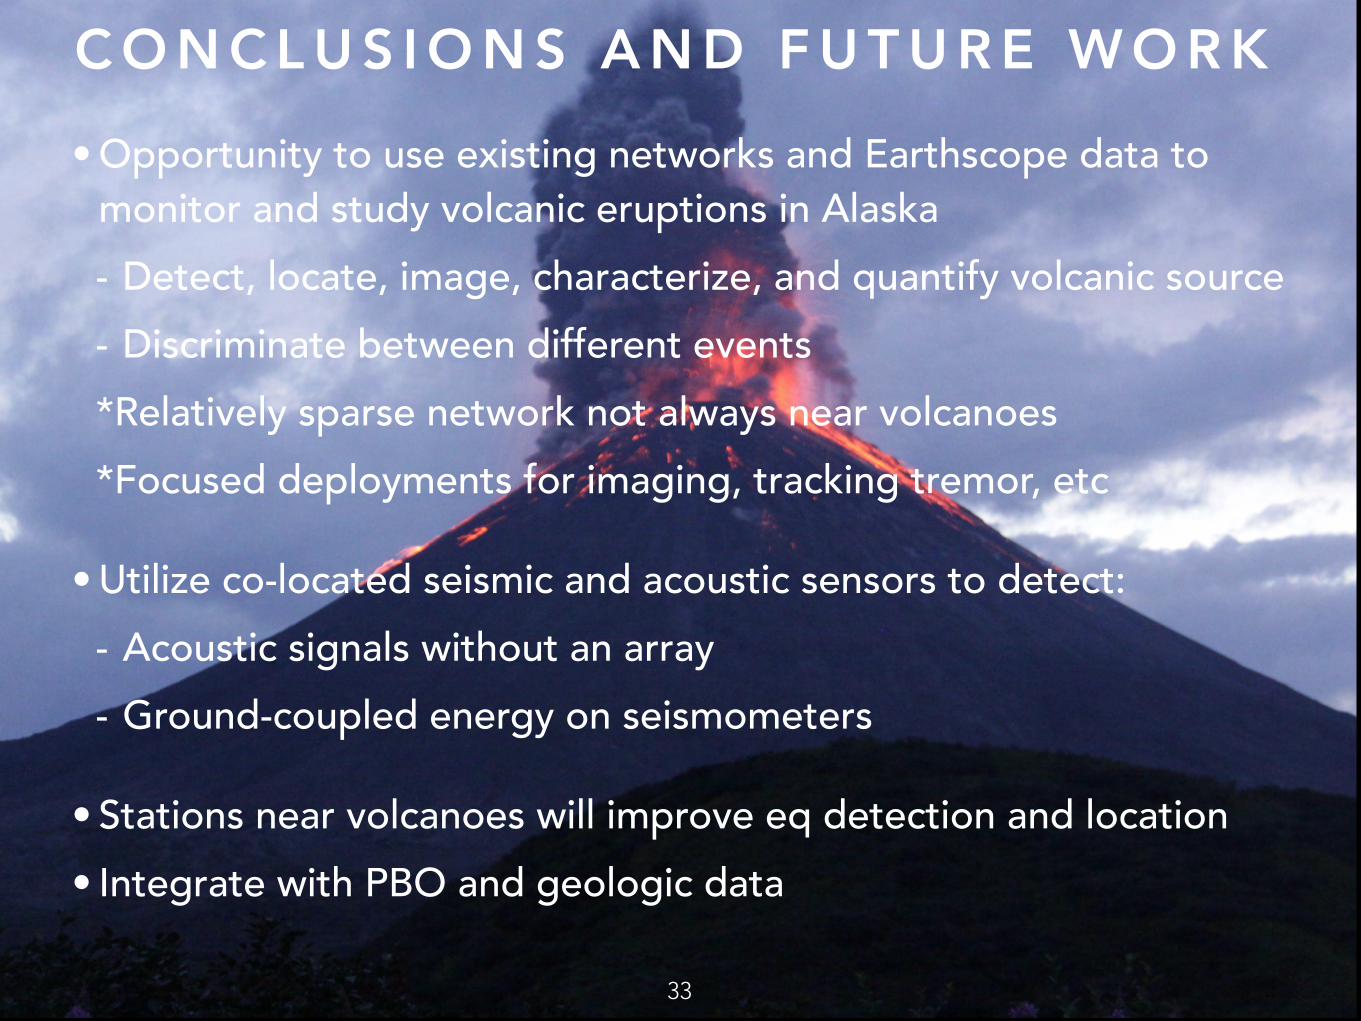
C O N C L U S I O N S A N D F U T U R E W O R K
33
• Opportunity to use existing networks and Earthscope data to monitor and study volcanic eruptions in Alaska - Detect, locate, image, characterize, and quantify volcanic source - Discriminate between different events *Relatively sparse network not always near volcanoes *Focused deployments for imaging, tracking tremor, etc
• Utilize co-located seismic and acoustic sensors to detect: - Acoustic signals without an array - Ground-coupled energy on seismometers
• Stations near volcanoes will improve eq detection and location • Integrate with PBO and geologic data