Embed Size (px)
Citation preview

Recent Developments in Predicting El Nino and the Implications for Insurers
Agus Santoso, Alexander Pui, Tim Andrews
© UNSW Climate Change Research Centre, Finity Consulting, IAG
This presentation has been prepared for the Actuaries Institute 2014 General Insurance Seminar. The Institute Council wishes it to be understood that opinions put forward herein are not necessarily those of the Institute and the Council is not responsible for those
opinions.
Introduction
Latest in the science
Weather cycles and claims costs
Implications for property insurers
Science of Weather Cycles Latest developments in the…
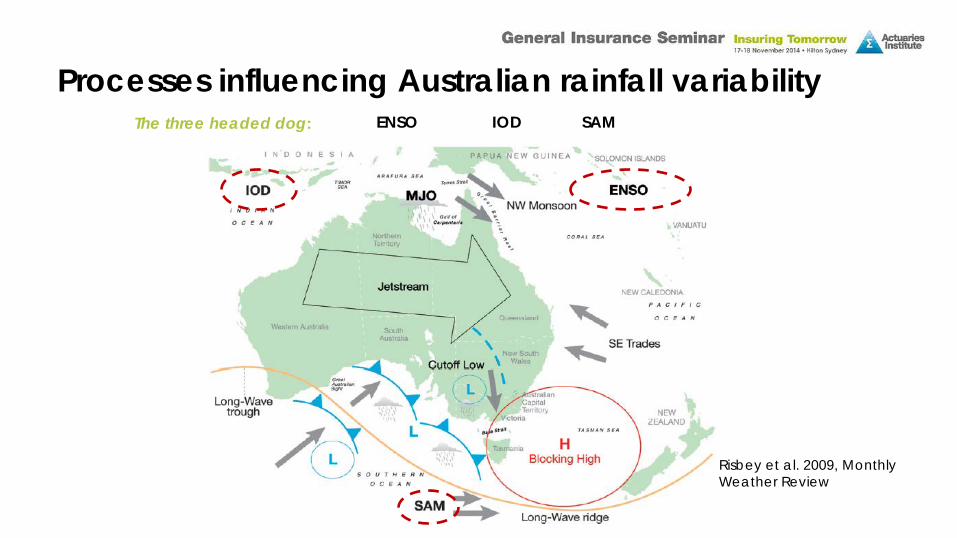
Processes influencing Australian rainfall variability ENSO IOD SAM The three headed dog:
Risbey et al. 2009, Monthly Weather Review

El Nino Southern Oscillation (ENSO) La Nina/normal condition El Niño condition
NINO3.4 ENSO peaks in austral summer. Impacts can be significantly felt in winter and spring.
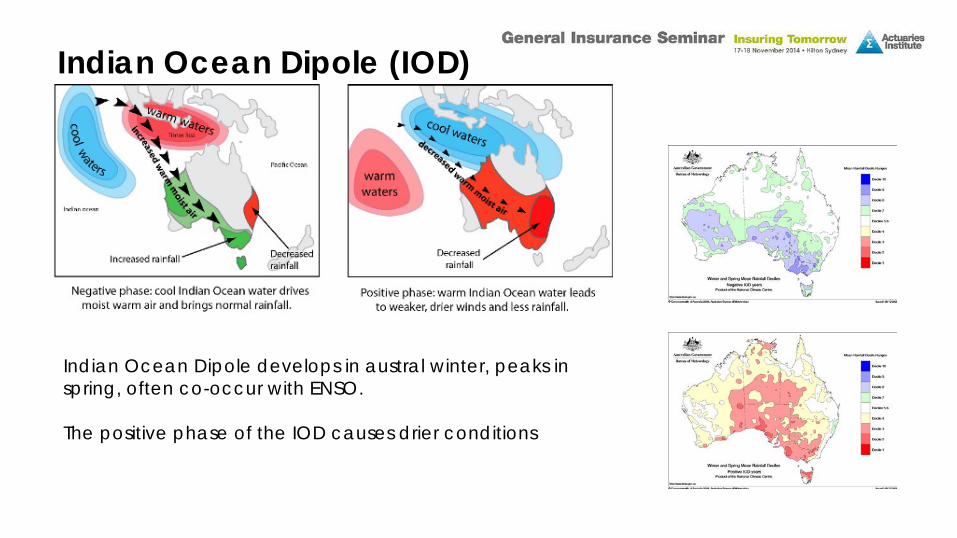
Indian Ocean Dipole (IOD)
Indian Ocean Dipole develops in austral winter, peaks in spring, often co-occur with ENSO. The positive phase of the IOD causes drier conditions
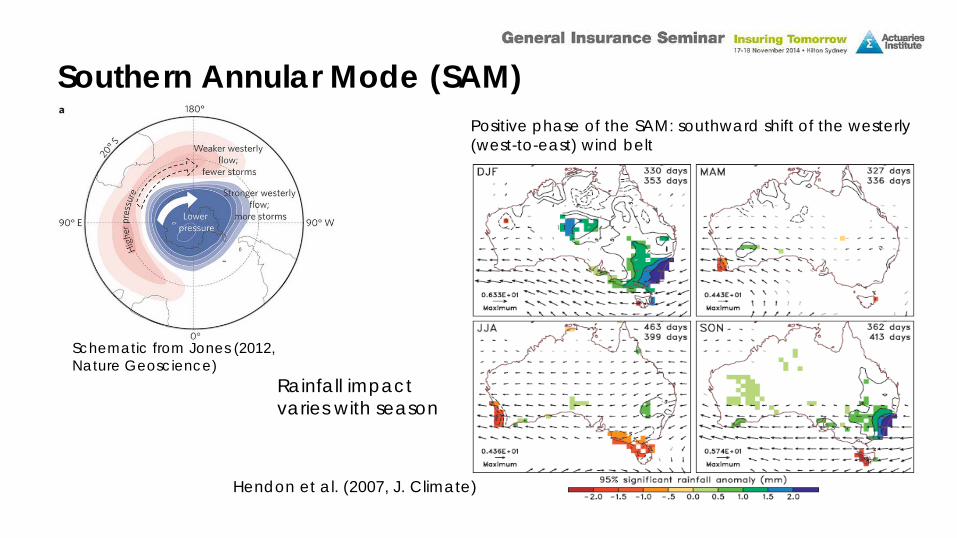
Positive phase of the SAM: southward shift of the westerly (west-to-east) wind belt
Rainfall impact varies with season
Hendon et al. (2007, J. Climate)
Schematic from Jones (2012, Nature Geoscience)
Southern Annular Mode (SAM)
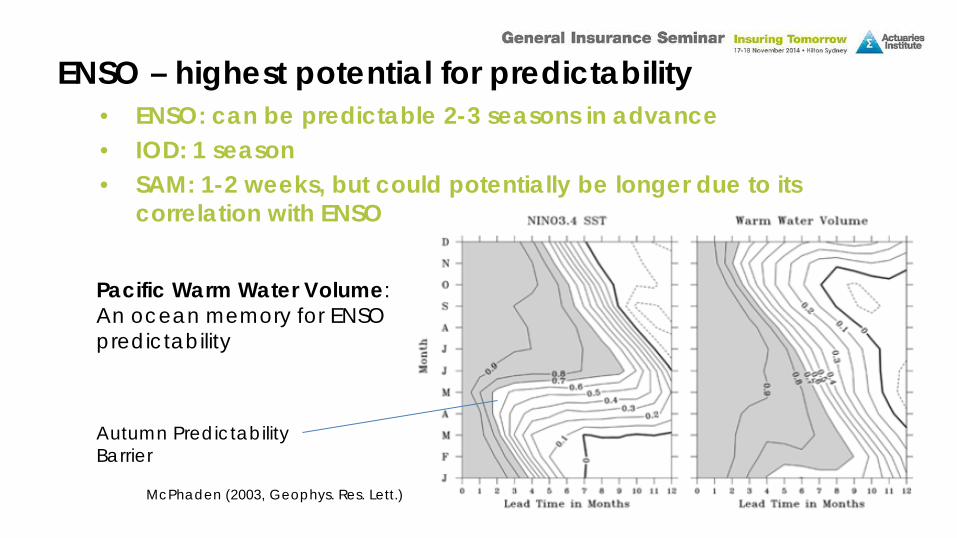
• ENSO: can be predictable 2-3 seasons in advance • IOD: 1 season • SAM: 1-2 weeks, but could potentially be longer due to its
correlation with ENSO
McPhaden (2003, Geophys. Res. Lett.)
Pacific Warm Water Volume: An ocean memory for ENSO predictability
Autumn Predictability Barrier
ENSO – highest potential for predictability
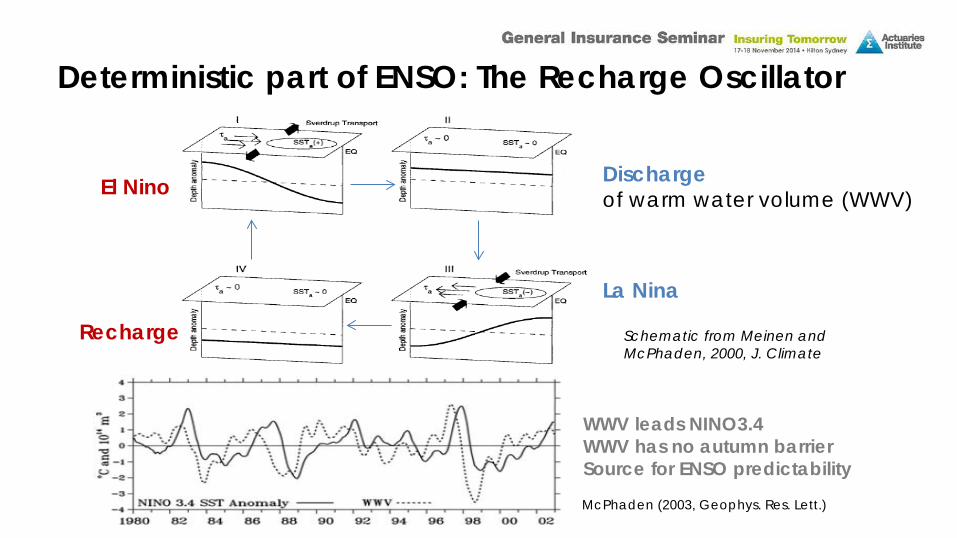
Schematic from Meinen and McPhaden, 2000, J. Climate
El Nino
La Nina
Discharge of warm water volume (WWV)
Recharge
McPhaden (2003, Geophys. Res. Lett.)
WWV leads NINO3.4 WWV has no autumn barrier Source for ENSO predictability
Deterministic part of ENSO: The Recharge Oscillator
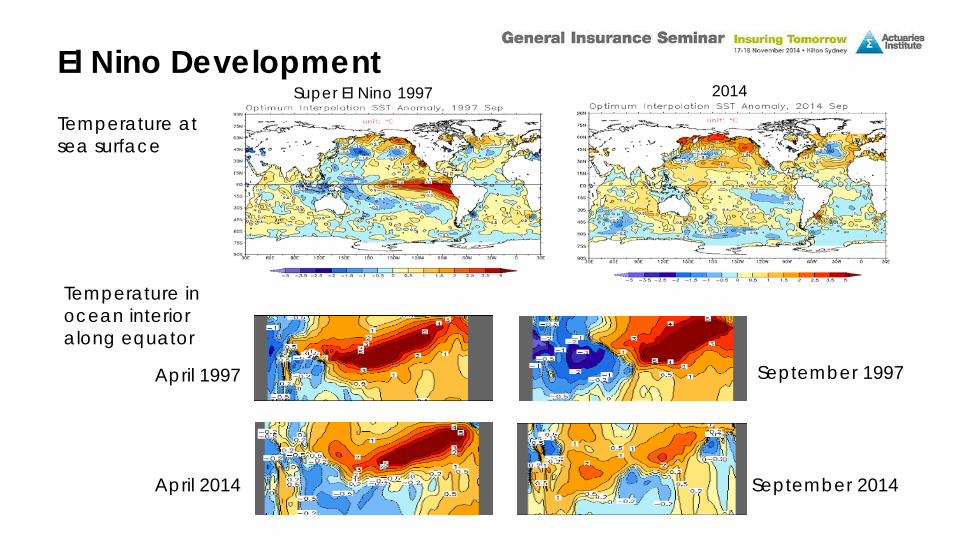
April 1997
April 2014
September 1997
September 2014
Super El Nino 1997 2014 El Nino Development
Temperature at sea surface
Temperature in ocean interior along equator
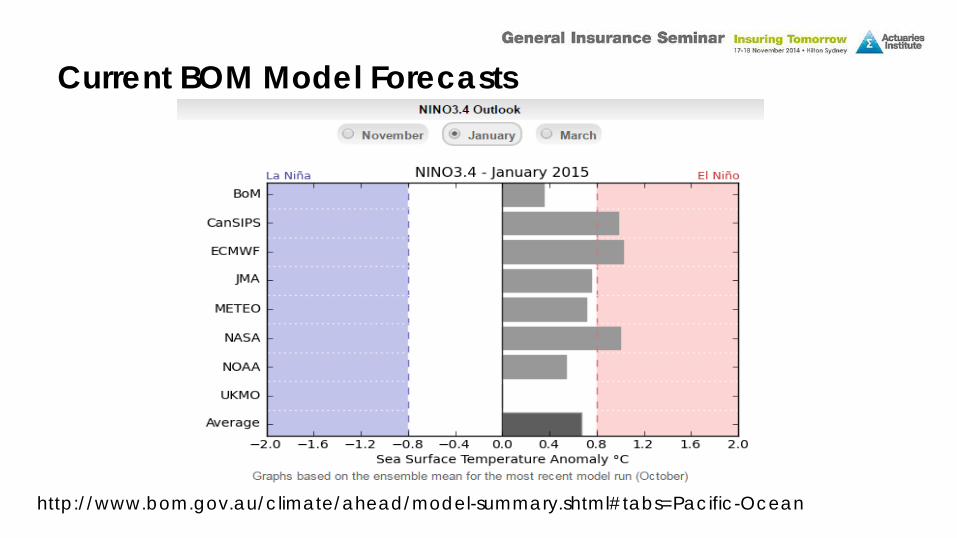
http://www.bom.gov.au/climate/ahead/model-summary.shtml#tabs=Pacific-Ocean
Current BOM Model Forecasts
• Better models • Better observations: more data (real-time) • Better initialisation methods (data assimilation) Note:
• Prediction becomes more accurate with shorter lead times • It is easier to predict stronger events than weak/neutral. This is dependent upon
the mean climate. In most recent decade (since 2000), ENSO variability is weaker and forecasts become less accurate (Barnston et al. 2012).
theconversation.com/dont-dismiss-a-2014-super-el-ni-o-just-yet-30720 theconversation.com/drought-in-store-as-el-ni-os-western-cousin-to-grow-stronger-27826 theconversation.com/are-we-heading-for-a-worrying-super-el-ni-o-26090
More on El Nino predictability:
Improved forecasting
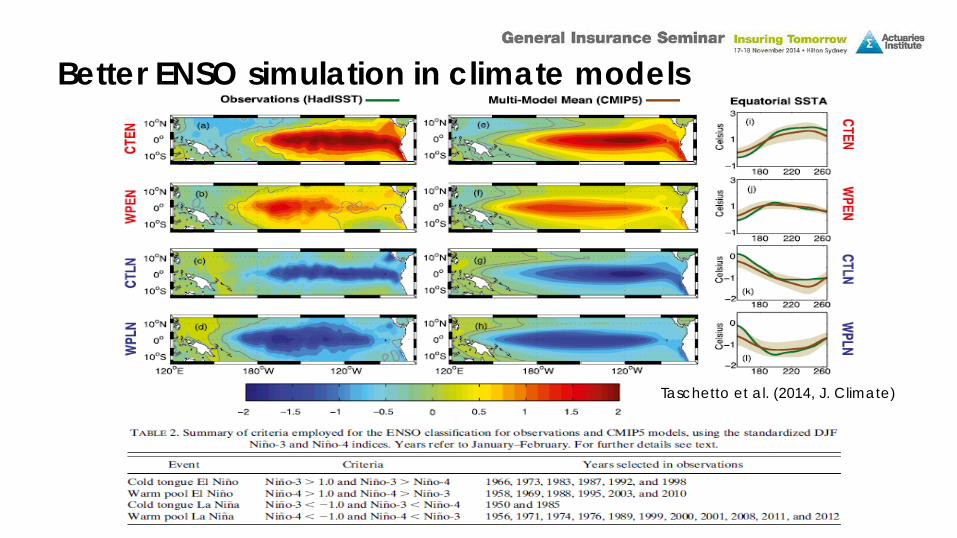
Taschetto et al. (2014, J. Climate)
Better ENSO simulation in climate models
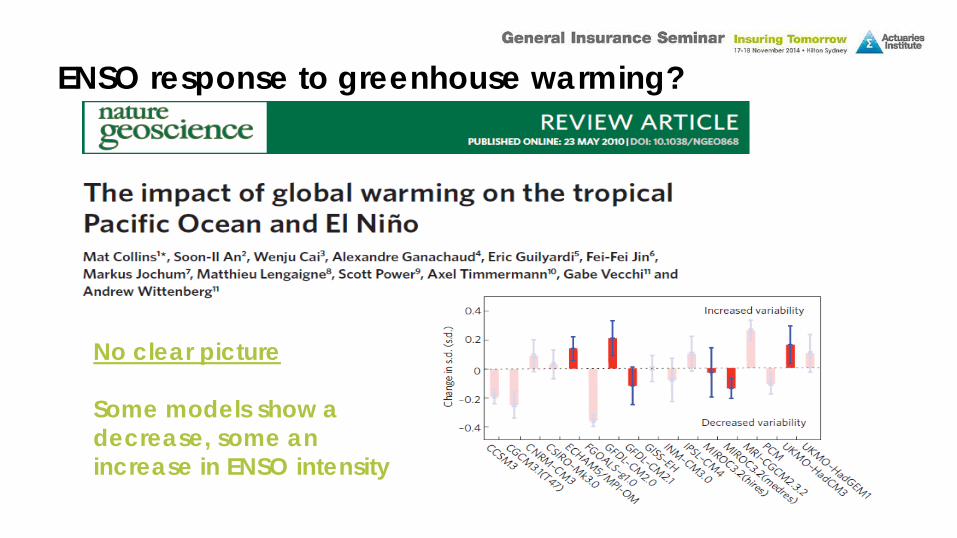
No clear picture Some models show a decrease, some an increase in ENSO intensity
ENSO response to greenhouse warming?
• More “El Nino-like” in the Pacific: Weakened Walker Circulation (e.g., Vecchi et al. 2006, Nature)
• More positive IOD-like in the Indian Ocean (e.g., Cai et al. 2013, Nature Geoscience)
• More positive SAM-like southward shift of the extra-tropical westerly jet (e.g., Arblaster and Meehl 2006, J. Climate)
Lack of consensus despite robust projections of the background climate:
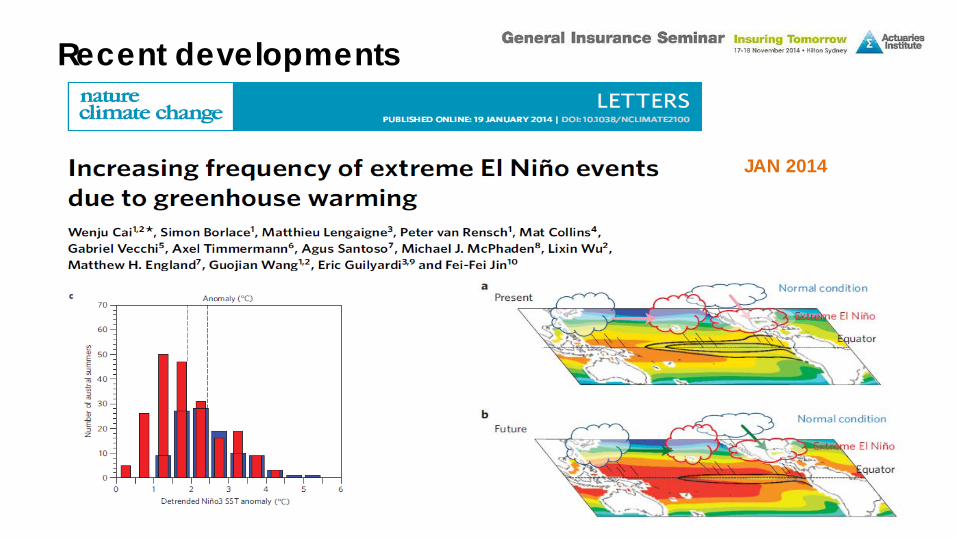
JAN 2014
Recent developments
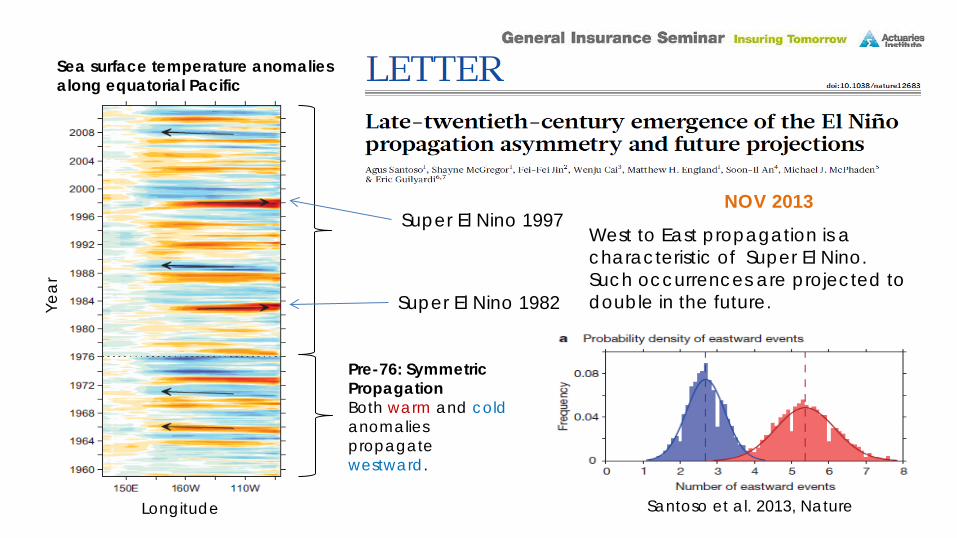
Pre-76: Symmetric Propagation Both warm and cold anomalies propagate westward.
Sea surface temperature anomalies along equatorial Pacific
Yea
r
Longitude
Super El Nino 1997
Super El Nino 1982
NOV 2013
West to East propagation is a characteristic of Super El Nino. Such occurrences are projected to double in the future.
Santoso et al. 2013, Nature

How about La Nina? ….stay tuned!
Cai and Santoso, et al., 2014, Nature

ENSO prediction for pricing?
Weather Cycles and Claim Costs The relationship between…
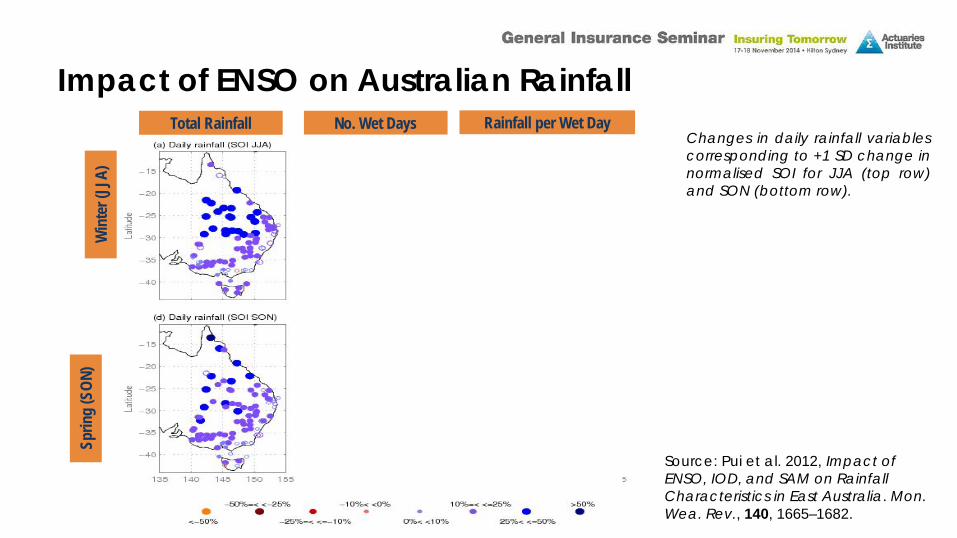
Changes in daily rainfall variables corresponding to +1 SD change in normalised SOI for JJA (top row) and SON (bottom row).
Source: Pui et al. 2012, Impact of ENSO, IOD, and SAM on Rainfall Characteristics in East Australia. Mon. Wea. Rev., 140, 1665–1682.
Total Rainfall No. Wet Days Rainfall per Wet Day W
inte
r (JJ
A)
Sprin
g (S
ON)
Impact of ENSO on Australian Rainfall
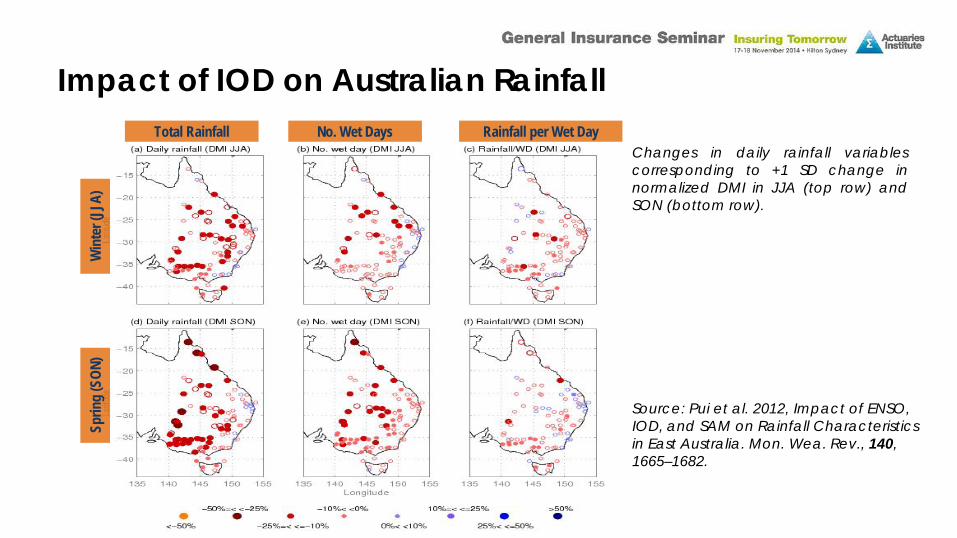
Changes in daily rainfall variables corresponding to +1 SD change in normalized DMI in JJA (top row) and SON (bottom row).
Source: Pui et al. 2012, Impact of ENSO, IOD, and SAM on Rainfall Characteristics in East Australia. Mon. Wea. Rev., 140, 1665–1682.
Total Rainfall No. Wet Days Rainfall per Wet Day
Win
ter (
JJA)
Sp
ring
(SON
) Impact of IOD on Australian Rainfall
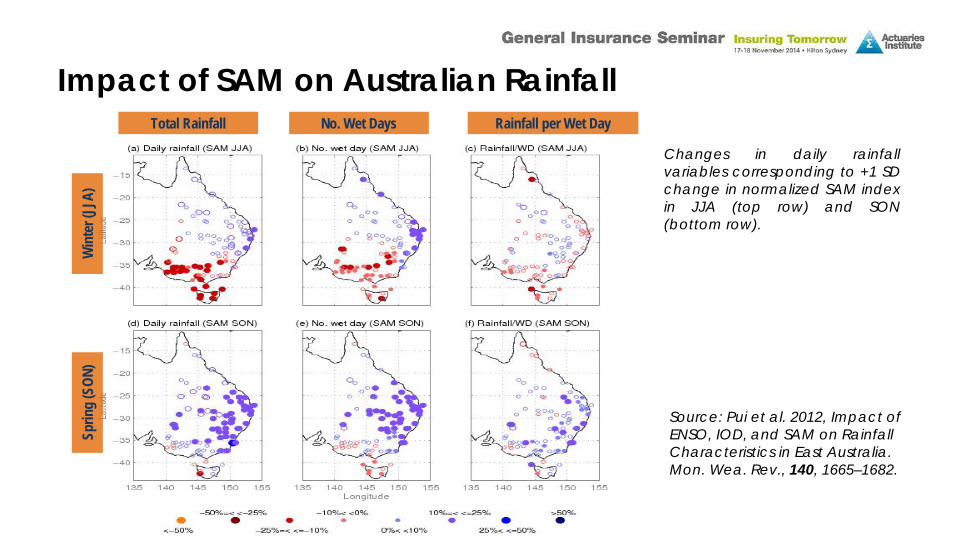
Changes in daily rainfall variables corresponding to +1 SD change in normalized SAM index in JJA (top row) and SON (bottom row).
Source: Pui et al. 2012, Impact of ENSO, IOD, and SAM on Rainfall Characteristics in East Australia. Mon. Wea. Rev., 140, 1665–1682.
Total Rainfall No. Wet Days Rainfall per Wet Day
Win
ter (
JJA)
Sp
ring
(SON
) Impact of SAM on Australian Rainfall
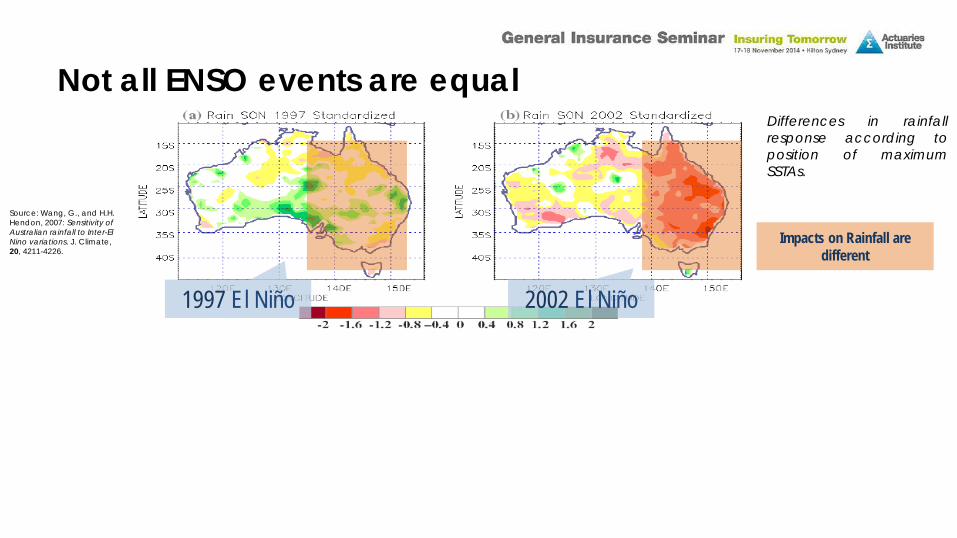
Source: Wang, G., and H.H. Hendon, 2007: Sensitivity of Australian rainfall to Inter-El Nino variations. J. Climate, 20, 4211-4226.
Impacts on Rainfall are different
1997 El Niño 2002 El Niño
Max. SSTAs at different locations
Differences in rainfall response according to position of maximum SSTAs.
Not all ENSO events are equal
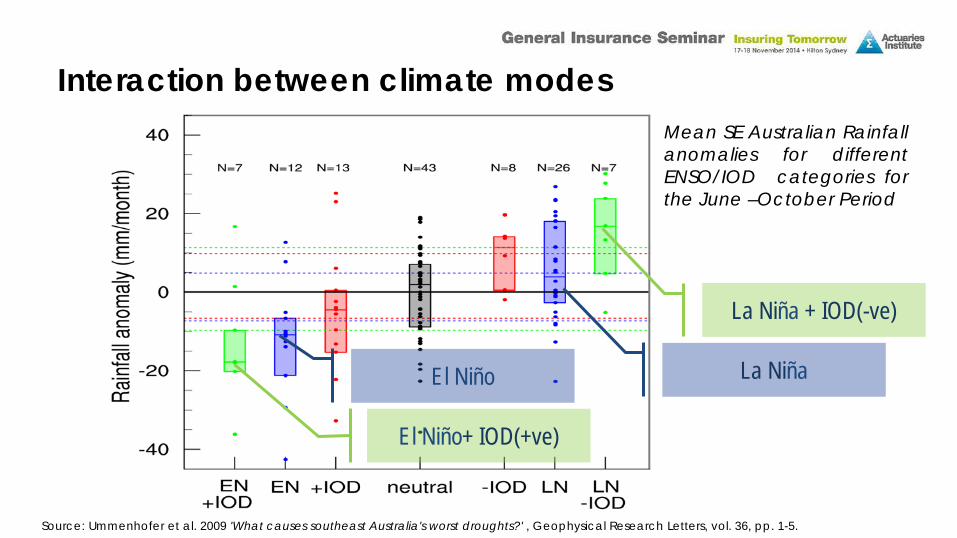
Source: Ummenhofer et al. 2009 'What causes southeast Australia's worst droughts?' , Geophysical Research Letters, vol. 36, pp. 1-5.
La Niña + IOD(-ve)
El Niño+ IOD(+ve)
La Niña El Niño
Mean SE Australian Rainfall anomalies for different ENSO/IOD categories for the June –October Period
Interaction between climate modes
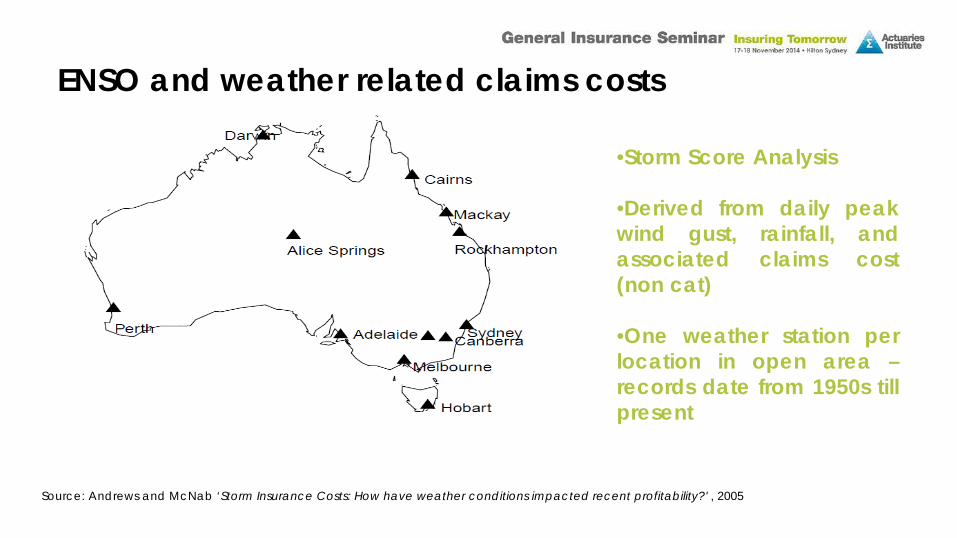
•Storm Score Analysis
•Derived from daily peak wind gust, rainfall, and associated claims cost (non cat)
•One weather station per location in open area – records date from 1950s till present
Source: Andrews and McNab ‘Storm Insurance Costs: How have weather conditions impacted recent profitability?' , 2005
ENSO and weather related claims costs

ENSO impact on East Coast Storm Scores

ENSO impact: Individual stations
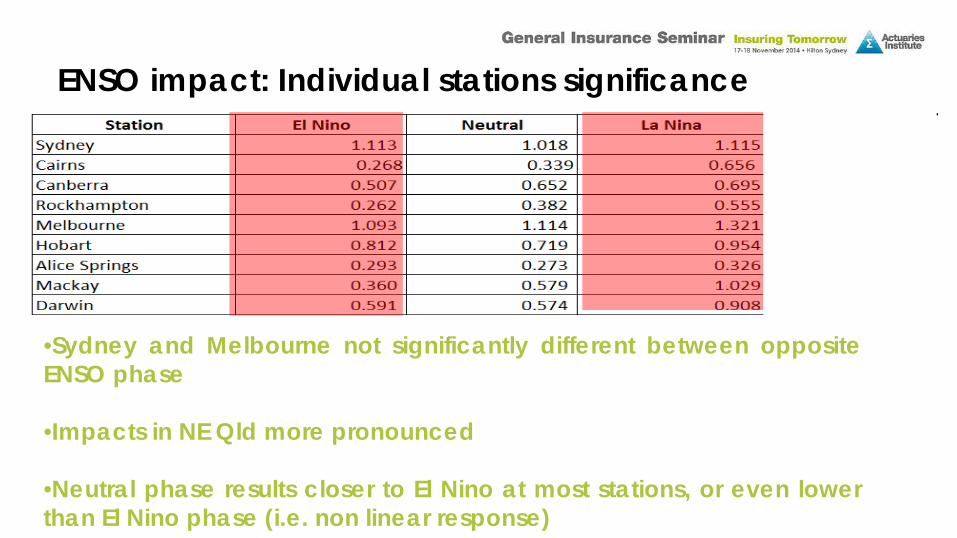
•Sydney and Melbourne not significantly different between opposite ENSO phase
•Impacts in NE Qld more pronounced
•Neutral phase results closer to El Nino at most stations, or even lower than El Nino phase (i.e. non linear response)
ENSO impact: Individual stations significance
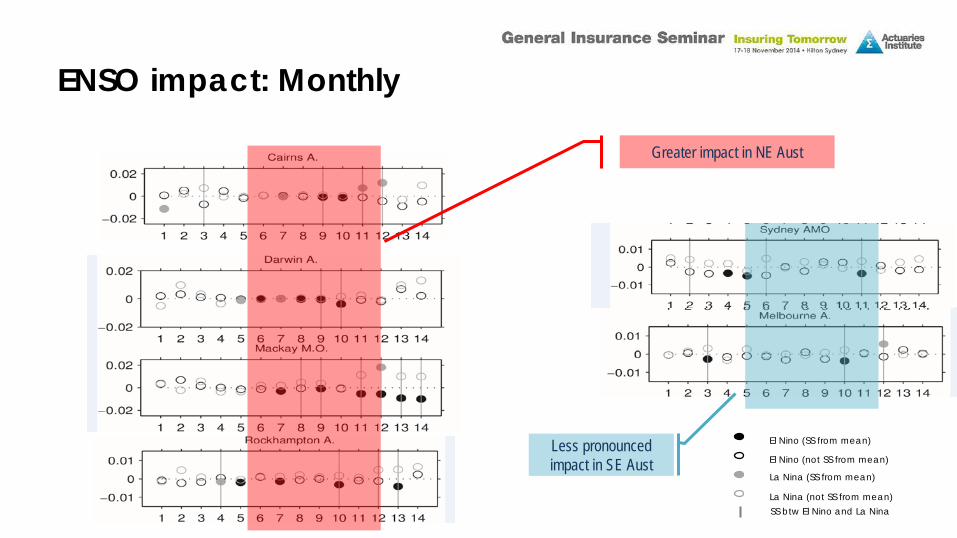
Greater impact in NE Aust
Less pronounced impact in SE Aust
El Nino (SS from mean)
El Nino (not SS from mean)
La Nina (SS from mean)
La Nina (not SS from mean) SS btw El Nino and La Nina
ENSO impact: Monthly
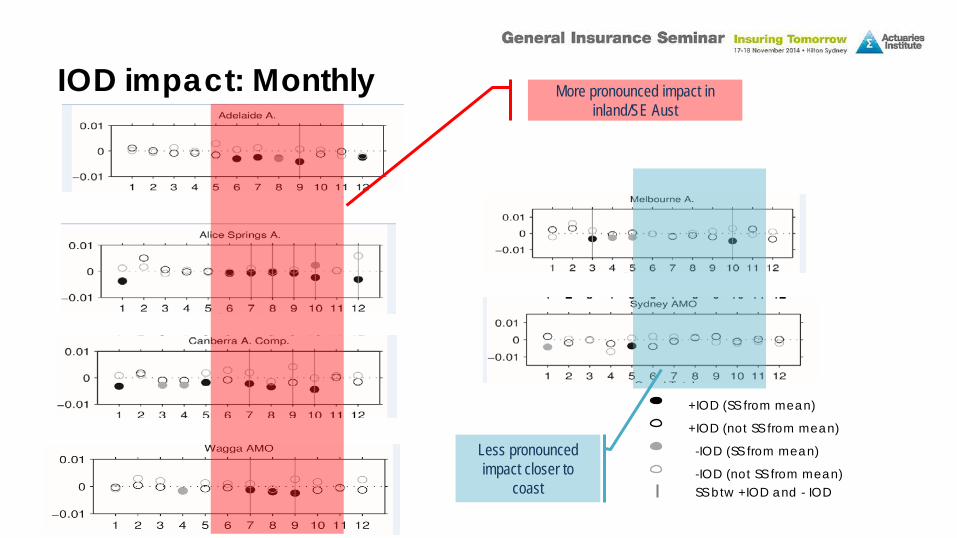
More pronounced impact in inland/SE Aust
Less pronounced impact closer to
coast
+IOD (SS from mean)
+IOD (not SS from mean)
-IOD (SS from mean)
-IOD (not SS from mean) SS btw +IOD and - IOD
IOD impact: Monthly
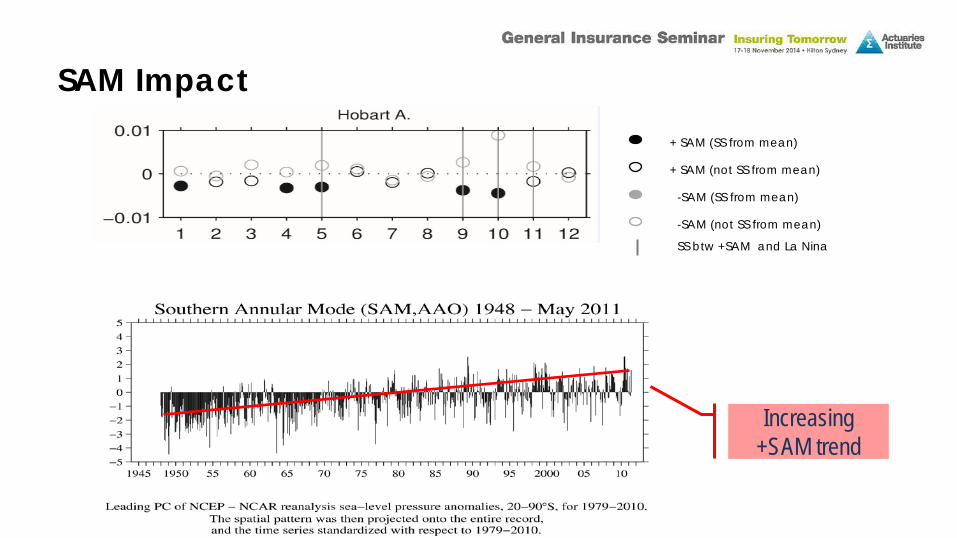
+ SAM (SS from mean)
+ SAM (not SS from mean)
-SAM (SS from mean)
-SAM (not SS from mean)
SS btw +SAM and La Nina
Increasing +SAM trend
SAM Impact
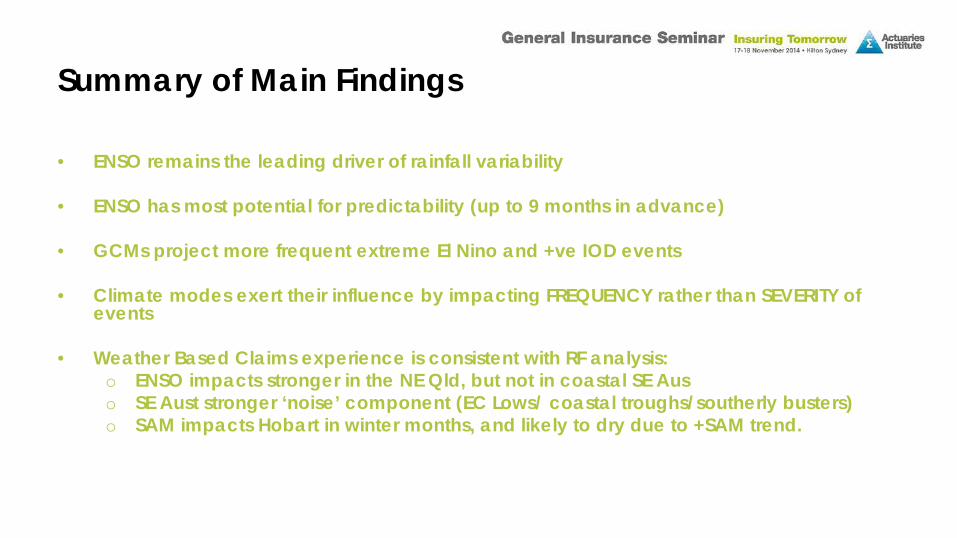
• ENSO remains the leading driver of rainfall variability
• ENSO has most potential for predictability (up to 9 months in advance)
• GCMs project more frequent extreme El Nino and +ve IOD events
• Climate modes exert their influence by impacting FREQUENCY rather than SEVERITY of events
• Weather Based Claims experience is consistent with RF analysis: o ENSO impacts stronger in the NE Qld, but not in coastal SE Aus o SE Aust stronger ‘noise’ component (EC Lows/ coastal troughs/southerly busters) o SAM impacts Hobart in winter months, and likely to dry due to +SAM trend.
Summary of Main Findings

What it means for insurers Impact on Insurers…
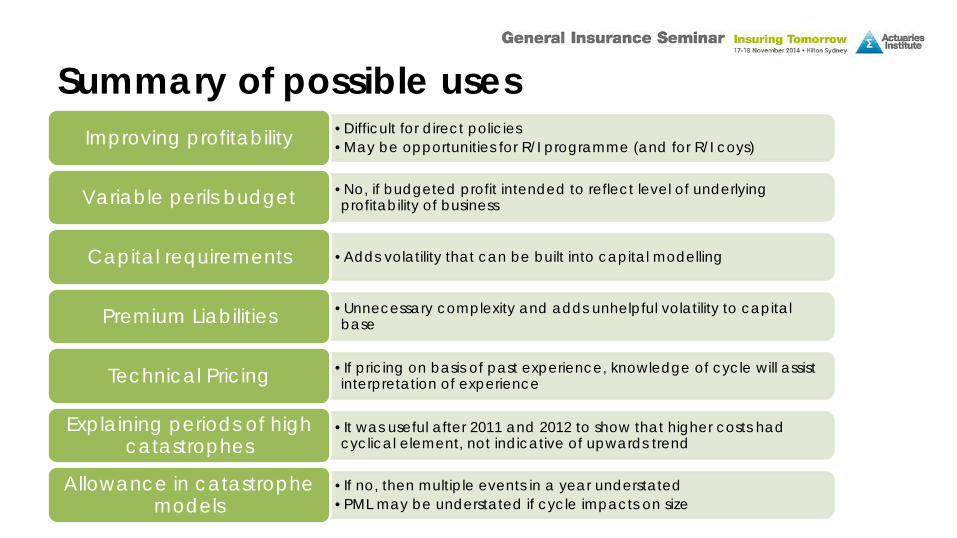
Summary of possible uses •Difficult for direct policies •May be opportunities for R/I programme (and for R/I coys) Improving profitability
•No, if budgeted profit intended to reflect level of underlying profitability of business Variable perils budget
•Adds volatility that can be built into capital modelling Capital requirements
•Unnecessary complexity and adds unhelpful volatility to capital base Premium Liabilities
•If pricing on basis of past experience, knowledge of cycle will assist interpretation of experience Technical Pricing
•It was useful after 2011 and 2012 to show that higher costs had cyclical element, not indicative of upwards trend
Explaining periods of high catastrophes
•If no, then multiple events in a year understated •PML may be understated if cycle impacts on size
Allowance in catastrophe models

Improving Profitability
• 2012 paper – direct writer with perfect knowledge – 0.2% improvement in COR – but smaller portfolio
• May be opportunities relating to
reinsurance programme – eg. lower retentions in La Nina
• Equally reinsurers may look to exploit
EL NINO

Allow for in Premium Liabilities • Overly theoretical • Unnecessary
complexity • Can’t vary premiums
to reflect phase in cycle
• Adds unhelpful volatility to capital base
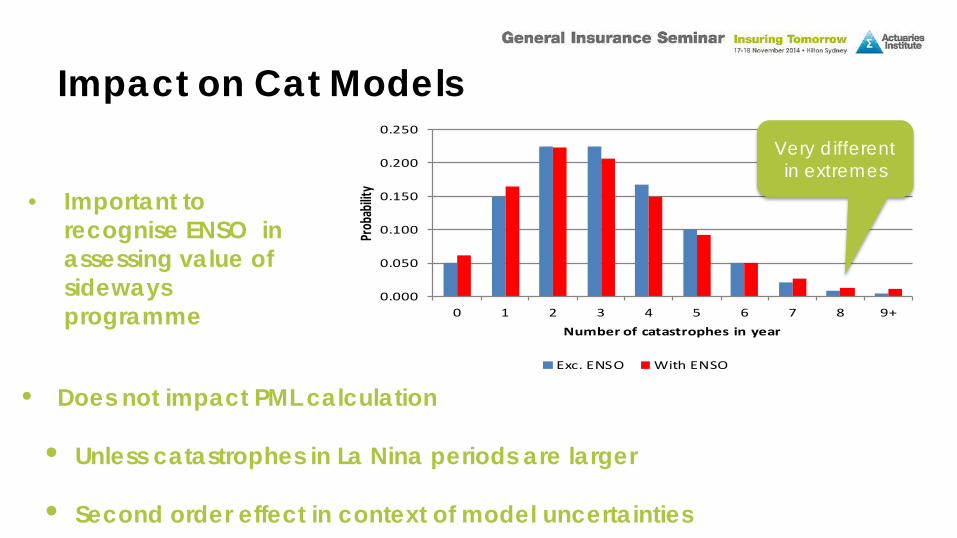
Impact on Cat Models
• Important to recognise ENSO in assessing value of sideways programme
0.000
0.050
0.100
0.150
0.200
0.250
0 1 2 3 4 5 6 7 8 9+
Prob
abilit
y
Number of catastrophes in year
Exc. ENSO With ENSO
• Does not impact PML calculation
• Unless catastrophes in La Nina periods are larger
• Second order effect in context of model uncertainties
Very different in extremes

Budgeting for cat costs • Cost vary significantly year to year
• Appropriate to take long term view (20+ years) • Applies more critically to pricing
0
1,000
2,000
3,000
4,000
5,000
6,000
Norm
alise
d Cl
aims
Costs
$m
Taking a “medium term” view, say 5 years, is also
too volatile

Budgeting for cat costs • Cycle predictions
– Some evidence extreme states of cycle could be predicted 6-18 months out
• Variable budgeting
– Potential to respond to prediction in budget allowances
– For listed insurers difficult to explain guidance to markets. Better approach
may be informing investment market of potential for higher cat activity
when approaching a certain phase
– For unlisted insurers this approach may be more feasible
– What’s the cost of getting it wrong?

Budgeting for cat costs • Multi-year peril budgets?
• Investment markets
– Attempt to see through catastrophe results to understand
underlying margins
– Possible for market to not recognise underpricing of peril covers
• Heightened as insurers at varied levels of sophistication in peril
based risk selection
– Role for insurers to educate markets on financial impact of
weather
Implications for capital
• Multi-state nature of weather means profit volatility is greater than
history may suggest
• “Tail” outcomes are different enough that capital modelling results
could be materially impacted when considered in light of risk
appetites
• Reinsurance strategy can be considered in light of ENSO predictions
– Works better for December renewals
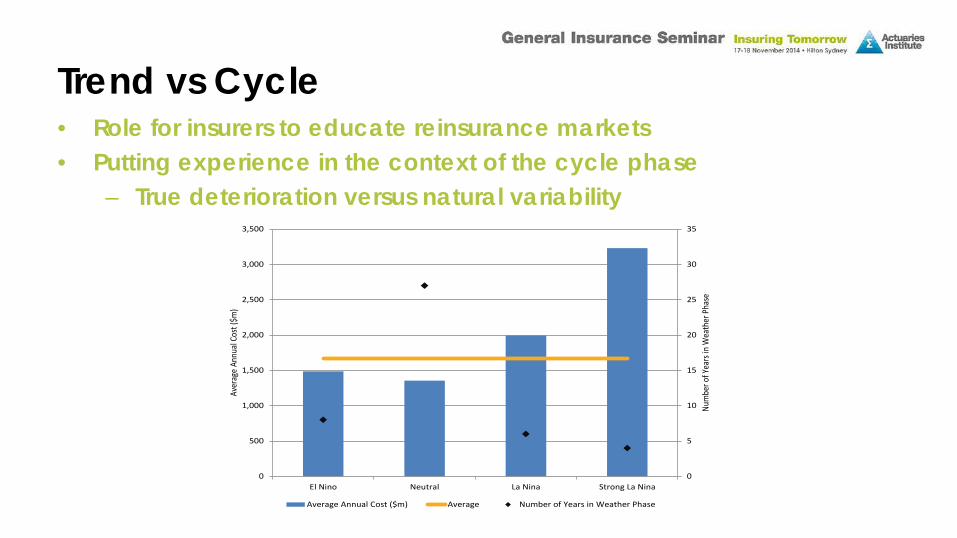
Trend vs Cycle • Role for insurers to educate reinsurance markets • Putting experience in the context of the cycle phase
– True deterioration versus natural variability
0
5
10
15
20
25
30
35
0
500
1,000
1,500
2,000
2,500
3,000
3,500
El Nino Neutral La Nina Strong La Nina
Num
ber o
f Yea
rs in
Wea
ther
Pha
se
Aver
age
Annu
al Co
st ($
m)
Average Annual Cost ($m) Average Number of Years in Weather Phase

Wrap-up Final remarks