Embed Size (px)
Citation preview

R E C E N T FILIPINO IMMIGRATION To T H E U N I T E D STATES:
A PROFILE
EAST-WEST C E N T E R
EAST-WEST POPULATION INSTITUTE

T H E IMMIGRATION PROJECT
This booklet is one result of an ongoing study of immigration to the United States being conducted at the East-West Population Institute, East-West Center, Honolulu, Hawaii. The goal of the project is to gather information obtainable in no other way on immigration from the two countries in Asia that send the most immigrants to the United States: the Republic of Korea and the Philippines. Information on immigrants before their 1986 departures from Korea and the Philippines was collected during face-to-face interviews conducted by researchers from Hanyang University in Seoul, Korea, and from the University of the Philippines in Manila. The research team from Korea was headed by Dr. In-Sook Park, while the team from the Philippines was led by Dr. Benjamin Carino. Data on immigrant experiences after arrival in the United States were collected through mail surveys and telephone interviews by researchers at the East-West Population Institute, headed by Dr. James T. Fawcett and Dr. Robert W. Gardner.

R E C E N T FILIPINO IMMIGRATION To T H E U N I T E D STATES:
A PROFILE
December 1990
EAST-WEST C E N T E R
EAST-WEST POPULATION INSTITUTE

A C K N O W L E D G M E N T S
This booklet is the product of the efforts of many people. M o s t important, of course, are the kind and patient people, 1986 immigrants f rom the Philippines, who have given of their time and opened their lives to us so that we could learn more about the immigration experience. Al so important to the booklet's completion have been Dina Nada la , Melay Patron, and Lynna SyCip, research interns and assistants at the East-West Population Institute. The staff of the United States Embassy in M a n i l a was extremely helpfu l in arranging and facilitating the first stage of the study. Generous funding has been provided by the Sloan Foundation and the East-West Population Institute, East-West Center.

SUMMARY This report provides a brief statistical profile of Filipino immigration to the United States, with a special focus on those who arrived in 1986. The statistics show that Filipino immigrants are quite a diverse group, coming from different backgrounds in the Philippines and making their living in the United States through a variety of occupations. There were a few who had faced obstacles in finding suitable employment, but on the whole, most were doing quite well economically after two years in the United States. A new survey planned for 1991 will give a better picture of the social and economic adaptation of the 1986 immigrants after they have been in the United States for five years.
The statistics presented in this report are mostly drawn from other reports that contain more-detail and are somewhat more technical in nature. These are included in the suggested readings on Filipino-Americans and Asian Americans at the end of this report for those who want to gain a deeper knowledge about this important segment of American society.
Fil ipino immigration to the United States began at the turn of the century—about 1903—and has gone through three main historical phases. First, Fil ipinos were recruited to work in Hawai i and Cal i forn ia . About 150,000 Fil ipinos came to the United States in this way, mostly between 1907 and 1930. M o r e than half went to Hawai i . The f low of these early immigrants was facilitated by a U.S. law that, until 1935, allowed Fil ipinos to move to the United States freely as U.S. nationals.
When the Philippines was granted commonwealth status in 1935, Fi l ip ino immigration to the United States was virtually halted. It was not until after the Philippines had been granted its independence in 1946 that the number of Fi l ip ino immigrants rose substantially, beginning the second phase of immigration which lasted until 1965. The number of Fi l ip ino immigrants, however, did not exceed 4,000 in any given year. Between 1946 and 1965, over 34,000 Filipinos came to the United States.
By far the largest group—over 800,000—has arrived since 1965, when the U.S. immigration law was changed to eliminate discrimination based on country of origin (Figure 1). Initially, a high proportion of the Fil ipinos entering under the new law were admitted on the basis of their job skills. M o r e recently, however, the great
1

Figure 1
Cumulative Number of Filipino Immigrants "S Admitted to the United States, 1962-1988 % 1.000,000 -
< r 1,000.000
CO § 800.000 - - 800.000 Co £ E 600.000 -
**— - 600.000
jmb
er c
- 400,000
jlativ
e N
i
- 200.000
~T*y~*Trr~\ i i i i i i i i i i i 0
Year of Immigration
Source: Light and Bonacich (1988), INS Annual Reports and Statistical Yearbooks (various years)
Figure 2
Percentage of Filipino Americans Born In and Outside the United States, 1980
^^^ : : : : : : ; : ; : ; : ; : ; ^77- > ^^ Born in U.S. , / " N x 35%
V j
— — - —
Foreign-born 65%
Source: 1980 Census of Population
2

majority have been admitted based on petitions f rom family members already living in the United States.
This report focuses on immigrants who entered the United States during one recent year—1986—and provides a portrait of that group. The findings are drawn primarily f rom surveys that were carried out by the University of the Philippines in M a n i l a and by the East-West Center in the United States.
The Filipino-American population is made up of both immigrants t
from the Philippines and ethnic Filipinos who were born in the United States. The 1980 census indicated that 65 percent of Fi l ip ino-Americans were immigrants, whereas 35 percent had been born in the United States (Figure 2). This shows that immigration has been responsible for the recent rapid growth in this population. In the 1970 census, 336,000 Fil ipino-Americans were counted, but the number rose rapidly to 781,000 in 1980, and it is estimated that there wi l l be over 1.4 million Filipino-Americans counted in the 1990 census (Figure 3).
The most rapid growth in the Fi l ipino-American population occurred during the period 1966-70 (Figure 4). Since then growth has continued, but at a slower pace, and, according to records kept by the Immigration and Naturalization Service (INS), over 800,000 Filipinos have been legally admitted to the United States. In 1987, Fil ipinos were the second largest group of new immigrants, after Mexicans (Figure 5).
The current Filipino-American population contains slightly more females than males. For the last few decades, women have tended to constitute more than half of immigrants f rom the Philippines, a marked contrast to immigration during the early 1900s when female immigrants were a tiny minority (Figure 6). For example, of the estimated 102,000 Fil ipinos who came to Hawai i f rom 1907 to 1929, only 13 percent were women. The recent predominance of female immigrants reflects two things: the military presence of the United States in the Philippines (providing a context in which international marriages can occur between Fi l ip ino women and American men) and immigration policies that promote female immigration not only as part of the family but also as occupational immigrants.
Recent Fi l ip ino immigrants tend to be well educated (Figure 7). For example, the immigrant group contains a higher percentage of
3

Figure 3
Number of Filipinos in the United States: 1970,1980, and 1990
1,400,000
1,200,000
1,000,000
800,000
600,000
400,000
200,000
0
1,405,146
781,894
336,731
1970 1980 1990
Source: Figure for 1990 is an estimate from Bouvier & Agresta (1987, p.292); Figures for 1980, 1970: 1980 Census of Population
Figure 4
Number of Filipino Immigrants Admitted to the United States Each Year, 1962-1988
E < c O )
E E
i 1 1 1 1 1 1 1 1 1 1 1 1 r
'62 '64 '66 "68 70 '72 74 76 78 '80 '82 '84 '86 "88
60.000
50,000
40,000
30,000
20,000
10,000
0
Source:
Year of Immigration
Light and Bonacich (1988). INS Annual Reports and Statistical Yearbooks (various years)
4

Figure 5
Top Ten Source Countries of Immigrants to the United States in 1986
c o O
0 10,000 20,000 30,000 40,000 50,000 60,000 70,000
Number Admitted
Source: 1986 INS Statistical Yearbook
Figure 6
Percentage of Males and Females in the Filipino American Population, 1980
^ — M a l e s 48%
Females 52%
Source: 1980 Census of Population
5

Figure 7
Educational Attainment of 1986 Filipino Immigrants and of the Philippine Population, 1980
100 CD C D B 80 c CD O CD Q_ CD >
=3 E o
60
40 A
20
1986 Immigrants Philippine Population Ages 18 and Above
Co) lege ana
Above
n Middle/
High School
'$M Elementary 1 • 8 or Less Jgj
Males Source: 1986 Survey Note: Only immigrants 18 and
above were interviewed.
Females Total Source: 1980 Philippine
Census of Population and Housing
Figure 8
Educational Attainment of Filipino Americans and the U.S. Population, 1980
CD C D
CD O k-CD CL S
=3 E
100 -
80 -
60 -
40 -
20 •
College and Above
Middle/ High School
Elementary or Less
Filipino Americans U.S. Population
Source: 1980 Census of Population
6

college-educated persons than does the whole population of the Philippines, and Fil ipinos in the United States are ahead of the total U.S. population in educational attainment (Figure 8). The proportion of males and females who have a college education are almost equal, also indicating the general importance that is placed upon getting an education.
When asked why they intended to go to a particular place in the United States, the great majority of Fi l ip ino immigrants cited family connections as the reason (Figure 9). Of ten , the immigrants went to places where their "petitioners" lived. The particular family relationships mentioned most by the 1986 immigrants as influencing their choice of destination were parents, followed by spouses or fiance(e)s, children, unspecified family members, and siblings (Figure 10). The 1980 census showed that Cal i forn ia was by far the most popular place for Fil ipinos to live, followed by Hawai i , Illinois, and N e w York (Figure U). The 1986 survey showed a very similar pattern for where new immigrants expected to live (Figure 12).
When new Fil ipino immigrants were asked about their reasons for immigrating to the United States, family factors were most often mentioned, but work and other relationship factors (e.g., the presence of other non-immediate relatives, friends) were also important (Figure 13). A somewhat different picture of motivations emerged in response to a question about what things new immigrants were " looking forward to the most" in the United States. The economic benefits of being in the United States and a better and happy life were mentioned most frequently, with seeing and being with friends and relatives, f inancial stability, and owning property also mentioned often as things to look forward to when moving to the United States (Figure 14).
After about two years in the United States, fewer women than men were working (60.1 percent versus 81.9 percent), but an even smaller proportion of women (37.8 percent) had worked in the Philippines before departure, so many women experienced a major change in their daily lives upon immigrating to the United States (Figures IS and 16).
Almost all of the Fi l ip ino immigrants held salaried jobs. M o s t of them tended to work for Caucasians (71 percent) and only a small proportion (12 percent) worked for other Fil ipinos (Figure 17).
7

Figure 9
Reasons Given by 1986 Filipino Immigrants for Choosing Intended U.S. Destination
Source: 1986 Survey
Figure 10
Type of Famil forC
Parents 27% _
y Affiliation Cited as a Reason choosing Destination
/ Spouse/Fiance(e) 23%
/
Children 2 0 % ^ | | ! |
Source: 1986 Survey
I s / j Family Members, JL. ^ - r - ^ q / Unspecified 16%
Siblings 13%
8

Figure 11
Top Ten States of Residence of Filipinos in the United States, 1980
California - 49.8 Hawaii - U H 18.4
CD O
c Illinois - •] 6.2
CD T > New York -~~~] 5.0 "co CD rv Washington - [133.6 LL *o
New Jersey -• 3.4
Sta
te i Virginia -
Texas -Florida -
Maryland -
• 2.7 1 2 . 2 • 2.1 1 1 . 6
C ) 10 20 30 40 50 60
Percentage Source: 1980 Census of Population
Figure 12
CD O c CD
" O W CD
rr " D CD
" O C CD
O CD aj •*-• C/)
Top Ten States of Intended Residence for 1986 Filipino Immigrants
California Hawaii Illinois
New York New Jersey Washington
50.5
10.6
20 30
Percentage
40 50 60
Source: 1986 Survey
9

Figure 13
Why 1986 Filipino Immigrants Wanted to Move to the United States
Family 42%
Other Affiliation 20%
Work 29%
Source: 1986 Survey
Figure 14
Things That 1986 Filipino Immigrants Were Looking Forward to About the United States
L . Work/Better Job • • • • • • • • • • H B P 3i.o
Better/Happy Life -• • • • • • • • • • ( ] 25.9
Financial Stability - • • • • 10.7
See/Be With Rel/Friends -• • • • ! 9.8
Owning Property J • m u g , - 8.3 Other Family-Related - WkW 5.5
Educational Opportunities J • i 4.6
Becoming U.S. Citizen 0 2.0
Others -0 2.3
C ) 10 20 30 40 50 Percentage Mentioning
Source: 1986 Survey
10

Figure 15
What Female Filipino Immigrants Were Doing Two Years After Their Arrival in the United States
Employed
Not-Working (0 GO
i= Not in U.S. <
Self-Employed
0 20 40 60 80 100 Percentage
Source: 1987-1988 Follow-up Survey
Figure 16
What Male Filipino Immigrants Were Doing Two Years After Their Arrival in the United States
Employed -Employed -
CO CO
Not-Working -• I -
Act
iv
Not in U.S. -
Self-Employed -I " i i I 1 1 1 1 1
0 20 40 60 80 100 Percentage
Source: 1987-1988 Follow-up Survey
1 1

Figure 17
Ethnicity of Employers of 1986 Filipino Immigrants
Source: 1988 Follow-up Survey
Figure 18
Types of Jobs Employed Filipino Immigrants Held in the Year Before Immigration
Professional/Technical o a? Admn/Exec/Managerial O Clerical "cB Bus. Prop. & Sales o to Q- Transport/Communictn o o O i_
Farm/Fish/Mining
Craft/Production I
Services/Recreation -I
20 34
TT 1_L
10
19
:19
7 9
16
6 8 • Males n Females
, 9
5 10 15 20 25 30 35
Percentage
Source: 1986 Survey
12

Fil ipino immigrants held a variety of jobs before they left the Philippines and most of them changed to a different type of job when they first started working in the United States. For example, the largest job categories for men in the Philippines involved professional and technical work, farming and fishing, crafts and production, and business proprietorships. For women, most of them were doing professional and technical, clerical, and business proprietorship work (Figure 18). In the United States, the most common first jobs for men were in the areas of services and recreation and crafts and production (such as working in a factory). For women, the majority were found in services and recreation, clerical, and crafts and production jobs (Figure 19). The situation had changed very little after the immigrants had been in the United States for two years, although a slightly greater percentage of men and women held professional and technical jobs (Figure 20).
The monthly income of immigrants two years after arrival varied widely, wi th women earning slightly more than men (Figure 21). The income of all Filipino-Americans compared quite favorably with earnings of other groups in America in 1980. For the groups shown, among men, Fil ipinos were third after whites and Asian and Pacific Islanders. A m o n g women, Fil ipinos were the top earners (Figure 22).
Before departing, Fil ipinos did not generally expect to encounter any problems in the United States. For those that d id , however, language difficulties were most often mentioned (Figure 23). Af ter two years in the United States, the problems that the majority of Filipinos had actually experienced involved f inding a suitable job and adjusting to life in the United States (Figure 24). Prior to departure, the majority of Fi l ip ino immigrants expected help in dealing with their problems f rom several sources: their relatives and friends in the United States, U.S. government agencies or their employer in the United States, U.S. church agencies, and U.S. government agencies (Figure 25). The great majority, however, expected the most helpful source of assistance to be from relatives in the United States (Figure 26).
M o s t Filipinos also did not expect to be discriminated against, although for those that d id , they expected discrimination to occur in terms of getting a job, being looked down upon, or securing promotions (Figures 27 and 28). After two years in the United States,
13

Figure 19
Types of Jobs Employed Filipino Immigrants Held Upon Arrival in the United States
^ Professional/Technical j ? Admn/Exec/Managerial ^
Clerical eg o c o
C L Z3 O o O i_ o
Bus. Prop. & Sales Farm/Fish/Mining
Transport/Communictn Craft/Production
Services/Recreation Others
Source: 1988 Follow-up Survey
5.1 9.6
1.9 5 12.8
3 9.6 8.5
• 1.9 0.2
a 18.7
upo m i.i
u Mates
26.6
31.2
33.7 29.9
10 20 30
Percentage
40
Figure 20
Types of Jobs Employed Filipino Immigrants Held After Two Years in the United States
5 Professional/Technical
2 Admn/Exec/Managerial O Clerical c Bus. Prop. & Sales o "•g Farm/Fish/Mining
g Transport/Communictn
O Craft/Production
.o Services/Recreation
2 Others
• Males
m Females
20 30 Percentage
Source: 1988 Follow-up Survey
14

Figure 21
Monthly Income of 1986 Filipino Immigrants After Two Years in the United States
Less than $500
t| $500-$999
8 $1,00041.198
J|> $1,200-$1,499
O $1,500-$1,999
$2,000-$2,999
$3,000-$3,999
12 39
319 17
21
O 3
o Males • Females
Source: 1988 follow-up survey
10 20 30
Percentage
40
Figure 22
Annual Income of Filipino-Americans and Other Groups in the United States, 1980
Filipino- [~~ Americans
110,749
8,253
Whites
§- Blacks o ^ Hispanics c
.Asians/ Island* w Pac. Islander
U.S.
112,881 5,356
7,827 • Mates • Females 4,674
9,078 4,733
11,718 6,685
" ! ~ 1 12,192 8,253
0 2,000 4,000 6,000 8,00010,000 12,000 Median Annual Income
Source: 1980 Census of Population
2 5

Figure 23
Problems That 1986 Filipino Immigrants Expected in the United States
Language
§ Schooling
o £ Jobs 1 *o o
§; Cost of Living
Housing
Source: 1986 Survey
ilk ... 5 5
J 9
8
10
5 17
15 20 Percentage Mentioning
Figure 24
Problems That 1986 Filipino Immigrants Had Experienced Within Two Years
After Arrival in the United States
Finding Suitable Job CO E n Adjusting to Life o
H H | H H H f I 32.3
Q_
o English Language CO
••jjjjjjp 15.6 © >»
H Cost of Living H 9.0
C l l l i i
) 20 40 60 80 100 Percentage Mentioning Problem
Source: 1988 follow-up survey
1 6

Figure 25
Expected Sources of Help in Dealing With Problems in the United States
Philippine Embassy
© U.S. Church Agencies
O
=> O
CO T J
•
o 0) CL
U.S. Govt. Agencies
U.S. Employer
Friends in U.S.
Relatives in U.S.- |
Relatives in Phil
I 5 4
J 53
60
| 60
3 65
Source: 1986 Survey
20 40 60 80 Percentage Mentioning
100
Figure 26
Source of Assistance that Filipino Immigrants Expected to be Most Helpful
Relatives in U.S.
Employer in U.S
^ U.S. Govt. Agencies Q ' 7
8 U.S. Church Agencies -njl 5
5 Philippine Embassy -OT 4
Friends in U.S. -If 2
Relatives in Phil - i l 2 X
o 20 40 60 Percentage Mentioning
Source: 1986 Survey
3 73
80
1 7

Figure 27
Whether 1986 Immigrants Believed Before Departure that Filipinos are Discriminated
Against in the United States
Yes, but does not expect personal discrimination
1% Source: 1986 Survey
Figure 28
Type of Discrimination Expected
Promot ions
Source: 1986 Survey
18

very few Fil ipinos (16 percent) had actually personally experienced discrimination, although 37 percent still perceived that discrimination against Filipinos existed (Figure 29).
M o s t Fi l ip ino immigrants (84 percent) continued to practice mainly Fi l ip ino customs in their own homes in the United States. The remaining 15 percent chose to either practice mainly Amer i can customs (8 percent) or both Fi l ip ino and American customs (7 percent) (Figure 30). What they missed most about the Phil ippines were the relatives and friends who were still there.
Before they left the Philippines, Fi l ip ino immigrants rated the Philippines higher than the United States in terms of its moral c l i mate and the kindness of the people around them. The United States, on the other hand, was rated higher on a number of economic and job-related issues as well as on polit ical conditions, educational opportunities, freedom from crime, and the variety of enjoyable things to do. They also perceived that they had a higher social status in the United States than in the Philippines (Figure 31).
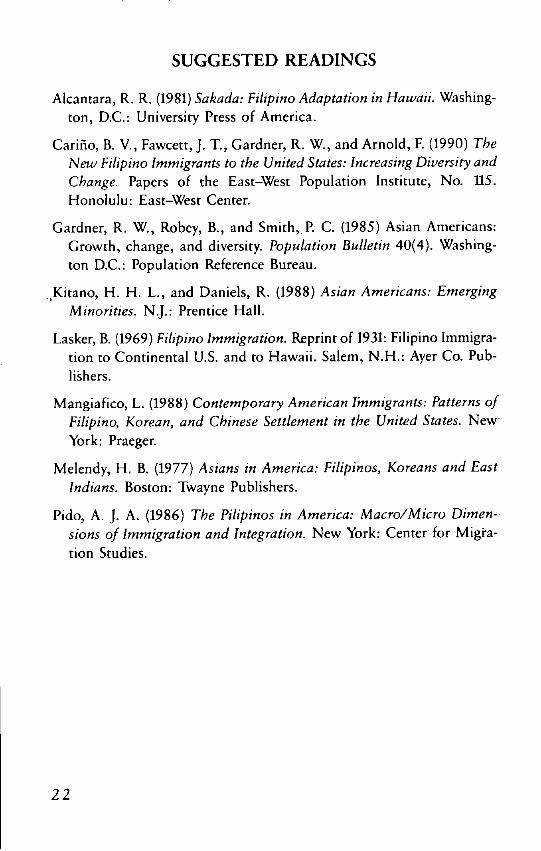
After two years in the United States, Fi l ipino immigrants felt that they worked harder, were better off financially, and were more optimistic about the future in the United States than they had been in the Philippines. O n the other hand, they felt that their social status had been higher and that they had had more friends in the Philippines than in the United States (Figure 32).
This statistical profile has focused on 1986 Fi l ip ino immigrants and their experiences during their first few years in the United States. A survey planned for 1991 wi l l give us a better picture of this diverse group of immigrants after they have been in the United States for five years.
19

Figure 29
Whether Immigrants Perceived Discrimination After Two Years in the United States
Yes, and experienced
No discrimination 63%
Source: 1988 Follow-up Survey
Figure 30
Whether Filipino or American Customs are Practiced in New Immigrants' Homes
Source: 1988 follow-up survey
20
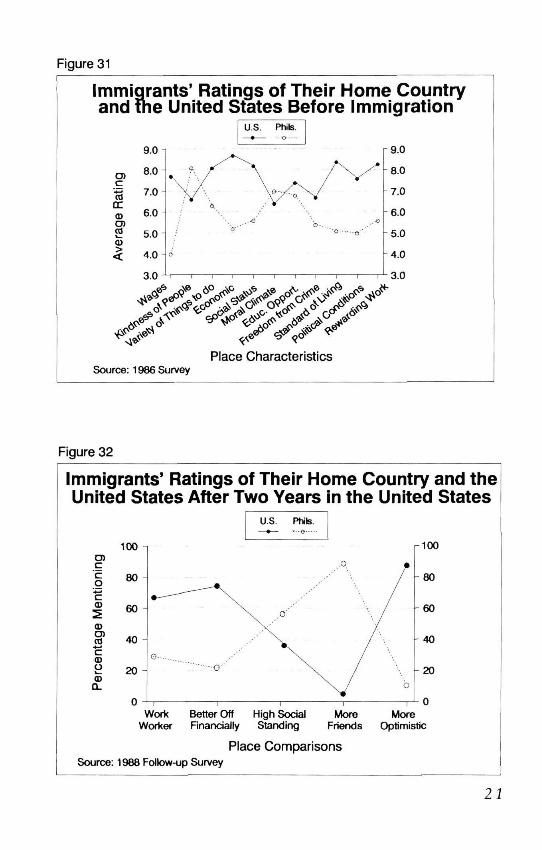
Figure 31
Immigrants' Ratings of Their Home Country and the United States Before Immigration
O )
c
CC CD O) Cti
CD
3
9.0
8.0
7.0
6.0
5.0
4.0
3.0
U.S. Phils. • -©••-••
6^
9.0
8.0
h7.0
6.0
5.0
4.0
3.0
Place Characteristics Source: 1986 Survey
Figure 32
Immigrants' Ratings of Their Home Country and the United States After Two Years in the United States
CJ) c "c o •*—>
c CD
CD O ) cd
-»—I
c CD O i— CD
Q-
U.S. Phils.
Work Better Off High Social More More Worker Financially Standing Friends Optimistic
Place Comparisons Source: 1988 Follow-up Survey
21
S U G G E S T E D R E A D I N G S
Alcantara, R. R. (1981) Sakada: Filipino Adaptation in Hawaii. Washington, D.C.: University Press of America.
Carino, B. V., Fawcett, J. T., Gardner, R. W., and Arnold, F. (1990) The New Filipino Immigrants to the United States: Increasing Diversity and Change. Papers of the East-West Population Institute, No. 115. Honolulu: East-West Center.
Gardner, R. W., Robey, B., and Smith, P. C. (1985) Asian Americans: Growth, change, and diversity. Population Bulletin 40(4). Washington D.C.: Population Reference Bureau.
tKitano, H. H. L. , and Daniels, R. (1988) Asian Americans: Emerging Minorities. N.J.: Prentice Hall.
Lasker, B. (1969) Filipino Immigration. Reprint of 1931: Filipino Immigration to Continental U.S. and to Hawaii. Salem, N.H.: Ayer Co. Publishers.
Mangiafico, L. (1988) Contemporary American Immigrants: Patterns of Filipino, Korean, and Chinese Settlement in the United States. New York: Praeger.
Melendy, H. B. (1977) Asians in America: Filipinos, Koreans and East Indians. Boston: Twayne Publishers.
Pido, A. J. A. (1986) The Filipinos in America: Macro/Micro Dimensions of Immigration and Integration. New York: Center for Migration Studies.
2 2


T H E EAST-WEST CENTER was established in Hawaii in 1960 by the United States Congress "to promote better relations and understanding between the United States and the nations of Asia and the Pacific through cooperative study, training, and research."
Some 2,000 research fellows, graduate students, and professionals in business and government each year work with the Center's international staff on major Asia-Pacific issues relating to population, economic and trade policies, resources and the environment, culture and communication, and international relations. Since I960, more than 27,000 men and women from the region have participated in the Center's cooperative programs.
Officially known as the Center for Cultural and Technical Interchange Between East and West, Inc., the Center is a public, nonprofit institution with an international board of governors. Principal funding comes from the United States Congress. Support also comes from more than 20 Asian and Pacific governments, as well as from private agencies and corporations.
T H E EAST-WEST POPULATION INSTITUTE, established as a unit of the East-West Center in 1969, carries out multidisciplinary research, training, and related activities in the field of population, placing emphasis on economic, social, psychological, and environmental aspects of population problems in Asia, the Pacific, and the United States.