Embed Size (px)
Citation preview
Ann. Rev. Astron. Astrophys.1977. 15: 19-44 Copyright © 1977 by Annual Reviews Inc. All rights reserved
RECENT OBSERVATIONS OF PULSARS J. H. Taylor Department of Physics and Astronomy, University of Massachusetts, Amherst, Massachusetts, 01003
R. N. Manchester CSIRO, Division of Radiophysics, Sydney, Australia and Department'of Physics and Astronomy, University of Massachusetts, Amherst, Massachusetts, 01003
INTRODUCTION
=-=2106
It is now almost ten years since pulsars were discovered (Hewish et al. 1968), and the fascination that these objects have provided for the observer and theorist alike continues to ensure them a fair share of astronomical attention. Since 1968 more than 400 papers have been written on pulsar observations or their interpretation, and this work has contributed significantly to our knowledge of galactic structure, stellar evolution, and the physics of very dense matter. Although remarkable progress has been made in understanding the nature of pulsars, and a basic model-a rapidly rotating, highly magnetized neutron star-has gained general acceptance, the mechanism responsible for the observed radio emission is still not understood.
Our intention in this review is not to attempt to discuss all the known properties of pulsars; rather, we have concentrated on two main areas in which there has been substantial progress during the last few years and which look promising for future work. The second section is devoted to a summary of the existing observational material relevant to the pulse emission mechanism. In general, we have not attempted to describe the possible interpretations of the data or the various models that have been proposed for generation of the pulsed emission. The third section deals with the important problem of the origin and evolution of pulsars. The observed variations, both regular and irregular, in pulsar periods are first described. Recent extensive surveys have detected a large number of new pulsars, many at large distances from the Sun. We review the analysis of these results, which give the galactic distribution of pulsars and their luminosity function. Finally, we describe recent observations suggesting that, for many pulsars, the characteristic age is an overestimate of the true age. These results, together with the derived galactic distribution, imply a relatively high birthrate for pulsars.
19
Ann
u. R
ev. A
stro
. Ast
roph
ys. 1
977.
15:1
9-44
. Dow
nloa
ded
from
ww
w.a
nnua
lrev
iew
s.or
gby
Uni
vers
ity o
f Sa
skat
chew
an o
n 10
/07/
13. F
or p
erso
nal u
se o
nly.
20 TAYLOR & MANCHESTER
OBSERVED PULSE CHARACTERISTICS I ntegrated Pulse Profiles
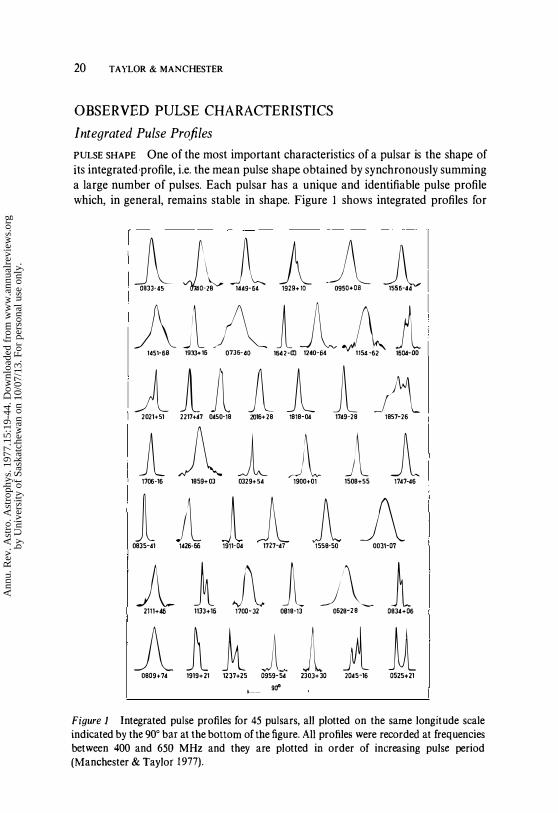
PULSE SHAPE One of the most important characteristics of a pulsar is the shape of its integrated profile, i.e. the mean pulse shape obtained by synchronously summing a large number of pulses. Each pulsar has a unique and identifiable pulse profile which, in general, remains stable in shape. Figure 1 shows integrated profiles for
l!!AJl! AA,Gl!AA llAJll1Jl
2021+51 2217+47 0450-18 2016+28 1818-04 1749-28 1857-26
lAllA! 1706-16 1859+03 0329+ 54 1900+01 1508+55 1747-46
1 A 11 A A 0835-41 1426-66 1911-04 1727-47 1558-50 0031-07
A1AAAl 2111+46 1133+16 1700-32 0818-13 0628-28 0834+06
AAklllll 0809+74 1919+21 1237+25 0959-54 2303+30 2045-16 0525+21
,__ 9rf'
Figure 1 Integrated pulse profiles for 45 pulsars, all plotted on the same longitude scale indicated by the 900 bar at the bottom of the figure. All profiles were recorded at frequencies between 400 and 650 MHz and they are plotted in order of increasing pulse period (Manchester & Taylor 1977).
Ann
u. R
ev. A
stro
. Ast
roph
ys. 1
977.
15:1
9-44
. Dow
nloa
ded
from
ww
w.a
nnua
lrev
iew
s.or
gby
Uni
vers
ity o
f Sa
skat
chew
an o
n 10
/07/
13. F
or p
erso
nal u
se o
nly.
RECENT OBSERVATIONS OF PULSARS 21
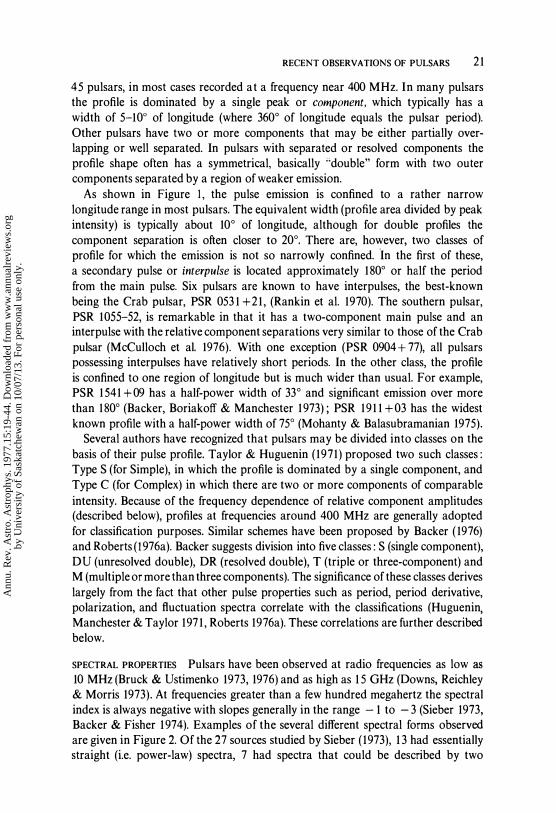
45 pulsars, in most cases recorded at a frequency near 400 MHz. In many pulsars the profile is dominated by a single peak or component, which typically has a width of 5-10° of longitude (where 360° of longitude equals the pulsar period). Other pulsars have two or more components that may be either partially overlapping or well separated. In pulsars with separated or resolved components the profile shape often has a symmetrical, basically "double" form with two outer components separated by a region of weaker emission.
As shown in Figure I, the pulse emission is confined to a rather narrow longitude range in most pulsars. The equivalent width (profile area divided by peak intensity) is typically about 10° of longitude, although for double profiles the component separation is often closer to 20°. There are, however, two classes of profile for which the emission is not so narrowly confined. 'In the first of these, a secondary pulse or interpulse is located approximately 180° or half the period from the main pulse. Six pulsars are known to have interpulses, the best-known being the Crab pulsar, PSR 053 1 +21, (Rankin et al. 1970). The southern pulsar, PSR 1055-52, is remarkable in that it has a two-component main pulse and an inter pulse with the relative component separations very similar to those of the Crab pulsar (McCulloch et al. 1976). With one exception (PSR 0904 + 77), all pulsars possessing interpulses have relatively short periods. In the other class, the profile is confined to one region of longitude but is much wider than usual. For example, PSR 1 541 +09 has a half-power width of 33° and significant emission over more than 180° (Backer, Boriakoff & Manchester 1973); PSR 191 1 +03 has the widest known profile with a half-power width of 75" (Mohanty & Balasubramanian 1975).
Several authors have recognized that pulsars may be divided into classes on the basis of their pulse profile. Taylor & Huguenin (1971) proposed two such classes: Type S (for Simple), in which the profile is dominated by a single component, and Type C (for Complex) in which there are two or more components of comparable intensity. Because of the frequency dependence of relative component amplitudes (described below), profiles at frequencies around 400 MHz are generally adopted for classification purposes. Similar schemes have been proposed by Backer ( 1976) and Roberts (1976a). Backer suggests division into five classes: S (single component), DU (unresolved double), DR (resolved double), T (triple or three-component) and M (multiple or more than three components). The significance of these classes derives largely from the fact that other pulse properties such as period, period derivative, polarization, and fluctuation spectra correlate with the classifications (Huguenin, Manchester & Taylor 197 1 , Roberts 1976a). These correlations are further described below.
SPECTRAL PROPERTIES Pulsars have been observed at radio frequencies as low as
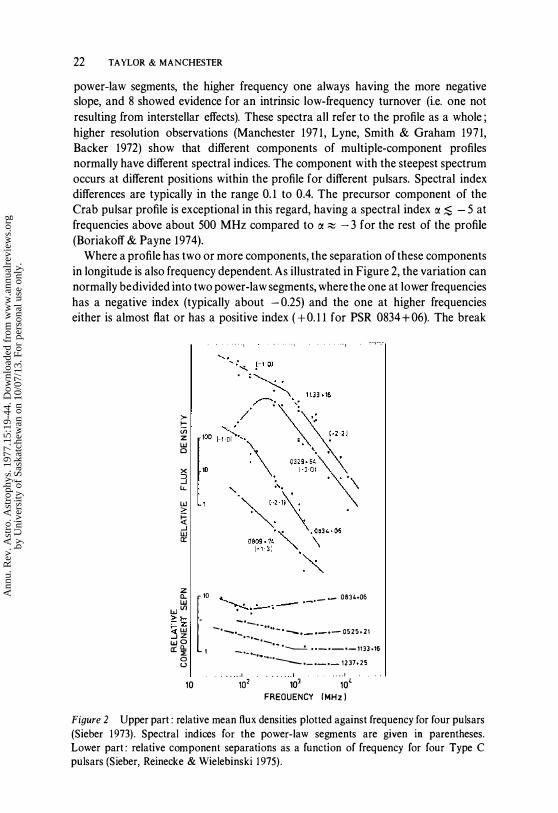
10 MHz (Bruck & Ustimenko 1973, 1976) and as high as 1 5 GHz (Downs, Reichley & Morris 1973). At frequencies greater than a few hundred megahertz the spectral index is always negative with slopes generally in the range - 1 to - 3 (Sieber 1973, Backer & Fisher 1974). Examples of the several different spectral forms observed are given in Figure 2. Of the 27 sources studied by Sieber (1973), 1 3 had essentially straight (i.e. power-law) spectra, 7 had spectra that could be described by two
Ann
u. R
ev. A
stro
. Ast
roph
ys. 1
977.
15:1
9-44
. Dow
nloa
ded
from
ww
w.a
nnua
lrev
iew
s.or
gby
Uni
vers
ity o
f Sa
skat
chew
an o
n 10
/07/
13. F
or p
erso
nal u
se o
nly.
22 TAYLOR & MANCHESTER
power-law segments, the higher frequency one always having the more negative slope, and 8 showed evidence for an intrinsic low-frequency turnover (i.e. one not resulting from interstellar effects). These spectra all refer to the profile as a whole; higher resolution observations (Manchester 1971, Lyne, Smith & Graham 1971, Backer 1972) show that different components of multiple-component profiles normally have different spectral indices. The component with the steepest spectrum occurs at different positions within the profile for different pulsars. Spectral index differences are typically in the range 0.1 to 0.4. The precursor component of the Crab pulsar profile is exceptional in this regard, having a spectral index rx ;s - 5 at frequencies above about 500 MHz compared to rx ;;:0 - 3 for the rest of the profile (Boriakoff & Payne 1974).
Where a profile has two or more components, the separation of these components in longitude is also frequency dependent. As illustrated in Figure 2, the variation can normally be divided into two power-law segments, where the one at lower frequencies has a negative index (typically about -0.25) and the one at higher frequencies either is almost flat or has a positive index ( +0.11 for PSR 0834 +06). The break
>!:: Vl z UJ o
x :3 u.
UJ > � ...J i!!
z
W (!ill) [110 "'"------'- 0834.06
. "';-..:.. :.!-- : - .-'
�� -. <c LU -' __ ._ -·-.. ··-· __ ._._.- 0525+21 �6 "'-._
a:: � ... I----...!.. •• -1-1-,,33.16
8 -·· ...... -.··----._._._1231+25 , • • • • • j , • • • • •• 1 • • • . 1
10 102 103 10' FREOUENCY (MHz)
Figure 2 Upper part : relative mean flux densities plotted against frequency for four pulsars
(Sieber 1973). Spectral indices for the power-law segments are given in parentheses. Lower part : relative component separations as a function of frequency for four Type C pulsars (Sieber, Reinecke & Wielebinski 1975).
Ann
u. R
ev. A
stro
. Ast
roph
ys. 1
977.
15:1
9-44
. Dow
nloa
ded
from
ww
w.a
nnua
lrev
iew
s.or
gby
Uni
vers
ity o
f Sa
skat
chew
an o
n 10
/07/
13. F
or p
erso
nal u
se o
nly.

RECENT OBSERVATIONS OF PULSARS 23
between the two segments is often at about the same frequency as the similar break in the spectrum; for example, the break frequencies for PSR 0834 + 06 and PSR 1133 + 16 are about 150 MHz and 1 GHz respectively (Figure 2). In multiplecomponent profiles the relative spacing of the components is generally independent of frequency. Pulsars where this is not true (e.g. PSR 0329 + 54) appear to have overlapping emission from two independent regions.
There is some evidence that component widths are also less at higher frequencies. For example, Sieber, Reinecke & Wielebinski (1975) find that component widths at 4.9 GHz are typically 15% narrower than those at 2.7 GHz.
POLARIZATION The emission from pulsars shows a wide range of fractional polarization with linear dominating over circular in most cases (Manchester 1971, Lyne, Smith & Graham 1971, Hamilton et al. 1977a, b). Polarization properties are illustrated for two integrated profiles in Figure 3. For PSR 0833·45 the average degree of linear polarization is 82% and circular polarization is 6%. In about 75% of the pulsars with significapt linear polarization, the position angle changes continuously through the profile, often with the approximately linear variation seen for PSR 0833-45 (Figure 3). For most Type C pulsars, the position-angle variation has a characteristic shape with an approximately constant position angle in the wings of the profile and a rapid variation near the center. Observations at different frequencies show that, at a given longitude, the position-angle gradient is independent of frequency; at low frequencies the total range of variation is generally larger because of the wider profile, but it is always less than or about 1800•
The second profile in Figure 3, for PSR 1857-26, is an example showing a
o
I . . 1
PSR0833�
I 30
I 60
• • I I I I '"" "S3-\ I-f
I o 30
LONGITUDE (DEG)
I 60 90
Figure 3 Integrated profiles and polarization characteristics for two pulsars, recorded at a frequency of 631 MHz (Hamilton et a\. 1977b). In each case the full line represents the total intensity profile, the dashed line the linearly polarized part, and the dotted line the circularly polarized part. The position angle of the linear part is shown with error bars (± 2 a) on every second point.
Ann
u. R
ev. A
stro
. Ast
roph
ys. 1
977.
15:1
9-44
. Dow
nloa
ded
from
ww
w.a
nnua
lrev
iew
s.or
gby
Uni
vers
ity o
f Sa
skat
chew
an o
n 10
/07/
13. F
or p
erso
nal u
se o
nly.

24 TAYLOR & MANCHESTER
discontinuous position-angle variation. For this source and others like it, the position angle has one or more discontinuous steps with the magnitude of step generally being close to 90°. The fractional polarization always has a minimum at the longitude of the step, which suggests an overlap of two components with orthogonal position angles. This effect is clearly related to the orthogonally polarized subpulses seen in most pulsars as described below. If the trailing position-angle segment for PSR 1857-26 is moved by 90°, then the position-angle variation is continuous and, in fact, has the shape characteristic of Type C pulsars. The implication is that, for the trailing part of the profile, the emission is in a mode whose position angle relative to some vector on the star (presumably the magnetic field) is orthogonal to that of the rest of the profile.
Observations at various frequencies show that for pulsars, in contrast to most radio sources, the degree of linear polarization is greatest at low frequencies (Manchester, Taylor & Huguenin 1973). The fractional polarization is generally constant below some break frequency (generally a few hundred megahertz) and approximately inversely proportional to frequency at higher frequencies. For some pulsars (e.g. PSR 0833-45), the degree of circular polarization increases with frequency, but in others it is less at higher frequencies (Hamilton et al. 1 977b).
PROFILE STABILITY One of the principal reasons for the importance of the integrated profile as a pulsar characteristic is its great stability with time. With the exception of mode changing (see below), there is no evidence for a secular change in the intrinsic shape of the integrated profile or its polarization characteristics for any pulsar (Rankin, Payne & Campbell 1974, Helfand, Manchester & Taylor 1975). However, the mean pulse energy does change with time; McLean (1973) found that (after removing the effects of interstellar scattering) mean pulse energies often varied by about a factor of two from day to day, and much larger variations, by a factor of ten or more, are observed over longer intervals (Huguenin, Taylor & Helfand 1 973, Rankin, Payne & Campbell 1 974, Lyne & Thorne 1 975).
Mode changing is a phenomenon, first observed in PSR 1237 + 25 by Backer (1970a), in which the profile abruptly changes to a second stable form, remains in that form for some interval, and then abruptly reverts to its normal form. For PSR 1237 + 25, these mode changes typically occur every few hours and last for several minutes. A more complicated form of mode changing with several stable modes has been observed for PSR 0329 + 54 by Lyne ( 1971 ), Hesse ( 1973), and Hesse, Sieber & Wielebinski (1973).
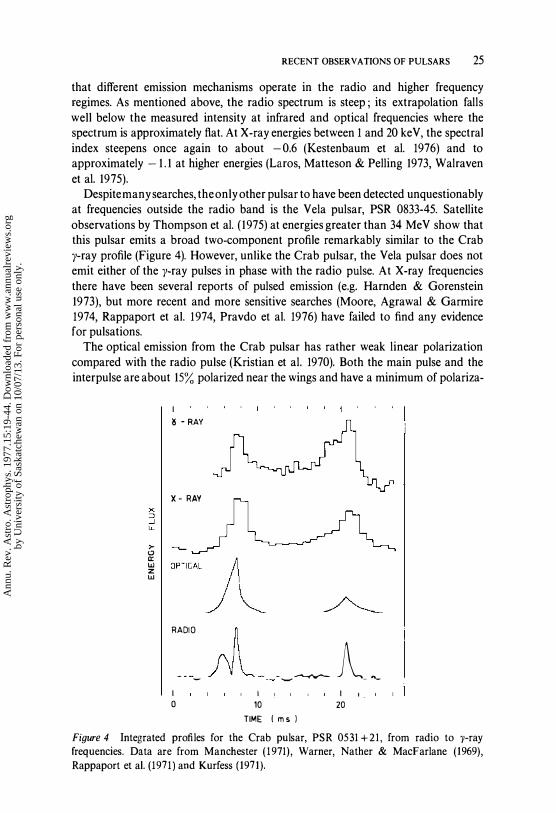
HIGH-FREQUENCY OBSERVATIONS Up to this point this review has been concerned solely with the radio properties of pulsars. It is of course well known that the Crab pulsar emits infrared, optical, X-ray, and y-ray pulses synchronously with the radio emission. Integrated profiles for four of these frequency regimes are shown in Figure 4. Although the pulse clearly has the same basic shape (with a main pulse and interpulse) at all frequencies, the profiles differ considerably in detail. The radio main pulse has a precursor component that is absent at higher frequencies; the components become wider at higher frequencies and the ratio of interpulse energy to main pulse energy is greater at higher frequencies. Spectral measurements indicate
Ann
u. R
ev. A
stro
. Ast
roph
ys. 1
977.
15:1
9-44
. Dow
nloa
ded
from
ww
w.a
nnua
lrev
iew
s.or
gby
Uni
vers
ity o
f Sa
skat
chew
an o
n 10
/07/
13. F
or p
erso
nal u
se o
nly.
RECENT OBSERVATIONS OF PULSARS 25
that different emission mechanisms operate in the radio and higher frequency regimes. As mentioned above, the radio spectrum is steep; its extrapolation falls well below the measured intensity at infrared and optical frequencies where the spectrum is approximately flat. At X-ray energies between 1 and 20 keV, the spectral index steepens once again to about -0.6 (Kestenbaum et al. 1976) and to approximately -1 . 1 at higher energies (Laros, Matteson & Pelling 1973, Walraven et al. 1975).
Despite many searches, the only other pulsar to have been detected unquestionably at frequencies outside the radio band is the Vela pulsar, PSR 0833-45. Satellite observations by Thompson et al. (1975) at energies greater than 34 MeV show that this pulsar emits a broad two-component profile remarkably similar to the Crab y-ray profile (Figure 4). However, unlike the Crab pulsar, the Vela pulsar does not emit either of the y-ray pulses in phase with the radio pUlse. At X-ray frequencies there have been several reports of pulsed emission (e.g. Harnden & Gorenstein 1973), but more recent and more sensitive searches (Moore, Agrawal & Garmire 1974, Rappaport et al. 1974, Pravdo et al. 1976) have failed to find any evidence for pulsations.
The optical emission from the Crab pulsar has rather weak linear polarization compared with the radio pulse (Kristian et al. 1970). Both the main pulse and the inter pulse are about 15% polarized near the wings and have a minimum of polariza-
� <.) c:: w z w
I � - RAY
x - RAY
RADIO �
_ fi l_� __ � R_ �
I o
I 10
TIME I ms )
I , _
20
Figure 4 Integrated profiles for the Crab pulsar, PSR 0531 +2 1 , from radio to y-ray frequencies. Data are from Manchester (1971), Warner, Nather & MacFarlane (1969),
Rappaport et al. (1971) and Kurfess (1971).
Ann
u. R
ev. A
stro
. Ast
roph
ys. 1
977.
15:1
9-44
. Dow
nloa
ded
from
ww
w.a
nnua
lrev
iew
s.or
gby
Uni
vers
ity o
f Sa
skat
chew
an o
n 10
/07/
13. F
or p
erso
nal u
se o
nly.
26 TAYLOR & MANCHESTER
tion near the pulse peak. The position-angle variation appears to be similar to that characteristic of Type C pulsars, but may be more complicated near the minimum owing to the uncertainty in the interstellar polarization (Ferguson, Cocke & Gehrels 1974). A limit of 0.07% has been set on the circular polarization at the peak of the main pulse by Cocke, Muncaster & Gehrels (1971).
Individual Pulses
Unlike the integrated profile, which is very stable, individual pulses vary greatly in shape, intensity, and polarization. The short time scale of these variations shows that they are almost certainly associated with the emission process rather than with the interstellar medium, so their study is an important aspect of pulsar astronomy.
SUBPULSES Individual pulses typically consist of one or more subpulses that have a characteristic width of 3-10° of longitude. For a given pulsar this width is either independent of frequency or at most weakly dependent on frequency. Subpulses usually have a rather simple, almost Gaussian, shape and may fall anywhere within the integrated profile; the form of the integrated profile results from variation with longitude of both the strength and the frequency of occurrence of subpulses. Observations of series of individual pulses show that the pulse modulation indices are generally between 0.5 and 3, are different for different components of the integrated profile, and are larger at lower frequencies (Backer 1973, Taylor, Manchester & Huguenin 1975). These pulse-to-pulse fluctuations are highly correlated at frequencies separated by several hundred megahertz, which shows that subpulse modulation is a broadband process. Sporadic narrow-band emission at frequencies around 100 MHz has been reported by UdaI'tsov & Zlobin (1974) and Zlobin & Udal'tsov (1 975). The narrow features appear in about 10% of pulses from PSRs 0329 + 54, 0834+06, 0950 + 08, and 1919 +21 and typically have a bandwidth of a few megahertz.
Histograms of pulse intensities (Smith 1973, Hesse & Wielebinski 1974, Ritchings 1976) are often bimodal, with one of the maxima at pulse intensity zero. The missing or "null" pulses,first discussed by Backer (1970b), are weaker than normal pulses by at least a factor of 100 and tend to come in groups of from just a few missing pulses up to 100 or more. Ritchings (1976) has shown that the fraction of null pulses observed is greater in long-period pulsars, especially those with smallperiod derivatives. This suggests that a large fraction of null pulses may indicate an advanced state of senility for a pulsar.
Spectral analyses of the pulse-to-pulse energy fluctuations show that some pulsars exhibit secondary periodicities (e.g. Taylor & Huguenin 1971). Observed modulation frequencies range from about 0. 1 cycles/period up to very close to the Nyquist value, 0.5 cycles/period. Strong features in the fluctuation spectrum occur preferentially in longer-period (usually Type C) pulsars and are sometimes narrow with a fractional width (11f1f) of only a few percent. Pulsars with periods less than 0.75 sec (usually Type S) generally have featureless fluctuation spectra that either are flat or rise gradually toward low frequencies. Computation of independent fluctuation spectra for different pulse longitude regions (Backer 1973, Schonhardt & Sieber 1973,
Ann
u. R
ev. A
stro
. Ast
roph
ys. 1
977.
15:1
9-44
. Dow
nloa
ded
from
ww
w.a
nnua
lrev
iew
s.or
gby
Uni
vers
ity o
f Sa
skat
chew
an o
n 10
/07/
13. F
or p
erso
nal u
se o
nly.
RECENT OBSERVATIONS OF PULSARS 27
Backer, Rankin & CampbeU1975) show that the periodic modulations are frequently confined to just part of the profile. For example, in PSR 1237 + 25, a Type C pulsar with five components, the periodic modulation is present only in the outer components (1 and 5). A similar symmetry of fluctuation characteristics about the profile center is observed in other Type C pulsars. A relationship between the periodic fluctuations and mode changing in PSR 1237 + 25 has been found by Taylor, Manchester & Huguenin (1975). When this pulsar is in its second mode (in which components 4 and 5 are weak), the periodic modulation of component 1 disappears.
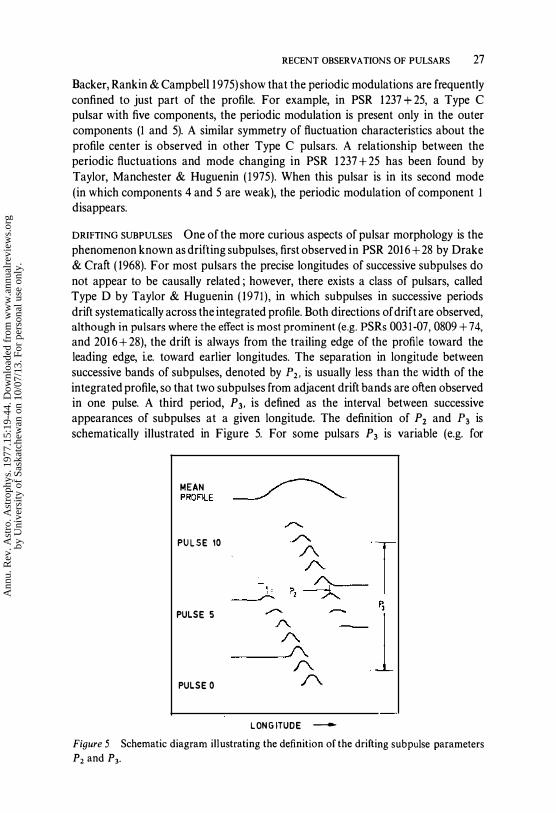
DRIFTING SUBPULSES One of the more curious aspects of pulsar morphology is the phenomenon known as drifting subpulses, first observed in PSR 2016 + 28 by Drake & Craft ( 1968). For most pulsars the precise longitudes of successive subpulses do not appear to be causally related; however, there exists a class of pulsars, called Type D by Taylor & Huguenin ( 1971), in which sub pulses in successive periods drift systematically across the integrated profile. Both directions of drift are observed, although in pulsars where the effect is most prominent (e.g. PSRs 0031-07, 0809 + 74, and 2016 + 28), the drift is always from the trailing edge of the profile toward the leading edge, i.e. toward earlier longitudes. The separation in longitude between successive bands of sub pulses, denoted by P2. is usually less than the width of the integrated profile, so that two subpulses from adjacent drift bands are often observed in one pulse. A third period, P 3. is defined as the interval between successive appearances of sub pulses at a given longitude. The definition of P2 and P3 is schematically illustrated in Figure 5. For some pulsars P3 is variable (e.g. for
MEAN � PROFILE � "'--
PULSE 10
PULSE 5
PULSE 0
LONGITUOE -Figure 5 Schematic diagram illustrating the definition of the drifting sub pulse parameters P2 and P3•
Ann
u. R
ev. A
stro
. Ast
roph
ys. 1
977.
15:1
9-44
. Dow
nloa
ded
from
ww
w.a
nnua
lrev
iew
s.or
gby
Uni
vers
ity o
f Sa
skat
chew
an o
n 10
/07/
13. F
or p
erso
nal u
se o
nly.

28 TAYLOR & MANCHESTER
PSR 2016 + 28, from 3 to 15 periods) but the subpulse spacing, P2. is more stable. Hence subpulses drift across the profile more slowly when P3 is large. For PSR 0031-07, P 3 appears to be restricted to one of three approximately harmonically related values, 4, 7, and 13 periods respectively (Huguenin, Taylor & Troland 1970).
For pulsars such as PSR 0809 + 74 (e.g. Page 1 973) where P3 is stable, there is a corresponding feature at frequency P31 in the fluctuation spectrum. Variation of the phase of this periodic component as a function of longitude can reveal drifting behavior that is otherwise difficult to detect (Backer 1973, Backer, Rankin & Campbell 1975). Especially for pulsars where P3 is close to two periods (the Nyquist value), there is an ambiguity in the drift direction resulting from possible aliasing of the periodic component (Sieber & Oster 1 975). For example, in PSR 0943 + 10, a P 3 of 2.11 periods corresponds to drift toward later longitudes at a rate of 4.00 per period, whereas for the alia sed P3 of 1.90 periods the drift is towards earlier longitudes at a rate of 4.40 per period. The ambiguity in drift direction can only be resolved by correlation of some feature down the drift band. So far
-17 1 0
0·01 I
0·1
o o
o o r1' 0
00 00
PERIOD Is)
.
/
10
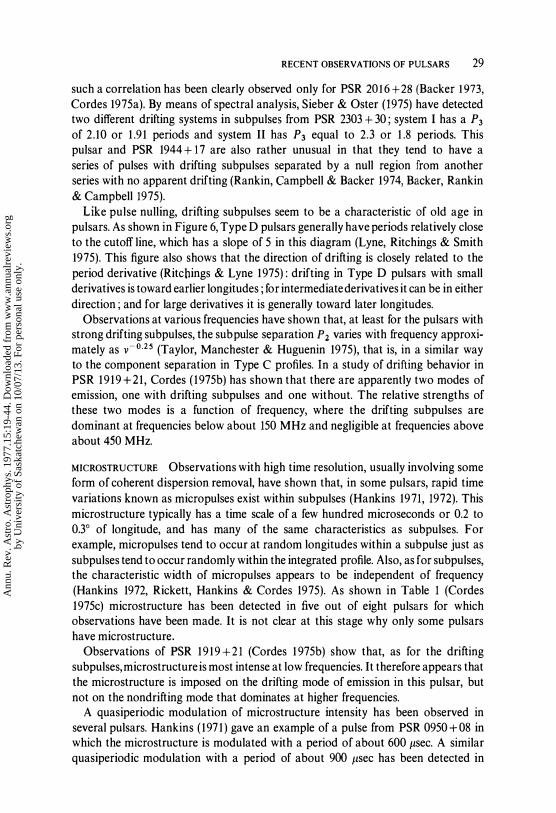
Figure 6 Period derivative plotted against period for 87 pulsars. Pulsars that have drifting subpulses (Type D) are plotted as squares. The direction of subpulse drift is toward earlier longitudes if the square is open, toward later longitudes if it is filled, and if the square is half-filled, both directions of drift are seen. The sloping line apparently represents a period beyond which no pulsed emission is possible.
Ann
u. R
ev. A
stro
. Ast
roph
ys. 1
977.
15:1
9-44
. Dow
nloa
ded
from
ww
w.a
nnua
lrev
iew
s.or
gby
Uni
vers
ity o
f Sa
skat
chew
an o
n 10
/07/
13. F
or p
erso
nal u
se o
nly.
RECENT OBSERVATIONS OF PULSARS 29
such a correlation has been clearly observed only for PSR 2016+28 (Backer 1973, Cordes 1975a). By means of spectral analysis, Sieber & Oster (1975) have detected two different drifting systems in subpulses from PSR 2303 + 30; system I has a P 3 of 2.10 or 1 .91 periods and system II has P3 equal to 2.3 or 1 .8 periods. This pulsar and PSR 1944 + 17 are also rather unusual in that they tend to have a series of pulses with drifting subpulses separated by a null region from another series with no apparent drifting (Rankin, Campbell & Backer 1974, Backer, Rankin & Campbell 1975).
Like pulse nulling, drifting subpulses seem to be a characteristic of old age in pulsars. As shown in Figure 6, Type D pulsars generally have periods relatively close to the cutoff line, which has a slope of 5 in this diagram (Lyne, Ritchings & Smith 1975). This figure also shows that the direction of drifting is closely related to the period derivative (Ritchings & Lyne 1975): drifting in Type D pulsars with small derivatives is toward earlier longitudes; for intermediate derivatives it can be in either direction; and for large derivatives it is generally toward later longitudes.
Observations at various frequencies have shown that, at least for the pulsars with strong drifting subpulses, the sub pulse separation P2 varies with frequency approximately as V�O.25 (Taylor, Manchester & Huguenin 1975), that is, in a similar way to the component separation in Type C profiles. In a study of drifting behavior in PSR 1919 + 21, Cordes ( 1975b) has shown that there are apparently two modes of emission, one with drifting subpulses and one without. The relative strengths of these two modes is a function of frequency, where the drifting subpulses are dominant at frequencies below about 150 MHz and negligible at frequencies above about 450 MHz.
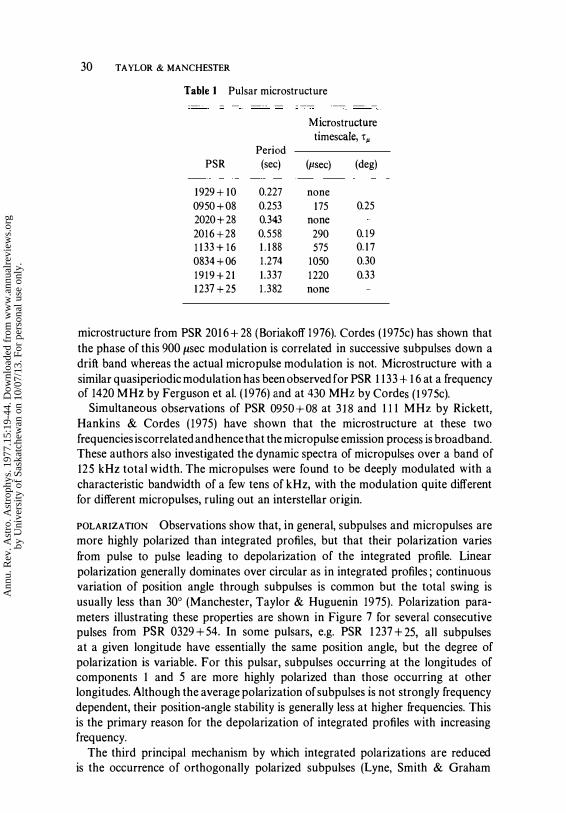
MICROSTRUCTURE Observations with high time resolution, usually involving some form of coherent dispersion removal, have shown that, in some pulsars, rapid time variations known as micro pulses exist within sub pulses (Hankins 1971, 1972). This microstructure typically has a time scale of a few hundred microseconds or 0.2 to 003° of longitude, and has many of the same characteristics as subpulses. For example, micropulses tend to occur at random longitudes within a sub pulse just as subpulses tend to occur randomly within the integrated profile. Also, as for subpulses, the characteristic width of micro pulses appears to be independent of frequency (Hankins 1972, Rickett, Hankins & Cordes 1975). As shown in Table 1 (Cordes 1975c) microstructure has been detected in five out of eight pulsars for which observations have been made. It is not clear at this stage why only some pulsars have microstructure.
Observations of PSR 1919 + 2 1 (Cordes 1975b) show that, as for the drifting subpulses, microstructure is most intense at low frequencies. It therefore appears that the microstructure is imposed on the drifting mode of emission in this pulsar, but not on the nondrifting mode that dominates at higher frequencies.
A quasiperiodic modulation of microstructure intensity has been observed in several pulsars. Hankins ( 1971 ) gave an example of a pulse from PSR 0950+08 in which the microstructure is modulated with a period of about 600 J.lsec. A similar quasiperiodic modulation with a period of about 900 J.lsec has been detected in
Ann
u. R
ev. A
stro
. Ast
roph
ys. 1
977.
15:1
9-44
. Dow
nloa
ded
from
ww
w.a
nnua
lrev
iew
s.or
gby
Uni
vers
ity o
f Sa
skat
chew
an o
n 10
/07/
13. F
or p
erso
nal u
se o
nly.
30 TAYLOR & MANCHESTER
Table I Pulsar microstructure
Microstructure timescale, r #
Period PSR (sec) (psec) (deg)
1929+10 0.227 none 0950+08 0.253 175 0.25 2020+28 0.343 none 2016 + 28 0.558 290 0.19 1133+16 1.188 575 0.17 0834+06 1.274 1050 0.30 1919+21 1.337 1220 0.33 1237 +25 1.382 none
microstructure from PSR 2016 + 28 (Boriakoff 1976). Cordes ( 1975c) has shown that the phase of this 900 J1.sec modulation is correlated in successive subpulses down a drift band whereas the actual micro pulse modulation is not. Microstructure with a similar quasiperiodic modulation has been observed for PSR 1 133 + 1 6 at a frequency of 1420 MHz by Ferguson et al. ( 1976) and at 430 MHz by Cordes (1975c).
Simultaneous observations of PSR 0950+08 at 318 and 1 1 1 MHz by Rickett, Hankins & Cordes (1975) have shown that the microstructure at these two frequencies is correlated and hence that the micropulse emission process is broadband. These authors also investigated the dynamic spectra of micro pulses over a band of 125 kHz total width. The micro pulses were found to be deeply modulated with a characteristic bandwidth of a few tens of kHz, with the modulation quite different for different micropu\ses, ruling out an interstellar origin.
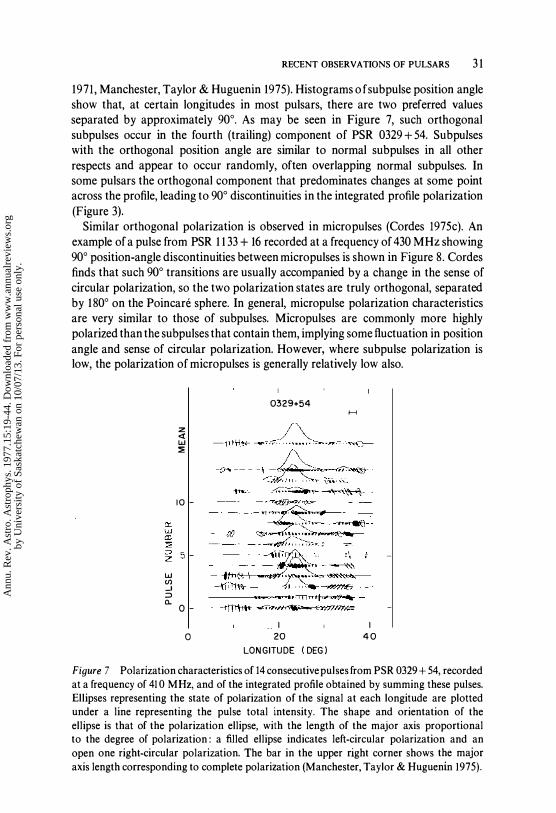
POLARIZATION Observations show that, in general, subpulses and micropulses are more highly polarized than integrated profiles, but that their polarization varies from pulse to pulse leading to depolarization of the integrated profile. Linear polarization generally dominates over circular as in integrated profiles; continuous variation of position angle through subpulses is common but the total swing is usually less than 30° (Manchester, Taylor & Huguenin 1975). Polarization parameters illustrating these properties are shown in Figure 7 for several consecutive pulses from PSR 0329 + 54. In some pulsars, e.g. PSR 1237 + 25, all subpulses at a given longitude have essentially the same position angle, but the degree of polarization is variable. For this pulsar, subpulses occurring at the longitudes of components 1 and 5 are more highly polarized than those occurring at other longitudes. Although the average polarization of subpulses is not strongly frequency dependent, their position-angle stability is generally less at higher frequencies. This is the primary reason for the depolarization of integrated profiles with increasing frequency.
The third principal mechanism by which integrated polarizations are reduced is the occurrence of orthogonally polarized subpulses (Lyne, Smith & Graham
Ann
u. R
ev. A
stro
. Ast
roph
ys. 1
977.
15:1
9-44
. Dow
nloa
ded
from
ww
w.a
nnua
lrev
iew
s.or
gby
Uni
vers
ity o
f Sa
skat
chew
an o
n 10
/07/
13. F
or p
erso
nal u
se o
nly.
RECENT OBSERVATIONS OF PULSARS 3 1
1971, Manchester, Taylor & Huguenin 1975). Histograms of sub pulse position angle show that, at certain longitudes in most pulsars, there are two preferred values separated by approximately 90°. As may be seen in Figure 7, such orthogonal subpulses occur in the fourth (trailing) component of PSR 0329 + 54. Subpulses with the orthogonal position angle are similar to normal sub pulses in all other respects and appear to occur randomly, often overlapping normal subpulses. In some pulsars the orthogonal component that predominates changes at some point across the profile, leading to 90° discontinuities in the integrated profile polarization (Figure 3).
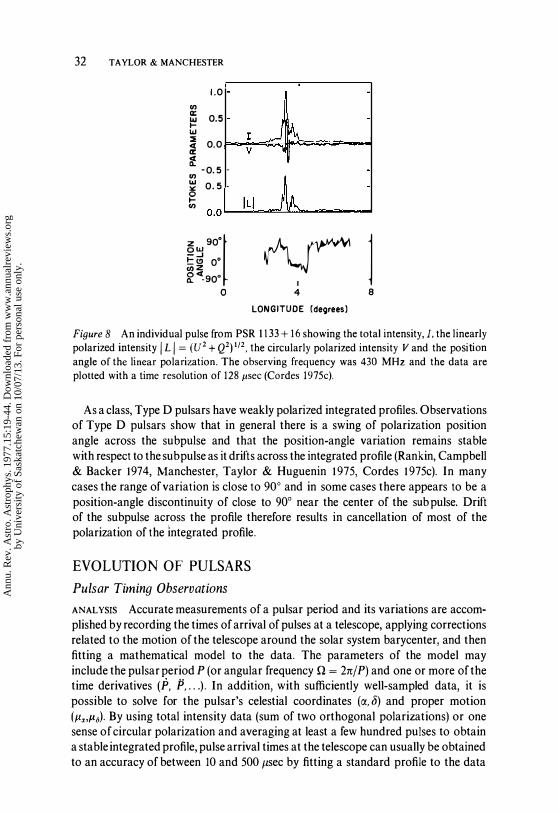
Similar orthogonal polarization is observed in micro pulses (Cordes 1975c). An example of a pulse from PSR 1 1 33 + 16 recorded at a frequency of 430 MHz showing 90° position-angle discontinuities between micro pulses is shown in Figure 8. Cordes finds that such 90° transitions are usually accompanied by a change in the sense of circular polarization, so the two polarization states are truly orthogonal, separated by 180° on the Poincare sphere. In general, micropulse polarization characteristics are very similar to those of subpulses. Micropulses are commonly more highly polarized than the subpulses that contain them, implying some fluctuation in position angle and sense of circular polarization. However, where subpulse polarization is low, the polarization of micro pulses is generally relatively low also.
w (/) --1 ;;) D-
z « w ::;;
10
O
o
0329+54 H
".-0 .' .,:'"".1.' .... 17 ....
I 20
LONGITUDE (DEG)
I 40
Figure 7 Polarization characteristics of 14 consecutive pulses from PSR 0329 + 54, recorded at a frequency of 41 0 MHz, and of the integrated profile obtained by summing these pulses. Ellipses representing the state of polarization of the signal at each longitude are plotted under a line representing the pulse total intensity. The shape and orientation of the ellipse is that of the polarization ellipse, with the length of the major axis proportional to the degree of polarization: a filled ellipse indicates left-circular polarization and an open one right-circular polarization. The bar in the upper right corner shows the major axis length corresponding to complete polarization (Manchester, Taylor & Huguenin 1975).
Ann
u. R
ev. A
stro
. Ast
roph
ys. 1
977.
15:1
9-44
. Dow
nloa
ded
from
ww
w.a
nnua
lrev
iew
s.or
gby
Uni
vers
ity o
f Sa
skat
chew
an o
n 10
/07/
13. F
or p
erso
nal u
se o
nly.
32 TAYLOR & MANCHESTER
1.0 '" a: � 0.5 w � 0.0 I=-��:.-t;f:;�...c=== ...... -I � '" -0.5 � 0.5 � O.OL.-..:.I;...:L I ....... =L�_==_-d
Z 900t ow -...J !:e> O· (J)Z � <'90·
o �l
4 LONGITUDE (degrees)
8
Figure 8 An individual pulse from PSR 1133 + 16 showing the total intensity, 1. the linearly polarized intensity I L I = (U2 + Q2) 1/2, the circularly polarized intensity V and the position angle of the linear polarization. The observing frequency was 430 MHz and the data are plotted with a time resolution of 128 psec (Cordes 1975c).
As a class, Type D pulsars have weakly polarized integrated profiles. Observations of Type D pulsars show that in general there is a swing of polarization position angle across the subpulse and that the position-angle variation remains stable with respect to the sub pulse as it drifts across the integrated profile (Rankin, Campbell & Backer 1974, Manchester, Taylor & Huguenin 1975, Cordes 1975c). In many cases the range of variation is close to 90° and in some cases there appears to be a position-angle discontinuity of close to 900 near the center of the sub pulse. Drift of the subpulse across the profile therefore results in cancellation of most of the polarization of the integrated profile.
EVOLUTION OF PULSARS Pulsar Timing Observations
ANAL YSIS Accurate measurements of a pulsar period and its variations are accomplished by recording the times of arrival of pulses at a telescope, applying corrections related to the motion of the telescope around the solar system barycenter, and then fitting a mathematical model to the data. The parameters of the model may include the pulsar period P (or angular frequency Q = 2nfP) and one or more of the time derivatives (P, P, .. . ). In addition, with sufficiently well-sampled data, it is possible to solve for the pulsar's celestial coordinates (C(, b) and proper motion (J.l"J.lii)' By using total intensity data (sum of two orthogonal polarizations) or one sense of circular polarization and averaging at least a few hundred pulses to obtain a stable integrated profile, pulse arrival times at the telescope can usually be obtained to an accuracy of between 10 and 500 /lsec by fitting a standard profile to the data
Ann
u. R
ev. A
stro
. Ast
roph
ys. 1
977.
15:1
9-44
. Dow
nloa
ded
from
ww
w.a
nnua
lrev
iew
s.or
gby
Uni
vers
ity o
f Sa
skat
chew
an o
n 10
/07/
13. F
or p
erso
nal u
se o
nly.
RECENT OBSERVATIONS OF PULSARS 33
(e.g. Manchester & Peters 1972, Groth 1975). Effects of the Earth's motions are removed by referring arrival times to the solar system barycenter using an ephemeris that is in most cases derived from planetary radar observations (e.g. Ash et al. 1967). Corrections must also be made for the annual variation in the rate of terrestrial clocks caused by changes in distance between Earth and Sun.
The reduction of observed pulse arrival times to yield values of P, P, ex, b. '" is usually done by means of a linearized least-squares fitting procedure that solves for small corrections to the parameters in question. In the one known instance of a pulsar in a binary system (Hulse & Taylor 1975a), the orbital parameters are also included in the least-squares fit; the solution then yields an accurate description of the orbit and its secular changes as well as the behavior of the pulsar (Taylor et al. 1976). A thorough discussion of both the timing corrections and the fitting procedure has recently been published by Blandford & Teukolsky (1976).
In the absence of inherent timing irregularities much larger than the typical measurement uncertainty of ",200 flsec, it is possible to obtain, from an accumulation of several years of data on a given pulsar, measurement of the period to within ± 10-12 sec and of the period derivative to ± 1O� 18 sec sec-I. The accuracy of the derived positions is in most cases limited by uncertainty in the orientation of the planetary coordinate system, currently believed to be about ±0".1 (Groth 1975).
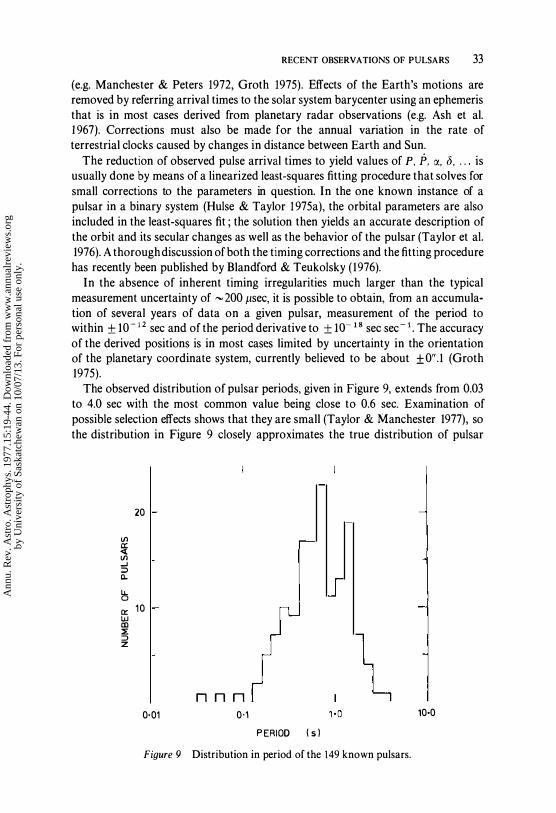
The observed distribution of pulsar periods, given in Figure 9, extends from 0.03 to 4.0 sec with the most common value being close to 0.6 sec. Examination of possible selection effects shows that they are small (Taylor & Manchester 1977), so the distribution in Figure 9 closely approximates the true distribution of pulsar
Vl a:: <t Vl -' ::> c..
lJ.. 0
[:t: w III :l: ::> z
20
10
0·01 nnn
0'1 PERIOD (sl
Figure 9 Distribution in period of the 149 known pulsars.
10·0
Ann
u. R
ev. A
stro
. Ast
roph
ys. 1
977.
15:1
9-44
. Dow
nloa
ded
from
ww
w.a
nnua
lrev
iew
s.or
gby
Uni
vers
ity o
f Sa
skat
chew
an o
n 10
/07/
13. F
or p
erso
nal u
se o
nly.
34 TAYLOR & MANCHESTER
periods. The distribution is apparently bimodal with a gap at periods close to 1.0 sec. This gap shows up in independent surveys (Hulse & Taylor 1975b, Davies, Lyne & Seiradakis 1 977) and may be related to division of pulsars into Type S and Type C classes.
SECULAR VARIATIONS At the time of writing nearly 90 pulsars have measured period derivatives. Most of these derivatives have been obtained from full timing solutions (e.g. Manchester & Peters 1 972, Richards, Rankin & Zeissig 1974, Gullahorn et al. 1976), but 36 were obtained by measuring periods in two sessions spaced by precisely one year, thereby avoiding errors resulting from uncertainty in the assumed pulsar position (Lyne, Ritchings & Smith 1975). All observed derivatives are positive, that is, the pulsars are all slowing down. The rates vary between about 4.2 x 10⁻¹³ sec sec-lor 36 nsec day-I for the Crab pulsar and 1 .6 x 10-18 sec sec-lor 0.14 psec day-I for PSR 1952 + 29 . Except for the Crab and Vela pulsars (at the top left of Figure 6), there is little correlation between period and period derivative. It is notable that the binary pulsar has a very small derivative (8.8 x 10⁻¹⁸ sec sec-I) despite the fact that its period of 59 msec is the second shortest known (Taylor et al. 1976).
In most theoretical models, the braking torque is proportional to some power n
of the rotation frequency, so that
( 1) The parameter n, known as the braking index, can in principle be determined from a measurement of the period or frequency second derivative, because differentiation of ( 1 ) yields the relation
n = Qn/Q2. (2) The validity of the braking law (1) can be checked if the third derivative is measurable, because differentiating once again gives
(3) If the pulsar magnetic field is dipolar in form, the braking index n is equal to 3 (Ostriker & Gunn 1969, Goldreich & Julian 1 969). The value will be greater than 3 if multipole electromagnetic or gravitational radiation is an important energy loss process, if the magnetic field is decaying, or if the magnetic axis is moving toward alignment with the rotation axis. On the other hand, it will be less than three if the field lines are deformed radially outward (by, for example, inertial effects) or if the magnetic axis is moving toward counteralignment (i.e. perpendicular to the rotation axis).
Unfortunately, the value of n, and hence of n, has been measured for only one pulsar, the one in the Crab Nebula. Groth ( 1975) obtains the value n = 2.5 15 ±0.005, somewhat less than the "canonical" value of 3. This suggests that the radial variation of magnetic field strength between the pulsar and the light cylinder is somewhat slower than that characterizing a dipole (r -3), and/or that the magnetic axis is moving toward counter-alignment. The presence of an interpulse in the Crab pulse profile
Ann
u. R
ev. A
stro
. Ast
roph
ys. 1
977.
15:1
9-44
. Dow
nloa
ded
from
ww
w.a
nnua
lrev
iew
s.or
gby
Uni
vers
ity o
f Sa
skat
chew
an o
n 10
/07/
13. F
or p
erso
nal u
se o
nly.
RECENT OBSERVATIONS OF PULSARS 35
(Figure 4) suggests that the magnetic and rotational axes are already almost perpendicular. For other pulsars the frequency second derivative has not been measurable because insufficient time is spanned by the measurements and/or because inherent timing irregularities exist in the pulsar. The same comment applies to the term n for the Crab pulsar.
If all pulsars followed similar evolutionary tracks, the common braking index could be estimated from a plot of P vs P such as that shown in Figure 6. However, the wide scatter of points in Figure 6 proves that all pulsars do not evolve along the same path. For n = 3, a given pulsar will evolve along a line of constant PP. i.e. a line of slope - 1 in Figure 6. The data and Equation (I) then imply a range of about five orders of magnitude in the parameter B6Ro/I. where Bo is the surface magnetic field strength, R is the neutron star radius, and I is the moment of inertia (Greenstein 1 972). Several explanations for the wide scatter of points exist: (a) pulsars may be born with different masses, so that R6 / I covers a wide range; (b) pulsars may be born with different surface field strengths; (e) the magnetic fields may decay significantly on time scales of the order of 106 yr; or any combination of these possibilities may be true. Lyne, Ritchings & Smith (1975) have interpreted Figure 6 as indicative of magnetic decay, chiefly because the observed number of short-period pulsars with small-period derivatives is smaller than would be expected if pulsars followed straight evolutionary paths with n = 3. Although the statistical basis for this conclusion is not very strong, and although theoretical work (Ewart, Guyer & Greenstein 1975) suggests that magnetic decay on such short time scales is unlikely, independent arguments presented below suggest that pulsars must cease to radiate on a time scale of a few million years. Decay of the magnetic field would have this effect.
IRREGULAR VARIATIONS In addition to systematic period variations that can be fitted by Equation (1), many pulsars have unpredictable period changes of significant magnitude. These changes appear to be of two main types: (a) sudden, apparently discontinuous decreases in period, and (b) small irregular fluctuations or period "noise." By far the largest of these irregularities are the jumps (glitches) observed in the period of the Vela pulsar. Three of these events have occurred over a sevenyear interval (Radhakrishnan & Manchester 1969, Reichley & Downs 1969, 1971, Manchester, Goss & Hamilton 1976). In each case the pulsation frequency increased by a fractional amount !'lU/U � 2 x 10⁻⁶, and at the same time the slowdown rate increased by an amount !'lQ/Q � 10-2 before slowly relaxing toward its original value. The post-jump decay of the period appears to be consistent with the "twocomponent" model for neutron stars (Baym et al. 1969), in which much of the mass of the neutron star is in a superfluid state. This model predicts an exponential decay of 0. toward its pre-jump value; data for the third Vela discontinuity (Manchester et al. 1976) indicate that the decay time-constant is about 450 days and that the period will remain offset from the extrapolated pre-jump value by about 80% of the initial period decrease.
Similar but much smaller discontinuities have been observed in the Crab pulsar period in 1969 (Boynton et al. 1972) and 1975 (Lohsen 1975). Groth ( 1975) has
Ann
u. R
ev. A
stro
. Ast
roph
ys. 1
977.
15:1
9-44
. Dow
nloa
ded
from
ww
w.a
nnua
lrev
iew
s.or
gby
Uni
vers
ity o
f Sa
skat
chew
an o
n 10
/07/
13. F
or p
erso
nal u
se o
nly.
36 TAYLOR & MANCHESTER
argued that a third event in 1971 reported by Lohsen (1972) is most likely a statistical fluctuation in the period noise. For the 1 969 and 1975 events the fractional increases in pulsation frequency 80/0 were respectively 9 x 10⁻⁹ and 3.7 x 10⁻⁸, the fractional increases in derivative Mi/Q were about 2 x 10- 3 in both cases, and the decay times were respectively 5 days and 16 days. Although the post-jump period variations for these two jumps are separately consistent with the two-component neutron star model, the fact that the ratio of 8Q/Q to 80/0 differed for the two events is inconsistent with this model (Greenstein 1976).
Small-period discontinuities (80/0 � 10- 1 °) have been reported for several longer-period pulsars by Manchester & Taylor ( 1974) and Gullahorn et al. ( 1976). In these cases also, the post-jump decay does not seem to be consistent with the two-component model. It is possible that, as for the 1971 Crab event, these changes represent fluctuations in the period noise rather than discrete events of the Vela class.
..... CRAB 2msx 500 / '.
'" / -' 0 , / "--- �/-
-500
5 0329+54 I : it t � .... ��:� .. -j-0 f:- ..
" --... � .. ;. ... , I ( ,
-5
(j) 1508+55 Cl " r 0 5 � ii: I � ..... , :· .. ··.·co w
0 "�, c.. : ::J ,I " :::! -5 ·1 ".-.
:l: � :� "
...J <t
5 1919+21 I ::::> Cl u; 0 !- � ___ '_L _ _ _�
"�1 w -- -.. .-. ... ..-0:::
-5
5 2217+47
0 -I .. � �i. , '. ! J.-. '. -: I·- 7' " ..... - .. . • -;1: .-::
' 1 -5
I I I 1970.0 1972.0 1974.0 1976.0
DATE
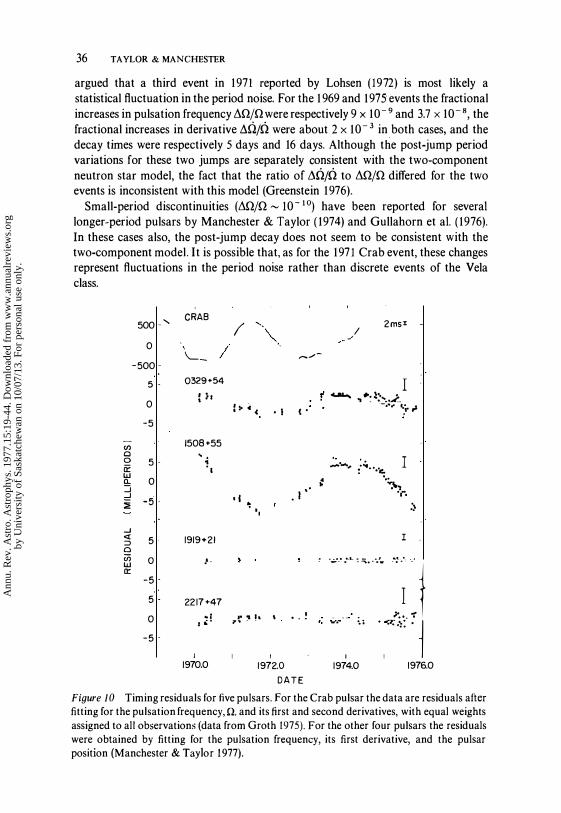
Figure 10 Timing residuals for five pulsars. For the Crab pulsar the data are residuals after fitting for the pulsation frequency, n. and its first and second derivatives, with equal weights assigned to all observations (data from Groth 1975). For the other four pulsars the residuals were obtained by fitting for the pulsation frequency, its first derivative, and the pulsar position (Manchester & Taylor 1977).
Ann
u. R
ev. A
stro
. Ast
roph
ys. 1
977.
15:1
9-44
. Dow
nloa
ded
from
ww
w.a
nnua
lrev
iew
s.or
gby
Uni
vers
ity o
f Sa
skat
chew
an o
n 10
/07/
13. F
or p
erso
nal u
se o
nly.

RECENT OBSERVATIONS OF PULSARS 37
In addition to occasional glitches, pulsar periods are in some cases continuously subject to small fluctuations that far exceed the uncertainties of measurement. These fluctuations are manifested as systematic timing residuals, i.e. differences between observed arrival times and those predicted by a Taylor series in Q and its derivative(s). Plots of residuals over an interval of about six years are shown for five different pulsars in Figure 10. In the case of the Crab pulsar, shown at the top, a cubic polynomial has been removed from the data, and for the other pulsars a parabolic curve has been removed. In all but two cases, systematic timing residuals are seen. Obviously the residuals can be reduced to low values by increasing the number of parameters fitted. However, subsequent observations are not correctly predicted by such fits, and the number of parameters required increases with the length of the data span. Furthermore, the implied braking indices are implausibly large and not constant. Boynton et al. (1972) and more recently Groth ( 1975) have interpreted the timing behavior of the Crab pulsar in terms of a random series of small frequency jumps with stationary statistical properties. From five years of timing data, Groth (1975) finds that the parameter R<i\Q2), where R is the average rate at which the frequency jumps occur, and <i\Q2) is their variance, to be about 2 x 10- 21 sec- 3. Since the individual jumps are not resolved with daily observations, R): 10-4 sec- \ so the rms size of the frequency jumps must be <i\Q2)1/2 <: 5 x 10⁻⁹ sec -I. Groth finds no statistically significant evidence for time variations in the parameters describing either the secular slowdown or the random irregularities.
The systematic residuals found for other pulsars (Figure 10) seem to have similar characteristics to those of the Crab pulsar. For PSR 0329 + 54 the parameter R<i\Q2) has a value of about 2 x 10- 27 sec-3 (Manchester & Taylor 1974). Generally, period noise seems to be greater in younger pulsars; the two pulsars in Figure 10 with no detectable irregularities both have relatively small values of the parameter pp-5, i.e. they are close to the "turn-off line" in Figure 6.
Galactic Distribution
The number of known pulsars (149) is now sufficiently large and the galactic distribution of these pulsars sufficiently widespread to permit meaningful analyses of the spatial distribution of pulsars within the Galaxy and of the pulsar luminosity function. Evaluation of these distributions requires an understanding of the effects of selection in pulsar surveys. About three-fourths of the known pulsars were detected in one or more of three major surveys, the Molonglo survey (Large & Vaughan 1971), the Jodrell Bank survey (Davies, Lyne & Seiradakis 1972, 1973), and the University of Massachusetts-Arecibo survey (Hulse & Taylor 1975b), for which selection effects are reasonably well understood. Data from the Arecibo survey have been analyzed by Roberts ( 1976b), that from the Jodrell Bank survey by Davies, Lyne & Sieradakis (1977), and that from both surveys by Taylor & Manchester (1977) to determine the pulsar luminosity function and the distribution and total number of pulsars in the Galaxy.
DISTANCES AND Z-DISTRIBUTION In order to scale these distributions, the distances to the pulsars must be known. It is fortunate that each pulsar comes equipped with
Ann
u. R
ev. A
stro
. Ast
roph
ys. 1
977.
15:1
9-44
. Dow
nloa
ded
from
ww
w.a
nnua
lrev
iew
s.or
gby
Uni
vers
ity o
f Sa
skat
chew
an o
n 10
/07/
13. F
or p
erso
nal u
se o
nly.
38 TAYLOR & MANCHESTER
a built-in distance indicator, its dispersion measure. Observations of neutralhydrogen absorption (e.g. Gomez-Gonzales & Guelin 1974, Ables & Manchester 1976) show that the mean interstellar electron density is close to 0.03 cm - 3 over a substantial portion of the Galaxy and hence that, at least on a statistical basis, the dispersion measure is a reasonably accurate distance indicator.
There is good evidence (e.g. Bridle & Venugopal 1969, Falgarone & Lequeux 1 973, Readhead & Duffett-Smith 1975) that the equivalent half-thickness of the interstellar electron layer is of the order of LOOO pc, much larger than that of most other galactic constituents including pulsars. Therefore the distribution of DM sin 1 b I, the "z-component" of dispersion measure, essentially represents the zdistribution of pulsars. For an assumed mean electron density <ne) = 0.03 cm- 3 a t z = 0, the pulsar distribution i s such that <Z2) 1/2 � 270 pc and < I z I) � 230 pc. At present the data are not sufficient to determine whether the distribution follows an exponential law or, say, a Gaussian.
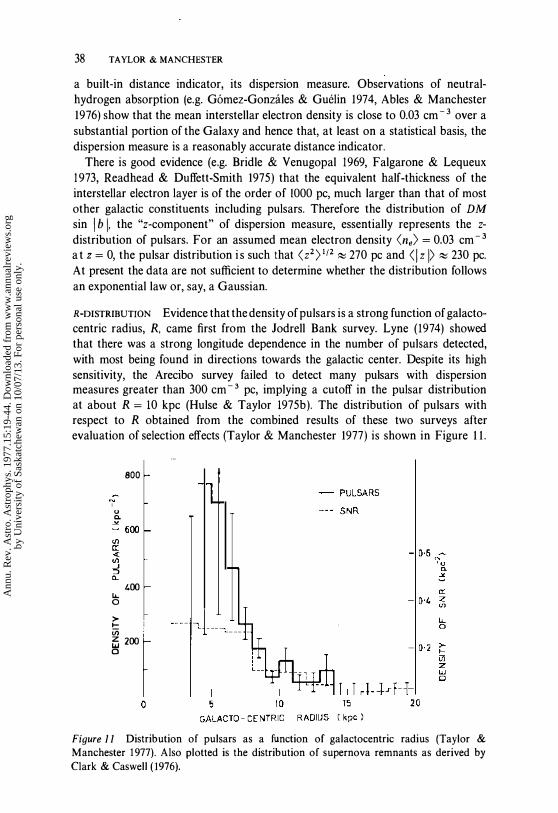
R-DISTRIBUTION Evidence that the density of pulsars is a strong function of galactocentric radius, R. came first from the Jodrell Bank survey. Lyne (1974) showed that there was a strong longitude dependence in the number of pulsars detected, with most being found in directions towards the galactic center. Despite its high sensitivity, the Arecibo survey failed to detect many pulsars with dispersion measures greater than 300 cm - 3 pc, implying a cutoff in the pulsar distribution at about R = 10 kpc (Hulse & Taylor 1975b). The distribution of pulsars with respect to R obtained from the combined results of these two surveys after evaluation of selection effects (Taylor & Manchester 1977) is shown in Figure 1 1 .
U Q.
Ll.. o >l-v;
800
1.00
� 200 a
Figure 1 1 Distribution of pulsars as a function of galactocentric radius (Taylor & Manchester 1977). Also plotted is the distribution of supernova remnants as derived by Clark & Caswell ( 1976).
Ann
u. R
ev. A
stro
. Ast
roph
ys. 1
977.
15:1
9-44
. Dow
nloa
ded
from
ww
w.a
nnua
lrev
iew
s.or
gby
Uni
vers
ity o
f Sa
skat
chew
an o
n 10
/07/
13. F
or p
erso
nal u
se o
nly.
RECENT OBSERVATIONS OF PULSARS 39
The plotted distribution is in units of pulsars per square kiloparsec, projected on to the galactic plane ; that is, it has already been integrated over z. The pulsar density is seen to increase rapidly inside the solar circle, reaching a maximum possibly as large as 5 times the local density at R ::::; 6 kpc. At smaller values of R the distribution is not well-determined, but may decrease somewhat. Outside the solar circle the density falls fairly rapidly, with no pulsars being found at R > 14 kpc. Davies, Lyne & Seiradakis ( 1977) find a similar distribution from their analysis of the Jodrell Bank data.
LUMINOSITY FUNCTION AN D GALACTIC POPULATION The pulsar luminosity function <I>(L) obtained from these analyses, where <I>(L) dL is the number of pulsars in a given volume with luminosity between L and L + dL. is well represented by a power law of the form <I>(L) = kL - Y over the observed range of luminosities. As the true radio luminosity of pulsars cannot be measured, a pseudo luminosity, L, is defined as the observed mean 400 MHz flux density multiplied by the square of the pulsar distance (or dispersion measure). Taylor & Manchester ( 1977) obtain a slope y = 1. l2±0.03 for logarithmic luminosity intervals, in good agreement with the value of 0.96 obtained by Davies, Lyne & Seiradakis ( 1977).
Assuming a cutoff in the luminosity function at about the lowest luminosities observed ( � 3 mJy kpc2), and a mean electron' density < ne> = 0.03 cm - 3, Taylor & Manchester (1977) find that the density of observable pulsars in the solar neighborhood is 90 ± 1 5 pulsars per square kilo parsec. This result is rather dependent on < ne> ; assuming < ne> = 0.025 cm - 3, Davies, Lyne & Seiradakis (1977) obtain a density of about 50 kpc- 2. Integration over the radial distribution shown in Figure 1 1 gives a total number of observable pulsars in the Galaxy of ( 1 . 3 ± 0.4) x 105 for < ne> = 0.03 cm - 3 or 2 x 10⁴ for < ne> = 0.02 cm - 3. Davies, Lyne & Seiradakis obtain a similar result, (1-3) x 105 pulsars. The much lower figure of 4000 derived by Roberts (1976b) appears to be a considerable underestimate. If only a fraction of all active pulsars are seen because of beaming effects, then the total number of active pulsars in the Galaxy may be greater than 5 x 10⁵•
Ages and Origins
CHARACTERISTIC AGES Before one can adequately assess the importance of pulsars as a galactic population, it is necessary to have some estimate of their active lifetime. If pulsars evolve with a braking index n = 3, the number in equal logarithmic period intervals would be expected to increase as p2. The distribution shown in Figure 9 therefore implies that many pulsars turn off at periods as short as 0.7 or 0.8 sec. If a pulsar was born spinning rapidly (P'6 � p2) and has since slowed down according to Equation ( 1 ), then its age is given by
Q p r == � ---.- =
(n - I )Q (n - liF (n #- 1 ) . (4)
For n = 3, this age, P/(2F). is known as the characteristic age. For the Crab pulsar, the characteristic age T = 1240 yr is close to the 922 yr elapsed since the supernova outburst ; similarly, the characteristic age of PSR 0833-45, 1. 1 x 10⁴ yr, is consistent
Ann
u. R
ev. A
stro
. Ast
roph
ys. 1
977.
15:1
9-44
. Dow
nloa
ded
from
ww
w.a
nnua
lrev
iew
s.or
gby
Uni
vers
ity o
f Sa
skat
chew
an o
n 10
/07/
13. F
or p
erso
nal u
se o
nly.
40 TAYLOR & MANCHESTER
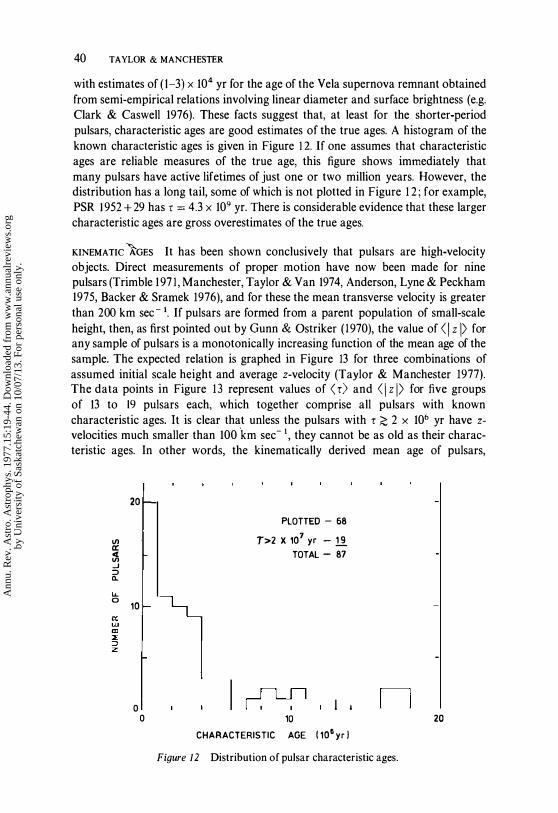
with estimates of ( 1-3) x 104 yr for the age of the Vela supernova remnant obtained from semi-empirical relations involving linear diameter and surface brightness (e.g. Clark & Caswell 1976). These facts suggest that, at least for the shorter-period pulsars, characteristic ages are good estimates of the true ages. A histogram of the known characteristic ages is given in Figure 1 2. If one assumes that characteristic ages are reliable measures of the true age, this figure shows immediately that many pulsars have active lifetimes of just one or two million years. However, the distribution has a long tail, some of which is not plotted in Figure 1 2 ; for example, PSR 1 952 + 29 has r = 4.3 x 10⁹ yr. There is considerable evidence that these larger characteristic ages are gross overestimates of the true ages.
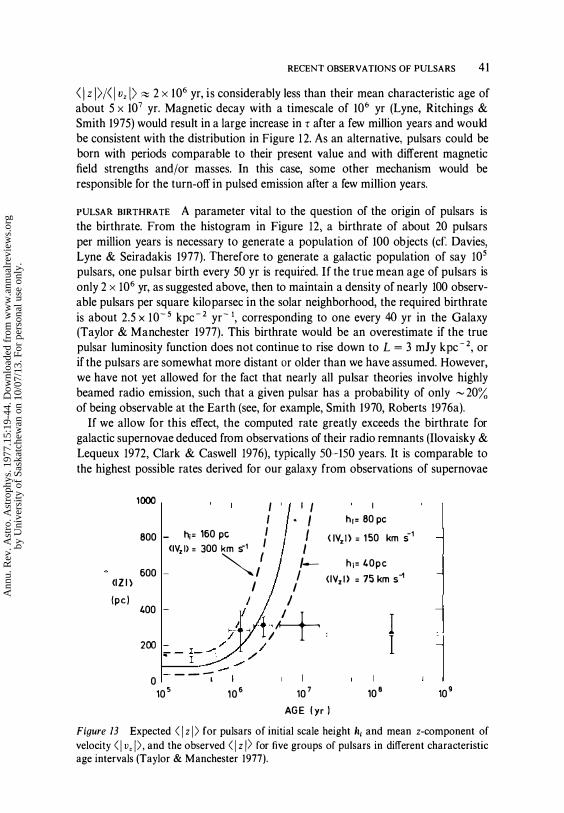
KINEMATIC )-GES It has been shown conclusively that pulsars are high-velocity objects. Direct measurements of proper motion have now been made for nine pulsars (Trimble 197 1 , Manchester, Taylor & Van 1974, Anderson, Lyne & Peckham 1975, Backer & Sramek 1976), and for these the mean transverse velocity is greater than 200 km sec - 1. If pulsars are formed from a parent population of small-scale height, then, as first pointed out by Gunn & Ostriker ( 1970), the value of < 1 z I> for any sample of pulsars is a monotonically increasing function of the mean age of the sample. The expected relation is graphed in Figure 13 for three combinations of assumed initial scale height and average z-velocity (Taylor & Manchester 1977). The data points in Figure 13 represent values of < r> and < 1 z I> for five groups of 13 to 19 pulsars each, which together comprise all pulsars with known characteristic ages. It is clear that unless the pulsars with r � 2 x 10⁶ yr have z
velocities much smaller than 100 km sec- t, they cannot be as old as their characteristic ages. In other words, the kinematically derived mean age of pulsars,
VI a: � .J � 0..
LL a
20
10
o o
PLOTTED - 68 T>2 X 10⁷ yr - 1l!.
TOTAL - 87
I I 10
CHARACTERISTIC AGE ( 106 yr )
Figure 12 Distribution of pulsar characteristic ages.
20
Ann
u. R
ev. A
stro
. Ast
roph
ys. 1
977.
15:1
9-44
. Dow
nloa
ded
from
ww
w.a
nnua
lrev
iew
s.or
gby
Uni
vers
ity o
f Sa
skat
chew
an o
n 10
/07/
13. F
or p
erso
nal u
se o
nly.
RECENT OBSERVATIONS OF PULSARS 41
< 1 z 1>/< 1 UZ I> � 2 x 10⁶ yr, is considerably less than their mean characteristic age of about 5 x 10⁷ yr. Magnetic decay with a timescale of 106 yr (Lyne, Ritchings & Smith 1975) would result in a large increase in T after a few million years and would be consistent with the distribution in Figure 12. As an alternative, pulsars could be born with periods comparable to their present value and with different magnetic field strengths and/or masses. In this case, some other mechanism would be responsible for the turn-off in pulsed emission after a few million years.
PULSAR BIRTHRATE A parameter vital to the question of the origin of pulsars is the birthrate. From the histogram in Figure 12, a birthrate of about 20 pulsars per million years is necessary to generate a popUlation of 100 objects (cf. Davies, Lyne & Seiradakis 1977). Therefore to generate a galactic population of say 105 pulsars, one pulsar birth every 50 yr is required. If the true mean age of pulsars is only 2 x 10⁶ yr, as suggested above, then to maintain a density of nearly 100 observable pulsars per square kilo parsec in the solar neighborhood, the required birthrate is about 2.5 x 10⁻⁵ kpc - 2 yr - 1, corresponding to one every 40 yr in the Galaxy (Taylor & Manchester 1977). This birthrate would be an overestimate if the true pulsar luminosity function does not continue to rise down to L = 3 mJy kpc-2, or if the pulsars are somewhat more distant or older than we have assumed. However, we have not yet allowed for the fact that nearly all pulsar theories involve highly beamed radio emission, such that a given pulsar has a probability of only � 20% of being observable at the Earth (see, for example, Smith 1970, Roberts 1976a).
If we allow for this effect, the computed rate greatly exceeds the birthrate for galactic supernovae deduced from observations of their radio remnants (Ilovaisky & Lequeux 1972, Clark & Caswell 1976), typically 50--150 years. It is comparable to the highest possible rates derived for our galaxy from observations of supernovae
1000
800
600 (IZ I ) (pc)
400
200
0
I ' I
hi: 160 pc I (IVz l) : 300 km 5-1 I
�/ /
/ /
I I I � I hi: 80 pc
I I
( lV. 1 ) : 1 50 km 5-1
1- hi: 40pc I (IVz ! > : 75 km 5-1
/ I
It+ : I I / /
..". - - - .-
L I 10 5 10 6 10 7 10 8
AG E ( yr )
I 109
Figure 13 Expected < I z l > for pulsars of initial scale height hi and mean z-component of velocity < 1 VZ I>, and the observed < 1 z I> for five groups of pulsars in different characteristic age intervals (Taylor & Manchester 1977).
Ann
u. R
ev. A
stro
. Ast
roph
ys. 1
977.
15:1
9-44
. Dow
nloa
ded
from
ww
w.a
nnua
lrev
iew
s.or
gby
Uni
vers
ity o
f Sa
skat
chew
an o
n 10
/07/
13. F
or p
erso
nal u
se o
nly.
42 TA YLOR & MANCHESTER
in external galaxies (Tam mann 1974). It would seem that one must consider seriously the possibility that some pulsars-perhaps the majority-are born in circumstances not accompaI}ied by a supernova explosion.
Ostriker, Richstone & Thuan (1974) and Biermann & Tinsley ( 1974) have shown that the death rate of stars with mass � 2.5 M0 is about 10-4 yr - 1 kpc- 2 in the solar neighborhood, about equal to the pulsar birthrate if 80% of pulsars are unobservable because of beaming effects. We note that the scale height of young pulsars (Figure 1 3) is more consistent with progenitors of mass 2.5-4 M0 than, say, > 6 M0. Stars of mass less than 4 M0 are generally thought to evolve into white dwarfs, but the present information seems to require that many of them must (at least eventually) become pulsars. Better determination of the low end of the pulsar luminosity function, as well as theoretical work on the final evolutionary tracks of massive stars, should heIp to resolve these problems.
Literature Cited
Ables, J. G., Manchester, R. N. 1976. Astron. Astroph ys. 50 : 1 77-84
Anderson, B., Lyne, A. G., Peckham, R. 1 1 975. Nature 258 : 2 1 5-17
Ash, M. E. , Shapiro, I . I . , Smith, W . B. 1 967. Astron. J. 72 : 338-50
Backer, D. C. 1970a. Nature 228 : 1 297-98 Backer, D. C 1970b. Nature 228 : 42-43 Backer, D. C 1972. Ap. J. 174 : L l 57-61 Backer, D. C 1973. Ap. J. 1 82 : 245-76 Backer, D. C 1976. Ap. J. 209 : 895-907 Backer, D. C, Boriakoff, V., Manchester,
R. N. 1973. Nature Phys. Sci. 243 : 77-78 Backer, D. C, Fisher, J. R. 1974. Ap. J. 1 89 :
1 37-45 Backer, D. C, Rankin, 1 M., Campbell, D. B.
1 975. Ap. J. 197 : 481-87 Backer, D. C, Sramek, R. A. 1 976. Astron. J.
8 1 : 430-32 Baym, G., Pethick, C, Pines, D., Ruderman,
M. 1 969. Nature 224 : 872-74 Biermann, P., Tinsley, B. M. 1974. Astron.
Astrophys. 30 : 1-12 Blandford, R. D., Teukolsky, S. A. 1 976. Ap.
J. 205: 580-9 1 Boriakoff, V. 1 976. Ap. J. Lett. 208: L43-46 Boriakoff, V., Payne, R. R. 1 974. Astrophys.
Lett. 1 5 : 1 75-76 Boynton, P. E., Groth, E. J., Hutchinson,
D. P., Nanos, G. P., Partridge, R. B., Wilkinson, D. T. 1972. Ap. J. 1 75 : 2 17-41
Bridle, A. H., Venugopal, V. R. 1969. Nature 224 : 545-47
Bruck, Yu. M., Ustimenko, B. Yu. 1 973. Nature Phys. Sci. 242 : 58-59
Bruck, Yu. M., Ustimenko, B. Yu. 1976. Nature Phys. Sci. 260 : 766-67
Clark, D. H., Caswell, 1 L. 1 976. M N RAS 1 74 : 267-305
Cocke, W. 1, Muncaster, G. W., Gehrels, T. 1 971 . Ap. J. Lett. 169 : L l I9-21
Cordes, 1 M. 1 975a. Ap. J. 208 : 944-54 Cordes, J. M. 1975b. Ap. J. 195 : 193-202 Cordes, J. M. 1 97Sc. PhD thesis. Univ. Calif.,
San Diego, pp. 1-173 Davies, 1 G., Lyne, A. G., Seiradakis, 1 H.
1972. Nature 240 : 229-30 Davies, 1 G., Lyne, A. G., Seiradakis, 1 H.
1 973. Nature Phys. Sci. 244 : 84-85 Davies, 1 G., Lyne, A. G., Seiradakis, J. H.
1 977. M N RAS. In press Downs, G. S., Reichley, P. E., Morris, G. A.
1973. Ap. J. Lett. 1 8 1 : LI43-46 Drake, F. D., Craft, H. D. 1968. Nature
220 : 23 1-35 Ewart, G. M., Guyer, R. A., Greenstein, G.
1975. Ap. J. 202 : 238-47 Falgarone, E., Lequeux, J. 1 973. Astron.
Astrophys. 25 : 253-60 Ferguson, D. C, Cocke, W. J., G"hrels, T.
1974. Ap. J. 190 : 375-80 Ferguson, D. C, Graham, D. A., Jones, B. B.,
Seiradakis, 1 H., Wielebinski, R. 1 976. Nature 260 : 25-27
Goldreich, P., Julian, W. H. 1 969. Ap. J. 1 57 : 869-80
Gomez-Gonzales, J., Guelin, M. 1 974. Astron. Astrophys. 32 : 441-46
Greenstein, G: 1 972. Ap. J. 1 77 : 251-53 Greenstein, G. 1 976. Ap. J. 208 : 836-48 Groth, E. 1 1975. Ap. J. Suppl. Ser., No.
293, 29 : 431-65 Gullahorn, G. E., Payne, R. R., Rankin, J. M.,
Richards, D. W. 1 976. Ap. J, Lett. 205 : LI SI-53 ;
Gunn, J. E., Ostriker, 1 P. 1 970. Ap. J. 160 : 979-1002
Hamilton, P. A., McCulloch, P. M., Ables,
Ann
u. R
ev. A
stro
. Ast
roph
ys. 1
977.
15:1
9-44
. Dow
nloa
ded
from
ww
w.a
nnua
lrev
iew
s.or
gby
Uni
vers
ity o
f Sa
skat
chew
an o
n 10
/07/
13. F
or p
erso
nal u
se o
nly.
1. G., Komesaroff, M. M. 1977a. MNRAS. In press
Hamilton, P. A., McCulloch, P. M., Manchester, R. N., Ables, 1. G. 1977b. M N RAS. Submitted for publication
Hankins, T. H. 1971. Ap. J. 1 69 : 487-94 Hankins, T. H . 1972. Ap. J. Lett. 1 77 : L l I-15 Harnden, F. R. , Gorenstein, P. 1 973. Nature
241 : 107-8 Helfand, D. 1., Manchester, R. N., Taylor,
J. H. 1975. Ap. J. 1 98 : 661-70 Hesse, K. H. 1973. Astron. Astrophys. 27 :
373-77 Hesse, K. H., Sieber, W., Wielebinski, R.
1973. Nature Phys. Sci. 245 : 57-58 Hesse, K H., Wiele bin ski, R. 1974. Astron.
Astrophys. 3 1 : 409-1 3 Hewish, A., Bell, S . J., Pilkington, 1. D . H.,
Scott, P. F., Collins, R. A. 1 968. Nature 2 1 7 : 709-1 3
H uguenin, G . R., Manchester, R . N., Taylor, 1. H. 1971 . Ap. J. 1 69 : 97-104
H uguenin, G. R., Taylor, 1. H., Helfand, D. 1. 1973. Ap. J. Lett. 1 8 1 : L l 39-42
H uguenin, G. R., Taylor, 1. H., Troland, T. H. 1970. Ap. J. 162 : 727-35
Hulse, R A., Taylor, J. H. 1 975a. Ap. J. Lett. 195 : L51-53
Hulse, R. A., Taylor, 1. H. 1 975b. Ap. J. Lett. 20 1 : L55-59
I1ovaisky, S. A., Lequeux, 1. 1972. Astron. Astrophys. 20 : 347-56
Kestenbaum, H. L., Ku, W., Novick, R, Wolff, R. S. 1976. Ap. J. Lett. 203 : L57-61
Kristian, 1., Visvanathan, N., Westphal, 1. A., Snellen, G. H. 1970. Ap. J. 1 62 : 475-83
Kurfess, 1. D. 1971. Ap. J. Lett. 1 68 : L39-42 Large, M. I., Vaughan, A. E. 1971 . MNRAS
1 5 1 : 277-87 Laros, J. G., Matteson, J. L., Pelling, R M.
1 973. Nature Phys. Sci. 246 : 109-1 1 Lohsen, E. 1972. Nature Phys. Sci. 236 : 70--71 Lohsen, E. 1 975. Nature 258 : 688-89 Lyne, A. G. 1971. MNRAS 1 53 : 27P-32P Lyne, A. G. 1974. Galactic Radio Astronomy,
IAU Symp. 60. ed. F. 1. Kerr, S. C. Simonson, pp. 87-95. Dordrecht : Reidel
Lyne, A. G., Ritchings, R. T., Smith, F. G. 1975. MNRAS 1 7 1 : 579-97
Lyne, A. G., Smith, F. G., Graham, D. A. 1971 . MNRAS 153 : 337-82
Lyne, A. G., Thorne, D. 1. 1975. MNRAS 1 72 : 97-108
Manchester, R. N. 1971 . Ap. J. Suppl., No. 199, 23 : 283-322
Manchester, R N., Goss, W. M., Hamilton, P. A. 1976. Nature 259 : 291-92
Manchester, R N., Hamilton, P. A., Goss, W. M., Newton, L. M. 1976. Proc. Astron. Soc. Aust. 3 : 8 1-83
Manchester, R N., Peters, W. L. 1972. Ap. J.
RECENT OBSERVATIONS OF PULSARS 43
1 73 : 221-26 Manchester, R. N., Taylor, 1. H. 1974. Ap. J.
Lett. 191 : L63-65 Manchester, R. N., Taylor, J .H. 1977. Pulsars,
pp. 1-275. San Francisco : Freeman Manchester, R. N., Taylor, 1. H:, H uguenin,
G. R. 1973. Ap. J. Lett. 1 79 : L7-10 Manchester, R. N., Taylor, J. H., H uguenin,
G. R. 1975. Ap. J. 196 : 83-102 Manchester, R. N., Taylor, 1. H., Van, Y. Y.
1974. Ap. J. Lett. 1 89 : L l I9-22 McCulloch, P. M., Hamilton, P. A., Ables,
1. G., Komesaroff, M. M. 1976. MNRAS 1 75 : 7 1 P-75P
McLean, A. 1. 0 . 1973. M NRAS 165 : 1 33-48 Mohanty, D. K, Balasubramanian, V. 1975.
MNRAS 1 7 1 : 1 7P-18P Moore, W. E., Agrawal, P. c., Garmire, G.
1974. Ap. J. Lett. 1 89 : Ll I 7- 1 8 o striker, J. P., Gunn, 1. E . 1969. Ap. J .
1 57 : 1 395-14 1 7 Ostriker, J. P., Richstone, D. O., Thuan, T . X.
1974. Ap. J. Lett. 188 : L87-89 Page, C. G. 1973. MNRAS 163 : 29-40 Pravdo, S. H., Becker, R. H., Boldt, E. A.,
Holt, S. S., Rothschild, R. E., Seriemitsos, P. J., Swank, J. H. 1976. Ap. J. Lett. 208 : L67-69
Radhakrishnan, V., Manchester, R. N. 1969. Nature 222 : 228-29
Rankin, 1. M., Campbell, D. B., Backer, D. C. 1974. Ap. J. 188 : 609- 1 3
Rankin, J . M., Comella, J . M., Craft, H. D., Richards, D. W.,Campbell, D. B., Counselman, C. C. 1970. Ap. J. 1 62 : 707-25
Rankin, 1. M., Payne, R. R., Campbell, D. B. 1974. Ap. J. Lett. 1 9 3 : L71-74
Rappaport, S., Bradt, H., Doxsey, R., Levine, A., Spada, G. 1974. Nature 25 1 : 471-72
Rappaport, S., Bradt, H., Mayer, W. 1971 . Nature Phys. Sci. 229 : 40-42
Readhead, A. C. S., Duffett-Smith, P. J. 1975. Astron. Astrophys. 42 : 1 5 1-53
Reichley, P. E., Downs, G. S. 1969. Nature 222 : 229-30
Reichley, P. E., Downs, G. S. 1971 . Nature Phys. Sci. 234 : 48
Richards, D. W., Rankin, 1. M., Zeissig, G. A. 1974. Nature 2 5 1 : 37-39
Rickett, B. J., Hankins, T. H., Cordes, J. M. 1975. Ap. J. 201 : 425-30
Ritchings, R. T. 1976. M N RAS 1 76 : 249-263
Ritchings, R. T., Lyne, A. G. 1975. Nature 257 : 293-94
Roberts, D. H. 1976a. Ap. J. 207 : 949-61 Roberts, D. H. 1976b. Ap. J. 205 : L29-33 Schonhardt, R. E., Sieber, W. 1971 Astrophys.
Lett. 1 4 : 61-64 Sieber, W. 1973. Astron. Astrophys. 28 : 237-
52
Ann
u. R
ev. A
stro
. Ast
roph
ys. 1
977.
15:1
9-44
. Dow
nloa
ded
from
ww
w.a
nnua
lrev
iew
s.or
gby
Uni
vers
ity o
f Sa
skat
chew
an o
n 10
/07/
13. F
or p
erso
nal u
se o
nly.
44 TAYLOR & MANCHESTER
Sieber, W., Oster, L. 1975. Astron. Astrophys. 38 : 325-27
Sieber, W., Reinecke, R., Wielebinski, R. 1975. Astron. Astrophys. 38 : 1 69-82
Smith, F. G. 1970. MNRAS 149 : 1-15 Smith, F. G. 1973. MNRAS 161 : 9P-lOP Tammann, G. A. 1974. Supernovae and
Supernova Remnants. ed. C. B. Cosmovici. pp. 155-85. Dordrecht : Reidel
Taylor, J. H., Hug!lenin, G. R. 1971. Ap. J. 167 : 273-91
Taylor, J. H., Hulse, R. A., Fowler, L. A., Gullahorn, G. E., Rankin, J. M. 1976. Ap. J. Lett. 206: L53-58 .
Taylor, J. H., Manchester, R. N. 1977. Ap. J. 215, No. 3
Taylor, J. H., Manchester, R. N., Huguenin, . G. R. 1975. Ap. J. 195 : 51 3-28 Thompson, D. J., Fichtel, C. E., Kniffen, D. A�
6gelman, H. B. 1975. Ap. J. Lett. 200: L79-82
Trimble, V. 1971. The Crab Nebula, IAU Symp. 460 ed. R. D. Davies, F. G. Smith. pp. 12-21. Dordrecht : Reidel
Udal'tsov, V. A., Zlobin, V. N. 1974. Astron. Astrophys. 37 : 2 1-25
Walraven, G. D., Hall, R. D., Meegan, C. A., Coleman, P. L., Shelton, D. H., Haymes, R. C. 1975. Ap. J. 202: 502-10
Warner, B., Nather, R. E., MacFarlane, M. 1969. Nature 222 : 233-38
Zlobin, V. No, Udal'tsov, Vo A. 1975. Astron. Zh. 52 : 1 139-42
Ann
u. R
ev. A
stro
. Ast
roph
ys. 1
977.
15:1
9-44
. Dow
nloa
ded
from
ww
w.a
nnua
lrev
iew
s.or
gby
Uni
vers
ity o
f Sa
skat
chew
an o
n 10
/07/
13. F
or p
erso
nal u
se o
nly.