Embed Size (px)
Citation preview
RESEARCH ARTICLE
Recent Positive Selection Has Acted On Genes Encoding ProteinsWith More Interactions Within the Whole Human Interactome
Pierre Luisi1†, David Alvarez-Ponce2,3†, Marc Pybus1, Mario A. Fares2,4, Jaume Bertranpetit1*
and Hafid Laayouni1,5*.
(† These authors contributed equally to this work)
1Institute of Evolutionary Biology (Universitat Pompeu Fabra-CSIC), CEXS-UPF-PRBB,
Barcelona, Catalonia, Spain.
2Integrative Systems Biology Group, Instituto de Biología Molecular y Celular de Plantas,
Consejo Superior de Investigaciones Científicas (CSIC)-Universidad Politécnica de Valencia
(UPV), Valencia, Spain.
3Biology Department, University of Nevada, Reno, NV, USA.
4Smurfit Institute of Genetics, University of Dublin, Trinity College, Dublin, Ireland.
5Departament de Genètica i de Microbiologia, Grup de Biologia Evolutiva (GBE), Universitat
Autonòma de Barcelona, Bellaterra (Barcelona), Spain
* Authors for correspondence.
Pierre Luisi:
IBE, Institut de Biologia Evolutiva (UPF-CSIC)
CEXS-Universitat Pompeu Fabra-PRBB
Doctor Aiguader 88
08003 Barcelona, Catalonia, Spain
email: [email protected]
David Alvarez-Ponce:
Instituto de Biología Molecular y Celular de Plantas (Consejo Superior de Investigaciones
Científicas-Universidad Politécnica de Valencia)
Ingeniero Fausto Elio s/n
46022 Valencia, Spain
Biology Department,
University of Nevada, Reno
1
© The Author(s) 2015. Published by Oxford University Press on behalf of the Society for Molecular Biology and Evolution.This is an Open Access article distributed under the terms of the Creative Commons Attribution License (http://creativecommons.org/licenses/by/4.0/), which permits unrestricted reuse, distribution, and reproduction in any medium, provided the original work is properly cited.
Genome Biology and Evolution Advance Access published April 2, 2015 doi:10.1093/gbe/evv055
Max Fleischmann Agriculture Building
1664 N. Virginia Street
Reno, NV 89557-0314
email: [email protected]
Marc Pybus:
IBE, Institut de Biologia Evolutiva (UPF-CSIC)
CEXS-Universitat Pompeu Fabra-PRBB
Doctor Aiguader 88
08003 Barcelona, Catalonia, Spain
email: [email protected]
Mario A. Fares:
Instituto de Biología Molecular y Celular de Plantas (Consejo Superior de Investigaciones
Científicas-Universidad Politécnica de Valencia)
Ingeniero Fausto Elio s/n
46022 Valencia, Spain
Smurfit Institute of Genetics,
University of Dublin,
Trinity College,
2 College Green
Dublin 2, Ireland
email: [email protected]
Hafid Laayouni:
IBE, Institut de Biologia Evolutiva (UPF-CSIC)
CEXS-Universitat Pompeu Fabra-PRBB
Doctor Aiguader 88
08003 Barcelona, Catalonia, Spain
Departament de Genètica i de Microbiologia
Facultat de Biociències, Edifici Cn
Universitat Autònoma de Barcelona
08193 Bellaterra, Catalonia, Spain
email: [email protected]
2

Jaume Bertranpetit:
IBE, Institut de Biologia Evolutiva (UPF-CSIC)
CEXS-Universitat Pompeu Fabra-PRBB
Doctor Aiguader 88
08003 Barcelona, Catalonia, Spain
email: [email protected]
3
ABSTRACT
Genes vary in their likelihood to undergo adaptive evolution. The genomic factors that
determine adaptability, however, remain poorly understood. Genes function in the context of
molecular networks, with some occupying more important positions than others and thus
being likely to be under stronger selective pressures. However, how positive selection
distributes across the different parts of molecular networks is still not fully understood. Here,
we inferred positive selection using comparative genomics and population genetics
approaches through the comparison of 10 mammalian and 270 human genomes, respectively.
In agreement with previous results, we found that genes with lower network centralities are
more likely to evolve under positive selection (as inferred from divergence data). Surprisingly,
polymorphism data yields results in the opposite direction than divergence data: genes with
higher centralities are more likely to have been targeted by recent positive selection during
recent human evolution. Our results indicate that the relationship between centrality and the
impact of adaptive evolution highly depends on the mode of positive selection and/or the
evolutionary time-scale.
Keywords
Physical protein interaction, Protein interaction network, Natural selection, Positive selection,
Mammals, Humans
4
INTRODUCTION
In recent years, the availability of large-scale network and genomic datasets has
allowed researchers to study the relationship between the position of proteins within
molecular networks and their patterns of molecular evolution (Alvarez-Ponce 2014; Cork and
Purugganan 2004; Montanucci et al. 2014; Wagner 2012). These studies have shown that the
strength of purifying selection acting on individual genes is affected by the position that their
encoded products occupy in molecular networks. Indeed, genes acting at the centre of
protein–protein interaction networks (PINs) and metabolic networks (i.e., genes coding for
proteins with many interactions or connections) evolve under higher levels of purifying
selection than those acting at the network periphery (Alvarez-Ponce and Fares 2012; Alvarez-
Ponce 2012; Fraser et al. 2002; Hahn and Kern 2005; Vitkup et al. 2006) (but see Hahn et al.
2004; Jordan et al. 2003). Furthermore, interacting proteins evolve at similar rates, probably
as a result of molecular coevolution (Agrafioti et al. 2005; Codoñer and Fares 2008; Cui et al.
2009; Fraser et al. 2002; Lovell and Robertson 2010; Pérez-Bercoff et al. 2013).
Less well understood, however, is how adaptive events distribute across molecular
pathways and networks. Some evidence supports that adaptive events tend to occur in less
centrally located regions of gene networks. In an early study using two genomes, the human
and chimpanzee genomes, Kim et al. found that positive selection often targeted genes acting
at the periphery of the PIN (Kim et al. 2007). Powerful detection of positive selection
requires, nevertheless, comparing many genomes (Anisimova et al. 2002; Kosiol et al. 2008),
making it appropriate to re-evaluate this trend in light of the currently available mammalian
genomes.
In addition, recent population genetics studies of certain metabolic and signaling
pathways appear to contradict the notion that positive selection targets preferentially the
periphery of molecular networks. Indeed, positive selection often targets genes acting at the
most “influential” positions of these pathways, including the most central genes in the human
insulin/mTOR pathway (Luisi et al. 2012), genes acting at bifurcation points of the human N-
glycosylation pathway (Dall’Olio et al. 2012) and the Drosophila pathways involved in
glucose metabolism (Flowers et al. 2007), and the gene encoding the first enzyme of the
Arabidopsis glucosinolate pathway (Olson-Manning et al. 2013). Simulation studies also
indicate that adaptation preferentially targets genes acting at the upstream and branch-point
parts of pathways, at least when the system is far from the fitness optimum (Rausher 2012;
Wright and Rausher 2010). Proteins occupying these key network positions are expected to
exert strong influence over the pathway function, and thus on the associated phenotypes and
5
organism’s fitness (Olson-Manning et al. 2013; Rausher 2012; Wright and Rausher 2010).
Therefore, positive selection on genes encoding such proteins may lead to rapid adaptation.
Here, we make use of the unprecedented wealth of genomic (Kersey et al. 2012; The
1000 Genomes Project Consortium 2012) and interactomic data (Stark et al. 2011) to ascertain
what parts of the human protein–protein interaction network were affected by positive
selection, using both comparative genomics and population genetics approaches. We found
that positive selection, as inferred from divergence data, preferentially targets genes acting at
more peripheral positions in the network, in agreement with previous observations (Kim et al.
2007). Conversely, genes with signatures of recent positive selection, identified considering
polymorphism data, occupy more central parts of the network. We discuss on the apparently
contradictory results from divergence and polymorphism data and propose an evolutionary
scenario reconciling both patterns.
6
MATERIAL AND METHODS
Reconstructing the Human Protein–Protein Interaction Network
The human protein–protein interaction network (PIN) was reconstructed from the
interactions available from the BioGRID database version 3.1.81 (Stark et al. 2011). Only
non-redundant physical interactions were considered to calculate centrality measures. We
removed from our analysis proteins without an Ensembl ID as well as Ubiquitin C (encoded
by the gene with Ensembl ID ENSG00000150991), which has an outlier degree centrality. For
each protein, degree was computed as the total number of interactions in which it is involved,
and betweenness and closeness centralities were computed using the NetworkX Python
library (https://networkx.github.io/).
Inferring Natural Selection from 10 Mammalian Genomes
In order to infer events of positive selection that have occurred during the evolution of
mammals we used sequence data for a set of mammals, enriched in primates. The analysis
was restricted to 10 high-coverage genomes: human, chimpanzee, gorilla, orang-utan,
macaque, mouse, rat, cow, dog, and opossum. The platypus genome was not included in the
analysis, as the currently available assembly is highly fragmented, making gene annotation
difficult. Also excluded were non-mammalian genomes, in order to avoid the problem of
saturation of synonymous sites (Smith and Smith 1996), and to maximize the number of
genes with 1:1 orthologs in all studied genomes.
All protein and coding (CDS) sequences for the selected genomes were obtained from
Ensembl release 62 (Kersey et al. 2012). For each of the 9,041 human protein-coding genes
represented in the PIN, we searched the 9 non-human genomes for 1:1 orthologs using the
best reciprocal BLAST approach. First, we selected the longest protein (or, in the case of
multiple proteins sharing the maximal length, that classified as the canonical isoform), and
used it as query in a BLASTP search against each of the non-human proteomes. Second, for
the best hit in each proteome, we performed a BLASTP search against the human proteome. If
the hit obtained in the second search was the original human protein, then it was considered to
be a 1:1 ortholog. Only human genes with 1:1 orthologs in all 9 non-human genomes were
used in subsequent analyses (in total, 5,916 genes met this criterion).
Each group of orthologous proteins was aligned using ProbCons 1.12 (Do et al. 2005).
7
Because tests of positive selection are sensitive to sequencing, annotation and alignment
errors (Scheinfeldt et al. 2009; Talavera and Castresana 2007), we used highly stringent
criteria to filter our alignments. First, unreliably aligned regions were removed using Gblocks
version 0.91b (Talavera and Castresana 2007), with default parameters. Additionally, we used
an ad-hoc filtering procedure in order to remove annotation errors, including the following
steps: (i) identification of unique amino acid replacement (i.e., amino acids that are unique to
a given species in a certain alignment column); (ii) identification of alignment regions with a
very high incidence of unique substitutions in the same species; in particular, we used a
sliding window approach to identify regions of 15 amino acids containing 10 or more unique
substitutions in the same sequence, as well as regions of 5 amino acids containing 5 unique
substitutions in the same sequence; these patterns are unlikely to represent true divergence
between species, provided that the species included in the current analysis are relatively
closely related; and (iii) removal of these alignment regions. These procedures resulted in the
removal of 35.5% of amino acid positions. The resulting filtered protein alignments were used
to guide the alignment of the corresponding CDSs using an in-house BioPerl script.
We evaluated the impact of both purifying and positive selection on each orthologous
group using the program codeml from the package PAML 4.4 (Yang et al. 2005). For each
CDS alignment, three different evolutionary models (M0, M7 and M8) were fitted. First, for
each gene, an overall non-synonymous to synonymous divergence ratio (ω = dN/dS) estimate
was obtained from the M0 model, which assumes a homogeneous ω for all branches in the
tree and all codons in the alignment. This ratio was used as a proxy of the impact of purifying
selection, with values of ω close to 0 indicating strong purifying selection, and values close to
1 indicating weak purifying selection. Second, in order to infer the action of positive
selection, we applied the M7 vs. M8 test (Nielsen and Yang 1998). The M7 model assumes
that codons' ω values follow a beta distribution, limited to the interval (0, 1), whereas model
M8 allows for an additional class of codons with ω > 1. The likelihood ratio test was used to
contrast whether model M8 fits the data significantly better than model M7. Twice the
difference between the log-likelihoods of both nested models, [2Δℓ = 2 × (ℓM8 – ℓM7), where ℓi
is the log-likelihood of the observed data under model i], is assumed to follow a χ2
distribution with two degrees of freedom. In order to avoid the problem of local optima, for
each gene each model was fitted three times, using different starting ω values (0.04, 0.4 and
8
4), and the computation with the highest likelihood was retained. The commonly accepted tree
topology was used.
In order to discard potential alignment errors, not detected by our stringent filtering,
the alignments corresponding to genes with P < 0.1 in the likelihood ratio test for positive
selection were inspected visually. Alignment regions containing evident errors were manually
removed using BioEdit v7.0.5.2 (Hall 1999), and analyses of positive selection were re-run.
We obtained a list of 554 genes with putative signatures of positive selection (divPSGs; P <
0.05).
We also repeated the analysis of positive selection by considering two alternative
alignment sets: (i) a set of human genes with 1:1 orthologs in 3 to 9 non-human genomes
(8,697 genes met this criterion) to which we applied the filtering process described above and
(ii) the set of 5,916 human genes with 1:1 orthologs in all 9 non-human genomes without
applying any alignment filtering.
Inferring Natural Selection from 270 Human Genomes
We obtained phased genotypes from low-coverage data of the phase I of the 1000
Genomes Project (The 1000 Genomes Project Consortium 2012), which makes available data
for over 36 millions Single Nucleotide Variants (SNVs) for 1,092 individuals sampled from
14 populations worldwide. We used a subset of 270 individuals from YRI, CEU and CHB
populations. We focused on those three populations because they are representative of the
human genetic diversity in three main geographic regions (Africa, West Eurasia and East
Asia) and signals of positive selection have been described to be extensively shared in related
populations (Coop et al. 2009). Samples from American populations present a high level of
admixture (The 1000 Genomes Project Consortium 2012), making difficult an accurate study
of natural selection in these populations.
For each of the 9,041 genes contained in the PIN, we analysed the genomic region
corresponding to the transcript spanning the longest chromosome region. Gene coordinates
were obtained from the release 37 of the human genome at NCBI (Flicek et al. 2010). We
removed 365 genes located at sex chromosomes because some of the methods used to detect
signals of positive selection have been devised for autosomal regions, or provide results that
cannot be compared between genes located at autosomal and sex chromosomes. In order to
9
increase the statistical power in the detection of positive selection, we removed from the
analyses 96 genes with less than 10 SNVs annotated in the 1000 Genomes Project.
We used the genetic map provided by the 1000 Genomes Consortium. Ancestral states
inferred from comparison with orthologous sequences in the chimpanzee and rhesus macaque
genomes were obtained from the UCSC Genome Bioinformatics Site (Karolchik et al. 2009)
(http://genome.ucsc.edu/; table ‘‘snp128OrthoPanTro2RheMac2’’).
Retained genes (a total of 8,580), have a length ranging from 0.414 to 2,305 Kb (mean
= 61.70 Kb; median = 25.95 Kb) and are covered by a total of 6,815,879 SNVs. The number
of SNVs located in a gene ranges from 10 (28 genes) to 45,577, with a mean of 794.4 and a
median of 312.
To identify the genes belonging to the PIN that have evolved under positive selection
during human evolution, we applied three different tests: (i) the integrated Haplotype Score
(Voight et al. 2006) (iHS), which aims to detect extended haplotype homozygosity from the
local haplotype structure, (ii) the Cross-Population Composite Likelihood Ratio method
(Chen et al. 2010) (XP-CLR), based on the multi-locus allele frequency differentiation
between two populations, and (iii) DH (Zeng et al. 2007), based on the excess of rare variants,
which combines Tajima’s D (Tajima 1989) and Fay and Wu's H (Fay and Wu 2000). These
tests are designed assuming the hard sweep model which states that a new advantageous
mutation arises in the population and rapidly increases in frequency hitchhiking the
surrounding neutral variants located on the same haplotype.
We computed a raw iHS for each SNV with ancestral state information following the
method proposed by Voight et al. (2006). We used the script available at
http://hgdp.uchicago.edu/Software/, which we slightly modified in order to speed up
computation times; thresholds for Extended Haplotype Homozygosity (EHH) decay were
modified from 0.25 to 0.15 and we used a size for the analysed region of 0.2 Mb (original
size: 2.5 Mb). we validated that These changes were previously described not to affect the
sensitivity and specificity of the method through coalescent simulations (Pybus et al., 2014).
Standardized iHS scores were obtained by grouping SNVs into 20 bins separated by a derived
allele frequency of 0.05, subtracting the mean, and dividing by the standard deviation for all
SNVs in the same bin as in Voight et al. (2006). Extreme positive or negative values indicate
high extended haplotype homozygosity of haplotypes carrying the ancestral or derived allele,
10
respectively. Hence, we consider both extreme positive or negative iHS as potential signatures
of positive selection. We integrated the |iHS| scores observed at each gene of interest into a
gene-level summary statistic using the mean.
The XP-CLR method aims at detecting important genetic differentiation in an
extended genomic region in comparison with a reference population. This method provides a
good localization of the position of the selected variant (Chen et al. 2010). XP-CLR scores
were computed at regularly spaced grid points (every 2 Kb) using the information from SNVs
within a flanking window of 0.2 cM. To account for different SNV densities among genomic
regions, we restricted to 200 the maximal number of SNVs used to calculate XP-CLR scores
within each window, by randomly removing SNVs in excess. We integrated the XP-CLR
scores observed at each gene of interest into a gene-level summary statistic using the mean.
Extreme iHS and XP-CLR scores could also be attributable to the action of non-
selective events such as demographic changes and genetic drift. However, these selectively
neutral events act randomly on the genome, in contrast with positive selection, which targets
specific genes. Therefore, we adopted an outlier approach to infer the action of positive
selection on PIN genes (Kelley et al. 2006; Teshima et al. 2006): we evaluated the
significance of the scores for each gene by taking into account the whole genome context. For
that purpose, we used a genomic gene-level background containing all annotated genes that
were distant one from each other and from the 8,580 genes included in the analysis, by at least
5 Kb and contained at least 10 SNVs. The complete background gene set obtained thus
includes 13,388 genomic regions and 8,431,716 SNVs. For each of these background
genomic regions, we computed the mean summary statistics based on iHS and XP-CLR and
then obtained gene-level empirical distributions. Empirical P-values associated to iHS and
XP-CLR for PIN genes were obtained using the gene-level score distributions obtained from
the 13,388 genes in the background genome set.
For each gene, using the SNVs with ancestral state information, we also computed
Tajima's D, Fay and Wu's H and DH, using a program kindly provided by Kai Zeng. For each
gene, the DH P-value was obtained as in Zeng et al. (2007) from Tajima's D and Fay and Wu's
H by a bivariate comparison to their neutral distributions. However, instead of using 10,000
replicates of coalescent simulations to build these neutral distributions as in the original
article, we used the 13,388 genomic regions described above in order to better take into
11
account the demographic forces that acted on the studied populations.
In order to summarize the results of the three different tests, we combined the gene-
level empirical P-values obtained as described above using the Fisher combination test:
,
where Pi are the empirical P-values obtained from the three tests. Thus, for each gene we
obtained a unique ZF score, which follows a χ2 distribution with 6 degrees of freedom. This
combination requires independence of the three combined P-values. We confirmed that
deviation from this assumption would not affect our results (Supplementary Figure 1). We
invoked positive selection if the P-value associated to the ZF score was below 5%. Therefore,
we obtained 4 lists of genes with putative signatures of positive selection inferred from
polymorphism data (polyPSGs): 3 populations + global level.
The major limitation of the methods implemented to detect positive selection using
polymorphism data is that demographic events, such as population growth, bottleneck, and/or
subdivision, can mimic patterns similar to those produced by selection. However, the outlier
approach framework that we implemented and that combines three tests that consider three
different molecular patterns (namely genetic differentiation, site frequency spectrum and
linkage disequilibrium) is very likely to overcome this issue.
In order to estimate the strength of purifying selection acting on the genes involved in
the PIN we calculated the average Derived Allele Frequency (DAF) among the 270
individuals belonging to YRI, CEU and CHB populations (The 1000 Genomes Project
Consortium 2012).
Inferring Natural Selection using the McDonald and Kreitman Test
For each gene, we computed the polarized McDonald-Kreitman test (MK test;
McDonald and Kreitman 1991) in order to infer the impact of natural selection in the human
lineage, i.e. since the split with chimpanzee. For that purpose, we defined non-synonymous
and synonymous sites as the 0-fold and 4-fold degenerated sites using the longest transcript
for each of the 9,041 genes in the PIN. We then calculated the number of polymorphic non-
synonymous and synonymous sites (PN and PS, respectively) in any of the three studied
human populations (YRI, CEU and CHB). We also estimated the number of non-synonymous
12
and synonymous substitutions (DN and DS, respectively) that occurred in the human lineage by
comparing the human and chimpanzee reference genomes using as outgroup the gorilla
species: a substitution was assumed to have occurred in the human lineage when a site was
different in the human sequence as compared to both chimpanzee and gorilla. We then
estimated the Neutrality Index (NI) as
We applied the Haldane's correction for the NI whenever one of the four numbers (PN, PS, DN
or DS) was equal to 0 as follows:
We also tested for positive selection using a Fisher exact test performed on the contingency
table containing the number of fixed substitutions and polymorphic sites for both non-
synonymous and synonymous positions.
We finally obtained a NI score and a P-value from the Fisher's exact test for 3,381 genes
(those with more than three non-synonymous and synonymous polymorphic sites and more
than three non-synonymous and synonymous substitutions).
Analysing DAF patterns for three site classes nearby genes under positive selection.
In order to gain some insight into the functional nature of the variants targeted by
recent positive selection in humans, we analysed how extreme was the DAF observed at three
site classes nearby polyPSGs: cis-eQTLs, non-synonymous and synonymous variants. We
retrieved eQTLs annotations from two datasets which report eQTLs detected in different
lymphoblastoid cell line samples: (i) “GEUVADIS” for 373 European samples from the 1000
Genomes Consortium (Lappalainen et al. 2013); and (ii) “Liang et al.” for two British sample
sets: MRCE (Morar et al. 2007) and MRCA (Dixon et al. 2007) analysed together (Liang et al.
2013). We restricted our analyses to cis-eQTLs located within 100 Kb of the associated gene.
We then identified the 0 and 4-fold degenerated sites for all transcripts of the PIN genes using
Ensembl release 65. We removed all sites whose classification as 0-fold or 4-fold degenerated
13
depended on the transcript considered. The remaining 0-fold and 4-fold degenerated sites
were considered as non-synonymous and synonymous sites, respectively.
For each gene and site class, we calculated the maximum DAF observed in the CEU
population. Genes for which the DAF score was missing for at least one of the three site
classes were removed from the analysis. We obtained a maximum DAF score for the three site
classes for 358 and 198 PIN genes when using the “GEUVADIS” and “Liang et al.” eQTL
annotations. Among them, 29 and 14 genes exhibit a signal of recent positive selection as
inferred from polymorphism data (polyPSGs), respectively.
For each site class, we contrasted whether polyPSGs show a higher median of the
maximum DAF scores through 10,000 random permutations from the PIN genes.
We obtained a maximum DAF score for all three site classes for only 2 and 6
polyPSGs when using eQTLs detected in YRI samples in the studies performed by
Lappaneleinen et al. (2011) and Pickrell et al. (2010), respectively, limiting the power of this
analysis in the YRI population.
Determining Fitness Effects of Genes
Using data from the Mouse Genome Database (Bult et al. 2008)
(“MRK_Ensembl_Pheno.rpt” file downloaded on 7 October 2010), we classified genes as
essential and non-essential when described to be lethal and viable when knocked out in mice,
respectively. We retrieved such information for 3,994 genes represented in the PIN. However,
given that essentiality may evolve relatively fast (Zhang & He, 2005), essential genes in
mouse may not be essential in humans.
Therefore, we also used the functional indispensability score (Khurana et al. 2013)
estimated from functional and evolutionary properties. This score accurately distinguishes
between essential genes (those showing clinical features of death before puberty or infertility
when Loss-of-Function –LoF– mutations occur; Liao and Zhang 2008) and LoF-tolerant
genes (those observed to contain homozygous LoF mutations in at least one individual in the
1000 Genomes Pilot Data; MacArthur et al. 2012). We obtained the functional
indispensability score for 8,816 genes involved in the PIN.
14
RESULTS
Positive selection inferred from divergence data and gene centrality in the human
protein–protein interaction network
We used 10 mammalian genomes (Kersey et al. 2012) to infer events of positive
selection that took place within the last ~165 million years. Only genes with 1:1 orthologs in
all 10 species were used, and sequence alignments were stringently filtered prior to our
analyses (see Material and Methods). The test used in this study looks for a non-synonymous
to synonymous divergence ratio (ω = dN/dS) higher than 1 at a subset of codons (Nielsen and
Yang 1998). It is based on a positive selection likelihood score, termed 2Δℓ (see Material and
Methods), that is proportional to the likelihood of positive selection. We identified a total of
554 putative positively selected genes (divPSGs; those with P < 0.05).
We measured the difference in the mean degree (number of protein–protein
interactions, or number of proteins with which a protein interacts) between divPSGs and the
other genes in the network (non-divPSGs), and tested whether this difference was expected at
random through 10,000 random permutations of the two groups containing divPSGs and non-
divPSGs. We observed that divPSGs encode proteins with a significantly lower degree than
non-divPSGs (permutation test: P = 0.0067; Figure 1A; Supplementary Table 1). Indeed,
divPSGs and non-divPSGs encode proteins with, on average, 7.587 and 9.122 interactions,
respectively, i.e. the degree for divPSGs is 17% lower than the one observed for non-
divPSGs. The magnitude of this difference is similar to that previously described (Kim et al.
2007).
We next observed that log-likelihood increments (2Δℓ scores) from the positive
selection test exhibit a significant negative correlation with proteins’ degrees (Spearman's
rank correlation coefficient, ρ = −0.0841; P < 0.0001; Table 1), indicating that central genes
are less likely to be under positive selection. Finally, when proteins were binned into four
degree classes (low, medium-low, medium-high and high degree) according to the first,
second and third quartiles, we observed a continuous decrease in their positive selection
likelihood scores (2Δℓ) (Figure 2D; Table 1). Indeed, the non-parametric Analysis Of Variance
(ANOVA) F-test is significant (P < 0.0001), and there is a trend towards higher 2Δℓ scores in
the lower degree groups (linear trend test on ranks; P < 0.0001). We validated those results
using two alternative alignment sets: one using unfiltered alignments for genes present in all
10 species, and another using filtered genes with 1:1 orthologs in 4-10 species
(Supplementary Note; Supplementary Figure 2; Supplementary Table 2).
15
Taken together, our observations indicate that adaptation (as inferred from divergence
data) more frequently occurs at the less connected proteins of the human interactome,
consistent with previous observations (Kim et al. 2007).
Positive selection inferred from polymorphism data and gene centrality in the human
protein–protein interaction network
We inferred recent events of positive selection in humans using genomic data from
three different populations of West African, Northern European and East Asian ancestry (YRI,
CEU and CHB, respectively). We used a Fisher's combination (ZF score) of three tests of
positive selection assuming the hard sweep model: XP-CLR (Chen et al. 2010), iHS (Voight
et al. 2006) and DH (Zeng et al. 2007) (see Material and Methods). Assuming that ZF follows
a χ2 distribution with 6 degrees of freedom, we identified putative positively selected genes
(polyPSGs).
We measured the difference in the mean degree between these genes and genes
without evidences of having evolved under positive selection (non-polyPSGs) (Figure 1A;
Supplementary Table 1). When all populations were analysed together (global analysis), we
observed a statistically significant higher degree for genes with signatures of positive
selection (permutation test: P = 0.0254). Indeed, polyPSGs and non-polyPSGs encode
proteins with, on average, 9.637 and 8.107 interactions, respectively, i.e. the degree for
polyPSGs is 19% higher than that observed for non-polyPSGs. The magnitude of this
difference is similar to that observed at the inter-specific level, yet in the opposite direction.
When the three populations were considered separately, polyPSGs were always more
connected than non-polyPSGs, although the test was significant only for YRI (Supplementary
Table 1).
ZF scores and network degrees exhibit a significant positive correlation for all three
populations (Table 1). Finally, comparison of ZF scores for the four degree groups based on
degree quartiles (low, medium-low, medium-high and high degree) using a non-parametric
ANOVA showed significant differences in all three populations, as a result of higher ZF scores
at the highest degree groups, according to a linear trend test on ranks (Figure 2A–C; Table 1).
These results were reproduced using the three positive selection statistics separately (DH, iHS
and XP-CLR in all populations, except XP-CLR in CEU and CHB), and also using the
Composite of Multiple Signals method (CMS) (Grossman et al. 2013, 2010) (Supplementary
Note; Supplementary Figure 3; Supplementary Table 3). Furthermore, the observed trends
remain significant when removing the putative effect of linkage disequilibrium among genes
16
by using a subset of unlinked genes (see Supplementary Note; Supplementary Figure 4;
Supplementary Table 4).
These analyses indicate that genes encoding proteins with a greater number of
interactions in the human PIN are more likely to present signals of recent selective sweeps
than those acting at more peripheral positions.
Positive selection inferred from polymorphism and divergence data in the human
protein–protein interaction network
We inferred positive selection in the human lineage applying the polarized McDonald-
Kreitman (MK) test (McDonald and Kreitman 1991) on genomic data from three different
populations (YRI, CEU and CHB) along with three reference genomes (human, chimpanzee
and gorilla). Since the genetic diversity in the human lineage and the human-chimp
divergence are reduced, the MK test is not sensitive enough to detect selective events that
occurred during the evolution of the human lineage (Zhai et al. 2009). Indeed, we obtained
significant P-values (at a significance level of 5%) for only four genes in the PIN, making
difficult an accurate network-level analysis for positive selection at this evolutionary time-
scale. A more powerful alternative to the Fisher's exact test on the proportion of synonymous
and non-synonymous variants that are fixed between species or segregating in the lineage of
interest, is to contrast whether the parameter γ of for the Poisson random field model is
negative using a maximum likelihood framework (Sawyer & Hartl, 1992). We therefore
downloaded the results from a previous implementation of the MK test between human and
chimpanzee following this framework (Bustamante et al. 2005). In this study, however, the
authors did not polarize the test (using an outgroup species), which would have allowed
detecting putative selective events in specific lineages. We obtained a P-value for 3,077 genes
in the PIN, of which 210 genes exhibited a signal of selection (P <0.05). Genes under positive
selection exhibit a higher degree centrality (average: 8.162 interactions) than the other genes
(average degree: 7.481). However, the difference is not significant according to 10,000
permutations (P = 0.232).
Since the data set obtained from Bustamante et al. (2005) does not allow to study
positive selection specifically in the human lineage, we decided not to use it for further
analyses described below. We rather used the Neutral Index from our own implementation of
the polarized-MK test as an estimate of the strength of purifying selection during human
evolution.
17
Correcting for several putative confounding factors and validations
A number of factors correlate with both network centrality and the likelihood of
observing positive selection, and might thus be confounding our observations. In order to
discard this possibility, we conducted a number of validations.
In agreement with previous results (Alvarez-Ponce and Fares 2012; Alvarez-Ponce
2012; Fraser et al. 2002; Hahn and Kern 2005; Vitkup et al. 2006), we observed that purifying
selection is stronger in genes acting at the centre of the human PIN than at those acting at the
periphery, regardless of whether it was measured from the ω ratio, the Neutrality Index (NI)
or the Derived Allele Frequency (DAF) (Figure 2E–G, Table 1). Purifying selection, through
background selection (BGS), can produce signatures that can be confounded with positive
selection by tests based on DNA polymorphism (Charlesworth et al. 1993), thus raising the
possibility that our results could be a by-product of the distribution of purifying selection
across the network. This effect, however, is unlikely to have affected our network-level
analyses, given that we combined the results of different positive selection tests and Enard et
al. (2014) demonstrated that iHS was insensitive to background selection. Indeed,
multivariate analyses confirmed that the relationship between network degree and positive
selection was independent of purifying selection (Supplementary Note; Supplementary
Figures 10 and 11; Supplementary Tables 7 and 8).
Factors such as gene expression level and breadth (tissue specificity), and the length of
the encoded proteins, correlate with both network centralities and the likelihood of detecting
positive selection (Alvarez-Ponce and Fares 2012; Alvarez-Ponce 2012; Anisimova et al.
2002; Kim et al. 2007; Kosiol et al. 2008; Lemos et al. 2005) and thus could also represent
confounding factors. However, the relationship between network degree and all metrics of
positive selection (2Δℓ and ZF) and purifying selection (ω and DAF) considered in this study
remains unaltered when controlling for these parameters (Table 1; Supplementary Note;
Supplementary Figure 5).
Our results might also be biased by the incompleteness or low quality of available
interactomic data. However, similar results were obtained when a high-quality sub-network of
BioGRID (Stark et al. 2011) or the Human Protein Reference Database (Keshava Prasad et al.
2009) were analysed (see Supplementary Note; Supplementary Figures 6–7; Supplementary
Table 5), indicating that our observations are not a by-product of the quality of network data.
In addition to degree, which is a local measure of network centrality, we used two
additional centrality measures that take into account the global position of proteins within the
network: betweenness (the number of shortest paths between other proteins passing through a
18
protein), and closeness (the inverse of the average distance to all other proteins in the
network). Similar trends to those observed when using degree were observed in both cases
(see Supplementary Note; Supplementary Figures 8 and 9; Supplementary Table 6).
Assessing the putative target of positive selection during recent human evolution
In order to contrast whether positive selection had a stronger impact on the regulatory
or on the protein-coding regions of PIN genes during recent human evolution, we compared
the Derived Allele Frequencies (DAF) observed for three site classes nearby polyPSGs: cis-
eQTLs, non-synonymous (0-fold degenerated sites) and synonymous (4-fold degenerated
sites) variants (see Material and Methods). Following the hard sweep model, we assumed that
the variant targeted by positive selection and driving the signal detected using polymorphism
data must exhibit an important DAF. We assessed for each site class whether the maximum
DAF was higher for polyPSGs than expected in an average PIN gene through 10,000 random
samplings (Figure 3). Unsurprisingly, we observed that synonymous sites in polyPSGs do not
exhibit extreme DAF. On the contrary, cis-eQTLs associated to polyPSGs present higher DAF
than expected in the two studied datasets (P < 0.01; Figure 3). Thus, signals of recent positive
selection observed nearby polyPSGs are likely to be driven by variants located in their cis-
regulatory regions. However, positive selection acting on functional variants located in the
protein-coding region may also have driven some of the detected signals, as suggested by the
high DAF observed at non-synonymous sites located in polyPSGs (Figure 3).
Gene essentiality and impact of positive selection
To explore whether genes putatively under recent positive selection in our data set (i.e.
affected by a hard sweep during recent human evolution) have important fitness effects, we
classified the genes under study as viable or lethal using information from The Mouse
Genome Database (Bult et al. 2008). Lethal genes present a significantly higher degree than
viable genes (Mann-Whitney test; P < 0.0001; Table 2), in agreement with previous results
(Fraser et al. 2002; Iyer et al. 2013; Jeong and Albert 2000). This demonstrates that, as
expected, the phenotypic effect of a gene is highly associated with its position within the PIN
(for a review, see Olson-Manning et al. 2012). We next compared the scores of positive
selection on the PIN genes between the two groups (Table 2; Figure 3). As expected, lethal
genes have significantly lower DAF and ω scores and higher NI scores (Mann-Whitney test,
P < 0.0001; Table 2; Figure 3), indicating that they evolve under higher selective constraints.
19

Moreover, they are more likely to be targeted by recent positive selection, since they exhibit
significantly higher positive selection scores in the three human populations (Mann-Whitney
test; P = 0.0047 in YRI, P = 0.0009 in CEU and P = 0.0235 in CHB; Table 2; Figure 3). This
indicates that recent positive selection targets genes with the highest effects on fitness.
However, during mammal evolution, positive selection is more likely to act on viable genes:
2Δℓ scores are significantly higher for viable than for lethal genes (Mann-Whitney test; P <
0.0001; Table 2; Figure 3). Similar results were obtained when using the “functional
indispensability” score attributed to a specific gene according to its functional and
evolutionary properties (Khurana et al. 2013) (Table 2; Figure 3).
20
DISCUSSION
The results presented here indicate that signatures of positive selection identified
following two different methodological frameworks concentrate on different parts of the
human PIN: when interrogating mammal divergence data, we observe that positive selection
had a greater impact on genes with a lower network centrality, whereas recent, human-specific
positive selection (as inferred from polymorphism data) has targeted preferentially genes
occupying more central positions in the network. These patterns are independent of several
potentially confounding factors.
The signatures of adaptation detected in this study through either a comparative
genomics or population genetics approach might correspond to different kinds of changes at
the sequence level, a problem with no obvious solution. The maximum-likelihood test used to
detect positive selection using divergence data is powerful only in situations in which the
gene has experienced recurrent selection events at the coding sequence; adaptation at
regulatory sites, however, cannot be detected using this method. Therefore, positive selection
during mammal evolution, as inferred here, should be viewed as sequence adaptations that
alter the function of proteins recurrently across the mammalian phylogeny. Indeed, the M7 vs.
M8 test (Nielsen and Yang 1998) will detect an excess, in number, of non-synonymous
substitutions among species; the signal is therefore driven by recurring directional selection.
As suggested before (Kim et al. 2007), the interactome periphery may functionally correspond
to the cellular periphery. Indeed, our Gene Ontology enrichment analysis demonstrated that
the extracellular region is enriched in proteins encoded by genes showing signals of positive
selection in mammals (P = 0.0164 after FDR multiple testing correction; Supplementary
Table 9). Gene products acting at the cell periphery are likely to be more exposed to
pathogens than genes within the cell, making more likely Red Queen dynamics (Liow, Van
Valen and Stenseth, 2011) to affect the evolution of peripheral genes.
On the other hand, signatures of selection detected in a genomic region using re-
sequencing data can correspond to unique selective sweeps (not necessarily recurrent) that
occurred recently, either at the studied region or at a linked one (e.g., promoters and other
regulatory regions). Thus, the putative signals of recent positive selection can be the result of
variants that alter protein sequence, but are perhaps more likely to correspond to cis-
regulatory variants, whose role in recent human evolution seems to have been pivotal (Enard
et al. 2014). Moreover, when studying genetic diversity in coding sequences, Hernandez et al.
(2010) showed that hard selective sweeps were rare in the human lineage. Since protein-
coding genes are particularly constrained at the core of the interactome, their regulatory
21
regions may provide the necessary pool of variation for adaptation. In agreement with this
hypothesis, we showed that recent positive selection seems to have particularly targeted cis-
regulatory regions (Figure 3). However, hard sweeps are not the only way for short-term
adaptation and soft sweeps, partial sweep and polygenic adaptation are expected to also play a
crucial role (for a review see Pritchard, Pickrell, & Coop, 2010). Such selective events occur
through a subtle shift in allele frequency and, thus, are difficult to detect. Standing variants
are good candidates for local adaptation that are likely to affect phenotypes in a polygenic
manner, having relatively low size effect. We found no significant association between
network topology and signals of local adaptation discovered by looking at the correlations
between population-specific allele frequencies and environmental variables across the globe
(BayENV; Hancock et al., 2011; Supplementary Notes). Therefore, it seems that local
adaptation events through subtle shifts in allele frequency are uniformly distributed across the
PIN. Fraser (2013), using BayENV, demonstrated that positive selection events driving subtle
shifts in allele frequency were also more likely to occur in cis-regulatory regions than in
protein-coding genes. . Altogether, recent positive selection events detected using
polymorphism data are more likely to correspond to adaptation through changes in expression
patterns (gene expression level or regulation), while selective events detected through
divergence analysis may mostly correspond to changes in protein function.
Another line of explanation for the higher impact of recent positive selection in highly
connected genes could be that the relaxation of purifying selection in human populations –
due to their reduced effective population size (Hughes and Friedman 2010; Subramanian
2013) – may have allowed the spread of some deleterious mutations in genes encoding highly
connected proteins. In order to maintain the viability of the organism, compensatory
mutations in these genes or in any gene encoding directly interacting partners would have
been adaptive (Charlesworth and Eyre-Walker 2007). However, although purifying selection
is likely to have been relaxed in recent human evolution, we demonstrated that it remains
stronger in highly connected genes (Figure 2E–F).
The higher centrality of essential genes suggests that the centre of the network may
roughly correspond to the most important, influential and pleiotropic genes of the system.
Certain evolutionary mechanisms may promote a higher adaptability at the centre of the
network, where the effects of genes on fitness are important, whereas others may promote a
higher incidence of positive selection at the periphery. On the one hand, in the 1930s, Ronald
Fisher formulated the hypothesis that mutations with large effects on phenotype, such as those
with highly pleiotropic effects, should often be deleterious (Fisher 1930; Orr 2005). In
agreement with this hypothesis, purifying selection is stronger on genes acting at the centre of
22
molecular networks (Fraser et al. 2002; Hahn and Kern 2005; Vitkup et al. 2006; Alvarez-
Ponce and Fares 2012; Alvarez-Ponce 2012) (but see Hahn and Kern 2005; Jordan et al.
2003), a pattern that we have confirmed analysing both divergence and polymorphism data.
Since purifying selection quickly removes a high fraction of new mutations at these genes,
one would expect positive selection to rarely act on them because of their reduced variability
(Olson-Manning et al. 2012). Therefore, we may expect positive selection to target more
frequently the periphery of the network. On the other hand, the action of positive selection at
genes occupying the centre of the network is not to be discarded. Indeed, signatures of
positive selection are frequent at genes occupying relatively important positions in a number
of metabolic and signal transduction pathways (Dall’Olio et al. 2012; Luisi et al. 2012;
Flowers et al. 2007; Olson-Manning et al. 2013).
Simulation analyses of hypothetical metabolic pathways have shown that, when
pathways are far from the fitness optimum, positive selection first targets enzymes lying at the
upstream part, and at the branch points of the pathway, which exert greater control over
metabolic flux. In turn, when the system approaches its optimum, positive selection tends to
concentrate on enzymes with less flux control, and purifying selection constrains the
evolution of upstream and branch-point enzymes (Rausher 2012; Wright and Rausher 2010).
These observations match the expected pattern of diminishing returns, first proposed by
Ronald Fisher in his Geometric Model of Adaptation (Fisher 1930) (FGM), which states that
selection tends to act progressively more often on mutations with smaller phenotypic effects
as populations approach a peak in the adaptive landscape. A mutation's effect is measured as a
function of both its effect on a given trait and the numbers of phenotypes that are jointly
modified by the mutation (pleiotropic effect) (Fisher 1930; Orr 2005), and theoretical models
are currently being developed in order to relate the FGM to information on protein–protein
interaction networks (e.g. see Martin 2014). According to the FGM, events of selection are
more likely to be observed on mutations with small phenotypic effects (following a geometric
distribution), whereas positive selection on mutations with large effects is most likely to occur
during the first steps of adaptation.
The results described in the present study can be understood according to both the
FGM and the different kinds of advantageous changes detected at the sequence level. Indeed,
when focusing at large evolutionary time-scale, i.e. during mammal evolution, we are
studying the whole process of adaptation acting exclusively on protein-coding genes that
made the species fit. Therefore, according to the geometric distribution of the probability of a
mutation to be favourable, it is more likely to detect events of adaptation acting on genes with
lower effect on fitness, that is genes encoding proteins with less interacting partners. On the
23
other hand, when focussing at much shorter evolutionary time-scale, i.e. during recent human
evolution, we are studying the recent adaptation of human populations to a wide range of new
environments (e.g. the Mesolithic-Neolithic transition, the human diaspora across the world,
etc.). We speculate here that events of strong recent positive selection, as inferred from
polymorphism data assuming the hard sweep model, mainly targeted cis-regulatory regions of
genes with important effects on fitness in order to efficiently tune some specific phenotypes..
In summary, even though the interactome is a raw simplification of the processes that
take place within the cell, it contains valuable information on the relative role of the many
gene products that interact to sustain life. The position occupied by a protein within an
interaction network provides useful information –albeit incomplete– on the phenotypic effects
of mutations arising at the encoding gene. Interestingly, we have shown that using this
information can also help to better understand the impact of positive selection acting on
protein-coding genes and their cis-regulatory region. Although network centrality used alone
remains a modest predictor of the impact of positive selection, it could be included in an
integrative biology approach to shed light on adaptive processes acting on the genome. The
present study also underscores the fact that the relationship between positive selection and
network position is more complex than previously recognised, when positive selection was
suggested to mostly act at the network periphery. Indeed, the discovery of the rules governing
network evolution may shed light on the dynamics of the evolutionary processes driven by
selection. Notably, the distribution of selective events in a large-scale protein–protein
interaction network described in the present study, which relies on extensive sequence data,
can be understood in the light of the Fisher's Geometric Model of Adaptation. Particularly,
results presented here show that the raw material for innovation is also to be found in genes,
or in their cis-regulatory region, encoding proteins with high network centrality, meaning that
they have more pleiotropic effects., are more indispensable and in general are at the basis of
strong changes as a result of mutations.
24

SUPPLEMENTARY FILES
Four Supplementary Data files are available at http://biologiaevolutiva.org/jbertranpetit/wp-
content/uploads/2015/02/Luisi-et-al-SupplementaryInformation.rar.
The centrality measures computed in the three networks analysed in this study are available in
Supplementary Data file 1.
The statistics used to detect positive and purifying selection in humans using polymorphism
data are provided in Supplementary Data file 2.
The statistics used to detect positive and purifying selection in Mammals using divergence
data are provided in Supplementary Data file 3.
The results from the McDonald-Kreitman tests are listed in Supplementary Data file 4.
The supplementary data files contain results for the analysed genes retrieved from both
BioGRID and HPRD data sets, as well as from the genomic background when it applies.
Supplementary Notes contain a description of complementary analyses.
25
ACKNOWLEDGEMENTS
We thankfully acknowledge valuable discussion and corrections from Diego A.
Hartasanchez, David A. Hughes and Arcadi Navarro. We thank Gabriel Santpere for his help
to compute the McDonald-Krietman test. We thank the National Institute of Bioinformatics
(http://www.inab.org) and Javier Forment, from the Bioinformatics service at the "Instituto de
Biología Molecular y Celular de Plantas", for computational support. This work was funded
by the “Ministerio de Ciencia y Tecnología” (Spain) [grant BFU2010-19443; subprogram
BMC], and the “Direcció General de Recerca, Generalitat de Catalunya (Grup de Recerca
Consolidat 2009 SGR 1101)” awarded to JB. PL is supported by a Ph.D. fellowship from
“Acción Estratégica de Salud, en el marco del Plan Nacional de Investigación Científica,
Desarrollo e Innovación Tecnológica 2008–2011” from Instituto de Salud Carlos III. DA-P
was a “Juan de la Cierva” fellow from the “Ministerio de Economía y Competitividad”
(Spain) [JCI-2011-11089]. MAF is supported by a Principal Investigator grant from Science
Foundation Ireland (12/IP/1673) and a project from the “Ministerio de Economía y
Competitividad” [grant number BFU2012-36346].
26
REFERENCES
Agrafioti I et al. 2005. Comparative analysis of the Saccharomyces cerevisiae and
Caenorhabditis elegans protein interaction networks. BMC Evol. Biol. 5:23.
Alvarez-Ponce D. 2012. The relationship between the hierarchical position of proteins in the
human signal transduction network and their rate of evolution. BMC Evol. Biol. 12:192.
Alvarez-Ponce D, Fares MA. 2012. Evolutionary rate and duplicability in the Arabidopsis
thaliana protein–protein interaction network. Genome Biol. Evol. 4:1263–74.
Alvarez-Ponce D (2014) Why proteins evolve at different rates: The determinants of proteins’
rates of evolution. In: Fares MA, editor. Natural Selection: Methods and Applications.
London: CRC Press (Taylor & Francis). pp. 126-178.
Anisimova M, Bielawski JP, Yang Z. 2002. Accuracy and power of the likelihood ratio test in
detecting adaptive molecular evolution. Mol. Biol. Evol. 18:1585–1592.
Bult CJ, Eppig JT, Kadin J a, Richardson JE, Blake J a. 2008. The Mouse Genome Database
(MGD): mouse biology and model systems. Nucleic Acids Res. 36:D724–8.
Charlesworth B, Morgan MT, Charlesworth D. 1993. The effect of deleterious mutations on
neutral molecular variation. Genetics. 134:1289–303.
Charlesworth J, Eyre-walker A. 2007. The other side of the nearly neutral theory, evidence of
slightly advantageous back-mutations. Proc Natl Acad Sci U S A. 104:16992–7.
Chen H, Patterson N, Reich D. 2010. Population differentiation as a test for selective sweeps.
Genome Res. 20:393–402.
Codoñer FM, Fares MA. 2008. Why Should We Care About Molecular Coevolution ?
Bioinformatics. 4:29–38.
Coop G et al. 2009. The role of geography in human adaptation. PLoS Genet. 5:e1000500.
Cork JM, Purugganan MD. 2004. The evolution of molecular genetic pathways and networks.
Bioessays. 26:479–84.
Cui Q, Purisima E, Wang E. 2009. Protein evolution on a human signaling network. BMC
Syst. Biol. 3:21.
Dall’Olio GM et al. 2012. Distribution of events of positive selection and population
differentiation in a metabolic pathway: the case of asparagine N-glycosylation. BMC Evol.
Biol. 12:98.
27
Dixon AL et al. 2007. A genome-wide association study of global gene expression. Nat.
Genet. 39:1202–7.
Do CB, Mahabhashyam MSP, Brudno M, Batzoglou S. 2005. ProbCons: Probabilistic
consistency-based multiple sequence alignment. Genome Res. 15:330–40.
Enard D, Messer PW, Petrov D a. 2014. Genome-wide signals of positive selection in human
evolution. Genome Res. 24:885–895.
Fay JC, Wu CI. 2000. Hitchhiking under positive Darwinian selection. Genetics. 155:1405–
13.
Fisher RA. 1930. The Genetical Theory of Natural Selection. Oxford Univ Press: Oxford.
Flicek P et al. 2010. Ensembl’s 10th year. Nucleic Acids Res. 38:D557–62.
Flowers JM et al. 2007. Adaptive evolution of metabolic pathways in Drosophila. Mol. Biol.
Evol. 24:1347–54.
Fraser HB. 2013. Gene expression drives local adaptation in humans. Genome Res. 23:1089–
96.
Fraser HB, Hirsh AE, Steinmetz LM, Scharfe C, Feldman MW. 2002. Evolutionary Rate in
the Protein Interaction Network. Science. 296:750–752.
Grossman SR et al. 2010. A Composite of Multiple Signals Distinguishes Causal Variants in
Regions of Positive Selection. Science (80-. ). 327:883–886.
Grossman SR et al. 2013. Identifying recent adaptations in large-scale genomic data. Cell.
152:703–13.
Hahn MW, Conant GC, Wagner A. 2004. Molecular evolution in large genetic networks: does
connectivity equal constraint? J. Mol. Evol. 58:203–211.
Hahn MW, Kern AD. 2005. Comparative genomics of centrality and essentiality in three
eukaryotic protein-interaction networks. Mol. Biol. Evol. 22:803–806.
Hall TA. 1999. BioEdit: a user-friendly biological sequence alignment editor and analysis
program for Windows 95/98/NT. Nucleric Acids Symp. Ser. 41:95–98.
Hancock AM et al. 2011. Adaptations to Climate-Mediated Selective Pressures in Humans.PLoS Genet. 7:e1001375.
28
Hernandez, R. D., Kelley, J. L., Elyashiv, E., Melton, S. C., Auton, A., McVean, G., …
Przeworski1, M. (2011). Classic Selective Sweeps Were rare in Recent Human Evolution.
Science, 331, 920–924.
Hughes AL, Friedman R. 2010. More Radical Amino Acid Replacements in Primates than in
Rodents: Support for the Evolutionary Role of Effective Population Size. Gene. 440:50–56.
Iyer S, Killingback T, Sundaram B, Wang Z. 2013. Attack robustness and centrality of
complex networks. PLoS One. 8:e59613.
Jeong H, Albert R. 2000. The large-scale organization of metabolic networks. Nature.
407:651–654.
Jordan IK, Wolf Y, Koonin E. 2003. No simple dependence between protein evolution rate
and the number of protein-protein interactions: only the most prolific interactors tend to
evolve slowly. BMC Evol. Biol. 3:1.
Karolchik D, Hinrichs AS, Kent WJ. 2009. The UCSC Genome Browser. Curr. Protoc.
Bioinforma. Chapter1:Unit1:4.
Kelley JL, Madeoy J, Calhoun JC, Swanson W, Akey JM. 2006. Genomic signatures of
positive selection in humans and the limits of outlier approaches. Genome Res. 16:980–9.
Kersey PJ et al. 2012. Ensembl Genomes: an integrative resource for genome-scale data from
non-vertebrate species. Nucleic Acids Res. 40:D91–7.
Keshava Prasad TS et al. 2009. Human Protein Reference Database--2009 update. Nucleic
Acids Res. 37:D767–72.
Khurana E, Fu Y, Chen J, Gerstein M. 2013. Interpretation of Genomic Variants Using a
Unified Biological Network Approach. PLoS Comput. Biol. 9.
Kim PM, Korbel JO, Gerstein MB. 2007. Positive selection at the protein network periphery:
evaluation in terms of structural constraints and cellular context. Proc. Natl. Acad. Sci.
104:20274–20279.
Kosiol C et al. 2008. Patterns of positive selection in six Mammalian genomes. PLoS Genet.
4:e1000144.
Lappalainen T et al. 2013. Transcriptome and genome sequencing uncovers functional
variation in humans. Nature. 501:506–11.
Lemos B, Bettencourt BR, Meiklejohn CD, Hartl DL. 2005. Evolution of proteins and gene
expression levels are coupled in Drosophila and are independently associated with mRNA
29
abundance, protein length, and number of protein-protein interactions. Mol. Biol. Evol.
22:1345–1354.
Liang L et al. 2013. A cross-platform analysis of 14,177 expression quantitative trait loci
derived from lymphoblastoid cell lines. Genome Res. 23:716–26.
Liao B, Zhang J. 2008. Null mutations in human and mouse orthologs frequently result in
different phenotypes. Proc. Natl. Acadamy Sci. 105:6987–6992.
Liow LH, Van Valen L, Stenseth NC. 2011. Red Queen: from populations to taxa and
communities. Trends Ecol. Evol. 26:349–58.
Lovell SC, Robertson DL. 2010. An integrated view of molecular coevolution in protein-
protein interactions. Mol. Biol. Evol. 27:2567–75.
Luisi P et al. 2012. Network-level and population genetics analysis of the insulin/TOR signal
transduction pathway across human populations. Mol. Biol. Evol. 29:1379–92.
MacArthur DG et al. 2012. A systematic survey of loss-of-function variants in human protein-
coding genes. Science. 335:823–828.
Martin G. 2014. Fisher’s Geometrical Model Emerges as a Property of Complex Integrated
Phenotypic Networks. Genetics. 197:237–55.
McDonald JH, Kreitman M. 1991. Adaptive protein evolution at the Adh locus in Drosophila.
Nature. 351:652–4.
Mi H, Muruganujan A, Thomas PD. 2013. PANTHER in 2013 : modeling the evolution of
gene function , and other gene attributes , in the context of phylogenetic trees. Nucleic Acids
Res. 41:377–386.
Montanucci L, Laayouni H, Bertranpetit J (2014) The network framework of molecular
evolution. In: Fares MA, editor. Natural Selection: Methods and Applications. London: CRC
Press (Taylor & Francis). pp. 179-210.
Morar N, Cookson WOCM, Harper JI, Moffatt MF. 2007. Filaggrin mutations in children
with severe atopic dermatitis. J. Invest. Dermatol. 127:1667–72.
Nielsen R, Yang Z. 1998. Likelihood models for detecting positively selected amino acid sites
and applications to the HIV-1 envelope gene. Genetics. 148:929–936.
Olson-Manning CF, Lee C-R, Rausher MD, Mitchell-Olds T. 2013. Evolution of flux control
in the glucosinolate pathway in Arabidopsis thaliana. Mol. Biol. Evol. 30:14–23.
30
Olson-Manning CF, Wagner MR, Mitchell-Olds T. 2012. Adaptive evolution: evaluating
empirical support for theoretical predictions. Nat. Rev. Genet. 13:867–77.
Orr HA. 2005. The genetic theory of adaptation: a brief history. Nat. Rev. Genet. 6:119–27.
Pérez-Bercoff Å, Hudson CM, Conant GC. 2013. A conserved mammalian protein interaction
network. PLoS One. 8:e52581.
Pickrell JK et al. 2010. Understanding mechanisms underlying human gene expression
variation with RNA sequencing. Nature. 464:768–72.
Pritchard JK, Pickrell JK, Coop G. 2010. The genetics of human adaptation: hard sweeps, softsweeps, and polygenic adaptation. Curr. Biol. 20:R208–15.
Pybus M et al. 2014. 1000 Genomes Selection Browser 1.0: a genome browser dedicated to
signatures of natural selection in modern humans. Nucleic Acids Res. 42:D903–9.
Rausher MD. 2012. The evolution of genes in branched metabolic pathways. Evolution.
67:34–48.
Sawyer, S. A., & Hartl, D. L. (1992). Population genetics of polymorphism and divergence.
Genetics. 132(4):1161–76.
Scheinfeldt LB et al. 2009. Population genomic analysis of ALMS1 in humans reveals a
surprisingly complex evolutionary history. Mol. Biol. Evol. 26:1357–67.
Smith JM, Smith NH. 1996. Synonymous nucleotide divergence: what is “saturation”?
Genetics. 142:1033–6.
Stark C et al. 2011. The BioGRID Interaction Database: 2011 update. Nucleic Acids Res.
39:D698–704..
Subramanian S. 2013. Significance of population size on the fixation of nonsynonymous
mutations in genes under varying levels of selection pressure. Genetics. 193:995–1002.
Tajima F. 1989. Statistical method for testing the neutral mutation hypothesis by DNA
polymorphism. Genetics. 123:585–95.
Talavera G, Castresana J. 2007. Improvement of phylogenies after removing divergent and
ambiguously aligned blocks from protein sequence alignments. Syst. Biol. 56:564–77.
Teshima KM, Coop G, Przeworski M. 2006. How reliable are empirical genomic scans for
selective sweeps? Genome Res. 16:702–712.
The 1000 Genomes Project Consortium. 2012. An integrated map of genetic variation from
1,092 human genomes. Nature. 491:56–65.
31
Vitkup D, Kharchenko P, Wagner A. 2006. Influence of metabolic network structure and
function on enzyme evolution. Genome Biol. 7:R39.
Voight BF, Kudaravalli S, Wen X, Pritchard JK. 2006. A map of recent positive selection in
the human genome. PLoS Biol. 4:e72.
Wagner A. 2012. Metabolic networks and their evolution. Adv. Med. Biol. 751:29–51.
Wright KM, Rausher MD. 2010. The evolution of control and distribution of adaptive
mutations in a metabolic pathway. Genetics. 184:483–502.
Yang Z, Wong WSW, Nielsen R. 2005. Bayes empirical Bayes inference of amino acid sites
under positive selection. Mol. Biol. Evol. 22:1107–1118.
Zeng K, Shi S, Wu C-I. 2007. Compound tests for the detection of hitchhiking under positive
selection. Mol. Biol. Evol. 24:1898–908.
Zhai W, Nielsen R, Slatkin M. 2009. An investigation of the statistical power of neutrality
tests based on comparative and population genetic data. Mol. Biol. Evol. 26:273–283.
Zhang, J., & He, X. (2005). Significant Impact of Protein Dispensability on the Instantaneous
Rate of Protein Evolution. Mol. Biol. Evol. 22(4):1147–1155.
32
FIGURE LEGENDS
Figure 1. Distribution of genes with putative signatures of positive selection within the
Protein–Protein Interaction Network. ZF and 2Δℓ were used to estimate the likelihood of
having evolved under positive selection in human populations and in mammals, respectively.
A. Average degrees (number of interactions) for genes with and without signatures of positive
selection. We represent the mean of centrality measure ± one standard error for the genes with
a putative signal of positive selection (in red) and the other genes (in blue). The significance
of the differences between the mean of both groups was assessed through 10,000
permutations. Asterisks represent significant differences. *: P < 0.05; **: P < 0.01;. B.
Human protein–protein interaction network with genes with signatures of positive selection
according to divergence data (P < 0.05 estimated from 2Δℓ) represented in red. C. Human
protein–protein interaction network with genes with signatures of positive selection according
to polymorphism data represented in red.
Figure 2. Impact of natural selection among groups of genes divided according to degree
quartiles. Genes were divided into four groups according to the degree quartiles. The median
selection score ± one median absolute deviation for each group is represented in the y-axis. ZF
and 2Δℓ scores were used to estimate the likelihood of positive selection in human
populations and in mammals, respectively. DAF, NI and ω were used to estimate the impact
of purifying selection in recent human populations, in the human lineage and in mammals,
respectively. Lower DAF and ω indicate higher evolutionary constraint estimated from
polymorphism and divergence data, respectively, while higher NI scores indicate higher
evolutionary constraint estimated from both polymorphism and divergence data. A non
parametric ANOVA analysis was performed to contrast whether the medians of the scores are
equal across the groups. A trend test on ranks was also carried out to test for a linear
relationship between the four groups (encoded from 1 to 4) and natural selection scores. A
Tukey's honestly significant difference test was further applied to test for all pairwise
differences. Significantly different pairs are marked with asterisks according to the level of
significance. *: P < 0.05; **: P < 0.01; ***: P < 0.001.
33
Figure 3. Derived Allele Frequency for three sites classes nearby genes with signal of
recent positive selection. Crosses represent the median of the maximum Derived Allele
Frequency (DAF) observed for three site classes nearby polyPSGs: cis-eQTLs, 0-fold
degenerated sites and 4-fold degenerated sites. The violin plots represent the distribution of
the median of maximum DAF scores observed for a given site class in 10,000 random sets of
PIN genes. The analysis was restricted to PIN genes for which the Derived Allele Frequency
could be calculated for at least one SNP for each of the three site classes. (A) Using eQTLs
reported by the GEUVADIS consortium (Lappalainen et al. 2013) and located within 100 Kb
from the associated gene. The polyPSGs set contained 29 genes and the permutations were
performed on a set of 358 PIN genes (B) Using eQTLs reported by Liang et al. (2013) and
located within 100 Kb from the associated gene. The polyPSGs set contained 14 genes and
the permutations were performed on a set of 198 PIN genes. Significantly higher median DAF
in a site class for polyPSGs as compared to the 10,000 permutations are marked with
asterisks. **: P < 0.01
Figure 4. Comparison of the impact of natural selection between essential and non-
essential genes. We performed a Mann-Whitney test to compare the selection scores between
genes that are lethal (essential, in yellow) and viable (non essential, in green) when knocked
out in mice (data from the Mouse Genome Database (Bult et al. 2008);
“MRK_Ensembl_Pheno.rpt” file downloaded on 7 October 2010). ZF and 2Δℓ scores were
used to estimate the likelihood of positive selection in human populations and in mammals,
respectively. DAF, NI and ω were used to estimate the impact of purifying selection in recent
human populations, in the human lineage and in mammals, respectively. Lower DAF and ω
indicate higher evolutionary constraint estimated from polymorphism and divergence data,
respectively, while high NI scores indicate higher evolutionary constraint estimated from both
polymorphism and divergence data. In order to put all the scores within the same scale the
mean standardized scores are plotted (standardized scores were calculated by subtracting the
mean and dividing by the standard deviation). Significant differences between lethal and
viable genes pairs are marked with asterisks. *: P < 0.05; **: P < 0.01; ***: P < 0.001.
34
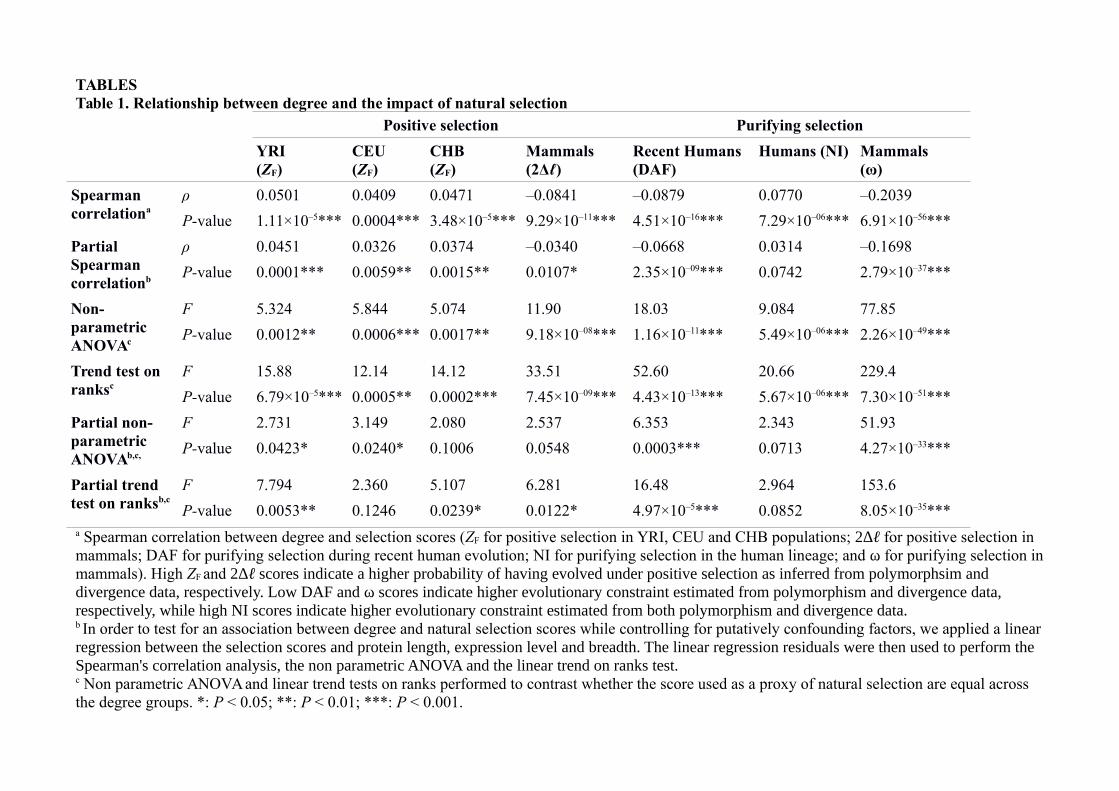
TABLESTable 1. Relationship between degree and the impact of natural selection
Positive selection Purifying selection
YRI(ZF)
CEU(ZF)
CHB(ZF)
Mammals(2Δℓ)
Recent Humans (DAF)
Humans (NI) Mammals(ω)
Spearman correlationa
ρ 0.0501 0.0409 0.0471 –0.0841 –0.0879 0.0770 –0.2039
P-value 1.11×10⁻⁵*** 0.0004*** 3.48×10⁻⁵*** 9.29×10⁻¹¹*** 4.51×10⁻¹⁶*** 7.29×10–06*** 6.91×10–56***
Partial Spearman correlationb
ρ 0.0451 0.0326 0.0374 –0.0340 –0.0668 0.0314 –0.1698
P-value 0.0001*** 0.0059** 0.0015** 0.0107* 2.35×10–09*** 0.0742 2.79×10–37***
Non-parametric ANOVAc
F 5.324 5.844 5.074 11.90 18.03 9.084 77.85
P-value 0.0012** 0.0006*** 0.0017** 9.18×10–08*** 1.16×10⁻¹¹*** 5.49×10–06*** 2.26×10–49***
Trend test on ranksc
F 15.88 12.14 14.12 33.51 52.60 20.66 229.4
P-value 6.79×10⁻⁵*** 0.0005** 0.0002*** 7.45×10–09*** 4.43×10⁻¹³*** 5.67×10–06*** 7.30×10–51***
Partial non-parametric ANOVAb,c,
F 2.731 3.149 2.080 2.537 6.353 2.343 51.93
P-value 0.0423* 0.0240* 0.1006 0.0548 0.0003*** 0.0713 4.27×10⁻³³***
Partial trend test on ranksb,c
F 7.794 2.360 5.107 6.281 16.48 2.964 153.6
P-value 0.0053** 0.1246 0.0239* 0.0122* 4.97×10–5*** 0.0852 8.05×10⁻³⁵***a Spearman correlation between degree and selection scores (ZF for positive selection in YRI, CEU and CHB populations; 2Δℓ for positive selection in mammals; DAF for purifying selection during recent human evolution; NI for purifying selection in the human lineage; and ω for purifying selection inmammals). High ZF and 2Δℓ scores indicate a higher probability of having evolved under positive selection as inferred from polymorphsim and divergence data, respectively. Low DAF and ω scores indicate higher evolutionary constraint estimated from polymorphism and divergence data, respectively, while high NI scores indicate higher evolutionary constraint estimated from both polymorphism and divergence data.b In order to test for an association between degree and natural selection scores while controlling for putatively confounding factors, we applied a linearregression between the selection scores and protein length, expression level and breadth. The linear regression residuals were then used to perform the Spearman's correlation analysis, the non parametric ANOVA and the linear trend on ranks test.c Non parametric ANOVA and linear trend tests on ranks performed to contrast whether the score used as a proxy of natural selection are equal across the degree groups. *: P < 0.05; **: P < 0.01; ***: P < 0.001.
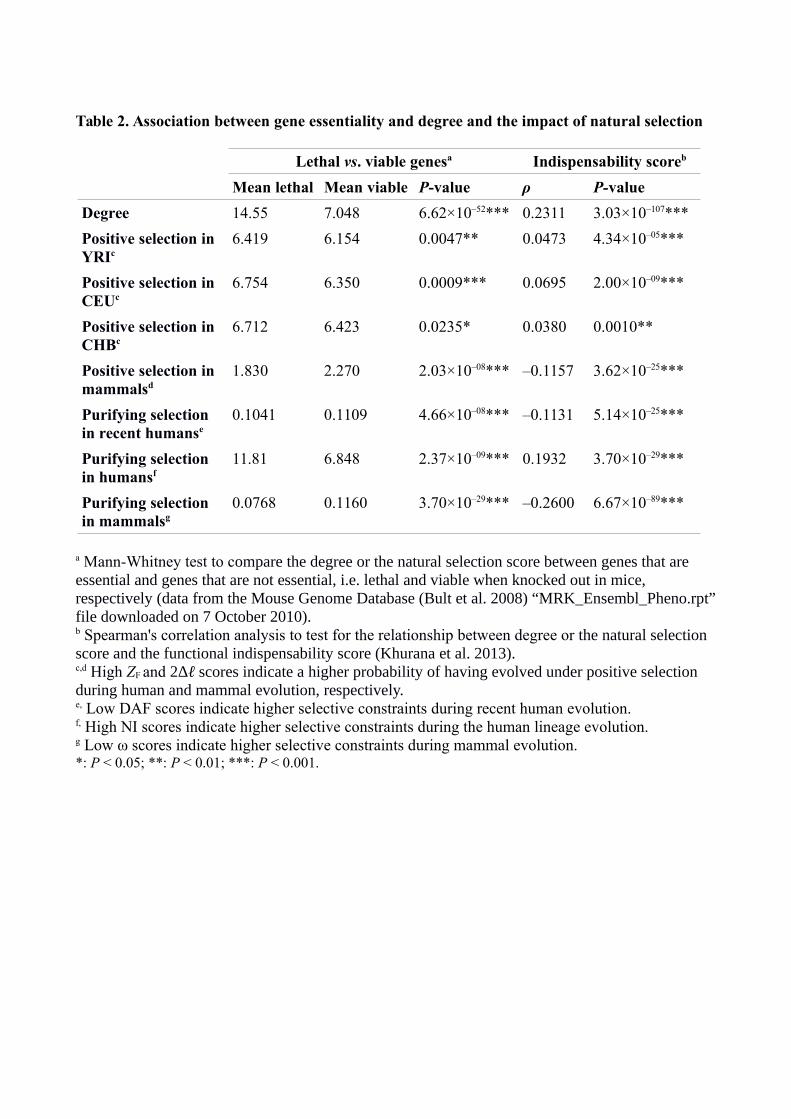
Table 2. Association between gene essentiality and degree and the impact of natural selection
Lethal vs. viable genesa Indispensability scoreb
Mean lethal Mean viable P-value ρ P-value
Degree 14.55 7.048 6.62×10–52*** 0.2311 3.03×10–107***
Positive selection in YRIc
6.419 6.154 0.0047** 0.0473 4.34×10–05***
Positive selection in CEUc
6.754 6.350 0.0009*** 0.0695 2.00×10–09***
Positive selection in CHBc
6.712 6.423 0.0235* 0.0380 0.0010**
Positive selection in mammalsd
1.830 2.270 2.03×10–08*** –0.1157 3.62×10⁻²⁵***
Purifying selection in recent humanse
0.1041 0.1109 4.66×10–08*** –0.1131 5.14×10⁻²⁵***
Purifying selection in humansf
11.81 6.848 2.37×10–09*** 0.1932 3.70×10⁻²⁹***
Purifying selection in mammalsg
0.0768 0.1160 3.70×10⁻²⁹*** –0.2600 6.67×10–89***
a Mann-Whitney test to compare the degree or the natural selection score between genes that are essential and genes that are not essential, i.e. lethal and viable when knocked out in mice, respectively (data from the Mouse Genome Database (Bult et al. 2008) “MRK_Ensembl_Pheno.rpt”file downloaded on 7 October 2010).b Spearman's correlation analysis to test for the relationship between degree or the natural selection score and the functional indispensability score (Khurana et al. 2013). c,d High ZF and 2Δℓ scores indicate a higher probability of having evolved under positive selection during human and mammal evolution, respectively.e, Low DAF scores indicate higher selective constraints during recent human evolution.f, High NI scores indicate higher selective constraints during the human lineage evolution.g Low ω scores indicate higher selective constraints during mammal evolution.*: P < 0.05; **: P < 0.01; ***: P < 0.001.
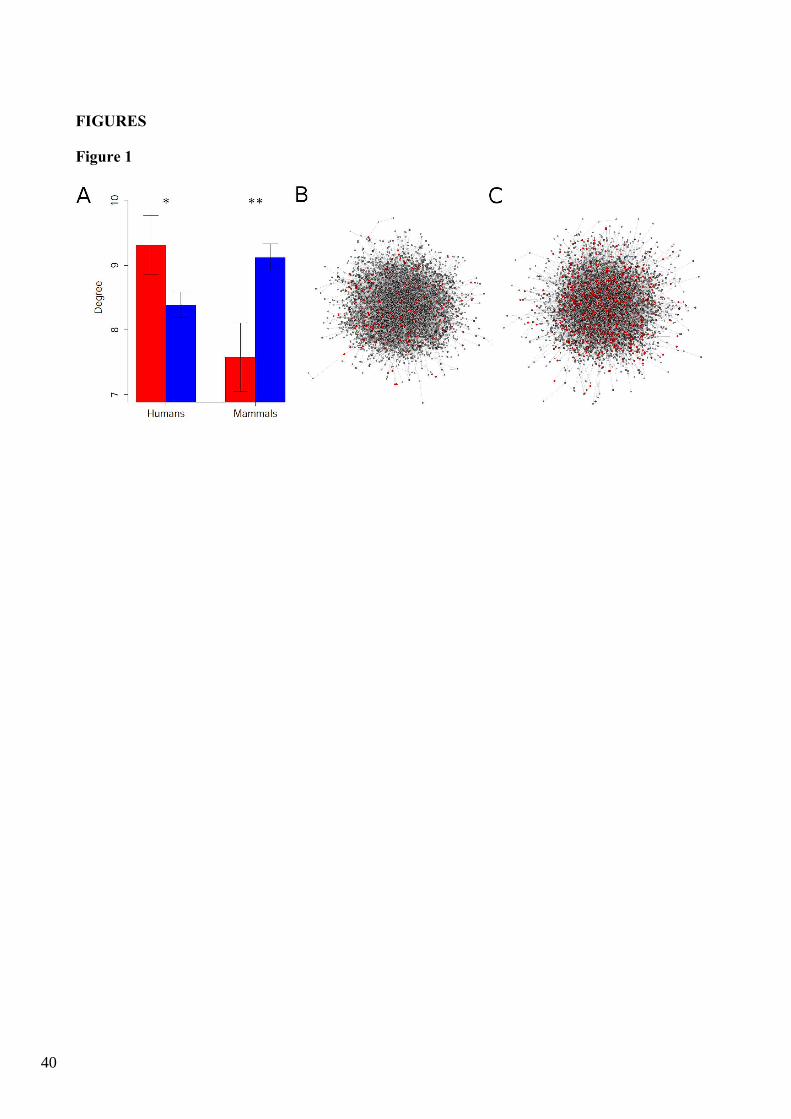
FIGURES
Figure 1
40
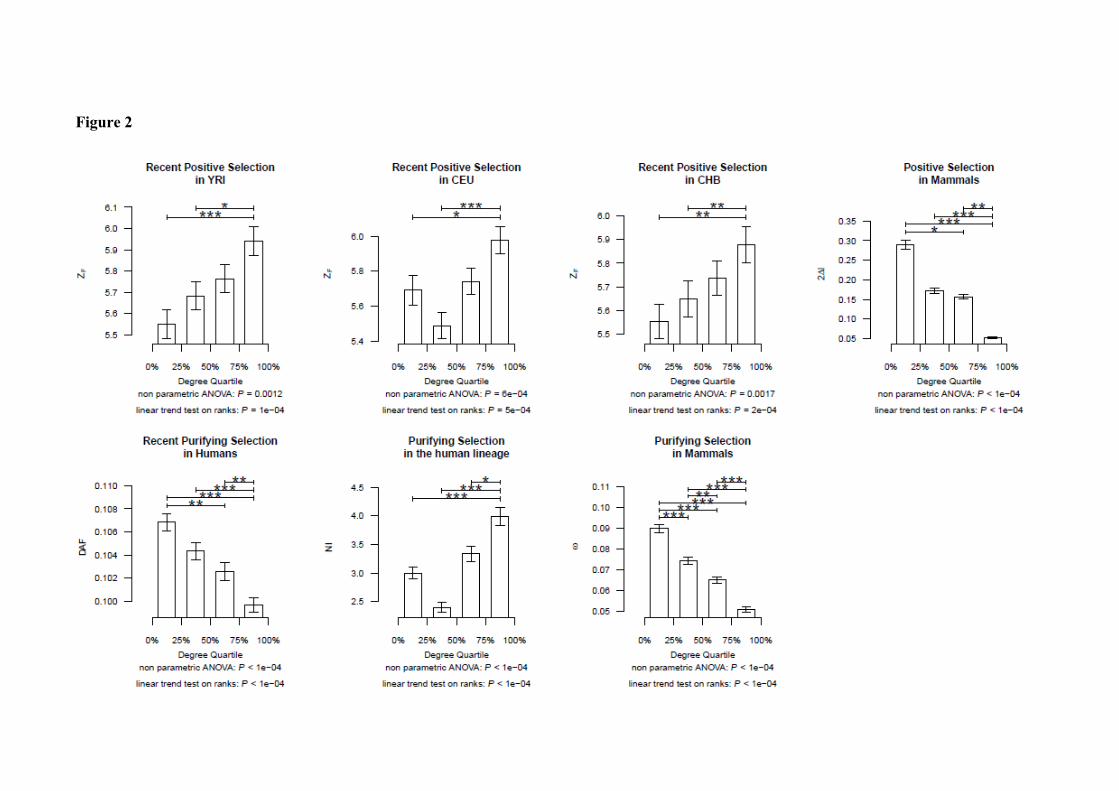
Figure 2
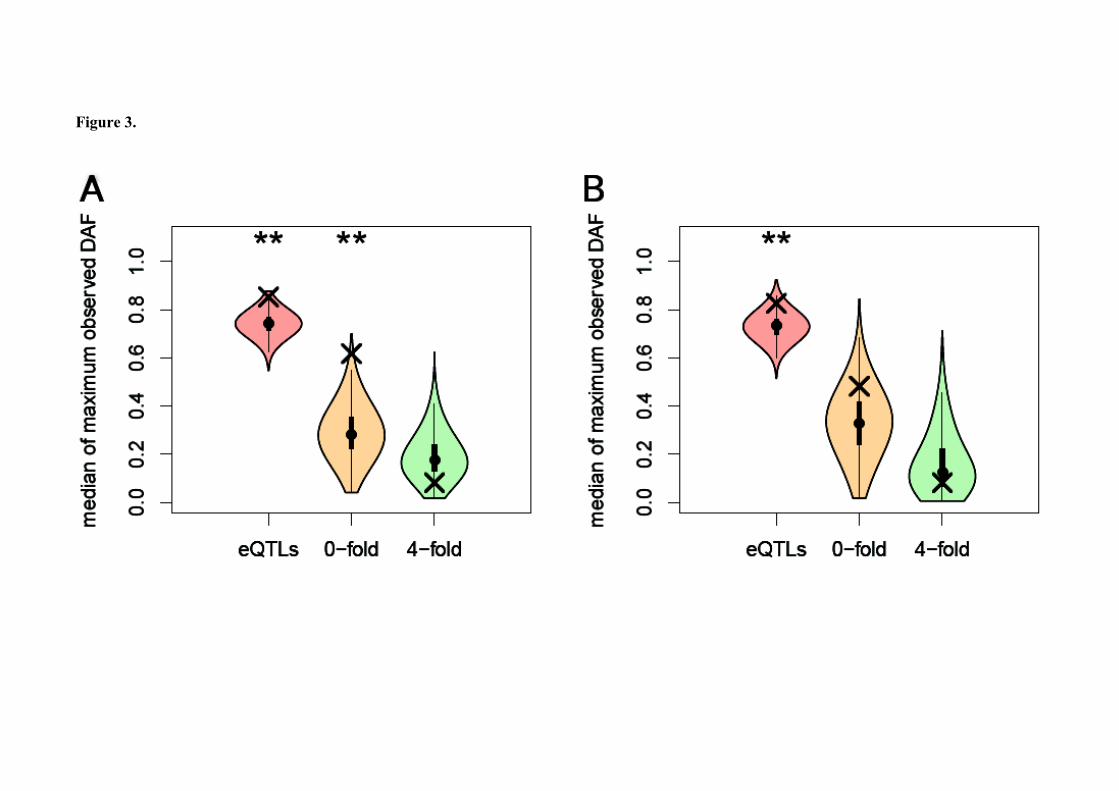
Figure 3.
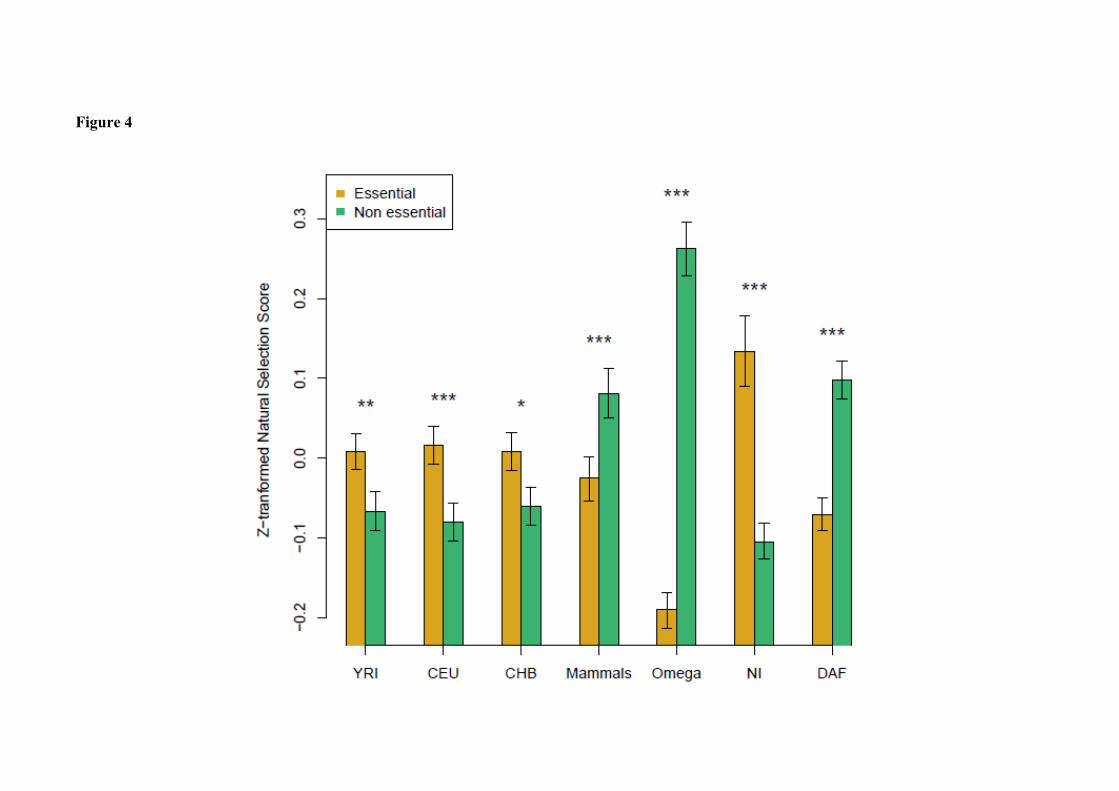
Figure 4


![GENES VII [Books biology genetics] [prentice.hall][genes](https://img.pdfslide.net/doc/110x75/55cce1ffbb61eb56508b46c3/genes-vii-books-biology-genetics-prenticehallgenes.jpg)