Embed Size (px)
Citation preview
Recent Progress of Microbubble Flow Simulation for ElucidatingDrag Reduction Mechanism
Kazuyasu SUGIYAMA*, Takafumi KAWAMURA**, Shu TAKAGI*** and Yoichiro MATSUMOTO***
*Center for Smart Control of Turbulence, National Maritime Research Institute6-38-1, Shinkawa, Mitaka-shi, Tokyo, 181-0004, JAPAN
**Department of Environmental and Ocean Engineering, The University of Tokyo7-3-1 Hongo, Bunkyo-ku, Tokyo, 113-8656, JAPAN
***Department of Mechanical Engineering, The University of Tokyo
7-3-1 Hongo, Bunkyo-ku, Tokyo, 113-8656, JAPAN
The progress of microbubble flow simulations in our group is summarized. Numerical simulations of
turbulent channel flows containing a lot of bubbles are performed for various Reynolds numbers. The
skin friction increases at the lower Reynolds number of Reτ ≈ 200, while it decreases at the higher
Reynolds number of Reτ ≈ 1× 10³ which is same magnitude as that in typical experiments. These results
are consistent with the dissipation theory, i.e., the reduction (or increase) of the total dissipation rate
accounts for the drag reduction (or increase). Numerical simulations of homogeneous shear flows are also
carried out in order to find the mechanism of reducing the turbulence production leading to the drag
reduction. By investigating the distribution of vortical structures, the turbulence production tends to
reduce when the turbulence introduced by the bubbles is small enough.
1 Introduction
Injecting microbubbles into a turbulent boundary layer is considered the most suitable for ships amongseveral techniques proposed for reducing a skin friction, such as riblets, mechanical devices and polymers,because of high efficiency, low cost and no environmental contamination. Madavan et al. (1984) measuredthe skin friction on a plate placed in a water tunnel and reported an attractive result that the efficiency ofthe MicroBubble Drag Reduction (MBDR) reaches up to 80%. Although the MBDR has been studied overthe last three decades since McCormick and Bhattachryya (1973) experimentally found this phenomenon, itsmechanism is not fully understood yet. It is because the microbubbles obstruct detailed measurements.
It is very recent to overcome the difficulty in obtaining the detailed data on the flow modulation. Withprogresses in measurements and numerical simulations, the dynamic interaction between the bubble andliquid has enabled us to be locally captured and tells us helpful insight into the MBDR mechanism. On thenumerical studies, we have simulated the microbubble flow since 2000 when the research project of “SmartControl of Turbulence” started. Although the numerical simulation seems appropriate for making clear theMBDR mechanism because of considering the local flow dynamics, it is not easy to reproduce the MBDR.Kawamura and Kodama (2002) and Sugiyama et al. (2002) simulated the channel turbulent flow containingdeformable bubbles in the Front Tracking Method (FTM) generalized by Unverdi and Tryggvason (1992) andshowed unsuccessful results that the skin friction increases with increasing void fraction. They set to thefriction Reynolds number Reτ less than 180, which is one or two orders of the magnitude smaller comparedwith typical experiments, due to computational restrictions. Sugiyama et al. (2002) also investigated theinfluences of other factors, such as the compressibility of bubble, and showed the increase of the skin friction.The first successful simulation to reproduce the MBDR was reported by Xu, Maxey and Karniadakis (2002).They employed the Force Coupling Method (FCM) developed by Maxey and Patel (2001). They simulatedthe turbulent channel flow at relatively low Reynolds number (Reτ = 135) with large bubbles (d = 0.2h−0.6h,here d is the bubble diameter and h the channel half height h). They initially put bubbles in the layer nearthe wall and showed that the drag reduction transiently occurs when the bubbles disperse by turbulence. Theauthors also investigated the transient effects of the bubble concentration on the skin friction at the comparableReynolds number in the Eulerian-Lagrangian Method (ELM), FTM and FCM (see Kodama et al., 2003 andSugiyama et al.,2003 & 2004). With respect to the fully resolved DNS for deformable bubbles, Lu , Fernandezand Tryggvason (2004) recently investigated the deformation effect on the skin friction in the FTM. Theyshowed that the deformable bubbles suppress forming quasi-streamwise vortices near the wall, which carrylarge Reynolds shear stress, and consequently the skin friction significantly reduces. Ferrante and Elghobashi(2004) performed point bubble simulations in the spatially developing turbulent boundary layer in the ELM.They showed that the non-zero divergence of the liquid velocity vector due to the inhomogeneous distributionof the void fraction causes the negative momentum transfer and displaces quasi-streamwise vortices away fromthe wall. Consequently, the MBDR rate reaches up to about 20% even at the small void fraction (α0 =2%).Although the high efficiency of the MBDR in their result is attractive for the application, it is technically
difficult to generate the small bubble comparable to the wall unit with small energy input. Until now, althoughseveral different hypotheses for the MBDR have been proposed from the simulation results, the consensus onits mechanism is not reached yet.
In this paper, the progress of microbubble flow simulations for elucidating the drag reduction mechanismin our group is summarized. The simulation methods in the ELM, FCM and FTM for the microbubble flow inthe channel are shown and flow modulations on the skin friction are discussed on the basis of the dissipationtheory. Numerical simulations of homogeneous shear flows are also carried out in order to find the mechanismof reducing the turbulence production leading to the drag reduction.
2 Channel flow simulation with point bubbles
In order to investigate the effect of the large scale density fluctuation, point bubble simulations havebeen performed (Sugiyama et al.,2003). The purpose of this simulation is to examine the effects of thetransient bubble dispersion (Xu et al., 2001) and the velocity divergence (Ferrante and Elghobashi, 2004). Thesimulation code based on the Eulerian-Lagrangian Method (ELM, Murai and Matsumoto, 1996) is developedfor the channel turbulent flow with microbubbles. In the ELM, the liquid phase is solved on the grid in theEulerian way and the bubble is individually tracked in the Lagrangian way. The governing equations arebased on the volume averaged equations for the mass and momentum conservations and discretized on gridsmuch larger than the bubble diameter.
Governing equations consist of conservation equations of liquid and gas volume fraction,
∂fL
∂t+ ∇ · (fLuL) = 0,
∂fG
∂t+ ∇ · (fGuG) = 0, (1)
and the momentum conservation equation for the liquid and gas mixture fluid,
ρL
[∂fLuL
∂t+ ∇ · (fLuLuL)
]= −∇p + µL∇2uL, (2)
where f is the volume fraction, t the time, u the velocity, p the pressure, µ the viscosity. The subscripts L andG represent liquid and gas phases, respectively. To close the set of equations, the constraints on the volumefraction fL + fG = 1 and the equation of translational motion of bubble taken the added inertia, steady dragforce on the bubble and the liquid inertia around the bubble into account are used as constitutive equations.The fourth-order finite difference and second-order Adams-Bashforth methods are employed for the spatial andtime derivatives, respectively. The interpolation from the liquid phase to the bubble centroid is approximatedby using the fifth-order Lagrange’s interpolation polynomial. The developing flow in a channel with a bubbleinjection from the top wall is simulated. The friction Reynolds number Reτ is set to 150. The size of thesimulation domain is set to Lx × Ly × Lz = 10πh × 2h × πh divided by Nx × Ny × Nz = 320 × 64 × 64 gridpoints, in the streamwise (x), wall-normal (y) and spanwise (z) directions, respectively. The bubble diameternormalized by the wall unit d+ is 2. The bulk void fraction fG0, corresponding to the flow rate of the injectedbubble divided by the total flow rate, is 0.3%. This fG0 is much smaller than in the typical experiments dueto the numerical restriction.
Figure 1 shows a typical side view of an instantaneous bubble distribution. White points correspond tothe bubbles. The bubbles are injected from x = 0.5πh to πh with the vertical velocity of −uτ . As shown inFig.1, the bubbles disperse by turbulence in the downstream.
Figure 2 shows the streamwise profile of Cf/Cf0 on the top and bottom walls. Cf corresponds to thefriction coefficient scaled by the inlet flow rate and the liquid density and Cf0 to that in single phase flow. Cf isaveraged over the time and in the spanwise direction. The skin friction on the top wall reduces at downstreamof the injection when the bubble cluster disperses into the flow. This results seems to be consistent with thatreported by Xu et al.(2001) in the force coupling method. The drag reduction persists to the outlet region atthe distance from the end of the injection zone longer than 20h, corresponding to 3000 wall units. Althoughthe skin friction increases on the top and bottom walls near the bubble injection region, the total skin frictionwith bubbles becomes smaller than that in the singe phase flow.
In order to discuss the flow modulation, the Reynolds shear stress −fLuLvL is analyzed. This stress canbe decomposed into
−fLuLvL =
fluctuating component︷ ︸︸ ︷−(fLuLvL − fLuLvL) −fLuLvL︸ ︷︷ ︸
mean component
, (3)
where the operator · corresponds to averaging over the xz−plane. Note that the mean component is zero inthe single phase flow because of vL = 0. The wall-normal profiles of the fluctuating and mean components
of the Reynolds shear stress on several x-positions are shown in Fig.3. The fluctuating component is almostindependent of x, while the mean component is non-zero (i.e., vL = 0) and strongly dependent on x. That isthe modulation of the turbulent flow is small, while that of the mean flow is large. It is caused by the velocitydivergence effect due to the inhomogeneous distribution of the void fraction shown by Ferrante and Elghobashi(2004). We confirmed the drag reduction obtained in the ELM is caused by the velocity divergence effect frommomentum balances. The results seem to be consistent with those reported by Xu et al.(2002) and Ferranteand Elghobashi (2004). In the ELM, however, the restriction of the bubble diameter being comparable tothe wall unit is severe problem when considering the bubble diameter being O(100) wall units in the typicalexperiments. In the following sections, the larger bubble will be treated in other simulation methods.
3 Channel flow simulations with finite size bubbles at low Reynoldsnumber (Reτ < 200)
Extensive simulations of the channel turbulent flow have been performed at the friction Reynolds numberReτ less than 200. So far, most of the microbubble flow simulations have also been performed at Reτ ∼ 150which is one or two orders of the magnitude smaller compared with typical experiments. Lu et al. (2004)showed both increase and reduction of the skin friction by examining the bubble deformation. For perfectly ornearly spherical bubbles in the low Reynolds number simulations, Xu et al.(2002) shows the drag reduction,while Kawamura and Kodama (2002) and Sugiyama et al. (2002& 2004) showed the drag increase in spiteof almost same bubble size. In this section, we discuss this inconsistency and show what type of simulationmethod should be employed in elucidating the drag redution mechanism on the basis of the dissipation theory.
Xu et al.(2002) employed the Force Coupling Method (FCM). They assumed the bubble is spherical andrigid and neglected the buoyancy. In the FCM, the no-slip boundary condition is not fully satisfied on thebubble surface. Instead of the satisfaction of the boundary condition, the body force from the bubble to theliquid Fp is introduced in the momentum equation given by
ρLDuDt
= −∇p + µL∇2u + Fp. (4)
Based on the Stokesian dynamics, Fp is expressed as,
Fpi =Nb∑l=1
(F
(l)i ∆(x − Y(l), σm)︸ ︷︷ ︸
Force monopole
+ F(l)ij
∂
∂xj∆(x − Y(l), σd)︸ ︷︷ ︸
Force dipole
...
). (5)
The force monopole is related to the translational motion of the bubble and equivalent to the reaction forceagainst the drag force on the bubble. Xu et al.(2002) considered the force monopole. The force dipole isrelated to the velocity gradient around the bubble. Even if the bubbles perfectly follow the surroundingliquid, the force dipole is non-zero due to the shear flow. According to the Einstein’s theory (Batchelor,1967), the force dipole contributes to the increase of the skin friction. Although the method to include theforce dipole in the FCM was generalized by Lomholt et al.(2002), Xu et al.(2002) neglected it. The authorsdeveloped the simple method to estimate the force dipole and showed reasonable result compared with theEinstein’s theory (Sugiyama et al., 2004).
The modulation of the skin friction will be discussed from the dissipation theory. In the single phase flow,the modulation of the skin friction is often discussed from the Reynolds shear stress or the production of theturbulent kinetic energy. The dissipation rate may seem the secondary effect because small eddies carryinglarge dissipation rate are generated as the result of the energy cascade from energy-containing large eddies.In the bubbly flow, however, the dissipation rate around the bubble locally changes due to the vorticitygeneration on the bubble surface. Based on Eq.4, total friction coefficient CTop
f + CBotf in the channel flow is
expressed as,
CTopf + CBot
f =8µLh〈S : S〉
ρL〈u〉3︸ ︷︷ ︸Dissipation
+2h
〈u〉3[d〈u · u〉
dt− d〈u〉〈u〉
dt
]︸ ︷︷ ︸
Fluid motion
− 4h
ρL〈u〉3 〈u ·Fp〉︸ ︷︷ ︸Bubble force
,(6)
where S(= ∇u + (∇u)T /2) is the strain rate tensor and the operator 〈·〉 the volume averaging over thewhole region. The effects of the buoyancy and the bubble deformation can be additionally included in Eq.6.The bubble force term in Eq.6 accounts for the bubble and liquid interaction. The third term in the RHS willtemporally decrease if the transient effect, e.g. the large scale density change due to the bubble dispersion, is
important for the drag reduction. In the statistically steady situation, this term becomes negligible and thedissipation term dominant.
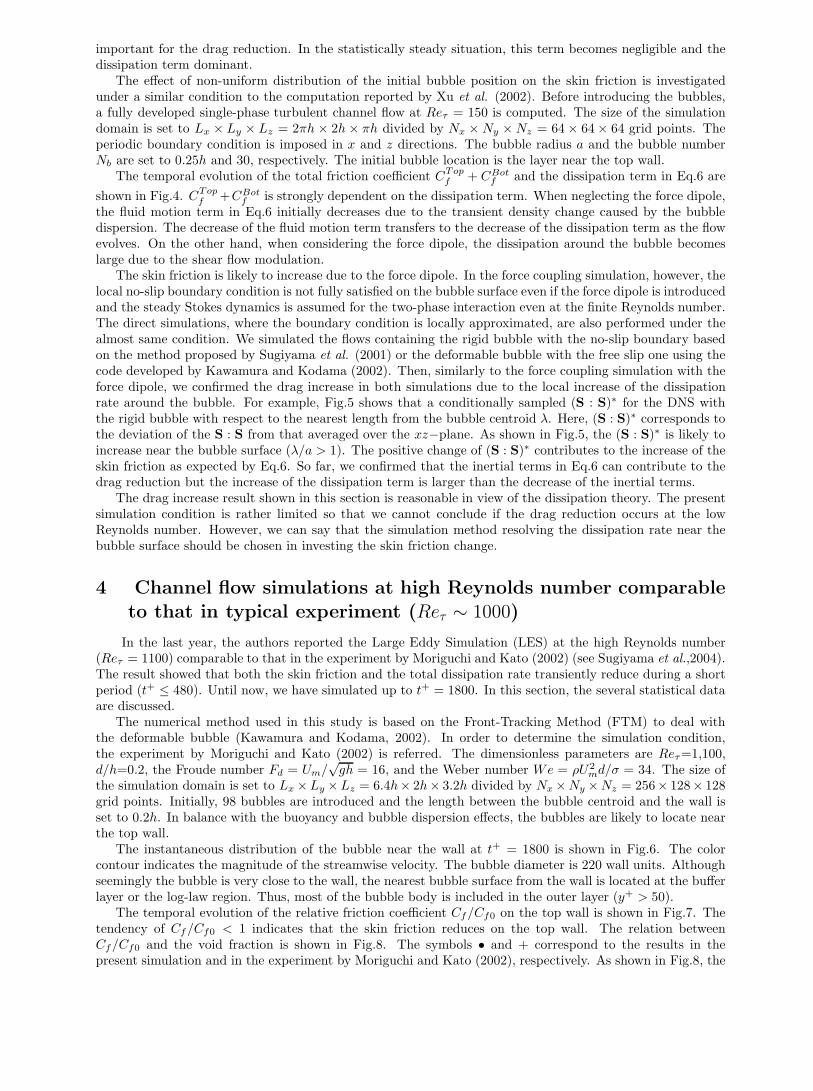
The effect of non-uniform distribution of the initial bubble position on the skin friction is investigatedunder a similar condition to the computation reported by Xu et al. (2002). Before introducing the bubbles,a fully developed single-phase turbulent channel flow at Reτ = 150 is computed. The size of the simulationdomain is set to Lx × Ly × Lz = 2πh × 2h × πh divided by Nx × Ny × Nz = 64 × 64 × 64 grid points. Theperiodic boundary condition is imposed in x and z directions. The bubble radius a and the bubble numberNb are set to 0.25h and 30, respectively. The initial bubble location is the layer near the top wall.
The temporal evolution of the total friction coefficient CTopf + CBot
f and the dissipation term in Eq.6 areshown in Fig.4. CTop
f +CBotf is strongly dependent on the dissipation term. When neglecting the force dipole,
the fluid motion term in Eq.6 initially decreases due to the transient density change caused by the bubbledispersion. The decrease of the fluid motion term transfers to the decrease of the dissipation term as the flowevolves. On the other hand, when considering the force dipole, the dissipation around the bubble becomeslarge due to the shear flow modulation.
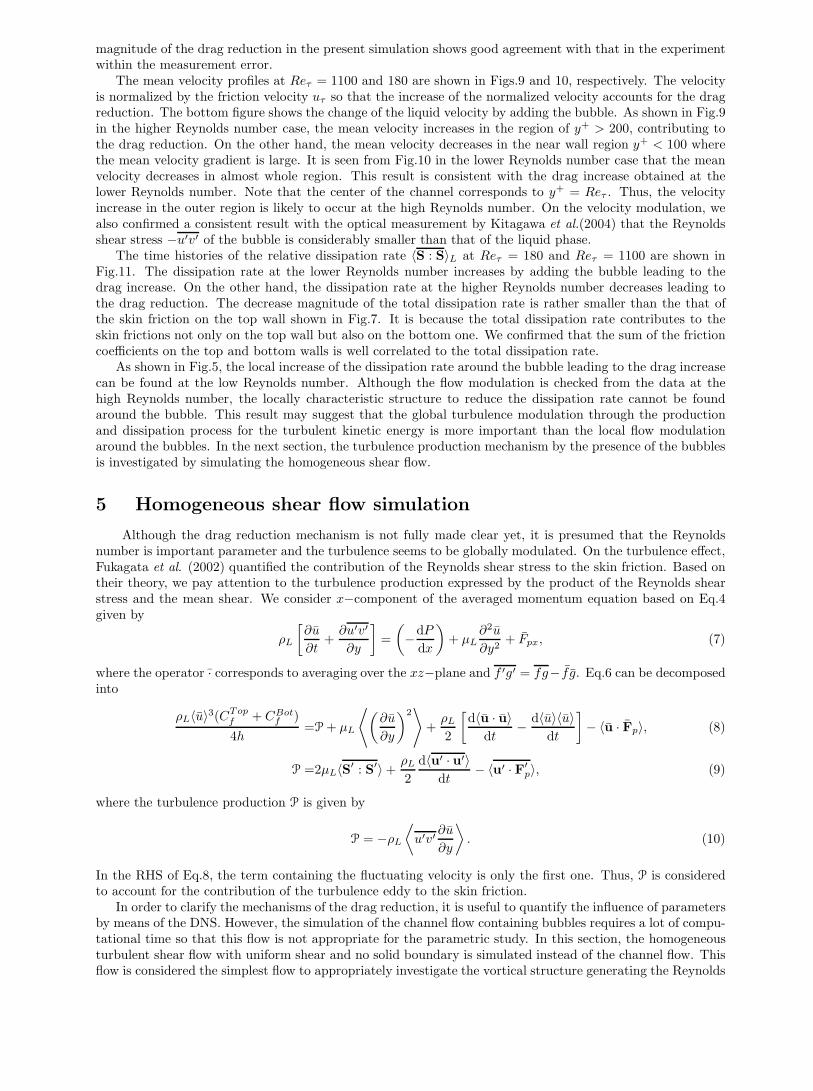
The skin friction is likely to increase due to the force dipole. In the force coupling simulation, however, thelocal no-slip boundary condition is not fully satisfied on the bubble surface even if the force dipole is introducedand the steady Stokes dynamics is assumed for the two-phase interaction even at the finite Reynolds number.The direct simulations, where the boundary condition is locally approximated, are also performed under thealmost same condition. We simulated the flows containing the rigid bubble with the no-slip boundary basedon the method proposed by Sugiyama et al. (2001) or the deformable bubble with the free slip one using thecode developed by Kawamura and Kodama (2002). Then, similarly to the force coupling simulation with theforce dipole, we confirmed the drag increase in both simulations due to the local increase of the dissipationrate around the bubble. For example, Fig.5 shows that a conditionally sampled (S : S)∗ for the DNS withthe rigid bubble with respect to the nearest length from the bubble centroid λ. Here, (S : S)∗ corresponds tothe deviation of the S : S from that averaged over the xz−plane. As shown in Fig.5, the (S : S)∗ is likely toincrease near the bubble surface (λ/a > 1). The positive change of (S : S)∗ contributes to the increase of theskin friction as expected by Eq.6. So far, we confirmed that the inertial terms in Eq.6 can contribute to thedrag reduction but the increase of the dissipation term is larger than the decrease of the inertial terms.
The drag increase result shown in this section is reasonable in view of the dissipation theory. The presentsimulation condition is rather limited so that we cannot conclude if the drag reduction occurs at the lowReynolds number. However, we can say that the simulation method resolving the dissipation rate near thebubble surface should be chosen in investing the skin friction change.
4 Channel flow simulations at high Reynolds number comparable
to that in typical experiment (Reτ ∼ 1000)
In the last year, the authors reported the Large Eddy Simulation (LES) at the high Reynolds number(Reτ = 1100) comparable to that in the experiment by Moriguchi and Kato (2002) (see Sugiyama et al.,2004).The result showed that both the skin friction and the total dissipation rate transiently reduce during a shortperiod (t+ ≤ 480). Until now, we have simulated up to t+ = 1800. In this section, the several statistical dataare discussed.
The numerical method used in this study is based on the Front-Tracking Method (FTM) to deal withthe deformable bubble (Kawamura and Kodama, 2002). In order to determine the simulation condition,the experiment by Moriguchi and Kato (2002) is referred. The dimensionless parameters are Reτ=1,100,d/h=0.2, the Froude number Fd = Um/
√gh = 16, and the Weber number We = ρU2
md/σ = 34. The size ofthe simulation domain is set to Lx ×Ly ×Lz = 6.4h× 2h× 3.2h divided by Nx ×Ny ×Nz = 256× 128× 128grid points. Initially, 98 bubbles are introduced and the length between the bubble centroid and the wall isset to 0.2h. In balance with the buoyancy and bubble dispersion effects, the bubbles are likely to locate nearthe top wall.
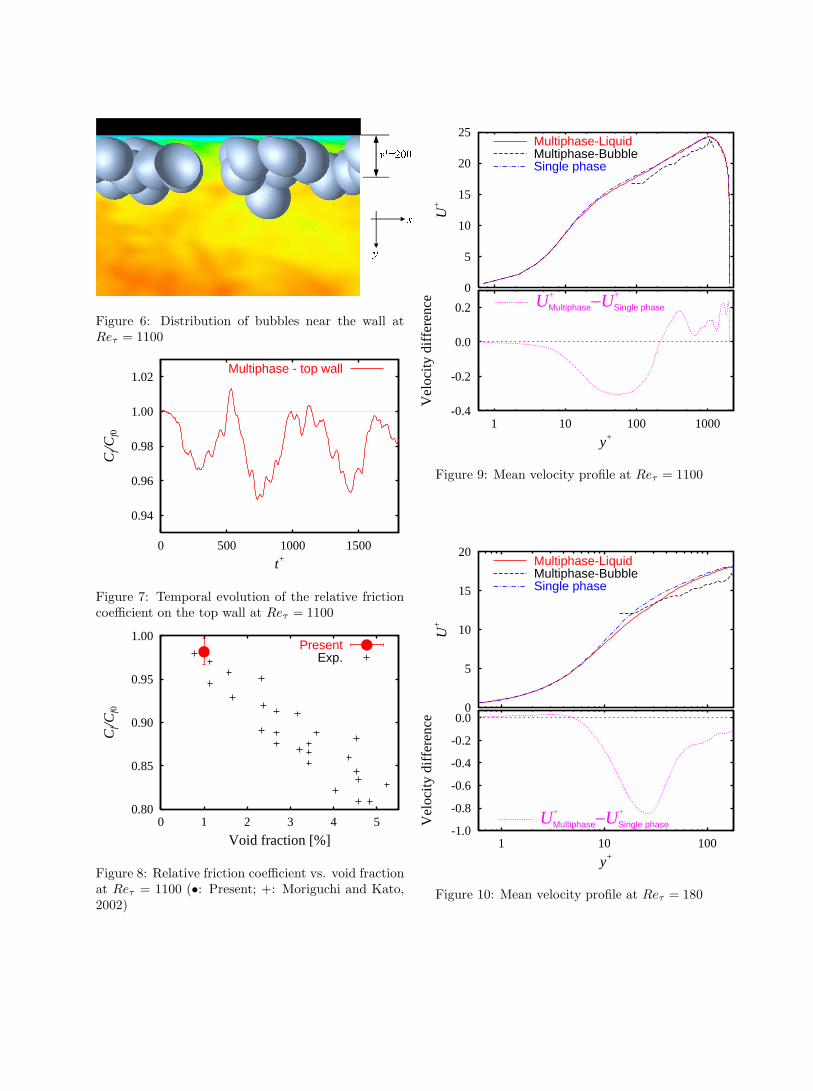
The instantaneous distribution of the bubble near the wall at t+ = 1800 is shown in Fig.6. The colorcontour indicates the magnitude of the streamwise velocity. The bubble diameter is 220 wall units. Althoughseemingly the bubble is very close to the wall, the nearest bubble surface from the wall is located at the bufferlayer or the log-law region. Thus, most of the bubble body is included in the outer layer (y+ > 50).
The temporal evolution of the relative friction coefficient Cf/Cf0 on the top wall is shown in Fig.7. Thetendency of Cf/Cf0 < 1 indicates that the skin friction reduces on the top wall. The relation betweenCf/Cf0 and the void fraction is shown in Fig.8. The symbols • and + correspond to the results in thepresent simulation and in the experiment by Moriguchi and Kato (2002), respectively. As shown in Fig.8, the
magnitude of the drag reduction in the present simulation shows good agreement with that in the experimentwithin the measurement error.
The mean velocity profiles at Reτ = 1100 and 180 are shown in Figs.9 and 10, respectively. The velocityis normalized by the friction velocity uτ so that the increase of the normalized velocity accounts for the dragreduction. The bottom figure shows the change of the liquid velocity by adding the bubble. As shown in Fig.9in the higher Reynolds number case, the mean velocity increases in the region of y+ > 200, contributing tothe drag reduction. On the other hand, the mean velocity decreases in the near wall region y+ < 100 wherethe mean velocity gradient is large. It is seen from Fig.10 in the lower Reynolds number case that the meanvelocity decreases in almost whole region. This result is consistent with the drag increase obtained at thelower Reynolds number. Note that the center of the channel corresponds to y+ = Reτ . Thus, the velocityincrease in the outer region is likely to occur at the high Reynolds number. On the velocity modulation, wealso confirmed a consistent result with the optical measurement by Kitagawa et al.(2004) that the Reynoldsshear stress −u′v′ of the bubble is considerably smaller than that of the liquid phase.
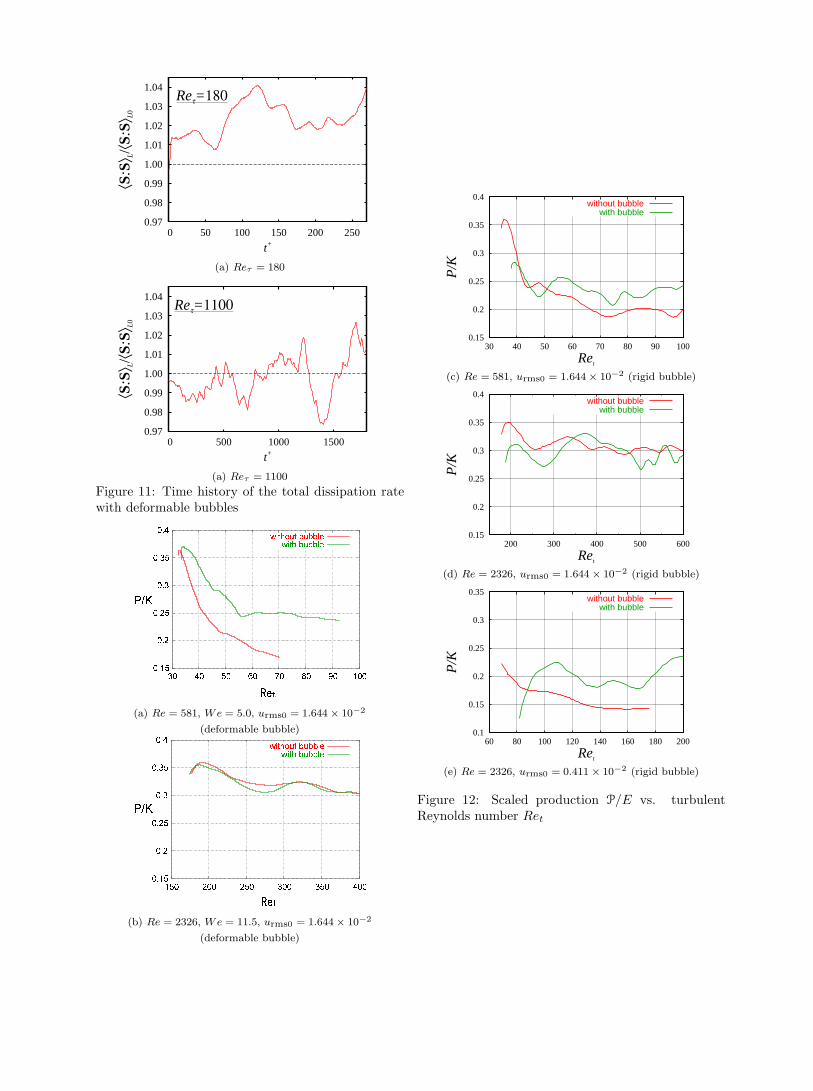
The time histories of the relative dissipation rate 〈S : S〉L at Reτ = 180 and Reτ = 1100 are shown inFig.11. The dissipation rate at the lower Reynolds number increases by adding the bubble leading to thedrag increase. On the other hand, the dissipation rate at the higher Reynolds number decreases leading tothe drag reduction. The decrease magnitude of the total dissipation rate is rather smaller than the that ofthe skin friction on the top wall shown in Fig.7. It is because the total dissipation rate contributes to theskin frictions not only on the top wall but also on the bottom one. We confirmed that the sum of the frictioncoefficients on the top and bottom walls is well correlated to the total dissipation rate.
As shown in Fig.5, the local increase of the dissipation rate around the bubble leading to the drag increasecan be found at the low Reynolds number. Although the flow modulation is checked from the data at thehigh Reynolds number, the locally characteristic structure to reduce the dissipation rate cannot be foundaround the bubble. This result may suggest that the global turbulence modulation through the productionand dissipation process for the turbulent kinetic energy is more important than the local flow modulationaround the bubbles. In the next section, the turbulence production mechanism by the presence of the bubblesis investigated by simulating the homogeneous shear flow.
5 Homogeneous shear flow simulation
Although the drag reduction mechanism is not fully made clear yet, it is presumed that the Reynoldsnumber is important parameter and the turbulence seems to be globally modulated. On the turbulence effect,Fukagata et al. (2002) quantified the contribution of the Reynolds shear stress to the skin friction. Based ontheir theory, we pay attention to the turbulence production expressed by the product of the Reynolds shearstress and the mean shear. We consider x−component of the averaged momentum equation based on Eq.4given by
ρL
[∂u
∂t+
∂u′v′
∂y
]=(−dP
dx
)+ µL
∂2u
∂y2+ Fpx, (7)
where the operator · corresponds to averaging over the xz−plane and f ′g′ = fg− f g. Eq.6 can be decomposedinto
ρL〈u〉3(CTopf + CBot
f )4h
=P + µL
⟨(∂u
∂y
)2⟩
+ρL
2
[d〈u · u〉
dt− d〈u〉〈u〉
dt
]− 〈u · Fp〉, (8)
P =2µL〈S′ : S′〉 +ρL
2d〈u′ · u′〉
dt− 〈u′ · F′
p〉, (9)
where the turbulence production P is given by
P = −ρL
⟨u′v′
∂u
∂y
⟩. (10)
In the RHS of Eq.8, the term containing the fluctuating velocity is only the first one. Thus, P is consideredto account for the contribution of the turbulence eddy to the skin friction.
In order to clarify the mechanisms of the drag reduction, it is useful to quantify the influence of parametersby means of the DNS. However, the simulation of the channel flow containing bubbles requires a lot of compu-tational time so that this flow is not appropriate for the parametric study. In this section, the homogeneousturbulent shear flow with uniform shear and no solid boundary is simulated instead of the channel flow. Thisflow is considered the simplest flow to appropriately investigate the vortical structure generating the Reynolds
shear stress. The modulation of the turbulence production P, which is significant for the skin friction (Eq.8),is discussed by estimating P based on Eq.9 for the fluctuating velocity field.
The DNS of the bubbly flow is performed based on the method proposed by Kajishima et al.(2001) for therigid bubble or in the FTM for the deformable bubble. Governing equations for fluctuating velocity ui andpressure p consist of the mass and momentum conservation equation. In the tensor form, these normalizedequations for the rigid bubble flow are given by
∂ui
∂xi= 0, (11)
∂ui
∂t+ U1
∂ui
∂x1+ Sδi1u2 + uj
∂ui
∂xj=
∂
∂xj(−pδij + 2νSij) + Fpi, (12)
where S(= dU1/dx2) is the shear rate and U1 = (S(x2 − L2/2), 0, 0) is the mean velocity. S is set to 1. Thesize of the simulation domain is set to L1 × L2 × L3 = 1 × 1 × 1 divided by N1 × N2 × N3 = 64 × 64 × 64 or128 × 128 × 128 grid points, in the streamwise (x1), vertical (x2) and spanwise (x3) directions, respectively.There is no wall in the flow, thus the periodic boundary condition is imposed in the x1 and x3 directionsand the shear-periodic boundary condition (Gerz et al.,1989) in the x2 direction. Initial turbulence field israndomly given by the solenoidal velocity vector satisfying the prescribed three-dimensional energy spectrumE(k) shown by Gerz et al.(1989). Simulation parameters consist of the shear Reynolds number Re(= Sd2/ν),the initial root-mean-square (rms) of fluctuating velocity urms0 and the Weber number We(= ρLS2d3/σ) (onlyfor the deformable bubble). In both Re and We, Sd is used as the velocity scale. In order to determine thesimulation condition, the parameters in the previous experiments performed by Moriguchi and Kato (2002)and Oishi et al.(2003) are referred. The ranges of Re and urms0 are 581−2326 and 0.411−6.576, respectively.We is set to 5.0 or 11.5. The bubble diameter d and the number of bubbles Nb are set to 0.2 and 8, respectively.Correspondingly, the void fraction α0 is 3.35%. Initially, the simulation domain is divided into 8 cubic boxesand the bubble centroids are located at the center of these boxes. The time derivative of the turbulent kineticenergy E(= 〈uiui/2〉) for the rigid bubble flow is expressed as,
dE
dt= P − ε + 〈Fpiui〉 , (13)
where P(= −S〈u1u2〉) is the turbulence production and ε(= 2ν〈SijSij〉) the turbulence dissipation. Thelast term in the RHS of Eq.13 corresponds to the contribution of the bubble with no-slip boundary. In thefully developed state, the growth of E, P and ε is exponential in time. Scaled turbulence production P/E isdiscussed.
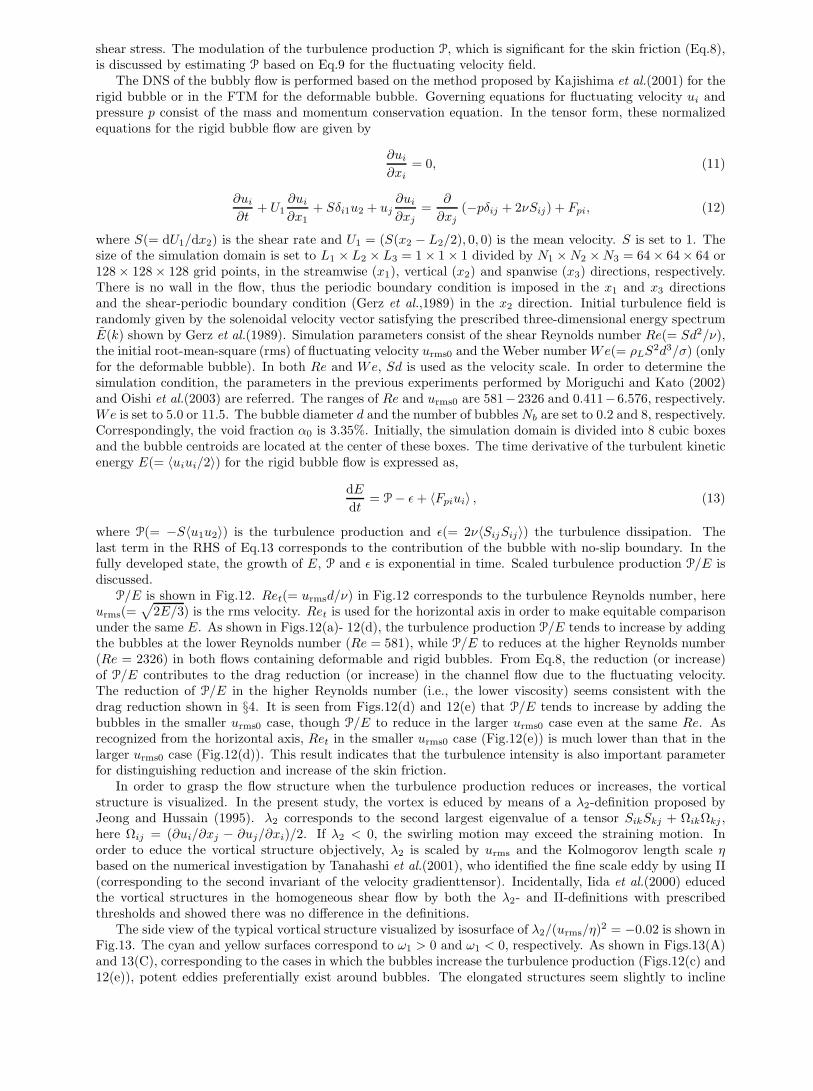
P/E is shown in Fig.12. Ret(= urmsd/ν) in Fig.12 corresponds to the turbulence Reynolds number, hereurms(=
√2E/3) is the rms velocity. Ret is used for the horizontal axis in order to make equitable comparison
under the same E. As shown in Figs.12(a)- 12(d), the turbulence production P/E tends to increase by addingthe bubbles at the lower Reynolds number (Re = 581), while P/E to reduces at the higher Reynolds number(Re = 2326) in both flows containing deformable and rigid bubbles. From Eq.8, the reduction (or increase)of P/E contributes to the drag reduction (or increase) in the channel flow due to the fluctuating velocity.The reduction of P/E in the higher Reynolds number (i.e., the lower viscosity) seems consistent with thedrag reduction shown in §4. It is seen from Figs.12(d) and 12(e) that P/E tends to increase by adding thebubbles in the smaller urms0 case, though P/E to reduce in the larger urms0 case even at the same Re. Asrecognized from the horizontal axis, Ret in the smaller urms0 case (Fig.12(e)) is much lower than that in thelarger urms0 case (Fig.12(d)). This result indicates that the turbulence intensity is also important parameterfor distinguishing reduction and increase of the skin friction.
In order to grasp the flow structure when the turbulence production reduces or increases, the vorticalstructure is visualized. In the present study, the vortex is educed by means of a λ2-definition proposed byJeong and Hussain (1995). λ2 corresponds to the second largest eigenvalue of a tensor SikSkj + ΩikΩkj ,here Ωij = (∂ui/∂xj − ∂uj/∂xi)/2. If λ2 < 0, the swirling motion may exceed the straining motion. Inorder to educe the vortical structure objectively, λ2 is scaled by urms and the Kolmogorov length scale ηbased on the numerical investigation by Tanahashi et al.(2001), who identified the fine scale eddy by using II(corresponding to the second invariant of the velocity gradienttensor). Incidentally, Iida et al.(2000) educedthe vortical structures in the homogeneous shear flow by both the λ2- and II-definitions with prescribedthresholds and showed there was no difference in the definitions.
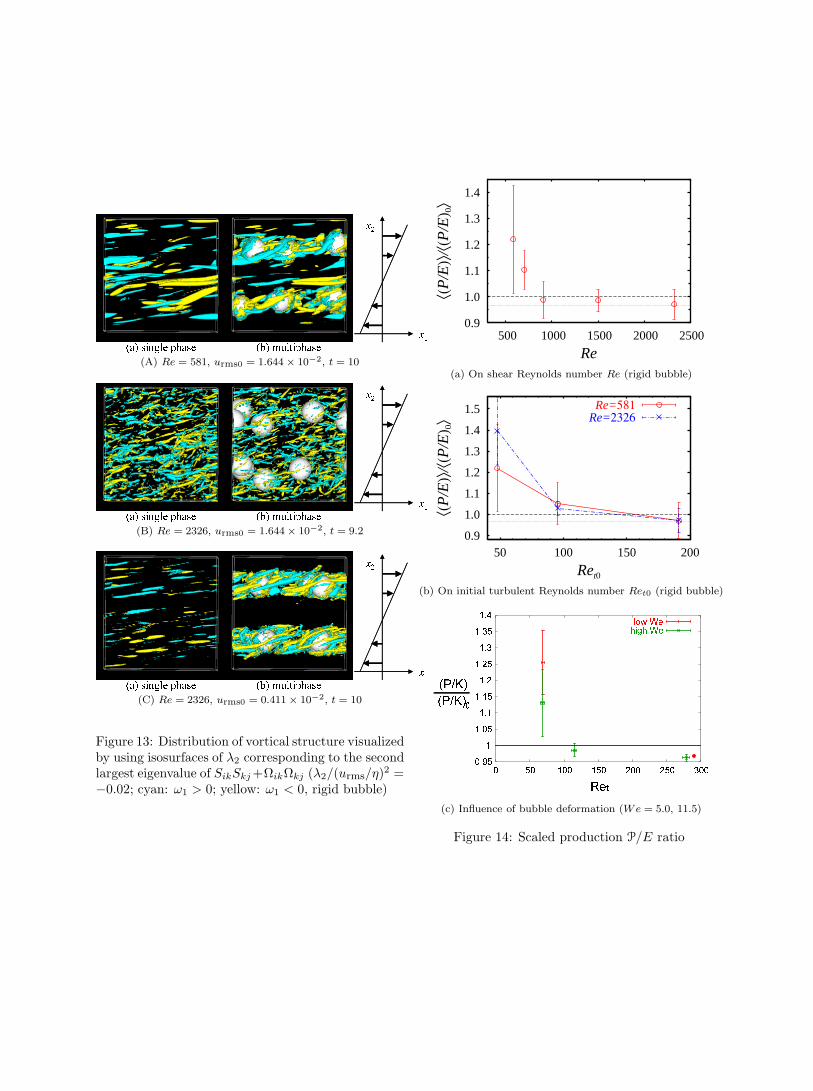
The side view of the typical vortical structure visualized by isosurface of λ2/(urms/η)2 = −0.02 is shown inFig.13. The cyan and yellow surfaces correspond to ω1 > 0 and ω1 < 0, respectively. As shown in Figs.13(A)and 13(C), corresponding to the cases in which the bubbles increase the turbulence production (Figs.12(c) and12(e)), potent eddies preferentially exist around bubbles. The elongated structures seem slightly to incline
from the x1-direction towards the x2-direction. Such an inclination of the vortical structure generates thenegative correlation between u1 and u2, contributing to the positive turbulence production. According toAdrian and Moin (1988) and Kida and Tanaka (1992), the Reynolds shear stress (i.e., P) is likely to takelarge value between pairs of counter rotating vortices. In Figs.13(A(b)) and 13(C(b)), the counter rotatingvortices, as drawn by different colors, are observed near the bubble. Indeed, we confirmed the preferentiallyorganized vortices contain quite large Reynolds shear stresses from the conditional sampling. The case ofFig.13(B) corresponds to that in which the bubbles decrease the turbulence production (Fig.12(d)). Theintegral length l is equivalent to that in Fig.13(C(b)), corresponding to l = 0.23. Unlike the cases at the lowerRe (Fig.13(A(b))) and the smaller urms0 (Fig.13(C(b))), it is seen from Fig.13(B(b)) that the preferentiallypotent eddies do not clearly observed around the bubble. The uniform distribution of the eddies indicates theReynolds shear stress is also uniformly distributed. Indeed, we confirmed that the x2−position of the bubbleand −u1u2, corresponding to the Reynolds stress averaged over x1x3−plane, are not well correlated. So far,we also performed computatitions based on the linear theory, corresponding to the rapid distortion theory(Lee et al., 1990), and confirmed that the nonlinear interaction among the small scale motion is essential forreducing the turbulence production. Moreover, the small scale motion to generate the Reynolds shear stress isconsiderably suppressed by the bubble containing no turbulence eddy when P/E reduces. From results of theuniform profile of −u1u2 in the liquid phase and the suppression of −u1u2 inside the bubble, the reduction ofP/E by adding the bubble is considered to be caused by decreasing the degree of freedom of the turbulencemotion.
The scaled production ratio 〈P/E〉/〈(P/E)0〉 is shown in Fig.14, here 〈(P/E)0〉 is for the single phase flow.From Figs.14(a) and 14(b), 〈P/E〉/〈(P/E)0〉 becomes smaller at the higher shear and turbulence Reynoldsnumbers. The result of 〈P/E〉/〈(P/E)0〉 > 1 at the lower Reynolds numbers is caused by the preferentiallyorganized vortices around the bubble as shown in Figs.13(A) and 13(C). The dotted line corresponds to theliquid volume fraction. Although the number of data is small, 〈P/E〉/〈(P/E)0〉 seems to approach the liquidvolume fraction at the higher Reynolds numbers. This result supports the hypothesis that the reduction ofP/E is caused by decreasing the degree of freedom of the turbulence motion if the turbulence introduced bythe bubble is small enough. Fig.14(c) shows the influence of the bubble deformation with different Webernumbers (We = 5.0, 11.5). At the lowest Reynolds number, 〈P/E〉 increases in both cases of We = 5.0 and11.5 by adding the bubble. The increase ratio is considerably smaller at the higher Weber number. Thisresult indicates that the deformation of bubbles suppresses the turbulence production. On the other hand,〈P/E〉 reduces at the higher Reynolds number in both Weber number cases. Unlike the cases at the lowerReynolds number, the influence of the Weber number is quite small on the decrease ratio of 〈P/E〉. For thedeformable bubble flow, 〈P/E〉/〈(P/E)0〉 also seems to approach the liquid volume fraction.
6 Conclusions
The progress of microbubble flow simulations for elucidating the drag reduction mechanism in our group issummarized. By using several simulation techniques such as the Eulerian-Lagrangian method, force couplingone and front tracking one, the following results are obtained.
• In a transient process of developing flows, the bubble dispersion contributes to the drag reduction, whilethe increase of the local velocity gradient around the bubble contributes to the drag increase. Althoughthe latter effect requires a lot of computational resources, it should be considered when investigatingthe drag reduction mechanism.
• In the low Reynolds number turbulence (Reτ < 200), the increase of the dissipation rate by the presenceof bubbles cannot be negligible so that the skin friction consequently tends to increase.
• At the friction Reynolds number higher than about 1000, the turbulence structure is globally modulatedto reduce the skin friction by the bubble motion. In the large eddy simulation at the friction Reynoldsnumber of Reτ = 1100 and the void fraction of 1%, the skin friction reduces in 2 − 3% as a result ofreducing the total dissipation rate. The drag reduction magnitude is comparable to the experimentalresult obtained by Moriguchi and Kato(2002) within a measurement error.
• From the homogeneous shear flow simulation, the Reynolds shear stress increases by adding the bubblewhen potent eddies are preferentially generated around bubbles, while it reduces when the bulk turbu-lence is large enough. When shear and turbulence Reynolds numbers and Weber number are large, theReynolds shear stress tends to be smaller, which may lead to the drag reduction.
References
Adrian, R.J. and Moin, P. (1988) Stochastic estimation of organized turbulent structure: homogeneous shear flow,J. Fluid Mech., 190, 531-559.
Batchelor, G.K. (1967) ’An Introduction to Fluid Dynamics,’ Chap. 4, Cambridge University Press.Ferrante, A. and Elghobashi, S., (2004) On the physical mechanisms of drag reduction in a spatially-developing
turbulent boundary layer laden with microbubbles, J. Fluid Mech., 503, 345-355.Gerz, T., Schumann, U. and Elghobashi, S.E. (1989) Direct simulation of stably stratified homogeneous turbulent
shear flows, J. Fluid Mech., 200, 563-594.Hinze, J.O. (1975) ’Turbulence,’ (2nd edition), Sec.5-7, McGraw-Hill.Iida, O, Iwatsuki, M. and Nagano, Y. (2000) Vortical turbulence structure and transport mechanism in a homoge-
neous shear flow, Phys. Fluids, 12, 2895-2905.Jeong, J. and Hussain, F. (1995) On the identification of a vortex, J. Fluid Mech., bf 285, 69-94.Kajishima, T., Takiguchi, S., Hamasaki, H. and Miyake, Y. (2001) Turbulence structure of particle-laden flow in a
vertical plane channel due to vortex shedding, JSME Int. J. Ser. B, 44, 526-535.Kawamura, T. and Kodama, Y. (2002) Numerical simulation method to resolve interactions between bubbles and
turbulence, Int. J. Heat and Fluid Flow, 23, 627-638.Kida, A. and Tanaka, M. (1992) Reynolds stress and vortical structure in a uniformly sheared turbulence, J. Phys.
Soc. Japan, 61, 4400-4417.Kitagawa, A., Hishida, K. and Kodama, Y. (2004) Two-phase turbulence structure in a microbubble channel flow,
Proc. of 5th Symp. on Smart Control of Turbulence, (The Univ. of Tokyo, Tokyo, Japan), 135-144.Lee, M.J., Kim, J. and Moin, P., (1990) Structure of turbulence at high shear rate, J. Fluid Mech., 216, 561-583.Lomholt, S, Stenum, B. and Maxey, M.R., (2002) Experimental verification of the force coupling method for
particulate flows, Int. J. Multiphase Flow, 28, 225.246.Lu, J., Fernandez, A. and Tryggvason, G., (2004) The effect of bubbles on the wall shear in a turbulent channel
flow, Phys. Fluids (submitted).Madavan, N.K., Deutsch, S. and Merkle, C.L. (1984) Reduction of turbulent skin friction by microbubbles, Phys.
Fluids, 27, 356-363.Maxey, M.R. and Patel, B.K. (2001) Localized force representations for particles sedimenting in Stokes flow, Int.
J. Multiphase Flow, 27, 1603-1626.McCormick, M.E. and Bhattacharyya, R. (1973) Drag reduction of a submersible hull by electrolysis, Naval Engi-
neers J., 85, 11-16.Moriguchi, Y., and Kato, H. (2002), Influence of microbubble diameter and distribution on frictional resistance
reduction, J. Mar. Sci. Technol., 7, 79-85.Murai, Y. and Matsumoto, Y. (1996) Numerical simulation of turbulent bubbly plumes using Eulerian-Lagrangian
bubbly flow model equations, Proc. of ASME FED, FED236, 67-74.Oishi, Y., Murai, Y., Ishikawa, M. and Yamamoto, F., (2003) PTV measurement of near-wall bubbly flow in a
horizontal channel, Proc. of Fluid Engineering Conference 2003, Japan Society of Mechanical Engineers, 1302 (CD-ROM, in Japanese).
Sugiyama, K., Kawamura, T., Takagi, S. and Matsumoto, Y. (2002) Numerical simulation on drag reductionmechanism by microbubbles, Proc. of 3rd Symp. on Smart Control of Turbulence, (The Univ. of Tokyo, Tokyo,Japan), 129-138.
Sugiyama, K., Kawamura, T., Takagi, S. and Matsumoto, Y. (2003) Numerical simulation of transient microbubbleflow, Proc. of 4th Symp. on Smart Control of Turbulence, (The Univ. of Tokyo, Tokyo, Japan), 51-60.
Sugiyama, K., Kawamura, T., Takagi, S. and Matsumoto, Y. (2004) The Reynolds number effect on the microbubbledrag reduction, Proc. of 5th Symp. on Smart Control of Turbulence, (The Univ. of Tokyo, Tokyo, Japan), 31-43.
Sugiyama, K., Takagi, S. and Matsumoto, Y. (2001) Multi-Scale analysis of bubbly flows, Computer Methods inApplied Mechanics and Engineering, 101, 689-704.
Tanahashi, M., Iwase, S. and Miyauchi, T. (2001) Appearance and alignment with strain rate of coherent fine scaleeddies in turbulent mixing layer, J. of Turbulence, 2, No. 006.
Unverdi, S.O. and Tryggvason, G. (1992) A front-tracking method for viscous, incompressible, multi-fluid flows, J.Comput. Phys., 100, 25-37.
Xu, J., Maxey, M.R. and Karniadakis, G.E. (2002) DNS of turbulent drag reduction using micro-bubbles, J. FluidMech. 468, 271-281.
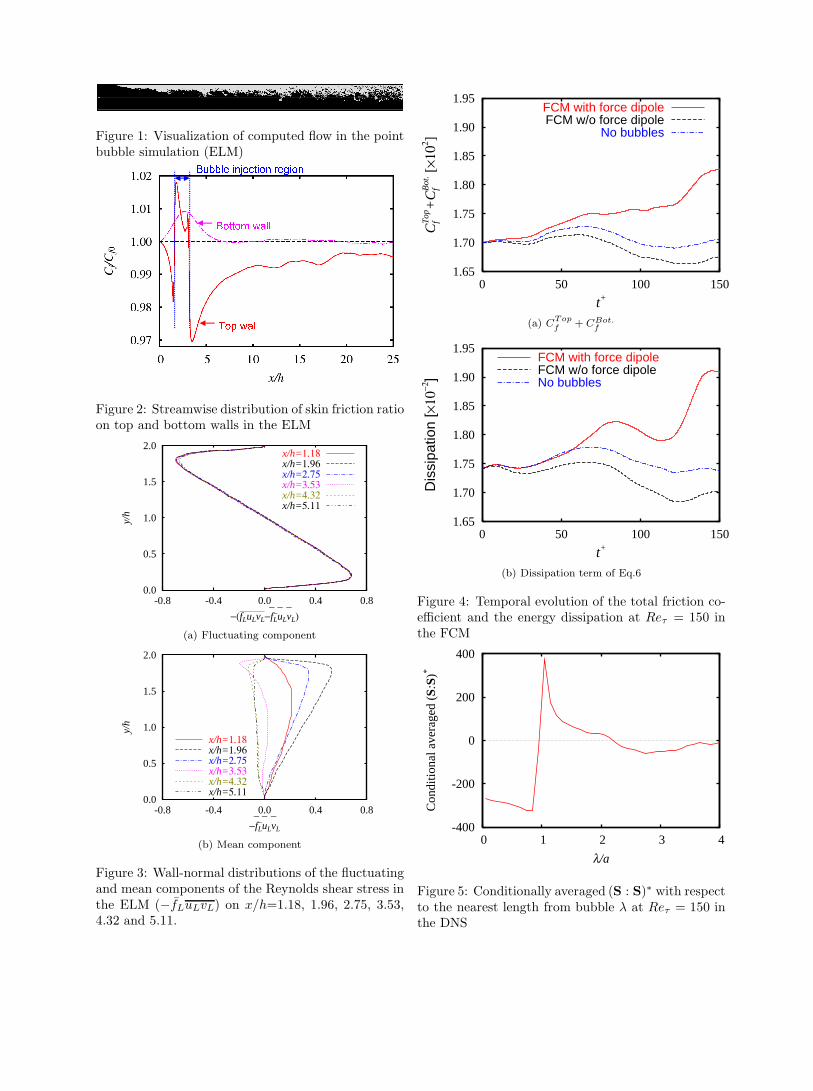
Figure 1: Visualization of computed flow in the pointbubble simulation (ELM)
Bubble injection region
Top wall
Bottom wall
Bubble injection region
Top wall
Bottom wall
Figure 2: Streamwise distribution of skin friction ratioon top and bottom walls in the ELM
0.0
0.5
1.0
1.5
2.0
-0.8 -0.4 0.0 0.4 0.8
y/h
−(fLuLvL−f–
L–u–
Lv–
L)
x/h=1.18x/h=1.96x/h=2.75x/h=3.53x/h=4.32x/h=5.11
(a) Fluctuating component
0.0
0.5
1.0
1.5
2.0
-0.8 -0.4 0.0 0.4 0.8
y/h
−f–
L–u–
Lv–
L
x/h=1.18x/h=1.96x/h=2.75x/h=3.53x/h=4.32x/h=5.11
(b) Mean component
Figure 3: Wall-normal distributions of the fluctuatingand mean components of the Reynolds shear stress inthe ELM (−fLuLvL) on x/h=1.18, 1.96, 2.75, 3.53,4.32 and 5.11.
1.65
1.70
1.75
1.80
1.85
1.90
1.95
0 50 100 150
CfT
op+
CfB
ot. [
×102 ]
t+
FCM with force dipoleFCM w/o force dipole
No bubbles
(a) CTopf + CBot.
f
1.65
1.70
1.75
1.80
1.85
1.90
1.95
0 50 100 150
Dis
sipa
tion
[×10
−2]
t+
FCM with force dipoleFCM w/o force dipoleNo bubbles
(b) Dissipation term of Eq.6
Figure 4: Temporal evolution of the total friction co-efficient and the energy dissipation at Reτ = 150 inthe FCM
-400
-200
0
200
400
0 1 2 3 4
Con
ditio
nal a
vera
ged
(S:S
)*
λ/a
Figure 5: Conditionally averaged (S : S)∗ with respectto the nearest length from bubble λ at Reτ = 150 inthe DNS
y+=200
y
x
Figure 6: Distribution of bubbles near the wall atReτ = 1100
0.94
0.96
0.98
1.00
1.02
0 500 1000 1500
Cf/C
f0
t+
Multiphase - top wall
Figure 7: Temporal evolution of the relative frictioncoefficient on the top wall at Reτ = 1100
0.80
0.85
0.90
0.95
1.00
0 1 2 3 4 5
Cf/C
f0
Void fraction [%]
PresentExp.
Figure 8: Relative friction coefficient vs. void fractionat Reτ = 1100 (•: Present; +: Moriguchi and Kato,2002)
-0.4
-0.2
0.0
0.2
1 10 100 1000V
eloc
ity d
iffe
renc
ey+
U+
Multiphase−U+
Single phase
0
5
10
15
20
25
U+
Multiphase-LiquidMultiphase-BubbleSingle phase
Figure 9: Mean velocity profile at Reτ = 1100
-1.0
-0.8
-0.6
-0.4
-0.2
0.0
1 10 100
Vel
ocity
dif
fere
nce
y+
U+
Multiphase−U+
Single phase
0
5
10
15
20
U+
Multiphase-LiquidMultiphase-BubbleSingle phase
Figure 10: Mean velocity profile at Reτ = 180
0.97
0.98
0.99
1.00
1.01
1.02
1.03
1.04
0 50 100 150 200 250
⟨S:S
⟩ L/⟨S
:S⟩ L0
t+
Reτ=180
(a) Reτ = 180
0.97
0.98
0.99
1.00
1.01
1.02
1.03
1.04
0 500 1000 1500
⟨S:S
⟩ L/⟨S
:S⟩ L0
t+
Reτ=1100
(a) Reτ = 1100
Figure 11: Time history of the total dissipation ratewith deformable bubbles
0.15
0.2
0.25
0.3
0.35
0.4
30 40 50 60 70 80 90 100
without bubble
with bubble
P/K
Ret
(a) Re = 581, We = 5.0, urms0 = 1.644 × 10⁻²
(deformable bubble)
0.15
0.2
0.25
0.3
0.35
0.4
150 200 250 300 350 400
without bubble
with bubble
P/K
Ret
(b) Re = 2326, We = 11.5, urms0 = 1.644 × 10⁻²
(deformable bubble)
0.15
0.2
0.25
0.3
0.35
0.4
30 40 50 60 70 80 90 100
P/K
Ret
without bubblewith bubble
(c) Re = 581, urms0 = 1.644 × 10⁻² (rigid bubble)
0.15
0.2
0.25
0.3
0.35
0.4
200 300 400 500 600
P/K
Ret
without bubblewith bubble
(d) Re = 2326, urms0 = 1.644 × 10⁻² (rigid bubble)
0.1
0.15
0.2
0.25
0.3
0.35
60 80 100 120 140 160 180 200
P/K
Ret
without bubblewith bubble
(e) Re = 2326, urms0 = 0.411 × 10⁻² (rigid bubble)
Figure 12: Scaled production P/E vs. turbulentReynolds number Ret
x1
x2
x1
x2
(a) single phase (b) multiphase
(A) Re = 581, urms0 = 1.644 × 10⁻², t = 10
x1
x2
x1
x2
(a) single phase (b) multiphase
(B) Re = 2326, urms0 = 1.644 × 10⁻², t = 9.2
x1
x2
x1
x2
(a) single phase (b) multiphase
(C) Re = 2326, urms0 = 0.411 × 10⁻², t = 10
Figure 13: Distribution of vortical structure visualizedby using isosurfaces of λ2 corresponding to the secondlargest eigenvalue of SikSkj +ΩikΩkj (λ2/(urms/η)2 =−0.02; cyan: ω1 > 0; yellow: ω1 < 0, rigid bubble)
0.9
1.0
1.1
1.2
1.3
1.4
500 1000 1500 2000 2500
⟨(P
/E)⟩
/⟨(P
/E) 0⟩
Re(a) On shear Reynolds number Re (rigid bubble)
0.9
1.0
1.1
1.2
1.3
1.4
1.5
50 100 150 200
⟨(P
/E)⟩
/⟨(P
/E) 0⟩
Ret0
Re=581Re=2326
(b) On initial turbulent Reynolds number Ret0 (rigid bubble)
0.95
1
1.05
1.1
1.15
1.2
1.25
1.3
1.35
1.4
0 50 100 150 200 250 300
low Wehigh We
Ret
(P/K)
(P/K)0
(c) Influence of bubble deformation (We = 5.0, 11.5)
Figure 14: Scaled production P/E ratio


![DBD plasma microbubble reactor for pre-treatment of … · DBD plasma microbubble reactor for pre-treatment of lignocellulosic biomass [poster] ... DBD plasma microbubble reactor](https://img.pdfslide.net/doc/110x75/5e4523a0e85b14090f08d100/dbd-plasma-microbubble-reactor-for-pre-treatment-of-dbd-plasma-microbubble-reactor.jpg)