Embed Size (px)
Citation preview
Biogeosciences, 12, 653–679, 2015
www.biogeosciences.net/12/653/2015/
doi:10.5194/bg-12-653-2015
© Author(s) 2015. CC Attribution 3.0 License.
Recent trends and drivers of regional sources and sinks of carbon
dioxide
S. Sitch1, P. Friedlingstein1, N. Gruber2, S. D. Jones3, G. Murray-Tortarolo1, A. Ahlström4, S. C. Doney5, H. Graven6,
C. Heinze7,8,9, C. Huntingford10, S. Levis11, P. E. Levy12, M. Lomas13, B. Poulter14, N. Viovy15, S. Zaehle16, N. Zeng17,
A. Arneth18, G. Bonan11, L. Bopp15, J. G. Canadell19, F. Chevallier15, P. Ciais15, R. Ellis10, M. Gloor20, P. Peylin15,
S. L. Piao21, C. Le Quéré3, B. Smith4, Z. Zhu22,23, and R. Myneni24
1University of Exeter, Exeter EX4 4QF, UK2Institute of Biogeochemistry and Pollutant Dynamics, ETH Zurich, Zurich, Switzerland3Tyndall Centre for Climate Change Research, University of East Anglia, Norwich NR4 7TJ, UK4Lund University, Department of Physical Geography and Ecosystem Science, Sölvegatan 12, 223 62 Lund, Sweden5Marine Chemistry and Geochemistry Department, Woods Hole Oceanographic Institution,
266 Woods Hole Road, Woods Hole, MA 02543, USA6Department of Physics and Grantham Institute for Climate Change, Imperial College London, London SW7 2AZ, UK7Geophysical Institute, University of Bergen, Bergen, Norway8Bjerknes Centre for Climate Research, Bergen, Norway9Uni Climate, Uni Research AS, Bergen, Norway10Centre for Ecology and Hydrology, Benson Lane, Wallingford OX10 8BB, UK11National Center for Atmospheric Research, Boulder, Colorado, USA12Centre for Ecology and Hydrology, Bush Estate, Penicuik, Midlothian EH26 0QB, UK13Department of Animal & Plant Sciences, University of Sheffield, Sheffield S10 2TN, UK14Institute on Ecosystems and Department of Ecology, Montana State University, Bozeman, MT 59717, USA15Laboratoire des Sciences du Climat et de l’Environnement, CEA CNRS UVSQ, 91191 Gif-sur-Yvette, France16Biogeochemical Integration Department, Max Planck Institute for Biogeochemistry,
P.O. Box 10 01 64, 07701 Jena, Germany17Department of Atmospheric and Oceanic Science, University of Maryland, College Park, MD 20740, USA18Karlsruhe Institute of Technology, Garmisch-Partenkirchen, Germany19Global Carbon Project, CSIRO Oceans and Atmosphere Flagship, Canberra, Australia20University of Leeds, School of Geography, Woodhouse Lane, Leeds LS9 2JT, UK21College of Urban and Environmental Sciences, Peking University, Beijing 100871, China22State Key Laboratory of Remote Sensing Science, Institute of Remote Sensing and Digital Earth,
Chinese Academy of Sciences, Beijing 100101, China23Center for Applications of Spatial Information Technologies in Public Health, Beijing 100101, China24Department of Geography and Environment, Boston University, 675 Commonwealth Avenue,
Boston, MA 02215, USA
Correspondence to: S. Sitch ([email protected])
Received: 21 November 2013 – Published in Biogeosciences Discuss.: 23 December 2013
Revised: 30 November 2014 – Accepted: 19 December 2014 – Published: 2 February 2015
Published by Copernicus Publications on behalf of the European Geosciences Union.
654 S. Sitch et al.: Recent trends and drivers of regional sources
Abstract. The land and ocean absorb on average just over
half of the anthropogenic emissions of carbon dioxide (CO2)
every year. These CO2 “sinks” are modulated by climate
change and variability. Here we use a suite of nine dynamic
global vegetation models (DGVMs) and four ocean biogeo-
chemical general circulation models (OBGCMs) to estimate
trends driven by global and regional climate and atmospheric
CO2 in land and oceanic CO2 exchanges with the atmo-
sphere over the period 1990–2009, to attribute these trends
to underlying processes in the models, and to quantify the
uncertainty and level of inter-model agreement. The mod-
els were forced with reconstructed climate fields and ob-
served global atmospheric CO2; land use and land cover
changes are not included for the DGVMs. Over the pe-
riod 1990–2009, the DGVMs simulate a mean global land
carbon sink of −2.4± 0.7 Pg C yr−1 with a small signifi-
cant trend of −0.06± 0.03 Pg C yr−2 (increasing sink). Over
the more limited period 1990–2004, the ocean models sim-
ulate a mean ocean sink of −2.2± 0.2 Pg C yr−1 with a
trend in the net C uptake that is indistinguishable from zero
(−0.01± 0.02 Pg C yr−2). The two ocean models that ex-
tended the simulations until 2009 suggest a slightly stronger,
but still small, trend of −0.02± 0.01 Pg C yr−2. Trends from
land and ocean models compare favourably to the land green-
ness trends from remote sensing, atmospheric inversion re-
sults, and the residual land sink required to close the global
carbon budget. Trends in the land sink are driven by increas-
ing net primary production (NPP), whose statistically sig-
nificant trend of 0.22± 0.08 Pg C yr−2 exceeds a significant
trend in heterotrophic respiration of 0.16± 0.05 Pg C yr−2 –
primarily as a consequence of widespread CO2 fertilisation
of plant production. Most of the land-based trend in simu-
lated net carbon uptake originates from natural ecosystems
in the tropics (−0.04± 0.01 Pg C yr−2), with almost no trend
over the northern land region, where recent warming and
reduced rainfall offsets the positive impact of elevated at-
mospheric CO2 and changes in growing season length on
carbon storage. The small uptake trend in the ocean mod-
els emerges because climate variability and change, and in
particular increasing sea surface temperatures, tend to coun-
teract the trend in ocean uptake driven by the increase in at-
mospheric CO2. Large uncertainty remains in the magnitude
and sign of modelled carbon trends in several regions, as well
as regarding the influence of land use and land cover changes
on regional trends.
1 Introduction
Soon after the first high-precision measurements of atmo-
spheric CO2 started in the late 1950s, it became clear that
the global-mean CO2 growth rate is substantially lower than
expected if all anthropogenic CO2 emissions remained in the
atmosphere (e.g. Keeling et al., 1976). The search for this
“missing” carbon and the identification of the processes driv-
ing carbon sinks has been one of the dominating questions
for carbon cycle research in the past decades (e.g. Tans et al.,
1990; Sarmiento and Gruber, 2002; and others). While much
progress has been achieved (e.g. Prentice et al., 2001; Sabine
et al., 2004; Denman et al., 2007; Le Quéré et al., 2009),
and estimates have converged considerably (Sweeney et al.,
2007; Khatiwala et al., 2013; Wanninkhof et al., 2013), the
spatial attribution of recent sink rates for the ocean and land,
and particularly their changes through time, remain uncer-
tain. To balance the global carbon budget, the combined sinks
by land and ocean must have increased over recent decades
(Keeling et al., 1995; Canadell et al., 2007; Raupach et al.,
2008; Sarmiento et al., 2010; Gloor et al., 2010; Ballantyne
et al., 2012). Sarmiento et al. (2010) showed that some of
the increasing sinks are driven by the ocean, but also iden-
tified an even more substantial increase in the net uptake by
the land biosphere between the 1980s and the 1990s. This in-
crease in the global land and ocean sink has been sustained
to date (Ballantyne et al., 2012).
There are several studies on the trends in carbon exchanges
at the regional level based on atmospheric CO2 observations
(top-down approach) (Angert et al., 2005; Buermann et al.,
2007; Chevallier et al., 2010; Sarmiento et al., 2010) and
changes in high-latitude greenness on land (Nemani et al.,
2003; Myneni et al., 1997) and changes in sea surface tem-
perature in the ocean (Park et al., 2010). Atmospheric CO2-
based top-down approaches provide large-scale constraints
on the land and ocean surface processes, but they cannot
unambiguously identify the underlying processes or the re-
gions driving these changes. Bottom-up studies using dy-
namic global vegetation models (DGVMs) or ocean biogeo-
chemical general circulation models (OBGCMs) mechanis-
tically represent many of the key land (Prentice et al., 2007)
and ocean processes (Le Quéré et al., 2005), and offer the
opportunity to investigate how changes in the structure and
functioning of land ecosystems and the ocean in response
to changing environmental conditions affect biogeochemi-
cal cycles. Therefore DGVMs and OBGCMs potentially al-
low for a more comprehensive analysis of surface carbon
trends and provide insight into possible mechanisms behind
regional trends in the carbon cycle.
There is a growing literature on regional carbon budgets
for different parts of the world (Ciais et al., 1995; Phillips
et al., 1998; Fan et al., 1998; Pacala et al., 2001; Janssens
et al., 2003; Stephens et al., 2007; Piao et al., 2009; Lewis
et al., 2009a; Ciais et al., 2010; Pan et al., 2011; Tjipu-
tra et al., 2010; Roy et al., 2011; Schuster et al., 2013;
Lenton et al., 2013), using bottom-up (inventory, carbon
cycle models) and top-down methodologies, although they
typically cover different time intervals. To date, no glob-
ally consistent attribution has been attempted for regional
sources and sinks of atmospheric CO2. This paper attempts
to fill this gap by combining top-down and bottom-up ap-
proaches discussed in the regional syntheses of the REgional
Biogeosciences, 12, 653–679, 2015 www.biogeosciences.net/12/653/2015/
S. Sitch et al.: Recent trends and drivers of regional sources 655
Carbon Cycle Assessment and Processes project (RECCAP;
Canadell et al., 2013) and by using factorial simulations to
elucidate the processes that drive trends in the sources and
sinks of atmospheric CO2.
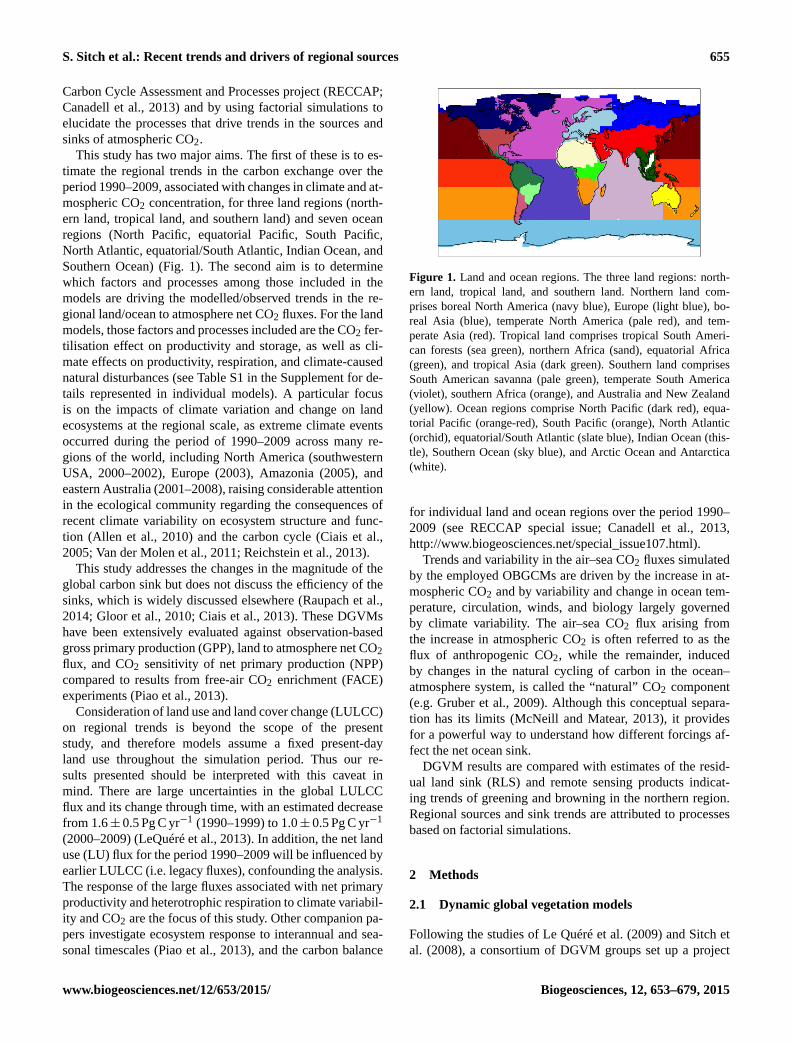
This study has two major aims. The first of these is to es-
timate the regional trends in the carbon exchange over the
period 1990–2009, associated with changes in climate and at-
mospheric CO2 concentration, for three land regions (north-
ern land, tropical land, and southern land) and seven ocean
regions (North Pacific, equatorial Pacific, South Pacific,
North Atlantic, equatorial/South Atlantic, Indian Ocean, and
Southern Ocean) (Fig. 1). The second aim is to determine
which factors and processes among those included in the
models are driving the modelled/observed trends in the re-
gional land/ocean to atmosphere net CO2 fluxes. For the land
models, those factors and processes included are the CO2 fer-
tilisation effect on productivity and storage, as well as cli-
mate effects on productivity, respiration, and climate-caused
natural disturbances (see Table S1 in the Supplement for de-
tails represented in individual models). A particular focus
is on the impacts of climate variation and change on land
ecosystems at the regional scale, as extreme climate events
occurred during the period of 1990–2009 across many re-
gions of the world, including North America (southwestern
USA, 2000–2002), Europe (2003), Amazonia (2005), and
eastern Australia (2001–2008), raising considerable attention
in the ecological community regarding the consequences of
recent climate variability on ecosystem structure and func-
tion (Allen et al., 2010) and the carbon cycle (Ciais et al.,
2005; Van der Molen et al., 2011; Reichstein et al., 2013).
This study addresses the changes in the magnitude of the
global carbon sink but does not discuss the efficiency of the
sinks, which is widely discussed elsewhere (Raupach et al.,
2014; Gloor et al., 2010; Ciais et al., 2013). These DGVMs
have been extensively evaluated against observation-based
gross primary production (GPP), land to atmosphere net CO2
flux, and CO2 sensitivity of net primary production (NPP)
compared to results from free-air CO2 enrichment (FACE)
experiments (Piao et al., 2013).
Consideration of land use and land cover change (LULCC)
on regional trends is beyond the scope of the present
study, and therefore models assume a fixed present-day
land use throughout the simulation period. Thus our re-
sults presented should be interpreted with this caveat in
mind. There are large uncertainties in the global LULCC
flux and its change through time, with an estimated decrease
from 1.6± 0.5 Pg C yr−1 (1990–1999) to 1.0± 0.5 Pg C yr−1
(2000–2009) (LeQuéré et al., 2013). In addition, the net land
use (LU) flux for the period 1990–2009 will be influenced by
earlier LULCC (i.e. legacy fluxes), confounding the analysis.
The response of the large fluxes associated with net primary
productivity and heterotrophic respiration to climate variabil-
ity and CO2 are the focus of this study. Other companion pa-
pers investigate ecosystem response to interannual and sea-
sonal timescales (Piao et al., 2013), and the carbon balance
Figure 1. Land and ocean regions. The three land regions: north-
ern land, tropical land, and southern land. Northern land com-
prises boreal North America (navy blue), Europe (light blue), bo-
real Asia (blue), temperate North America (pale red), and tem-
perate Asia (red). Tropical land comprises tropical South Ameri-
can forests (sea green), northern Africa (sand), equatorial Africa
(green), and tropical Asia (dark green). Southern land comprises
South American savanna (pale green), temperate South America
(violet), southern Africa (orange), and Australia and New Zealand
(yellow). Ocean regions comprise North Pacific (dark red), equa-
torial Pacific (orange-red), South Pacific (orange), North Atlantic
(orchid), equatorial/South Atlantic (slate blue), Indian Ocean (this-
tle), Southern Ocean (sky blue), and Arctic Ocean and Antarctica
(white).
for individual land and ocean regions over the period 1990–
2009 (see RECCAP special issue; Canadell et al., 2013,
http://www.biogeosciences.net/special_issue107.html).
Trends and variability in the air–sea CO2 fluxes simulated
by the employed OBGCMs are driven by the increase in at-
mospheric CO2 and by variability and change in ocean tem-
perature, circulation, winds, and biology largely governed
by climate variability. The air–sea CO2 flux arising from
the increase in atmospheric CO2 is often referred to as the
flux of anthropogenic CO2, while the remainder, induced
by changes in the natural cycling of carbon in the ocean–
atmosphere system, is called the “natural” CO2 component
(e.g. Gruber et al., 2009). Although this conceptual separa-
tion has its limits (McNeill and Matear, 2013), it provides
for a powerful way to understand how different forcings af-
fect the net ocean sink.
DGVM results are compared with estimates of the resid-
ual land sink (RLS) and remote sensing products indicat-
ing trends of greening and browning in the northern region.
Regional sources and sink trends are attributed to processes
based on factorial simulations.
2 Methods
2.1 Dynamic global vegetation models
Following the studies of Le Quéré et al. (2009) and Sitch et
al. (2008), a consortium of DGVM groups set up a project
www.biogeosciences.net/12/653/2015/ Biogeosciences, 12, 653–679, 2015
656 S. Sitch et al.: Recent trends and drivers of regional sources
to investigate further the spatial trends in land–atmosphere
flux and agreed to perform a factorial set of DGVM simu-
lations over the historical period, 1901–2009. These simula-
tions have contributed to the RECCAP activity (Canadell et
al., 2011, 2013). There are now a variety of DGVMs with ori-
gins in different research communities that typically contain
alternative parameterisations and a diverse inclusion of pro-
cesses (Prentice et al., 2007; Piao et al., 2013). DGVMs have
emerged from the land surface modelling (LSM), forest ecol-
ogy, global biogeography, and global biogeochemical mod-
elling communities. Representative of these research strands
are the following nine DGVMs, which are applied here: Hy-
land (Levy et al., 2004), JULES (Cox, 2001; Clark et al.,
2011), LPJ (Sitch et al., 2003), LPJ-GUESS (Smith et al.,
2001), NCAR-CLM4 (Thornton et al., 2007, 2009; Bonan
and Levis, 2010; Lawrence et al., 2011), ORCHIDEE (Krin-
ner et al., 2005), OCN (Zaehle and Friend, 2010), SDGVM
(Woodward et al., 1995; Woodward and Lomas, 2004), and
VEGAS (Zeng, 2003; Zeng et al., 2005). In this study we fo-
cus on two aspects of land surface modelling: the carbon and
the hydrological cycles. In the case of land surface models
coupled to GCMs, energy exchange between the land surface
and atmosphere is also simulated.
2.2 Ocean biogeochemical general circulation models
A total of four different groups have conducted the fac-
torial simulations over the analysis period with three-
dimensional OBGCMs and submitted their results to the
RECCAP archive. These are MICOM-HAMOCCv1 (BER)
(Assmann et al., 2010), CCSM-WHOI using CCSM3.1
(BEC) (Doney et al., 2009a, b), CCSM-ETH using CCSM3.0
(ETH) (Graven et al., 2012), and NEMO-PlankTOM5 (UEA)
(Buitenhuis et al., 2010). Details of the models are given
in the respective publications cited and in Table 2. Not all
model simulations are independent of each other, as sev-
eral of them share components. BEC and ETH employ the
same OBGCM, but differ in their spin-up and surface forc-
ing. The employed models have relatively similar horizontal
resolution of the order of 1 to 3◦ in longitude and latitude,
i.e. none of them is eddy-permitting or eddy-resolving. The
four ecosystem/biogeochemical models are also of compara-
ble complexity, i.e. including explicit descriptions of at least
one phytoplankton and zooplankton group, with some mod-
els considering up to three explicitly modelled groups for
phytoplankton and two for zooplankton. All models use the
same gas exchange parameterisation of Wanninkhof (1992),
although with different parameters. In particular, the ETH
model used a lower value for the gas exchange coefficient
than originally used in the CCSM standard configuration,
yielding a global-mean gas transfer velocity that is more than
25 % lower than those of the other models (Graven et al.,
2012). This reduction reflects the mounting evidence based
on radiocarbon analyses that the original global-mean gas
transfer velocity of Broecker et al. (1985) was too high (Pea-
cock, 2004; Sweeney et al., 2007; Müller et al., 2008).
2.3 Data sets
2.3.1 Land
Climate forcing is based on a merged product of Cli-
mate Research Unit (CRU) observed monthly 0.5◦ clima-
tology (v3.0, 1901–2009; New et al., 2000) and the high-
temporal-resolution NCEP reanalysis. The merged product
has a 0.5◦ spatial and 6 h temporal resolution. A coarse-
resolution 3.75◦× 2.5◦ version at monthly timescales was
also produced (see Table 1 for spatial resolution of individ-
ual DGVMs). Global atmospheric CO2 was derived from ice
core and NOAA monitoring station data, and provided at
annual resolution over the period 1860–2009. As land use
and land cover change was not simulated in these model
experiments, models assume a constant land use (invariant
agricultural coverage) throughout the simulation period. At-
mospheric nitrogen deposition data for CLM4CN and OCN
were sourced from Jean-Francois Lamarque (personal com-
munication, 2012) and Dentener et al. (2006), respectively.
Gridded fields of leaf area index (LAI) are used in the eval-
uation of DGVM northern greening trends. These LAI data
sets were based on remote sensing data and were generated
from the AVHRR GIMMS NDVI3g product using an artifi-
cial neural network (ANN)-derived model (Zhu et al., 2013).
The data set has a temporal resolution of 15 days over the
period 1981–2011, and a spatial resolution of 1/12◦.
2.3.2 Ocean
Unlike how the land models simulations were set up, no com-
mon climatic forcing data set was used for the ocean model
simulations. In fact, some models provided several simula-
tion results obtained with different climatic forcings. Models
were forced by the NCEP climatic data (Kalnay et al., 1996)
in their original form, or in the modified CORE (Common
Ocean-ice Reference Experiments – Corrected Normal Year
Forcing (CORE-CNYF; Large and Yeager, 2004)) form (Ta-
ble 2).
2.3.3 Atmospheric inversion
Simulated trends in land to atmospheric net CO2 flux are
compared with those from version 11.2 of the CO2 inver-
sion product from the Monitoring Atmospheric Composi-
tion and Climate – Interim Implementation (MACC-II) ser-
vice (http://copernicus-atmosphere.eu/). The horizontal res-
olution of the inversion is 3.75× 2.5 square degrees (longi-
tude× latitude), and weekly temporal resolution, with night-
time and daytime separated. The accuracy varies with the pe-
riod and the location over the globe, depending on the den-
sity and the information content of the assimilated data, and
usually decreases with increasing the resolution. Uncertainty
Biogeosciences, 12, 653–679, 2015 www.biogeosciences.net/12/653/2015/
S. Sitch et al.: Recent trends and drivers of regional sources 657
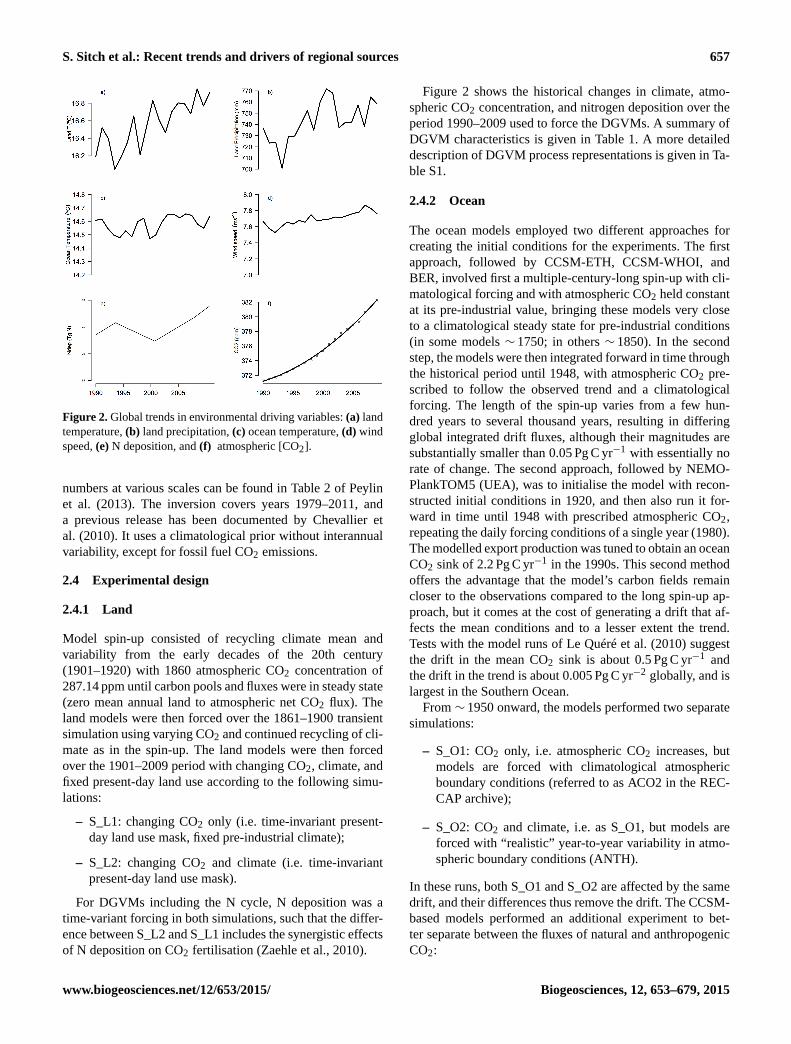
Figure 2. Global trends in environmental driving variables: (a) land
temperature, (b) land precipitation, (c) ocean temperature, (d) wind
speed, (e) N deposition, and (f) atmospheric [CO2].
numbers at various scales can be found in Table 2 of Peylin
et al. (2013). The inversion covers years 1979–2011, and
a previous release has been documented by Chevallier et
al. (2010). It uses a climatological prior without interannual
variability, except for fossil fuel CO2 emissions.
2.4 Experimental design
2.4.1 Land
Model spin-up consisted of recycling climate mean and
variability from the early decades of the 20th century
(1901–1920) with 1860 atmospheric CO2 concentration of
287.14 ppm until carbon pools and fluxes were in steady state
(zero mean annual land to atmospheric net CO2 flux). The
land models were then forced over the 1861–1900 transient
simulation using varying CO2 and continued recycling of cli-
mate as in the spin-up. The land models were then forced
over the 1901–2009 period with changing CO2, climate, and
fixed present-day land use according to the following simu-
lations:
– S_L1: changing CO2 only (i.e. time-invariant present-
day land use mask, fixed pre-industrial climate);
– S_L2: changing CO2 and climate (i.e. time-invariant
present-day land use mask).
For DGVMs including the N cycle, N deposition was a
time-variant forcing in both simulations, such that the differ-
ence between S_L2 and S_L1 includes the synergistic effects
of N deposition on CO2 fertilisation (Zaehle et al., 2010).
Figure 2 shows the historical changes in climate, atmo-
spheric CO2 concentration, and nitrogen deposition over the
period 1990–2009 used to force the DGVMs. A summary of
DGVM characteristics is given in Table 1. A more detailed
description of DGVM process representations is given in Ta-
ble S1.
2.4.2 Ocean
The ocean models employed two different approaches for
creating the initial conditions for the experiments. The first
approach, followed by CCSM-ETH, CCSM-WHOI, and
BER, involved first a multiple-century-long spin-up with cli-
matological forcing and with atmospheric CO2 held constant
at its pre-industrial value, bringing these models very close
to a climatological steady state for pre-industrial conditions
(in some models ∼ 1750; in others ∼ 1850). In the second
step, the models were then integrated forward in time through
the historical period until 1948, with atmospheric CO2 pre-
scribed to follow the observed trend and a climatological
forcing. The length of the spin-up varies from a few hun-
dred years to several thousand years, resulting in differing
global integrated drift fluxes, although their magnitudes are
substantially smaller than 0.05 Pg C yr−1 with essentially no
rate of change. The second approach, followed by NEMO-
PlankTOM5 (UEA), was to initialise the model with recon-
structed initial conditions in 1920, and then also run it for-
ward in time until 1948 with prescribed atmospheric CO2,
repeating the daily forcing conditions of a single year (1980).
The modelled export production was tuned to obtain an ocean
CO2 sink of 2.2 Pg C yr−1 in the 1990s. This second method
offers the advantage that the model’s carbon fields remain
closer to the observations compared to the long spin-up ap-
proach, but it comes at the cost of generating a drift that af-
fects the mean conditions and to a lesser extent the trend.
Tests with the model runs of Le Quéré et al. (2010) suggest
the drift in the mean CO2 sink is about 0.5 Pg C yr−1 and
the drift in the trend is about 0.005 Pg C yr−2 globally, and is
largest in the Southern Ocean.
From ∼ 1950 onward, the models performed two separate
simulations:
– S_O1: CO2 only, i.e. atmospheric CO2 increases, but
models are forced with climatological atmospheric
boundary conditions (referred to as ACO2 in the REC-
CAP archive);
– S_O2: CO2 and climate, i.e. as S_O1, but models are
forced with “realistic” year-to-year variability in atmo-
spheric boundary conditions (ANTH).
In these runs, both S_O1 and S_O2 are affected by the same
drift, and their differences thus remove the drift. The CCSM-
based models performed an additional experiment to bet-
ter separate between the fluxes of natural and anthropogenic
CO2:
www.biogeosciences.net/12/653/2015/ Biogeosciences, 12, 653–679, 2015
658 S. Sitch et al.: Recent trends and drivers of regional sources
Table 1. Characteristics of the nine dynamic global vegetation models.
Model name Abbreviation Spatial Land surface Full nitrogen River export Fire Harvest/grazing Source
resolution model cycle flux simulation flux
Community Land CLM4CN 0.5◦× 0.5◦ Yes Yes No Yes No Oleson et al. (2010);
Model 4CN Lawrence et al. (2011)
Hyland HYL 3.75◦× 2.5◦ No No No No Yes Friend et al. (1997);
Levy et al. (2004)
Lund–Potsdam–Jena LPJ 0.5◦× 0.5◦ No No No Yes Yes Sitch et al. (2003)
LPJ-GUESS LPJ-GUESS 0.5◦× 0.5◦ No No No Yes No Smith et al. (2001)
ORCHIDEE-CN OCN 3.75◦× 2.5◦ Yes Yes No No Yes Zaehle and Friend (2010);
Zaehle et al. (2010)
ORCHIDEE ORC 0.5◦× 0.5◦ Yes No No No No Krinner et al. (2005)
Sheffield-DGVM SDGVM 3.75◦× 2.5◦ No No Yes Yes No Woodward et al. (1995)
TRIFFID TRI 3.75◦× 2.5◦ Yes No No No No Cox (2001)
VEGAS VEGAS 0.5◦× 0.5◦ Yes No Yes Yes Yes Zeng et al. (2005)
Table 2. Characteristics of the four ocean biogeochemical general circulation models (OBGCMs). All include NPZD-type ecosystem models
and N, P, Si, and Fe nutrient components.
Model name Abbreviation Spatial resolution Meteorological Gas transfer Years used Source
forcing formulation
MICOM-HAMOCCv1 BER 2.4◦× 0.8−2.4◦ NCEP Wanninkhof (1992) 1990 to 2009 Assmann et al. (2010)
CCSM-WHOI BEC 3.6◦× 0.8−1.8◦ NCEP Wanninkhof (1992) 1990 to 2009 Doney et al. (2009a, b)
CCSM-ETH ETH 3.6◦× 0.9× 1.9◦ CORE Wanninkhof (1992) 1990 to 2007 Graven et al. (2012)
NEMO-PlankTOM5 UEA 2◦× 0.5−2◦ NCEP Wanninkhof (1992) 1990 to 2009 Buitenhuis et al. (2010)
– S_O3: pre-industrial CO2 and climate, i.e. atmospheric
CO2 is fixed at its pre-industrial level, but atmospheric
boundary conditions vary as in S_O2 (PIND).
From these simulations, only the results from 1990 through
to 2009 were analysed. Only the UEA and CCSM-WHOI
models made results available for the S_O1 and S_O2 simu-
lations for the entire analysis time. The results for the BER
model for 2009 are incomplete, and the CCSM-ETH simula-
tions extend only to 2007. In order to maintain a sufficiently
large set of models, we decided to focus our analysis primar-
ily on the 1990–2004 period, but occasionally also include
the results through to 2009, with the important caveat that
the latter are based only on two models.
2.5 Output variables
2.5.1 Land
In this study we focus primarily on the simulated carbon cy-
cle variables, net NPP, RH (heterotrophic respiration), and
LAI, a measure of vegetation greenness. The land to atmo-
sphere net CO2 flux is
land to atmosphere netCO2 flux=−NBP
= RH+wildfire flux riverine C flux+ harvest−NPP,
where we have adopted the atmospheric perspective with re-
gard to the sign of the fluxes, i.e. negative numbers indicate
a sink for atmospheric CO2 and a negative trend indicates an
increasing sink or a decreasing source.
DGVMs typically do not represent all these processes; a
list for each individual DGVM is given in Table 1. DGVM
results for simulation S_L2 are compared against the global
RLS, calculated as the annual anthropogenic CO2 emissions
(fossil fuel, cement manufacture, and land use C flux) mi-
nus the annual CO2 growth rate and model mean ocean C
sink as given by Friedlingstein et al. (2010). The ocean up-
take is from the same OGGCMs as the ones used here, and
the land use C flux is based on a book-keeping approach from
Houghton (2010). Note the RLS depends on a LULCC model
of emissions (the one of Houghton). Strictly speaking, com-
parison of model land to atmosphere net CO2 flux with RLS
is therefore inconsistent because these models treat areas af-
fected by LUC as pristine ecosystems, and these areas are
generally associated with a high land carbon sinks. Simulated
net carbon flux from S2 is therefore likely to overestimate the
RLS sink, by construction.
The regional analysis will focus on three large land regions
(Fig. 1), and within these regions, trends at a finer spatial res-
olution, from multi-grid-cell to the sub-region, are analysed.
The comparison of DGVM simulated trends in the north-
ern growing season against satellite-derived NDVI (nor-
malised difference vegetation index) observations was based
on eight models (JULES, LPJ, LPJ-GUESS, NCAR-CLM4,
ORCHIDEE, OCN, SDGVM, VEGAS), which provided
LAI outputs. The means and trends in the onset, end, and
length of growing season were computed. Growing season
variables were calculated using the methodology of Murray-
Tortarolo et al. (2013). Leaf onset is defined as the day when
LAI begins to increase above a critical threshold (CT), de-
fined as
CT= LAImin+ 0.2 · (LAImax−LAImin),
Biogeosciences, 12, 653–679, 2015 www.biogeosciences.net/12/653/2015/
S. Sitch et al.: Recent trends and drivers of regional sources 659
where LAImin and LAImax represent the minimum and max-
imum LAI over the annual cycle. Similarly, leaf senescence,
or offset, or end of growing season, is defined as the day
when LAI decreases below the CT. The length of the grow-
ing season in days is calculated as the end minus the onset.
This calculation was made for each grid cell above 30◦ N
(i.e. northern extratropics) from the models and the satellite
data. In addition, any grid cell where LAI varied by less than
0.5 over the annual cycle from the satellite data was consid-
ered to be predominantly evergreen (e.g. boreal forest), and
thus excluded from the analysis. We also masked out regions
where LAI decreases in the summer (drought deciduous veg-
etation). In addition, when the growing season spans over the
end of year (e.g. Mediterranean and some pixels particularly
on the southern margin of the domain), we include the first 3
months of the second year in our analysis. Means and trends
were calculated using a linear model over the period 1990–
2009.
2.5.2 Ocean
The modelling groups provided output on a monthly basis
for the years 1990 through to 2004 and 2009 at two levels
of priority. Tier-one data included the surface ocean fields of
the air–sea CO2 flux, oceanic pCO2, dissolved inorganic car-
bon (DIC), alkalinity (Alk), temperature (T ), salinity (S), and
mixed layer depth. The second-tier data included the biologi-
cal export at 100 m, the vertically integrated net primary pro-
duction, and the surface chlorophyll a concentration. Some
models also supplied three-dimensional climatological fields
of DIC, Alk, T , and S.
To determine the different factors contributing to the mod-
elled trends and variations, we undertook two (linear) sepa-
rations:
– The contribution of climate variability and change on
the ocean carbon cycle: X_var=X(S_O2)−X(S_O1),
X is any variable or flux, where the expression in paren-
theses represents the results of the corresponding sim-
ulation, and X_var represents the impact of climate
change and variability on the ocean carbon cycle.
– The contribution of anthropogenic CO2:
X_ant=X(S_O2)−X(S_O3).
For each of the integrations, but particularly for the changing
CO2 and climate simulation S_O2, we analysed the factors
contributing to the temporal change in the air–sea CO2 flux
F by a linear Taylor expansion (see e.g. Lovenduski et al.,
2007 and Doney et al., 2009a):
1F = ∂F/∂ws ·1ws+ ∂F/∂T ·1T + ∂F/∂ice
·1ice+ ∂F/∂sDIC ·1sDIC
+ ∂F/∂sAlk ·1sAlk+ ∂F/∂FS ·1S,
where ws is the wind speed, ice is the sea-ice fraction, sDIC
and sAlk are the salinity normalised DIC and Alk concentra-
tions, and ∂F/∂FS is the change in the air–sea CO2 flux in re-
sponse to freshwater fluxes. This latter term includes not only
the sensitivity of oceanic pCO2 to changes in salinity but also
the dilution effects of freshwater on DIC and Alk (see Doney
et al., 2009a, for details). The partial derivatives were com-
puted directly from the model equations for the mean condi-
tions in each region. The changes in the driving components
were derived from the trend computed via a linear regression
of the model results and then multiplied by the length of the
time series.
3 Results
3.1 Global Trends
3.1.1 Land
The ensemble mean global land to atmosphere net carbon
dioxide flux from S_L2 is −2.38± 0.72 Pg C yr−1 over the
period 1990–2009 (P = 0.04, where P is the probability of a
trend statistically indistinguishable from zero; a significance
level of 0.05 is selected) (Fig. 3, Fig. S1 in the Supplement,
Table 3). The numbers behind ± signs are the 1 standard de-
viation of 20-year means for nine DGVMs. This compares
to the global RLS of −2.45± 1.17 Pg C yr−1, inferred from
the global carbon budget by Friedlingstein et al. (2010) over
the same period. All DGVMs agree on an increasing land
sink with a net flux trend over this period ranging between
−0.02 and −0.11 Pg C yr−2, corresponding to the OCN and
Hyland DGVMs, respectively (Table 3). DGVMs simulate
an increase in the land C sink with an ensemble mean trend
of −0.06± 0.03 Pg C yr−2 (P < 0.05) over the period 1990–
2009 (Table 3) in response to changes in climate and atmo-
spheric CO2 content. The two DGVMs with a fully cou-
pled carbon and nitrogen cycle (CN) also simulate an in-
crease in the land sink, at −0.02 (P = 0.6) for OCN and
−0.05 Pg C yr−2 (P = 0.06) for CLM4CN. DGVMs suggest
the increase in global land sink between 1990 and 2009 is
driven by increases in simulated global NPP (Fig. 3).
DGVMs simulate an ensemble mean global NPP of
62.9± 8.73 Pg C yr−1 over the period 1990–2009 (Table 3).
All DGVMs simulate an increase in NPP over this pe-
riod, with an ensemble mean DGVM trend in NPP of
0.22± 0.08 Pg C yr−2 (P = 0.00) (Table 3). Models with a
higher NPP trend also produce a higher land to atmosphere
net CO2 flux trend (Fig. S2 in the Supplement). The ensem-
ble mean NPP trend of 0.22± 0.08 Pg C yr−2 (P < 0.01) from
simulation S_L2 (CO2 and climate forcing) contrasts with
an ensemble trend of 0.19± 0.08 Pg C yr−2 (P < 0.01) and
0.03± 0.05 Pg C yr−2 (P = 0.24) over the same period for
the S_L1 (CO2 only) and S_L2–S_L1 (the climate effect),
respectively (Tables S2, S3 in the Supplement). These re-
sults suggest that the simulated increase in global NPP is
mainly in response to increasing atmospheric CO2 (direct
www.biogeosciences.net/12/653/2015/ Biogeosciences, 12, 653–679, 2015
660 S. Sitch et al.: Recent trends and drivers of regional sources
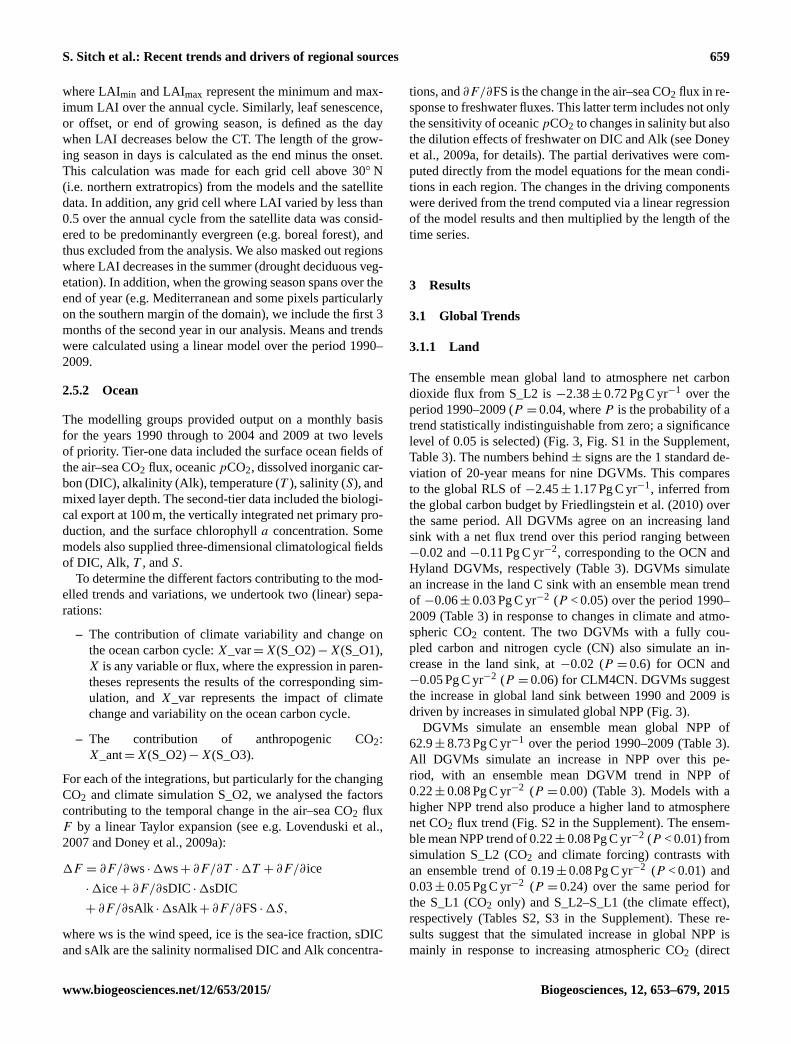
Figure 3. Global trends in ensemble land model responses.
(a) DGVM mean model land to atmosphere net CO2 flux and stan-
dard deviation (grey lines); (b) component fluxes, NPP; and (c) RH
(=RH+wildfire+ riverine C flux); and (d) remotely sensed trends
in annual mean NDVI (crosses), a measure of vegetation greenness,
and a linear regression through the data points (bold line).
CO2 fertilisation of photosynthesis, in addition to the indirect
benefits from an improved water balance in water-limited
ecosystems due to the physiological effects of CO2 on wa-
ter use efficiency). VEGAS, CLM4CN, and OCN simulate
the smallest positive trends in NPP among the DGVMs in re-
sponse to elevated CO2 forcing (Table S2). This suggests that
the potential CO2 fertilisation effect may be already strongly
limited by present-day nitrogen availability in some ecosys-
tems (Vitousek and Howarth, 1991). There is more uncer-
tainty among models on the impact of climate changes on
global NPP, with only two models simulating a significant
positive trend (Table S3).
DGVMs simulate an ensemble mean global RH of
57.5± 9.8 Pg C yr−1 over the period 1990–2009 (Table 3).
All DGVMs simulate an increase in RH for S_L2
(CO2 and climate), with an ensemble mean trend of
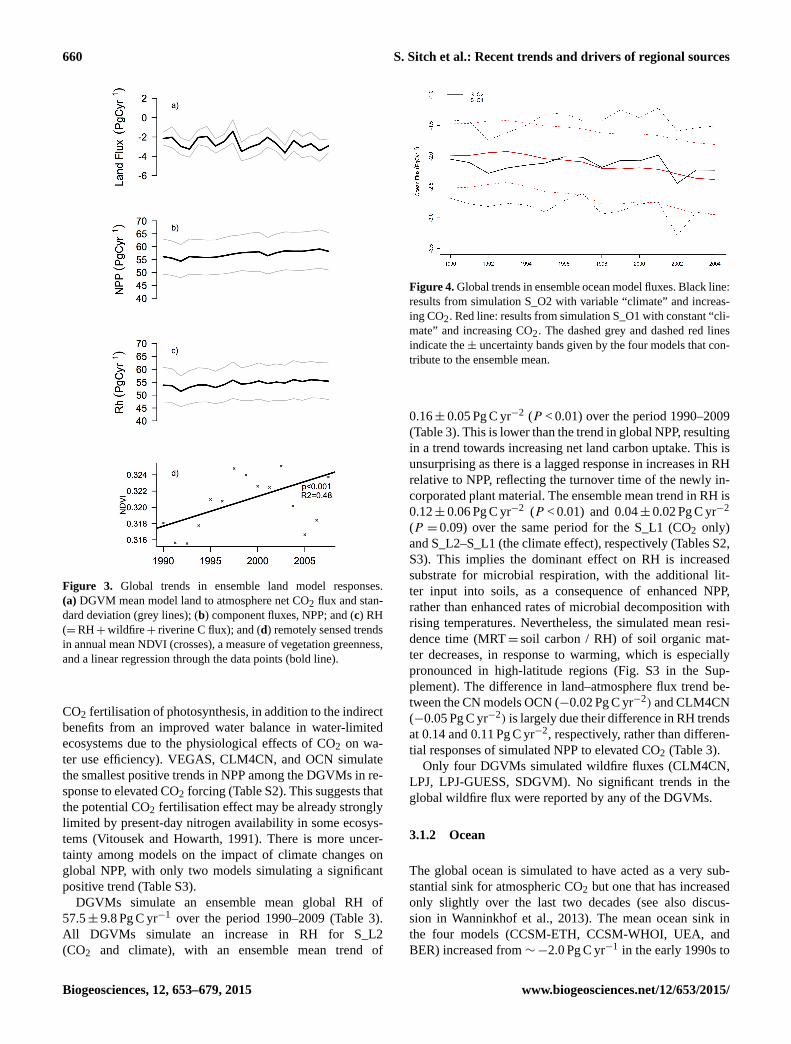
Figure 4. Global trends in ensemble ocean model fluxes. Black line:
results from simulation S_O2 with variable “climate” and increas-
ing CO2. Red line: results from simulation S_O1 with constant “cli-
mate” and increasing CO2. The dashed grey and dashed red lines
indicate the ± uncertainty bands given by the four models that con-
tribute to the ensemble mean.
0.16± 0.05 Pg C yr−2 (P < 0.01) over the period 1990–2009
(Table 3). This is lower than the trend in global NPP, resulting
in a trend towards increasing net land carbon uptake. This is
unsurprising as there is a lagged response in increases in RH
relative to NPP, reflecting the turnover time of the newly in-
corporated plant material. The ensemble mean trend in RH is
0.12± 0.06 Pg C yr−2 (P < 0.01) and 0.04± 0.02 Pg C yr−2
(P = 0.09) over the same period for the S_L1 (CO2 only)
and S_L2–S_L1 (the climate effect), respectively (Tables S2,
S3). This implies the dominant effect on RH is increased
substrate for microbial respiration, with the additional lit-
ter input into soils, as a consequence of enhanced NPP,
rather than enhanced rates of microbial decomposition with
rising temperatures. Nevertheless, the simulated mean resi-
dence time (MRT= soil carbon / RH) of soil organic mat-
ter decreases, in response to warming, which is especially
pronounced in high-latitude regions (Fig. S3 in the Sup-
plement). The difference in land–atmosphere flux trend be-
tween the CN models OCN (−0.02 Pg C yr−2) and CLM4CN
(−0.05 Pg C yr−2) is largely due their difference in RH trends
at 0.14 and 0.11 Pg C yr−2, respectively, rather than differen-
tial responses of simulated NPP to elevated CO2 (Table 3).
Only four DGVMs simulated wildfire fluxes (CLM4CN,
LPJ, LPJ-GUESS, SDGVM). No significant trends in the
global wildfire flux were reported by any of the DGVMs.
3.1.2 Ocean
The global ocean is simulated to have acted as a very sub-
stantial sink for atmospheric CO2 but one that has increased
only slightly over the last two decades (see also discus-
sion in Wanninkhof et al., 2013). The mean ocean sink in
the four models (CCSM-ETH, CCSM-WHOI, UEA, and
BER) increased from ∼−2.0 Pg C yr−1 in the early 1990s to
Biogeosciences, 12, 653–679, 2015 www.biogeosciences.net/12/653/2015/
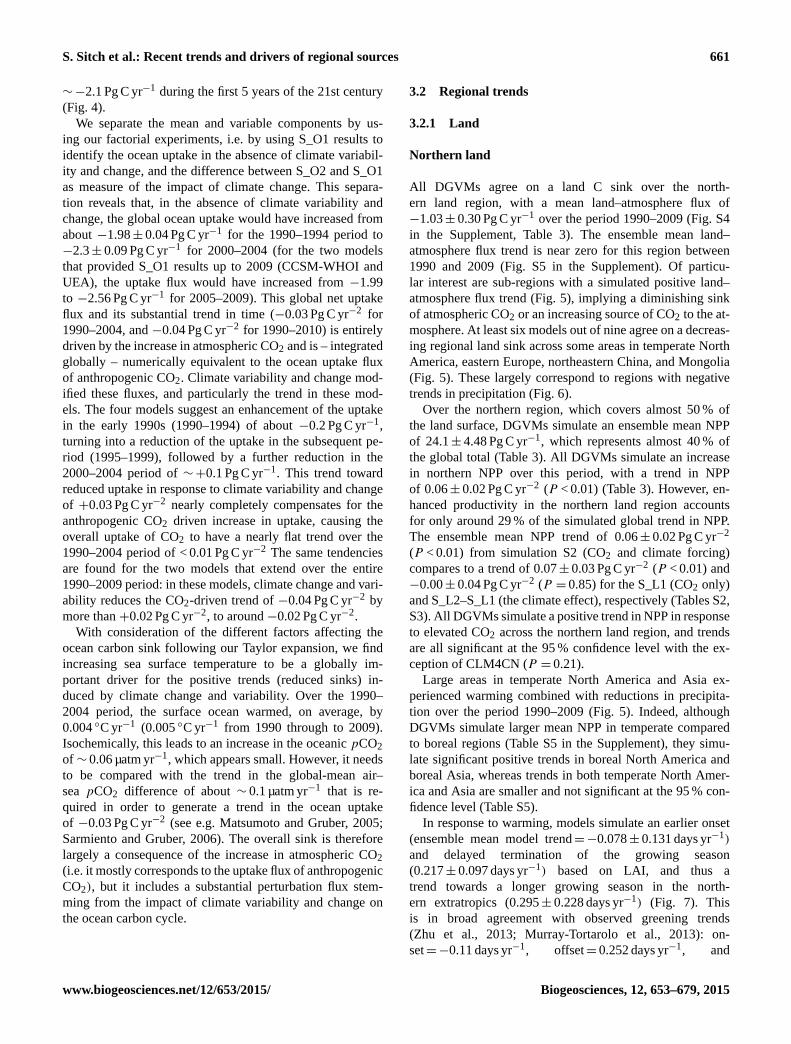
S. Sitch et al.: Recent trends and drivers of regional sources 661
∼−2.1 Pg C yr−1 during the first 5 years of the 21st century
(Fig. 4).
We separate the mean and variable components by us-
ing our factorial experiments, i.e. by using S_O1 results to
identify the ocean uptake in the absence of climate variabil-
ity and change, and the difference between S_O2 and S_O1
as measure of the impact of climate change. This separa-
tion reveals that, in the absence of climate variability and
change, the global ocean uptake would have increased from
about −1.98± 0.04 Pg C yr−1 for the 1990–1994 period to
−2.3± 0.09 Pg C yr−1 for 2000–2004 (for the two models
that provided S_O1 results up to 2009 (CCSM-WHOI and
UEA), the uptake flux would have increased from −1.99
to −2.56 Pg C yr−1 for 2005–2009). This global net uptake
flux and its substantial trend in time (−0.03 Pg C yr−2 for
1990–2004, and −0.04 Pg C yr−2 for 1990–2010) is entirely
driven by the increase in atmospheric CO2 and is – integrated
globally – numerically equivalent to the ocean uptake flux
of anthropogenic CO2. Climate variability and change mod-
ified these fluxes, and particularly the trend in these mod-
els. The four models suggest an enhancement of the uptake
in the early 1990s (1990–1994) of about −0.2 Pg C yr−1,
turning into a reduction of the uptake in the subsequent pe-
riod (1995–1999), followed by a further reduction in the
2000–2004 period of ∼+0.1 Pg C yr−1. This trend toward
reduced uptake in response to climate variability and change
of +0.03 Pg C yr−2 nearly completely compensates for the
anthropogenic CO2 driven increase in uptake, causing the
overall uptake of CO2 to have a nearly flat trend over the
1990–2004 period of < 0.01 Pg C yr−2 The same tendencies
are found for the two models that extend over the entire
1990–2009 period: in these models, climate change and vari-
ability reduces the CO2-driven trend of −0.04 Pg C yr−2 by
more than +0.02 Pg C yr−2, to around −0.02 Pg C yr−2.
With consideration of the different factors affecting the
ocean carbon sink following our Taylor expansion, we find
increasing sea surface temperature to be a globally im-
portant driver for the positive trends (reduced sinks) in-
duced by climate change and variability. Over the 1990–
2004 period, the surface ocean warmed, on average, by
0.004 ◦C yr−1 (0.005 ◦C yr−1 from 1990 through to 2009).
Isochemically, this leads to an increase in the oceanic pCO2
of ∼ 0.06 µatm yr−1, which appears small. However, it needs
to be compared with the trend in the global-mean air–
sea pCO2 difference of about ∼ 0.1 µatm yr−1 that is re-
quired in order to generate a trend in the ocean uptake
of −0.03 Pg C yr−2 (see e.g. Matsumoto and Gruber, 2005;
Sarmiento and Gruber, 2006). The overall sink is therefore
largely a consequence of the increase in atmospheric CO2
(i.e. it mostly corresponds to the uptake flux of anthropogenic
CO2), but it includes a substantial perturbation flux stem-
ming from the impact of climate variability and change on
the ocean carbon cycle.
3.2 Regional trends
3.2.1 Land
Northern land
All DGVMs agree on a land C sink over the north-
ern land region, with a mean land–atmosphere flux of
−1.03± 0.30 Pg C yr−1 over the period 1990–2009 (Fig. S4
in the Supplement, Table 3). The ensemble mean land–
atmosphere flux trend is near zero for this region between
1990 and 2009 (Fig. S5 in the Supplement). Of particu-
lar interest are sub-regions with a simulated positive land–
atmosphere flux trend (Fig. 5), implying a diminishing sink
of atmospheric CO2 or an increasing source of CO2 to the at-
mosphere. At least six models out of nine agree on a decreas-
ing regional land sink across some areas in temperate North
America, eastern Europe, northeastern China, and Mongolia
(Fig. 5). These largely correspond to regions with negative
trends in precipitation (Fig. 6).
Over the northern region, which covers almost 50 % of
the land surface, DGVMs simulate an ensemble mean NPP
of 24.1± 4.48 Pg C yr−1, which represents almost 40 % of
the global total (Table 3). All DGVMs simulate an increase
in northern NPP over this period, with a trend in NPP
of 0.06± 0.02 Pg C yr−2 (P < 0.01) (Table 3). However, en-
hanced productivity in the northern land region accounts
for only around 29 % of the simulated global trend in NPP.
The ensemble mean NPP trend of 0.06± 0.02 Pg C yr−2
(P < 0.01) from simulation S2 (CO2 and climate forcing)
compares to a trend of 0.07± 0.03 Pg C yr−2 (P < 0.01) and
−0.00± 0.04 Pg C yr−2 (P = 0.85) for the S_L1 (CO2 only)
and S_L2–S_L1 (the climate effect), respectively (Tables S2,
S3). All DGVMs simulate a positive trend in NPP in response
to elevated CO2 across the northern land region, and trends
are all significant at the 95 % confidence level with the ex-
ception of CLM4CN (P = 0.21).
Large areas in temperate North America and Asia ex-
perienced warming combined with reductions in precipita-
tion over the period 1990–2009 (Fig. 5). Indeed, although
DGVMs simulate larger mean NPP in temperate compared
to boreal regions (Table S5 in the Supplement), they simu-
late significant positive trends in boreal North America and
boreal Asia, whereas trends in both temperate North Amer-
ica and Asia are smaller and not significant at the 95 % con-
fidence level (Table S5).
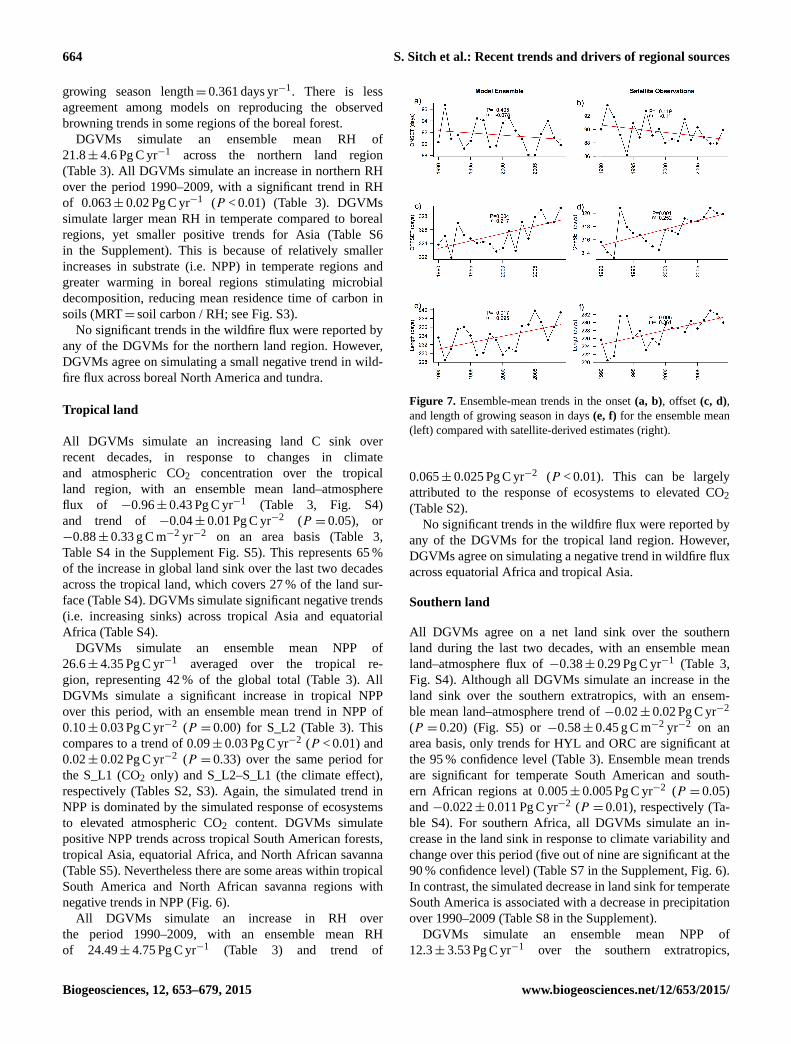
In response to warming, models simulate an earlier onset
(ensemble mean model trend=−0.078± 0.131 days yr−1)
and delayed termination of the growing season
(0.217± 0.097 days yr−1) based on LAI, and thus a
trend towards a longer growing season in the north-
ern extratropics (0.295± 0.228 days yr−1) (Fig. 7). This
is in broad agreement with observed greening trends
(Zhu et al., 2013; Murray-Tortarolo et al., 2013): on-
set=−0.11 days yr−1, offset= 0.252 days yr−1, and
www.biogeosciences.net/12/653/2015/ Biogeosciences, 12, 653–679, 2015
662 S. Sitch et al.: Recent trends and drivers of regional sources
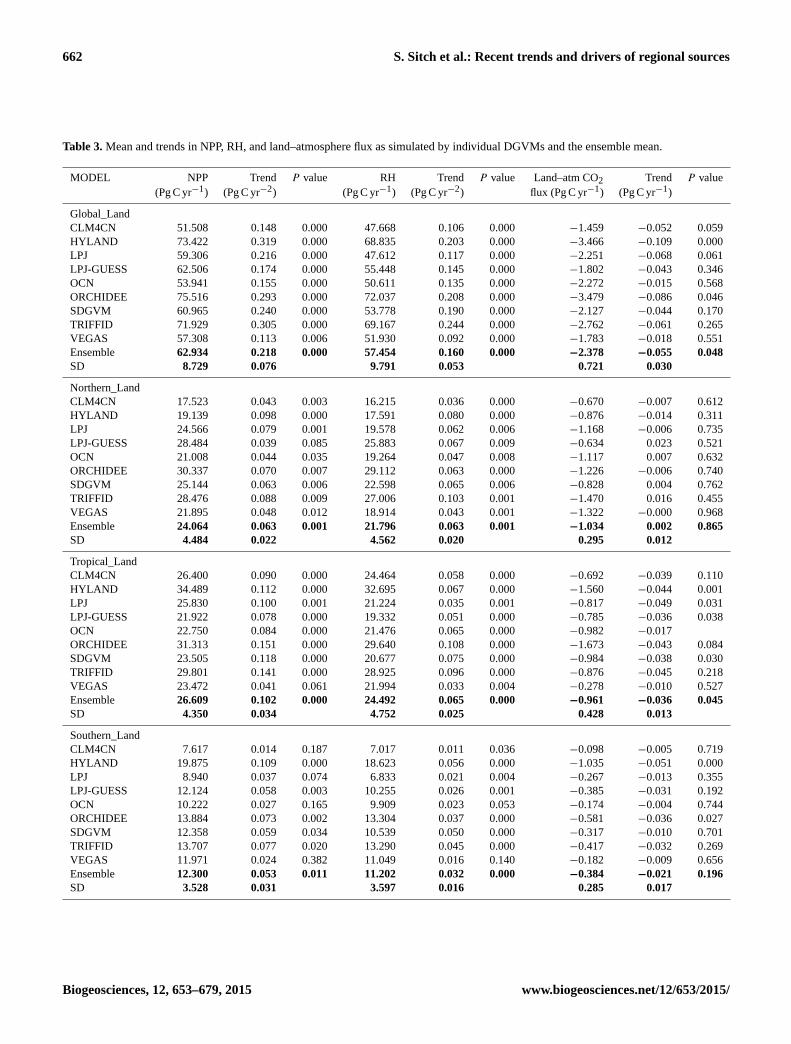
Table 3. Mean and trends in NPP, RH, and land–atmosphere flux as simulated by individual DGVMs and the ensemble mean.
MODEL NPP Trend P value RH Trend P value Land–atm CO2 Trend P value
(Pg C yr−1) (Pg C yr−2) (Pg C yr−1) (Pg C yr−2) flux (Pg C yr−1) (Pg C yr−1)
Global_Land
CLM4CN 51.508 0.148 0.000 47.668 0.106 0.000 −1.459 −0.052 0.059
HYLAND 73.422 0.319 0.000 68.835 0.203 0.000 −3.466 −0.109 0.000
LPJ 59.306 0.216 0.000 47.612 0.117 0.000 −2.251 −0.068 0.061
LPJ-GUESS 62.506 0.174 0.000 55.448 0.145 0.000 −1.802 −0.043 0.346
OCN 53.941 0.155 0.000 50.611 0.135 0.000 −2.272 −0.015 0.568
ORCHIDEE 75.516 0.293 0.000 72.037 0.208 0.000 −3.479 −0.086 0.046
SDGVM 60.965 0.240 0.000 53.778 0.190 0.000 −2.127 −0.044 0.170
TRIFFID 71.929 0.305 0.000 69.167 0.244 0.000 −2.762 −0.061 0.265
VEGAS 57.308 0.113 0.006 51.930 0.092 0.000 −1.783 −0.018 0.551
Ensemble 62.934 0.218 0.000 57.454 0.160 0.000 −2.378 −0.055 0.048
SD 8.729 0.076 9.791 0.053 0.721 0.030
Northern_Land
CLM4CN 17.523 0.043 0.003 16.215 0.036 0.000 −0.670 −0.007 0.612
HYLAND 19.139 0.098 0.000 17.591 0.080 0.000 −0.876 −0.014 0.311
LPJ 24.566 0.079 0.001 19.578 0.062 0.006 −1.168 −0.006 0.735
LPJ-GUESS 28.484 0.039 0.085 25.883 0.067 0.009 −0.634 0.023 0.521
OCN 21.008 0.044 0.035 19.264 0.047 0.008 −1.117 0.007 0.632
ORCHIDEE 30.337 0.070 0.007 29.112 0.063 0.000 −1.226 −0.006 0.740
SDGVM 25.144 0.063 0.006 22.598 0.065 0.006 −0.828 0.004 0.762
TRIFFID 28.476 0.088 0.009 27.006 0.103 0.001 −1.470 0.016 0.455
VEGAS 21.895 0.048 0.012 18.914 0.043 0.001 −1.322 −0.000 0.968
Ensemble 24.064 0.063 0.001 21.796 0.063 0.001 −1.034 0.002 0.865
SD 4.484 0.022 4.562 0.020 0.295 0.012
Tropical_Land
CLM4CN 26.400 0.090 0.000 24.464 0.058 0.000 −0.692 −0.039 0.110
HYLAND 34.489 0.112 0.000 32.695 0.067 0.000 −1.560 −0.044 0.001
LPJ 25.830 0.100 0.001 21.224 0.035 0.001 −0.817 −0.049 0.031
LPJ-GUESS 21.922 0.078 0.000 19.332 0.051 0.000 −0.785 −0.036 0.038
OCN 22.750 0.084 0.000 21.476 0.065 0.000 −0.982 −0.017
ORCHIDEE 31.313 0.151 0.000 29.640 0.108 0.000 −1.673 −0.043 0.084
SDGVM 23.505 0.118 0.000 20.677 0.075 0.000 −0.984 −0.038 0.030
TRIFFID 29.801 0.141 0.000 28.925 0.096 0.000 −0.876 −0.045 0.218
VEGAS 23.472 0.041 0.061 21.994 0.033 0.004 −0.278 −0.010 0.527
Ensemble 26.609 0.102 0.000 24.492 0.065 0.000 −0.961 −0.036 0.045
SD 4.350 0.034 4.752 0.025 0.428 0.013
Southern_Land
CLM4CN 7.617 0.014 0.187 7.017 0.011 0.036 −0.098 −0.005 0.719
HYLAND 19.875 0.109 0.000 18.623 0.056 0.000 −1.035 −0.051 0.000
LPJ 8.940 0.037 0.074 6.833 0.021 0.004 −0.267 −0.013 0.355
LPJ-GUESS 12.124 0.058 0.003 10.255 0.026 0.001 −0.385 −0.031 0.192
OCN 10.222 0.027 0.165 9.909 0.023 0.053 −0.174 −0.004 0.744
ORCHIDEE 13.884 0.073 0.002 13.304 0.037 0.000 −0.581 −0.036 0.027
SDGVM 12.358 0.059 0.034 10.539 0.050 0.000 −0.317 −0.010 0.701
TRIFFID 13.707 0.077 0.020 13.290 0.045 0.000 −0.417 −0.032 0.269
VEGAS 11.971 0.024 0.382 11.049 0.016 0.140 −0.182 −0.009 0.656
Ensemble 12.300 0.053 0.011 11.202 0.032 0.000 −0.384 −0.021 0.196
SD 3.528 0.031 3.597 0.016 0.285 0.017
Biogeosciences, 12, 653–679, 2015 www.biogeosciences.net/12/653/2015/
S. Sitch et al.: Recent trends and drivers of regional sources 663
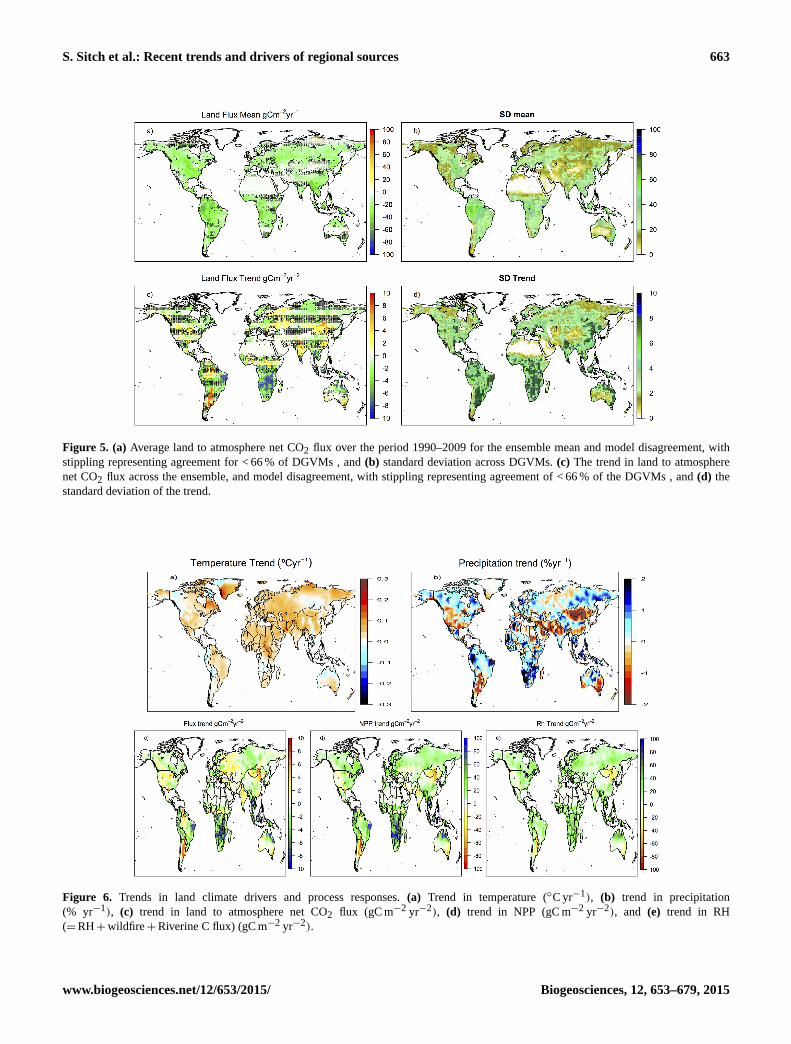
Figure 5. (a) Average land to atmosphere net CO2 flux over the period 1990–2009 for the ensemble mean and model disagreement, with
stippling representing agreement for < 66 % of DGVMs , and (b) standard deviation across DGVMs. (c) The trend in land to atmosphere
net CO2 flux across the ensemble, and model disagreement, with stippling representing agreement of < 66 % of the DGVMs , and (d) the
standard deviation of the trend.
Figure 6. Trends in land climate drivers and process responses. (a) Trend in temperature (◦C yr−1), (b) trend in precipitation
(% yr−1), (c) trend in land to atmosphere net CO2 flux (gC m−2 yr−2), (d) trend in NPP (gC m−2 yr−2), and (e) trend in RH
(=RH+wildfire+Riverine C flux) (gC m−2 yr−2).
www.biogeosciences.net/12/653/2015/ Biogeosciences, 12, 653–679, 2015
664 S. Sitch et al.: Recent trends and drivers of regional sources
growing season length= 0.361 days yr−1. There is less
agreement among models on reproducing the observed
browning trends in some regions of the boreal forest.
DGVMs simulate an ensemble mean RH of
21.8± 4.6 Pg C yr−1 across the northern land region
(Table 3). All DGVMs simulate an increase in northern RH
over the period 1990–2009, with a significant trend in RH
of 0.063± 0.02 Pg C yr−1 (P < 0.01) (Table 3). DGVMs
simulate larger mean RH in temperate compared to boreal
regions, yet smaller positive trends for Asia (Table S6
in the Supplement). This is because of relatively smaller
increases in substrate (i.e. NPP) in temperate regions and
greater warming in boreal regions stimulating microbial
decomposition, reducing mean residence time of carbon in
soils (MRT= soil carbon / RH; see Fig. S3).
No significant trends in the wildfire flux were reported by
any of the DGVMs for the northern land region. However,
DGVMs agree on simulating a small negative trend in wild-
fire flux across boreal North America and tundra.
Tropical land
All DGVMs simulate an increasing land C sink over
recent decades, in response to changes in climate
and atmospheric CO2 concentration over the tropical
land region, with an ensemble mean land–atmosphere
flux of −0.96± 0.43 Pg C yr−1 (Table 3, Fig. S4)
and trend of −0.04± 0.01 Pg C yr−2 (P = 0.05), or
−0.88± 0.33 g C m−2 yr−2 on an area basis (Table 3,
Table S4 in the Supplement Fig. S5). This represents 65 %
of the increase in global land sink over the last two decades
across the tropical land, which covers 27 % of the land sur-
face (Table S4). DGVMs simulate significant negative trends
(i.e. increasing sinks) across tropical Asia and equatorial
Africa (Table S4).
DGVMs simulate an ensemble mean NPP of
26.6± 4.35 Pg C yr−1 averaged over the tropical re-
gion, representing 42 % of the global total (Table 3). All
DGVMs simulate a significant increase in tropical NPP
over this period, with an ensemble mean trend in NPP of
0.10± 0.03 Pg C yr−2 (P = 0.00) for S_L2 (Table 3). This
compares to a trend of 0.09± 0.03 Pg C yr−2 (P < 0.01) and
0.02± 0.02 Pg C yr−2 (P = 0.33) over the same period for
the S_L1 (CO2 only) and S_L2–S_L1 (the climate effect),
respectively (Tables S2, S3). Again, the simulated trend in
NPP is dominated by the simulated response of ecosystems
to elevated atmospheric CO2 content. DGVMs simulate
positive NPP trends across tropical South American forests,
tropical Asia, equatorial Africa, and North African savanna
(Table S5). Nevertheless there are some areas within tropical
South America and North African savanna regions with
negative trends in NPP (Fig. 6).
All DGVMs simulate an increase in RH over
the period 1990–2009, with an ensemble mean RH
of 24.49± 4.75 Pg C yr−1 (Table 3) and trend of
Figure 7. Ensemble-mean trends in the onset (a, b), offset (c, d),
and length of growing season in days (e, f) for the ensemble mean
(left) compared with satellite-derived estimates (right).
0.065± 0.025 Pg C yr−2 (P < 0.01). This can be largely
attributed to the response of ecosystems to elevated CO2
(Table S2).
No significant trends in the wildfire flux were reported by
any of the DGVMs for the tropical land region. However,
DGVMs agree on simulating a negative trend in wildfire flux
across equatorial Africa and tropical Asia.
Southern land
All DGVMs agree on a net land sink over the southern
land during the last two decades, with an ensemble mean
land–atmosphere flux of −0.38± 0.29 Pg C yr−1 (Table 3,
Fig. S4). Although all DGVMs simulate an increase in the
land sink over the southern extratropics, with an ensem-
ble mean land–atmosphere trend of −0.02± 0.02 Pg C yr−2
(P = 0.20) (Fig. S5) or −0.58± 0.45 g C m−2 yr−2 on an
area basis, only trends for HYL and ORC are significant at
the 95 % confidence level (Table 3). Ensemble mean trends
are significant for temperate South American and south-
ern African regions at 0.005± 0.005 Pg C yr−2 (P = 0.05)
and −0.022± 0.011 Pg C yr−2 (P = 0.01), respectively (Ta-
ble S4). For southern Africa, all DGVMs simulate an in-
crease in the land sink in response to climate variability and
change over this period (five out of nine are significant at the
90 % confidence level) (Table S7 in the Supplement, Fig. 6).
In contrast, the simulated decrease in land sink for temperate
South America is associated with a decrease in precipitation
over 1990–2009 (Table S8 in the Supplement).
DGVMs simulate an ensemble mean NPP of
12.3± 3.53 Pg C yr−1 over the southern extratropics,
Biogeosciences, 12, 653–679, 2015 www.biogeosciences.net/12/653/2015/
S. Sitch et al.: Recent trends and drivers of regional sources 665
which represents ∼ 20 % of the global total (Table 3)
across 24 % of the land surface. All DGVMs simulate
an increase in NPP over this period, with a significant
ensemble mean trend of 0.05± 0.03 Pg C yr−2 (P = 0.01),
i.e. the southern land region accounts for around 25 % of
the simulated global trend in NPP. Southern Africa is the
only southern sub-region with a significant trend in NPP
of 0.041± 0.018 Pg C yr−2 (P < 0.01) (Table S5), due to
a positive response of plant production to both CO2 and
climate, and is likely in response to increases in precipitation
over the last two decades (Table S7, Fig. 5).
DGVMs simulate an ensemble mean RH of
11.20± 3.60 Pg C yr−1 over the southern land region
(Table 3). All DGVMs simulate an increase in RH over
the period 1990–2009, with a significant trend in the
ensemble mean RH of 0.03± 0.02 Pg C yr−2 (P < 0.01).
This is only partly explained by the response of ecosys-
tems to elevated CO2; over southern Africa the ensemble
mean trend in RH from S_L1 is 0.01± 0.01 Pg C yr−2
(P < 0.01), and a climate-induced positive trend in RH of
0.01± 0.00 Pg C yr−1 (P < 0.01) (Table S2, S7).
No significant trends in the wildfire flux were reported by
any of the DGVMs for the southern land region. However
DGVMs agree on simulating a negative trend in wildfire flux
across southern Africa.
In summary, the globally increasing trend in land carbon
sink is about two-thirds due to tropical ecosystems and one-
third due to the southern land region, with zero contribution
from northern land. This partitioning in trend is quite differ-
ent from the mean carbon sink fluxes themselves, which is
more like 43 : 41 : 16 (northern : tropical : southern).
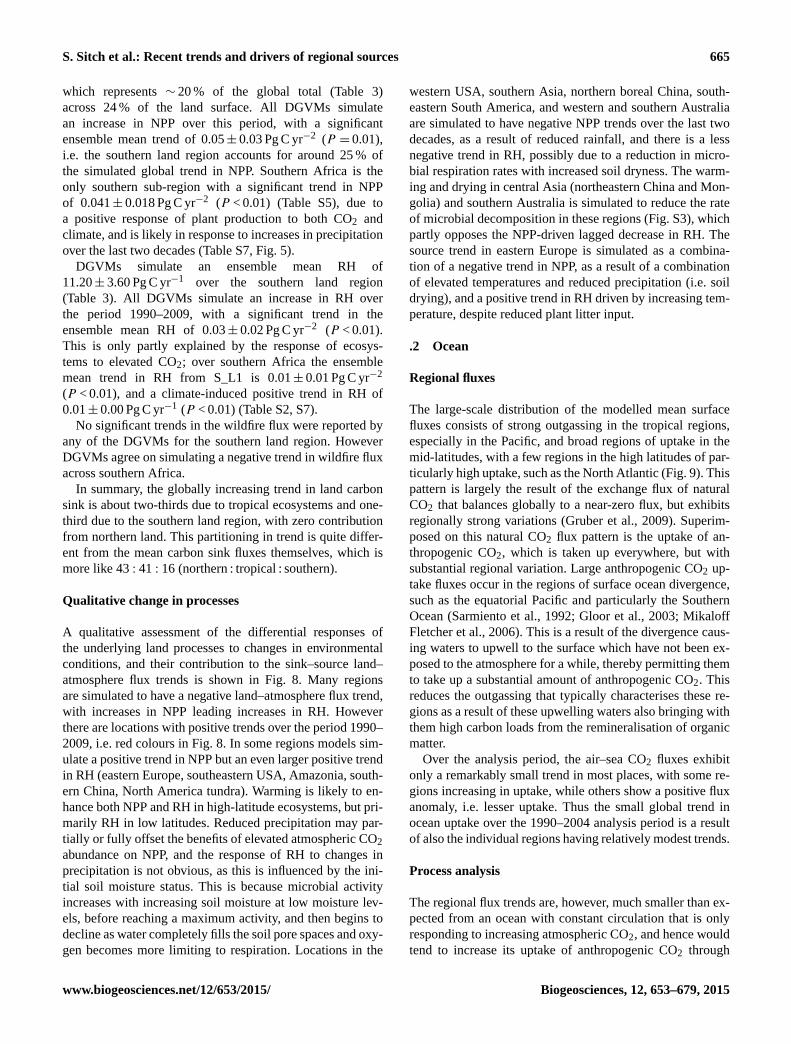
Qualitative change in processes
A qualitative assessment of the differential responses of
the underlying land processes to changes in environmental
conditions, and their contribution to the sink–source land–
atmosphere flux trends is shown in Fig. 8. Many regions
are simulated to have a negative land–atmosphere flux trend,
with increases in NPP leading increases in RH. However
there are locations with positive trends over the period 1990–
2009, i.e. red colours in Fig. 8. In some regions models sim-
ulate a positive trend in NPP but an even larger positive trend
in RH (eastern Europe, southeastern USA, Amazonia, south-
ern China, North America tundra). Warming is likely to en-
hance both NPP and RH in high-latitude ecosystems, but pri-
marily RH in low latitudes. Reduced precipitation may par-
tially or fully offset the benefits of elevated atmospheric CO2
abundance on NPP, and the response of RH to changes in
precipitation is not obvious, as this is influenced by the ini-
tial soil moisture status. This is because microbial activity
increases with increasing soil moisture at low moisture lev-
els, before reaching a maximum activity, and then begins to
decline as water completely fills the soil pore spaces and oxy-
gen becomes more limiting to respiration. Locations in the
western USA, southern Asia, northern boreal China, south-
eastern South America, and western and southern Australia
are simulated to have negative NPP trends over the last two
decades, as a result of reduced rainfall, and there is a less
negative trend in RH, possibly due to a reduction in micro-
bial respiration rates with increased soil dryness. The warm-
ing and drying in central Asia (northeastern China and Mon-
golia) and southern Australia is simulated to reduce the rate
of microbial decomposition in these regions (Fig. S3), which
partly opposes the NPP-driven lagged decrease in RH. The
source trend in eastern Europe is simulated as a combina-
tion of a negative trend in NPP, as a result of a combination
of elevated temperatures and reduced precipitation (i.e. soil
drying), and a positive trend in RH driven by increasing tem-
perature, despite reduced plant litter input.
.2 Ocean
Regional fluxes
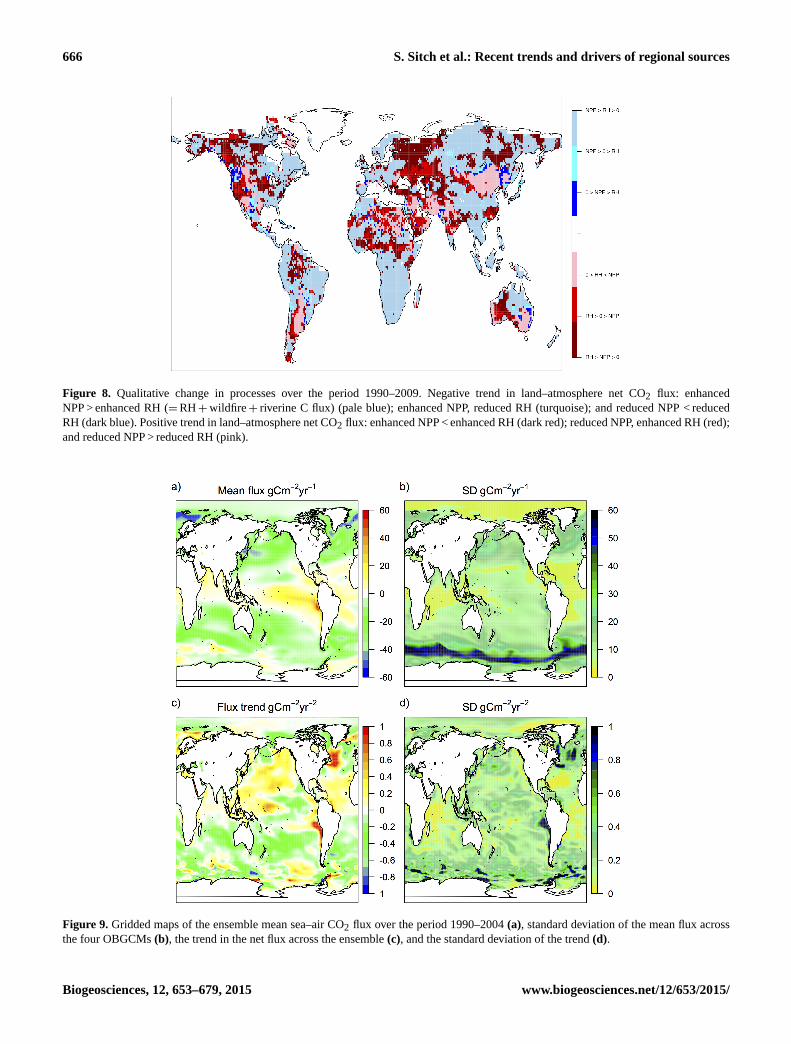
The large-scale distribution of the modelled mean surface
fluxes consists of strong outgassing in the tropical regions,
especially in the Pacific, and broad regions of uptake in the
mid-latitudes, with a few regions in the high latitudes of par-
ticularly high uptake, such as the North Atlantic (Fig. 9). This
pattern is largely the result of the exchange flux of natural
CO2 that balances globally to a near-zero flux, but exhibits
regionally strong variations (Gruber et al., 2009). Superim-
posed on this natural CO2 flux pattern is the uptake of an-
thropogenic CO2, which is taken up everywhere, but with
substantial regional variation. Large anthropogenic CO2 up-
take fluxes occur in the regions of surface ocean divergence,
such as the equatorial Pacific and particularly the Southern
Ocean (Sarmiento et al., 1992; Gloor et al., 2003; Mikaloff
Fletcher et al., 2006). This is a result of the divergence caus-
ing waters to upwell to the surface which have not been ex-
posed to the atmosphere for a while, thereby permitting them
to take up a substantial amount of anthropogenic CO2. This
reduces the outgassing that typically characterises these re-
gions as a result of these upwelling waters also bringing with
them high carbon loads from the remineralisation of organic
matter.
Over the analysis period, the air–sea CO2 fluxes exhibit
only a remarkably small trend in most places, with some re-
gions increasing in uptake, while others show a positive flux
anomaly, i.e. lesser uptake. Thus the small global trend in
ocean uptake over the 1990–2004 analysis period is a result
of also the individual regions having relatively modest trends.
Process analysis
The regional flux trends are, however, much smaller than ex-
pected from an ocean with constant circulation that is only
responding to increasing atmospheric CO2, and hence would
tend to increase its uptake of anthropogenic CO2 through
www.biogeosciences.net/12/653/2015/ Biogeosciences, 12, 653–679, 2015
666 S. Sitch et al.: Recent trends and drivers of regional sources
Figure 8. Qualitative change in processes over the period 1990–2009. Negative trend in land–atmosphere net CO2 flux: enhanced
NPP > enhanced RH (=RH+wildfire+ riverine C flux) (pale blue); enhanced NPP, reduced RH (turquoise); and reduced NPP < reduced
RH (dark blue). Positive trend in land–atmosphere net CO2 flux: enhanced NPP < enhanced RH (dark red); reduced NPP, enhanced RH (red);
and reduced NPP > reduced RH (pink).
Figure 9. Gridded maps of the ensemble mean sea–air CO2 flux over the period 1990–2004 (a), standard deviation of the mean flux across
the four OBGCMs (b), the trend in the net flux across the ensemble (c), and the standard deviation of the trend (d).
Biogeosciences, 12, 653–679, 2015 www.biogeosciences.net/12/653/2015/
S. Sitch et al.: Recent trends and drivers of regional sources 667
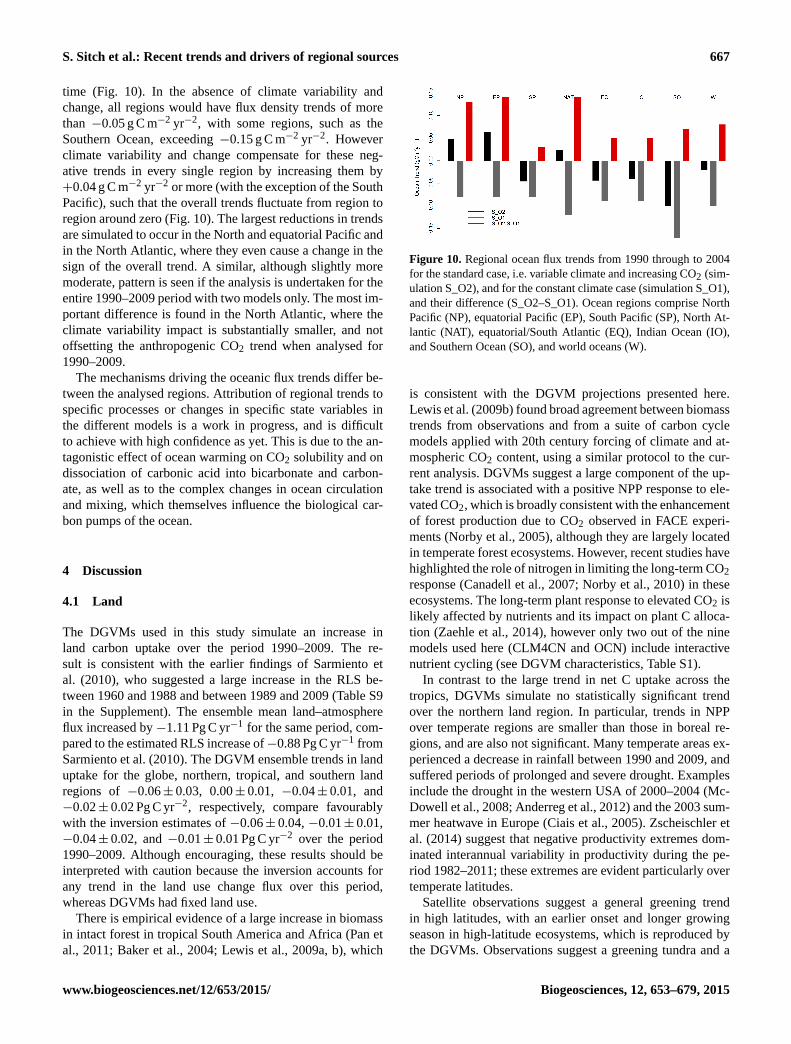
time (Fig. 10). In the absence of climate variability and
change, all regions would have flux density trends of more
than −0.05 g C m−2 yr−2, with some regions, such as the
Southern Ocean, exceeding −0.15 g C m−2 yr−2. However
climate variability and change compensate for these neg-
ative trends in every single region by increasing them by
+0.04 g C m−2 yr−2 or more (with the exception of the South
Pacific), such that the overall trends fluctuate from region to
region around zero (Fig. 10). The largest reductions in trends
are simulated to occur in the North and equatorial Pacific and
in the North Atlantic, where they even cause a change in the
sign of the overall trend. A similar, although slightly more
moderate, pattern is seen if the analysis is undertaken for the
entire 1990–2009 period with two models only. The most im-
portant difference is found in the North Atlantic, where the
climate variability impact is substantially smaller, and not
offsetting the anthropogenic CO2 trend when analysed for
1990–2009.
The mechanisms driving the oceanic flux trends differ be-
tween the analysed regions. Attribution of regional trends to
specific processes or changes in specific state variables in
the different models is a work in progress, and is difficult
to achieve with high confidence as yet. This is due to the an-
tagonistic effect of ocean warming on CO2 solubility and on
dissociation of carbonic acid into bicarbonate and carbon-
ate, as well as to the complex changes in ocean circulation
and mixing, which themselves influence the biological car-
bon pumps of the ocean.
4 Discussion
4.1 Land
The DGVMs used in this study simulate an increase in
land carbon uptake over the period 1990–2009. The re-
sult is consistent with the earlier findings of Sarmiento et
al. (2010), who suggested a large increase in the RLS be-
tween 1960 and 1988 and between 1989 and 2009 (Table S9
in the Supplement). The ensemble mean land–atmosphere
flux increased by −1.11 Pg C yr−1 for the same period, com-
pared to the estimated RLS increase of−0.88 Pg C yr−1 from
Sarmiento et al. (2010). The DGVM ensemble trends in land
uptake for the globe, northern, tropical, and southern land
regions of −0.06± 0.03, 0.00± 0.01, −0.04± 0.01, and
−0.02± 0.02 Pg C yr−2, respectively, compare favourably
with the inversion estimates of −0.06± 0.04, −0.01± 0.01,
−0.04± 0.02, and −0.01± 0.01 Pg C yr−2 over the period
1990–2009. Although encouraging, these results should be
interpreted with caution because the inversion accounts for
any trend in the land use change flux over this period,
whereas DGVMs had fixed land use.
There is empirical evidence of a large increase in biomass
in intact forest in tropical South America and Africa (Pan et
al., 2011; Baker et al., 2004; Lewis et al., 2009a, b), which
Figure 10. Regional ocean flux trends from 1990 through to 2004
for the standard case, i.e. variable climate and increasing CO2 (sim-
ulation S_O2), and for the constant climate case (simulation S_O1),
and their difference (S_O2–S_O1). Ocean regions comprise North
Pacific (NP), equatorial Pacific (EP), South Pacific (SP), North At-
lantic (NAT), equatorial/South Atlantic (EQ), Indian Ocean (IO),
and Southern Ocean (SO), and world oceans (W).
is consistent with the DGVM projections presented here.
Lewis et al. (2009b) found broad agreement between biomass
trends from observations and from a suite of carbon cycle
models applied with 20th century forcing of climate and at-
mospheric CO2 content, using a similar protocol to the cur-
rent analysis. DGVMs suggest a large component of the up-
take trend is associated with a positive NPP response to ele-
vated CO2, which is broadly consistent with the enhancement
of forest production due to CO2 observed in FACE experi-
ments (Norby et al., 2005), although they are largely located
in temperate forest ecosystems. However, recent studies have
highlighted the role of nitrogen in limiting the long-term CO2
response (Canadell et al., 2007; Norby et al., 2010) in these
ecosystems. The long-term plant response to elevated CO2 is
likely affected by nutrients and its impact on plant C alloca-
tion (Zaehle et al., 2014), however only two out of the nine
models used here (CLM4CN and OCN) include interactive
nutrient cycling (see DGVM characteristics, Table S1).
In contrast to the large trend in net C uptake across the
tropics, DGVMs simulate no statistically significant trend
over the northern land region. In particular, trends in NPP
over temperate regions are smaller than those in boreal re-
gions, and are also not significant. Many temperate areas ex-
perienced a decrease in rainfall between 1990 and 2009, and
suffered periods of prolonged and severe drought. Examples
include the drought in the western USA of 2000–2004 (Mc-
Dowell et al., 2008; Anderreg et al., 2012) and the 2003 sum-
mer heatwave in Europe (Ciais et al., 2005). Zscheischler et
al. (2014) suggest that negative productivity extremes dom-
inated interannual variability in productivity during the pe-
riod 1982–2011; these extremes are evident particularly over
temperate latitudes.
Satellite observations suggest a general greening trend
in high latitudes, with an earlier onset and longer growing
season in high-latitude ecosystems, which is reproduced by
the DGVMs. Observations suggest a greening tundra and a
www.biogeosciences.net/12/653/2015/ Biogeosciences, 12, 653–679, 2015
668 S. Sitch et al.: Recent trends and drivers of regional sources
slower greening and possible browning in some regions of
the boreal forest (Tucker et al., 2001; Bhatt et al., 2010), es-
pecially in North America (Beck and Goetz, 2011). In tun-
dra ecosystems, an earlier onset is attributed to warming
and earlier snowmelt. In these ecosystems, the start of the
growing season corresponds to near peak in radiation. Thus
any temperature-induced earlier snowmelt (McDonald et al.,
2004; Sitch et al., 2007a) is likely to enhance plant produc-
tion. Warming may not have such a great effect on the end
of the growing season in Arctic tundra ecosystems, as this
may be driven primarily by radiation. DGVMs simulate a
significant positive trend in NPP in boreal North America
and boreal Asia and the circumpolar tundra. Nitrogen limi-
tation is also likely to constrain the productivity at high lati-
tudes, but it was not possible to quantify N-limitation effects
on regional trends in this study.
DGVMs simulate decreasing NPP across northeastern
China and Mongolia, contributing to the overall decreas-
ing land uptake trend, in response to recent climate. In
a regional study, Poulter et al. (2013) investigated the dif-
ferential response of cool semi-arid ecosystems to recent
warming and drying trends across Mongolia and northern
China, using multiple sources of evidence, including the LPJ
DGVM, FPAR remotely sensed data (derived from GIMMS
NDVI3g), and tree-ring widths. They found coherent patterns
of high sensitivity to precipitation across data sources, which
showed some areas with warming-induced springtime green-
ing and drought-induced summertime browning, and limita-
tions to NPP explained mainly by soil moisture.
Browning has occurred as a consequence of regional
drought, wildfire, and insect outbreak, and their interaction,
especially in North America (Beck and Goetz, 2011). Distur-
bance plays a key role in the ecology of many global ecosys-
tems. For example, wildfire plays a dominant role in the car-
bon balance of boreal forest in central Canada and other
regions (Bond-Lamberty et al., 2007), and insect outbreaks
like the mountain pine beetle epidemic between 2000 and
2006 in British Colombia, Canada, resulted in the transition
of forests from a small carbon sink to a source (Kurz et al.,
2008). In general, disturbance and forest management are in-
adequately represented by the current generation of DGVMs,
even though several models include simple prognostic wild-
fire schemes (Table S1), while some are starting to include
other disturbance types such as insect attacks (Jönsson et al.,
2012) and windthrow (Lagergren et al., 2012). The exten-
sion of DGVMs to include representations of globally and
regionally important disturbance types and their response to
changing environmental conditions is a priority.
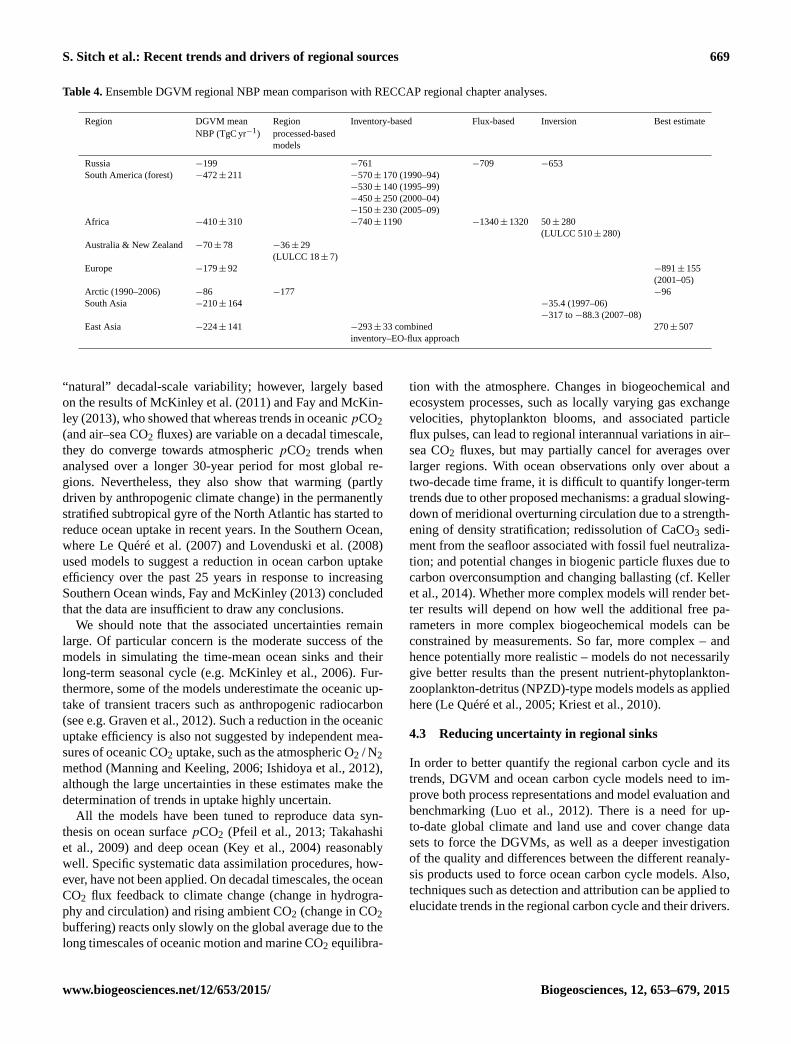
In Table 4, DGVM results are compared with the REC-
CAP synthesis papers documenting carbon sources and sinks
for individual regions. Note that DGVMs provided one
source of evidence for some regional papers. Over Russia,
DGVMs agree on a sink yet underestimate that sink’s mag-
nitude, likely related to soil respiration (which is unsurpris-
ing, as many DGVMs have a limited representation of per-
mafrost and active layer thickness) (Dolman et al., 2012).
In South America, DGVMs agree with inventory-based es-
timates on a sink in natural forests (Gloor et al., 2012).
DGVMs also agree with other data sources on the sign and
magnitude of the natural land sink over Australia (Harverd
et al., 2013). Over Europe DGVMs simulate a smaller mean
land sink than the synthesis study suggests (Luyssaert et al.,
2012). However, the regional synthesis was conducted over
the shorter time period 2001–2005. For the Arctic, DGVMs
tend to simulate a lower sink than regional process-based
models (McGuire et al., 2012). However, over the 1990–
2006 period, DGVMs are in line with observations and in-
versions on the magnitude and sign of the natural land sink,
and DGVM results also suggest a sink trend in line with ob-
servations. DGVMs simulate a land sink over South Asia in
agreement with inversions; however there were limited data
to compare trends from DGVMs and other products (Patra
et al., 2013). For East Asia, DGVM results agree remark-
ably well with remote sensing model–data fusion and inverse
models on the magnitude of the land sink over the period
1990–2009. Finally, for Africa, DGVMs are broadly consis-
tent with inventory- and flux-based estimates in simulating a
land sink over Africa, albeit of lower magnitude (Valentini et
al., 2014).
4.2 Ocean
The investigated OBGCMs consistently simulate an ocean
characterised by a substantial uptake of CO2 from the at-
mosphere, but with a global integrated trend in the last
two decades (−0.02± 0.01 Pg C yr−2) that is substantially
smaller than that expected based on the increase in at-
mospheric CO2. Results based on the predictions from
ocean inversion and ocean Green function methods (Mikaloff
Fletcher et al., 2006; Gruber et al., 2009; Khatiwala et al.,
2009) suggest an increase in ocean uptake with a trend of
the order of −0.04 Pg C yr−2 over the analysis period (see
also Wanninkhof et al., 2013). These latter methods assume
constant circulation, while our simulations here include the
impact of climate variability and change.
Our analyses reveal that recent climate variability and
change has caused the ocean carbon cycle to take up less
CO2 from the atmosphere than expected on the basis of the
increase in atmospheric CO2, i.e. it reduces the efficiency of
the ocean carbon sink. Globally, we find that this efficiency
reduction is primarily a result of ocean warming, while, re-
gionally, many more processes (e.g. wind changes, alkalin-
ity/DIC concentration changes) are at play.
Is this reduction in uptake efficiency over the analy-
sis period the first sign of a positive feedback between
global warming and the ocean carbon cycle – or, alterna-
tively, could it just reflect natural decadal-scale variability
in air–sea CO2 fluxes? Without a formal attribution study,
it is not possible to provide a firm answer. We suspect
that the majority of the trend in the efficiency is due to
Biogeosciences, 12, 653–679, 2015 www.biogeosciences.net/12/653/2015/
S. Sitch et al.: Recent trends and drivers of regional sources 669
Table 4. Ensemble DGVM regional NBP mean comparison with RECCAP regional chapter analyses.
Region DGVM mean Region Inventory-based Flux-based Inversion Best estimate
NBP (TgC yr−1) processed-based
models
Russia −199 −761 −709 −653
South America (forest) −472± 211 −570± 170 (1990–94)
−530± 140 (1995–99)
−450± 250 (2000–04)
−150± 230 (2005–09)
Africa −410± 310 −740± 1190 −1340± 1320 50± 280
(LULCC 510± 280)
Australia & New Zealand −70± 78 −36± 29
(LULCC 18± 7)
Europe −179± 92 −891± 155
(2001–05)
Arctic (1990–2006) −86 −177 −96
South Asia −210± 164 −35.4 (1997–06)
−317 to −88.3 (2007–08)
East Asia −224± 141 −293± 33 combined 270± 507
inventory–EO-flux approach
“natural” decadal-scale variability; however, largely based
on the results of McKinley et al. (2011) and Fay and McKin-
ley (2013), who showed that whereas trends in oceanic pCO2
(and air–sea CO2 fluxes) are variable on a decadal timescale,
they do converge towards atmospheric pCO2 trends when
analysed over a longer 30-year period for most global re-
gions. Nevertheless, they also show that warming (partly
driven by anthropogenic climate change) in the permanently
stratified subtropical gyre of the North Atlantic has started to
reduce ocean uptake in recent years. In the Southern Ocean,
where Le Quéré et al. (2007) and Lovenduski et al. (2008)
used models to suggest a reduction in ocean carbon uptake
efficiency over the past 25 years in response to increasing
Southern Ocean winds, Fay and McKinley (2013) concluded
that the data are insufficient to draw any conclusions.
We should note that the associated uncertainties remain
large. Of particular concern is the moderate success of the
models in simulating the time-mean ocean sinks and their
long-term seasonal cycle (e.g. McKinley et al., 2006). Fur-
thermore, some of the models underestimate the oceanic up-
take of transient tracers such as anthropogenic radiocarbon
(see e.g. Graven et al., 2012). Such a reduction in the oceanic
uptake efficiency is also not suggested by independent mea-
sures of oceanic CO2 uptake, such as the atmospheric O2 / N2
method (Manning and Keeling, 2006; Ishidoya et al., 2012),
although the large uncertainties in these estimates make the
determination of trends in uptake highly uncertain.
All the models have been tuned to reproduce data syn-
thesis on ocean surface pCO2 (Pfeil et al., 2013; Takahashi
et al., 2009) and deep ocean (Key et al., 2004) reasonably
well. Specific systematic data assimilation procedures, how-
ever, have not been applied. On decadal timescales, the ocean
CO2 flux feedback to climate change (change in hydrogra-
phy and circulation) and rising ambient CO2 (change in CO2
buffering) reacts only slowly on the global average due to the
long timescales of oceanic motion and marine CO2 equilibra-
tion with the atmosphere. Changes in biogeochemical and
ecosystem processes, such as locally varying gas exchange
velocities, phytoplankton blooms, and associated particle
flux pulses, can lead to regional interannual variations in air–
sea CO2 fluxes, but may partially cancel for averages over
larger regions. With ocean observations only over about a
two-decade time frame, it is difficult to quantify longer-term
trends due to other proposed mechanisms: a gradual slowing-
down of meridional overturning circulation due to a strength-
ening of density stratification; redissolution of CaCO3 sedi-
ment from the seafloor associated with fossil fuel neutraliza-
tion; and potential changes in biogenic particle fluxes due to
carbon overconsumption and changing ballasting (cf. Keller
et al., 2014). Whether more complex models will render bet-
ter results will depend on how well the additional free pa-
rameters in more complex biogeochemical models can be
constrained by measurements. So far, more complex – and
hence potentially more realistic – models do not necessarily
give better results than the present nutrient-phytoplankton-
zooplankton-detritus (NPZD)-type models models as applied
here (Le Quéré et al., 2005; Kriest et al., 2010).
4.3 Reducing uncertainty in regional sinks
In order to better quantify the regional carbon cycle and its
trends, DGVM and ocean carbon cycle models need to im-
prove both process representations and model evaluation and
benchmarking (Luo et al., 2012). There is a need for up-
to-date global climate and land use and cover change data
sets to force the DGVMs, as well as a deeper investigation
of the quality and differences between the different reanaly-
sis products used to force ocean carbon cycle models. Also,
techniques such as detection and attribution can be applied to
elucidate trends in the regional carbon cycle and their drivers.
www.biogeosciences.net/12/653/2015/ Biogeosciences, 12, 653–679, 2015
670 S. Sitch et al.: Recent trends and drivers of regional sources
4.3.1 Model evaluation and benchmarking
Piao et al. (2013) evaluated the DGVM model results for
their response to climate variability and to CO2 trends, and
the seasonal cycle of CO2 fluxes were benchmarked in Peng
et al. (2014). Piao et al. (2013) found DGVMs to simulate
higher mean and interannual variations (IAVs) in gross pri-
mary production than a data-driven model (Jung et al., 2011),
particularly in the tropics; however, this is the region where
the data-driven model is most uncertain. DGVMs were able
to capture the IAVs in RLS, although the simulated land–
atmosphere net CO2 flux appears too sensitive to variations in
precipitation in tropical forests and savannas. However, Poul-
ter et al. (2014) found an increase in the sensitivity of the net
flux to precipitation over the last three decades across conti-
nental Australia. Piao et al. (2013) found that the simulated
net CO2 flux was more sensitive than productivity to tem-
perature variations. When compared to ecosystem warming
experiments the DGVMs tend to underpredict the response
of NPP to temperature at temperate sites. DGVMs simulated
an ensemble mean NPP enhancement comparable to FACE
experiment observations (Piao et al., 2013). However, mod-
elling of ecosystem function in water-stressed environments
and changes in plant water use with elevated CO2 remains a
challenge for DGVMs (Morales et al., 2005; Keenan et al.,
2009; De Kauwe et al., 2013).
There is a critical need for comprehensive model bench-
marking, as a first step to attempt to reduce model un-
certainty. Several prototype carbon cycle benchmarking
schemes have been developed (Randerson et al., 2009; Cad-
ule et al., 2010). A more in-depth evaluation and community
benchmarking set needs to be agreed upon and implemented
which also evaluates models for their implicit land response
timescales (especially relevant in the discussion on future tip-
ping elements and non-linear future responses) and for the
simulated carbon, water, and nutrient cycles. New emerging
frameworks now exist (Blyth et al., 2011; Abramowitz, 2012;
Luo et al., 2012; Dalmonech and Zaehle, 2013; Harverd
et al., 2013). One example within RECAPP is a multiple-
constraint approach applied to reduce uncertainty in land car-
bon and water cycles over Australia (Haverd et al., 2013).
4.3.2 Model resolution
Simulated ocean carbon dynamics may be sensitive to
horizontal resolution, particularly as model resolution im-
proves sufficiently to adequately capture mesoscale eddies.
Mesoscale turbulence influences the ocean carbon cycle in
a variety of ways, and the present eddy parameterisations
may not adequately capture the full range of effects and
the responses to climate variability and change. For exam-
ple, mesoscale processes are thought to modulate biologi-
cal productivity by altering the supply of limiting nutrients
(Falkowski et al., 1991; McGillicuddy et al., 1998; Gruber
et al., 2011). A particularly crucial issue involves the wind-
driven overturning circulation in the Southern Ocean, where
non-eddy-resolving models indicate a strong sensitivity of
the overturning circulation and ocean carbon uptake to sur-
face wind stress (Le Quéré et al., 2007; Lovenduski et al.,
2008). Some eddy-resolving models, in contrast, suggest that
enhanced wind stress is dissipated by increased eddy activ-
ity, leading to only a small increase in overturning (Böning,
et al., 2008), although more recent results indicate a larger
response (Gent and Danabasoglu, 2011; Matear et al., 2013).
4.3.3 Model structure
There is a need for improved representation of ecological
processes in land and ocean models, e.g. nutrient cycling
(N, P), demographic dynamics, disturbance (wildfire, wind-
throw, insects), land use and land cover change in land mod-
els, and better representation of the key functional diversity
in ocean and land biogeochemical models. DGVMs need to
represent land use and land cover changes, forest manage-
ment, and forest age in order to improve estimates of the
regional and global land carbon budget. There have been
recent developments to include nutrient dynamics, mostly
nitrogen, in global land biosphere models (as reviewed by
Zaehle and Dalmonech, 2011). Too few model simulations
are available to date to allow for an ensemble model trend
assessment. However, a few general trends appear robust:
as evident from Table 3, CN models generally show less
of a response to increasing atmospheric CO2 due to nitro-
gen limitation of plant production. N dynamics further al-
ter the climate–carbon relationship, which tend to reduce the
C loss from temperate and boreal terrestrial ecosystems due
to warming – but with a considerable degree of uncertainty
(Thornton et al., 2009; Sokolov et al., 2008; Zaehle et al.,
2010). Changes in the nitrogen cycle due to anthropogenic
reactive nitrogen additions (both fertiliser to croplands and
N deposition on forests and natural grasslands) further mod-
ify the terrestrial net C balance and contribute with −0.2
to −0.5 Pg C yr−1 to the current land sink (Zaehle and Dal-
monech, 2011). Zaehle et al. (2011), using the OCN model,
estimated the 1995–2005 trend in land uptake due to N de-
position to be−1.1± 1.7 Tg C yr−2, with strong regional dif-
ferences depending on the regional trends in air pollution and
reactive N loading of the atmosphere and the nitrogen status
of the ecosystems, which are generally lower in less respon-
sive ecosystems close to nitrogen saturation highly polluted
regions. The DGVMs applied here do not consider the P cy-
cle; P limitation on land carbon uptake may be particularly
important in tropical forests and savannas (Edwards et al.,
2005; Wang et al., 2010; Zhang et al., 2014).
There are several additional land processes that have not
been considered in this current multi-model analysis. These
include the effects of aerosols and tropospheric ozone on the
carbon cycle. Unlike a global forcing agent such as CO2,
the effects of air pollutants (aerosols, NOx, and O3), with
their shorter atmospheric lifetimes, are at the regional scale.
Biogeosciences, 12, 653–679, 2015 www.biogeosciences.net/12/653/2015/
S. Sitch et al.: Recent trends and drivers of regional sources 671
Aerosol-induced changes in radiation quantity and quality
(i.e. the ratio of diffuse to direct) affect plant productivity and
the land sink (Mercado et al., 2009). From around 1960 until
the 1980s, radiation levels declined across industrialised re-
gions, a phenomenon called “global dimming”, followed by
a recent brightening in Europe and North America with the
adoption of air pollution legislation. Reductions in acid rain
have been found to greatly influence trends in riverine DOC,
vegetation health, and rates of soil organic matter decompo-
sition. Tropospheric ozone is known to be toxic to plants and
lead to reductions in plant productivity, and thus reduce the
efficiency of the land carbon sink (Sitch et al., 2007b; Anav et
al., 2011). Drivers of the land carbon sink related to air pollu-
tion – e.g. N deposition, acid precipitation, diffuse and direct
radiation, and surface O3 – have varied markedly in space
and time over recent decades. Although likely important for
regional carbon cycle trends, quantifying these effects is be-
yond the scope of the present study.
The Pinatubo eruption in 1991, at the start of the study pe-
riod, had a major influence on many carbon cycle processes,
leading to an enhanced land sink over the period 1991–1993.
This has been attributed to a combination of cooling-induced
reductions in high-latitude respiration and enhanced produc-
tivity associated with changes in diffuse radiation (Jones and
Cox, 2001; Lucht et al., 2002; Peylin et al., 2005; Mercado et
al., 2009; Frölicher et al., 2013). The direct effect of aerosols
on climate drivers is implicitly included in this study (i.e. re-
sponses to high-latitude cooling, tropical drying, reduced net
incoming solar radiation); however diffuse radiation effects
are not included.
Similar gaps need to be addressed in ocean biogeochemi-
cal models. The ecosystem modules in the current generation
of OBGCMs lack the ability to assess many of the suggested
mechanisms by which climate and ocean acidification could
alter marine biogeochemistry and ocean carbon storage. Pro-
posed biological processes that could influence ocean car-
bon uptake and release involve, for example, decoupling of
carbon and macronutrient cycling, changes in micronutrient
limitation, variations in elemental stoichiometry in organic
matter, and changes in the vertical depth scale for the res-
piration of sinking organic carbon particles (e.g. Boyd and
Doney, 2003; Sarmiento and Gruber, 2006). Some advances
have been made with the incorporation of dynamic iron cy-
cling and iron limitation, multiple plankton groups, calcifi-
cation, and nitrogen fixation (Le Quéré et al., 2005). How-
ever, the evaluation of these aspects of the models is cur-
rently hindered by both data- and process-level information
limitations.
4.3.4 Climate and land use and cover data sets
In addition to model structure, the choice of climate forc-
ing and model initial conditions can also contribute to dif-
ferences in the simulated terrestrial carbon sink. At regional
scales, differences in land cover can introduce ∼ 10 % un-
certainty in simulated regional-scale GPP (Jung et al., 2007;
Quaife et al., 2008) and ∼ 3.5 % uncertainty for global NPP.
Climate forcing uncertainty tends to have larger effects on
carbon flux uncertainty than land cover (Hicke, 2005; Poul-
ter et al., 2011), with up to 25 % differences in GPP reported
over Europe (Jung et al., 2007) and a 10 % difference for
global NPP (Poulter et al., 2011). Climate forcing uncertainty
and land cover (i.e. PFT distributions) can alter long-term
trends in land to atmosphere net CO2 flux and interannual
variability of carbon fluxes to climate (Poulter et al., 2011).
The DGVMs applied here did not consider LULCC. This
is an active area of research; models need a consistent im-
plementation of LULCC. Uncertainties in the simulated net
land use flux are associated with assumptions on the imple-
mentation of LULCC gridded maps (e.g. whether conversion
to cropland in a grid-cell is taken preferentially from grass-
land, forest, or both), simulated biomass estimates, and sub-
sequent decomposition rates. However DGVMs offer the ex-
citing prospect of disentangling the component fluxes asso-
ciated with land use (e.g. direct emissions and legacy fluxes)
and separating the environmental and direct human impacts
on the net LU flux (Gasser and Ciais, 2013; Pongratz et al.,
2014; Stocker et al., 2014).
5 Conclusions
Land models suggest an increase in the global land net C
uptake over the period 1990–2009, with increases in trop-
ical and southern regions and negligible increase in north-
ern regions. The increased sink is mainly driven by trends in
NPP, in response to increasing atmospheric CO2 concentra-
tion, and modulated by change in climate. Over the same pe-
riod, ocean models suggest a negligible increase in net ocean
C uptake – a result of ocean warming counteracting the ex-
pected increase in ocean uptake driven by the increase in at-
mospheric CO2. At the sub-regional level, trends vary both in
sign and magnitude, particularly over land. Areas in temper-
ate North America, eastern Europe, and northeastern China
show a decreasing regional land sink trend, due to regional
drying, suggesting a possibility for a transition to a net car-
bon source in the future if drying continues or droughts be-
come more severe and/or frequent. In the ocean, the trends
tend to be more homogeneous, but the underlying dynamics
differ greatly, ranging from ocean warming, to winds, and to
changes in circulation/mixing and ocean productivity, mak-
ing simple extrapolations into the future difficult.
Our conclusions need to be viewed with several important
caveats: only a few models include a fully coupled carbon–
nitrogen cycle, and no model included land use and land
cover changes. Ocean models tend to be too coarse in reso-
lution to properly represent important scales of motions and
mixing, such as eddies and other mesoscale processes, and
coastal boundary processes. Furthermore, their representa-
tion of ocean ecosystem processes and their sensitivity to
www.biogeosciences.net/12/653/2015/ Biogeosciences, 12, 653–679, 2015
672 S. Sitch et al.: Recent trends and drivers of regional sources
climate change and other stressors (e.g. ocean acidification,
deoxygenation, etc.; Gruber, 2011; Boyd, 2011) is rather
simplistic.
There is a need for detailed model evaluation and bench-
marking in order to reduce the uncertainty in the sinks in
the land and ocean and, particularly, in how these sinks have
changed in the past and how they may change in the fu-
ture. For land ecosystems, a concerted effort is needed in the
DGVM community to incorporate nutrient cycling as well as
land use and land cover change. For the oceans, models need
to improve their representation of unresolved physical trans-
port and mixing processes, and ecosystem models need to
evolve to better characterise their response to global change.
The Supplement related to this article is available online
at doi:10.5194/bg-12-653-2015-supplement.
Acknowledgements. S. Sitch acknowledges financial support by
RCUK through NERC (grant no. NE/J010154/). N. Gruber and
C. Heinze acknowledge financial support by the European Com-
mission through the EU FP7 projects CARBOCHANGE (grant
no. 264879) and GEOCARBON (grant no. 283080). N. Gruber
was additionally supported through ETH Zurich. S. C. Doney
acknowledges support from the US National Science Foundation
(NSF AGS-1048827). P. Friedlingstein, A. Arneth, and S. Zaehle
acknowledge support by the European Commission through the EU
FP7 project EMBRACE (grant no. 282672). A. Arneth and S. Sitch
acknowledge the support of the European Commission-funded
project LUC4C (grant no. 603542). The research leading to these
results received funding from the European Community’s Seventh
Framework Programme (FP7 2007–2013) under grant agreement
no. 238366. A. Ahlström and B. Smith acknowledge funding
through the Mistra Swedish Research Programme on Climate, Im-
pacts and Adaptation (SWECIA). This study is a contribution to the
Lund Centre for Studies of Carbon Cycle and Climate Interactions
(LUCCI) and the Strategic Research Area Modelling the Regional
and Global Earth System (MERGE). This is a contribution to the
Bjerknes Centre for Climate Research (BCCR) and core project
BIOFEEDBACK of the Centre for Climate Dynamics (SKD) at
BCCR. C. Heinze acknowledges support from NOTUR/NorStore
projects NN2980K and NS2980K. The authors wish to thank
Jonathan Barichivich for discussions on greening trends.
Edited by: F. Joos
References
Abramowitz, G.: Towards a public, standardized, diagnostic bench-
marking system for land surface models, Geosci. Model Dev., 5,
819–827, doi:10.5194/gmd-5-819-2012, 2012.
Allen, C. D., Macalady, A., Chenchouni, H., Bachelet, D., Mc-
Dowell, N., Vennetier, M., Gonzales, P., Hogg, T., Rigling, A.,
Breshears, D., Fensham, R., Zhang, Z., Kitzberger, T., Lim, J.,
Castro, J., Allard, G., Running, S., Semerci, A., and Cobb, N.:
A global overview of drought and heat-induced tree mortality
reveals emerging climate change risks for forests, Forest Ecol.
Manag., 4, 660–684, doi:10.1016/j.foreco.2009.09.001, 2010.
Anav, A., Menut, L., Khvorostyanov, D., and Viovy, N.: Impact of
tropospheric ozone on the Euro-Mediterranean vegetation, Glob.
Change Biol., 17, 2342–2359, 2011.
Anderegg, W. R. L., Berry J. A., Smith, D. D., Sperry J. S., An-
deregg, L. D. L., and Field, C. B.: The roles of hydraulic and car-
bon stress in a widespread climate-induced forest die-off, P. Natl.
Acad. Sci. USA, 109, 233–237, doi:10.1073/pnas.1107891109,
2012.
Angert, A., Biraud, S., Bonfils, C., Henning, C. C., Buermann, W.,
Pinzon, J., Tucker, C. J., and I. Fung: Drier summers cancel out
the CO2 uptake enhancement induced by warmer springs, P. Natl.
Acad. Sci., 102, 10823–10827, 2005.
Assmann, K. M., Bentsen, M., Segschneider, J., and Heinze, C.:
An isopycnic ocean carbon cycle model, Geosci. Model Dev., 3,
143–167, doi:10.5194/gmd-3-143-2010, 2010.
Baker, T. R., Phillips, O. L., Malhi, Y., Almeida, S., Arroyo, L.,
Di Fiore, A., Erwin, T., Higuchi, N., Killeen, T. J., Laurance, S.
G., Laurance, W. F., Lewis, S. L., Monteagudo, A., Neill, D. A.,
Nunez Vargas, P., Pitman, N. C. A., Silva, J. N. M., and Vasquez
Martinez, R.: Increasing biomass in Amazonian forest plots, Phi-
los. T. R. Soc. B, 359, 353–365, 2004.
Ballantyne, A. P., Alden, C. B., Miller, J. B., Tans, P. P., and White,
J. W. C.: Increase in observed net carbon dioxide uptake by
land and oceans during the past 50 years, Nature, 488, 70–72,
doi:10.1038/nature11299, 2012.
Beck, S. A. and Goetz, S. J.: Satellite observations of high north-
ern latitude vegetation productivity changes between 1982 and
2008: ecological variability and regional differences, Environ.
Res. Lett. 6, 045501, doi:10.1088/1748-9326/6/4/045501, 2011.
Bhatt, U. S., Walker, D. A., Raynolds, M. K., Comiso, J. C., Epstein,
H. E., Jia, G., Gens, R., Pinzon, J. E., Tucker, C. J., Tweedie,
C. E., and Webber, P. J.: Circumpolar Arctic tundra vegetation
change is linked to sea ice decline, Earth Interact., 14, 1–20,
2010.
Blyth, E., Clark, D. B., Ellis, R., Huntingford, C., Los, S., Pryor,
M., Best, M., and Sitch, S.: A comprehensive set of benchmark
tests for a land surface model of simultaneous fluxes of water
and carbon at both the global and seasonal scale, Geosci. Model
Dev., 4, 255–269, doi:10.5194/gmd-4-255-2011, 2011.
Bonan, G. B. and Levis, S.: Quantifying carbon-nitrogen feedbacks
in the Community Land Model (CLM4), Geophys. Res. Lett., 37,
L07401, doi:10.1029/2010GL042430, 2010.
Bond-Lamberty, B., Peckham, S. D., Ahl, D. E., and Gower, S. T.:
Fire as the dominant driver of central Canadian boreal forest car-
bon balance, Nature, 450, 89–92, 2007.
Böning, C. W., Dispert, A., Visbeck, M., Rintoul, S. R., and
Schwarzkopf, F. U.: The response of the Antarctic Circumpo-
lar Current to recent climate change, Nat. Geosci., 1, 864–869,
2008.
Boyd, P. and Doney, S. C.: The impact of climate change and feed-
back process on the ocean carbon cycle, Ocean Biogeochemistry,
edited by: Fasham, M., Springer, 157–193, 2003.
Boyd, P. W.: Beyond ocean acidification, Nat. Geosci., 4, 273–274,
2011.
Biogeosciences, 12, 653–679, 2015 www.biogeosciences.net/12/653/2015/
S. Sitch et al.: Recent trends and drivers of regional sources 673
Broecker, W. S., Peng, T.-H., Ostlund, G., and Stuiver, M.: The dis-
tribution of bomb radiocarbon in the ocean, J. Geophys. Res., 90,
6953–6970, 1985.
Buermann, W., Lintner, B. R., Koven, C. D., Angert, A., Pinzon,
J. E., Tucker, C. J., and Fung, I. Y.: The changing carbon cycle
at Mauna Loa observatory, P. Natl. Acad. Sci., 104, 4249–4254,
2007.
Buitenhuis, E. T., Rivkin, R. B., Sailley, S., and Le Quéré, C.:
Biogeochemical flues through microzooplankton, Global Bio-
geochem. Cy., 24, GB4015, doi:10.1029/2009GB003601, 2010.
Cadule, P., Friedlingstein, P., Bopp, L., Sitch, S., Jones, C. D.,
Ciais, P., Piao, S. L., and Peylin, P.: Benchmarking cou-
pled climate-carbon models against long-term atmospheric
CO2 measurements, Global Biogeochem. Cy., 24, Gb2016,
doi:10.1029/2009gb003556, 2010.
Canadell, J. G., Pataki D., Gifford, R., Houghton, R. A., Lou, Y.,
Raupach, M. R., Smith, P., and Steffen, W.: Saturation of the
terrestrial carbon sink, in: Terrestrial Ecosystems in a Changing
World, edited by: Canadell, J. G., Pataki, D., and Pitelka, L., 59–
78, The IGBP Series, Springer-Verlag, Berlin Heidelberg, 59–78,
2007.
Canadell, J. G., Ciais, P., Gurney, K., Le Quéré, C., Piao, S., Rau-
pach, M. R., and Sabine, C. L.: An international effort to quantify
regional carbon fluxes, EOS T. Am. Geophys. Un., 92, 81–82,
2011.
Canadell, J. G., Ciais, P., Sabine, C., and Joos, F. (Eds.): REgional
Carbon Cycle Assessment and Processes (RECCAP), Special
issue, Biogeosciences, http://www.biogeosciences-discuss.net/
special_issue83.html, 2013.
Chevallier, F., Ciais, P., Conway, T. J., Aalto, T., Anderson, B. E.,
Bousquet, P., Brunke, E. G., Ciattaglia, L., Esaki, Y., Fröhlich,
M., Gomez, A., Gomez-Pelaez, A. J., Haszpra, L., Krummel, P.
B., Langenfelds, R. L., Leuenberger, M., Machida, T., Maignan,
F., Matsueda, H., Morguí, J. A., Mukai, H., Nakazawa, T., Peylin,
P., Ramonet, M., Rivier, L., Sawa, Y., Schmidt, M., Steele, L. P.,
Vay, S. A., Vermeulen, A. T., Wofsy, S., and Worthy, D.: CO2
surface fluxes at grid point scale estimated from a global 21-year
reanalysis of atmospheric measurements, J. Geophys. Res., 115,
D21307, doi:10.1029/2010JD013887, 2010.
Ciais, P., Tans, P. P., Trolier, M., White, J. W. C., and Francey, R. J.:
A large northern hemisphere terrestrial CO2 sink indicated by the13C / 12C ratio of atmospheric CO2, Science, 269, 1098–1102,
doi:10.1126/science.269.5227.1098, 1995.
Ciais, P., Reichstein, M., Viovy, N., Granier, A., Ogee, J., Al-
lard, V., Aubinet, M., Buchmann, N., Bernhofer, C., Carrara,
A., Chevallier, F., De Noblet, N., Friend, A. D., Friedlingstein,
P., Grunwald, T., Heinesch, B., Keronen, P., Knohl, A., Krin-
ner, G., Loustau, D., Manca, G., Matteucci, G., Miglietta, F.,
Ourcival, J. M., Papale, D., Pilegaard, K., Rambal, S., Seufert,
G., Soussana, J. F., Sanz, M. J., Schulze, E. D., Vesala, T.,
and Valentini, R.: Europe-wide reduction in primary productivity
caused by the heat and drought in 2003, Nature, 437, 529–533,
doi:10.1038/nature03972, 2005.
Ciais, P., Canadell, J. G, Luyssaert, S., Chevallier, F., Shvidenko,
A., Pousii, Z., Jonas, M., Peylin, P., Wayne King, A., Schulze,
E.-D., Piao, S., Roedenbeck, C., Wouters, P., and Breon, F.-M.:
Can we reconcile atmospheric estimates of the Northern terres-
trial carbon sink with land-based accounting?, Current Opinion
in Environmental Sustainability, 2, 225–230, 2010.
Ciais, P., Sabine, C., Bala, G., Bopp, L., Brovkin, V., Canadell, J.,
Chhabra, A., DeFries, R., Galloway, J., Heimann, M., Jones, C.,
Le Quéré, C., Myneni, R. B., Piao, S., and Thornton, P.: Carbon
and Other Biogeochemical Cycles, in: Climate Change 2013:
The Physical Science Basis, Contribution of Working Group I
to the Fifth Assessment Report of the Intergovernmental Panel
on Climate Change, edited by: Stocker, T. F., Qin, D., Plattner,
G.-K., Tignor, M., Allen, S. K., Boschung, J., Nauels, A., Xia,
Y., Bex, V., and Midgley, P. M., Cambridge University Press,
Cambridge, United Kingdom and New York, NY, USA, 465–
570, 2013.
Clark, D. B., Mercado, L. M., Sitch, S., Jones, C. D., Gedney, N.,
Best, M. J., Pryor, M., Rooney, G. G., Essery, R. L. H., Blyth, E.,
Boucher, O., Harding, R. J., Huntingford, C., and Cox, P. M.: The
Joint UK Land Environment Simulator (JULES), model descrip-
tion – Part 2: Carbon fluxes and vegetation dynamics, Geosci.
Model Dev., 4, 701–722, doi:10.5194/gmd-4-701-2011, 2011.
Cox, P. M.: Description of the “TRIFFID” dynamic global vegeta-
tion model, Hadley Centre Technical Note, 24, 1–16, 2001.
Dalmonech, D. and Zaehle, S.: Towards a more objective evalua-
tion of modelled land-carbon trends using atmospheric CO2 and
satellite-based vegetation activity observations, Biogeosciences,
10, 4189–4210, doi:10.5194/bg-10-4189-2013, 2013.
De Kauwe, M. G., Medlyn, B. E., Zaehle, S., Walker, A. P., Dietze,
M. C., Hickler, T., Jain, A. K., Luo, Y., Parton, W. J., Prentice,
C., Smith, B., Thornton, P. E., Wang, S., Wang, Y-P., Wårlind,
D., Weng, E. S., Crous, K, Y., Ellsworth, D. S., Hanson, P. J.,
Seok-Kim, H., Warren, J. M., Oren, R., and Norby, R. J.: Forest
water use and water use efficiency at elevated CO2: a model-data
intercomparison at two contrasting temperate forest FACE sites,
Glob. Change Biol., 19, 1759–1779, 2013.
Denman, K. L., Brasseur, G., Chidthaisong, A., Ciais, P., Cox, P.
M., Dickinson, R. E., Hauglustaine, D., Heinze, C., Holland, E.,
Jacob, D., Lohmann, U., Ramachandran, S., da Silva Dias, P. L.,
Wofsy, S. C. , and Zhang, X.: Couplings Between Changes in the
Climate System and Biogeochemistry, in: Climate Change 2007:
The Physical Science Basis, Contribution of Working Group I
to the Fourth Assessment Report of the Intergovernmental Panel
on Climate Change, edited by: Solomon, S., Qin, D., Manning,
M., Chen, Z., Marquis, M., Averyt, K. B., Tignor, M., and Miller,
H. L., Cambridge University Press, Cambridge, United Kingdom
and New York, NY, USA, 499–588, 2007.
Dentener, F., Stevenson, D., Ellingsen, K., van Noije, T., Schultz,
M., Amann, M., Atherton, C., Bell, N., Bergmann, D., Bey, I.,
Bouwman, L., Butler, T., Cofala, J., Collins, B., Drevet, J., Do-
herty, R., Eickhout, B., Eskes, H., Fiore, A., Gauss, M., Hauglus-
taine, D., Horowitz, L., Isaksen, I. S. A., Josse, B., Lawrence, M.,
Krol, M., Lamarque, J. F., Montanaro, V., Muller, J. F., Peuch, V.
H., Pitari, G., Pyle, J., Rast, S., Rodriguez, J., Sanderson, M.,
Savage, N. H., Shindell, D., Strahan, S., Szopa, S., Sudo, K., Van
Dingenen, R., Wild, O., and Zeng, G.: The global atmospheric
environment for the next generation, Environ. Sci. Technol., 40,
3586–3594, doi:10.1021/es0523845, 2006.
Dolman, A. J., Shvidenko, A., Schepaschenko, D., Ciais, P.,
Tchebakova, N., Chen, T., van der Molen, M. K., Belelli March-
esini, L., Maximov, T. C., Maksyutov, S., and Schulze, E.-D.:
An estimate of the terrestrial carbon budget of Russia using
inventory-based, eddy covariance and inversion methods, Bio-
geosciences, 9, 5323–5340, doi:10.5194/bg-9-5323-2012, 2012.
www.biogeosciences.net/12/653/2015/ Biogeosciences, 12, 653–679, 2015
674 S. Sitch et al.: Recent trends and drivers of regional sources
Doney, S. C., Lima, I., Feely, R. A., Glover, D. M., Lindsay, K.,
Mahowald, N., Moore, J. K., and Wanninkhof, R.: Mechanisms
governing interannual variability in upper-ocean inorganic car-
bon system and air-sea CO2 fluxes: Physical climate and atmo-
spheric dust, Deep-Sea Res.-Pt. II, 56, 640–655, 2009a.
Doney, S. C., Lima, I., Moore, J. K., Lindsay, K., Behrenfeld, M. J.,
Westberry, T. K., Mahowald, N., Glover, D. M., and Takahashi,
T.: Skill metrics for confronting global upper ocean ecosystem-
biogeochemistry models against field and remote sensing data,
J. Marine Syst., 76, 95–112, doi:10.1016/j.jmarsys.2008.05.015,
2009b.
Edwards E., S. McCaffery, S., and Evans, J.: Phosphorus status de-
termines biomass response to elevated CO2 in a legume: C-4
grass community, Glob. Change Biol., 11, 1968–1981, 2005.
Falkowski, P. G., Ziemann, D., Kolber, Z., and Bienfang, P. K.: Role
of eddy pumping in enhancing primary production in the ocean,
Nature, 352, 55–58, 1991.
Fan, S., Gloor, M., Mahlmam, J., Pacala, S., Sarmiento, J., Taka-
hashi, T., and Tans, P.: A large terrestrial carbon sink in North
America implied by atmospheric and oceanic carbon dioxide
data and models, Science, 282, 442–446, 1998.
Fay, A. R. and McKinley, G. A.: Global trends in surface ocean
pCO2 from in situ data, Global Biogeochem. Cy., 27, 541–557,
doi:10.1002/gbc.20051, 2013.
Friedlingstein, P., Houghton, R. A., Marland, G., Hackler, J., Bo-
den,T. A., Conway, T. J., Canadell, J. G., Raupach, M. R., Ciais,
P., and Le Quéré, C.: Update on CO2 emissions, Nat. Geosci., 3,
811–812, doi:10.1038/ngeo1022, 2010.
Friend, A. D., Stevens, A. K., Knox, R. G., and Cannell, M. G.
R.: A process-based, terrestrial biosphere model of ecosystem
dynamics (Hybrid v3.0), Ecol. Model., 95, 249–287, 1997.
Frölicher, T. L., Joos, F., Raible, C. C., and Sarmiento, J. L.: Atmo-
spheric CO2 response to volcanic eruptions: the role of ENSO,
season, and variability, Global Biogeochem. Cy., 27, 239–251,
2013.
Gasser, T. and Ciais, P.: A theoretical framework for the net land-
to-atmosphere CO2 flux and its implications in the definition of
“emissions from land-use change”, Earth Syst. Dynam., 4, 171–
186, doi:10.5194/esd-4-171-2013, 2013.
Gent, P. R. and Danabasoglu, G.: Response to Increasing Southern
Hemisphere Winds in CCSM4, J. Climate, 24, 4992–4998, 2011.
Gloor, M., Gruber, N., Sarmiento, J. L., Sabine, C., Feely, D.,
and Rödenbeck, C.: A first estimate of present and preindus-
trial air-sea CO2 flux patterns based on ocean interior car-
bon measurements and models, Geophys. Res. Lett., 30, 1010,
doi:10.1029/2002GL015594, 2003.
Gloor, M., Sarmiento, J. L., and Gruber, N.: What can be learned
about carbon cycle climate feedbacks from the CO2 airborne
fraction?, Atmos. Chem. Phys., 10, 7739–7751, doi:10.5194/acp-
10-7739-2010, 2010.
Gloor, M., Gatti, L., Brienen, R., Feldpausch, T. R., Phillips, O.
L., Miller, J., Ometto, J. P., Rocha, H., Baker, T., de Jong, B.,
Houghton, R. A., Malhi, Y., Aragão, L. E. O. C., Guyot, J.-L.,
Zhao, K., Jackson, R., Peylin, P., Sitch, S., Poulter, B., Lomas,
M., Zaehle, S., Huntingford, C., Levy, P., and Lloyd, J.: The car-
bon balance of South America: a review of the status, decadal
trends and main determinants, Biogeosciences, 9, 5407–5430,
doi:10.5194/bg-9-5407-2012, 2012.
Graven, H. D., Gruber, N., Key, R., Khatiwala, S., and Giraud,
X.: Changing controls on oceanic radiocarbon: New insights on
shallow-to-deep ocean exchange and anthropogenic CO2 uptake,
J. Geophys. Res., 117, C10005, doi:10.1029/2012JC008074,
2012.
Gruber, N.: Warming up, turning sour, losing breath: Ocean bio-
geochemistry under global change, Philos. T. R. Soc. A, 369,
1980–1996, doi:10.1098/rsta.2011.0003, 2011.
Gruber, N., Gloor, M., Fletcher, S. E. M., Doney, S. C., Dutkiewicz,
S., Follows, M. J., Gerber, M., Jacobson, A. R., Joos, F., Lind-
say, K., Menemenlis, D., Mouchet, A., Muller, S. A., Sarmiento,
J. L., and Takahashi, T.: Oceanic sources, sinks, and transport
of atmospheric CO2, Global Biogeochem. Cy., 23, GB1005,
doi:10.1029/2008GB003349, 2009.
Gruber, N., Lachkar, Z., Frenzel, H., Marchesiello, P., Munnich, M.,
McWilliams, J., Nagai, T., and Plattner, G.-K.: Eddy-induced re-
duction of biological production in Eastern Boundary Upwelling
Systems, Nat. Geosci., 4, 787–792, doi:10.1038/ngeo1273, 2011.
Haverd, V., Raupach, M. R., Briggs, P. R., J. G. Canadell., Davis,
S. J., Law, R. M., Meyer, C. P., Peters, G. P., Pickett-Heaps, C.,
and Sherman, B.: The Australian terrestrial carbon budget, Bio-
geosciences, 10, 851–869, doi:10.5194/bg-10-851-2013, 2013.
Hicke, J. A.: NCEP and GISS solar radiation data sets available for
ecosystem modeling: Description, differences, and impacts on
net primary production, Global Biogeochem. Cy., 19, GB2006,
doi:10.1029/2004GB002391, 2005.
Houghton, R. A.: How well do we know the flux of CO2 from
land-use change? Tellus B, 62, 337–351, doi:10.1111/j.1600-
0889.2010.00473.x, 2010.
Ishidoya, S., Aoki, S., Goto, D., Nakazawa, T., Taguchi, S.,
and Patra, P. K.: Time and Space variations of O2/N2 ratio
in the troposphere over Japan and estimation of the global
CO2 budget for the period 2000–2010, Tellus B, 64, 18964,
doi:10.3402/tellusb.v64i0.18964, 2012.
Janssens, I. A., Freibauer, A., Ciais, P., Smith, P., Nabuurs, G.-J.,
Folberth, G., Schlamadinger, B., Hutjes, R. W. A., Ceulemans,
R., Schulze, E.-D., Valentini, R., and Dolman, A. J.: Europe’s ter-
restrial biosphere absorbs 7 to 12 % of European anthropogenic
CO2 emissions, Science 300, 1538–1542, 2003.
Jones, C. D. and Cox, P. M.: Modelling the volcanic signal in the
atmospheric CO2 record, Global Biogeochem. Cy., 15, 453–465,
doi:10.1029/2000GB001281, 2001.
Jönsson, A. M., Schröder, M., Lagergren, F., Anderbrandt, O., and
Smith, B.: Guess the impact of Ips typographus – an ecosystem
modelling approach for simulating bark beetle outbreaks, Agr.
Forest Meteorol., 166–167, 188–200, 2012.
Jung, M., Vetter, M., Herold, M., Churkina, G., Reichstein, M., Za-
ehle, S., Cias, P., Viovy, N., Bondeau, A., Chen, Y., Trusilova,
K., Feser, F., and Heimann, M.: Uncertainties of modelling GPP
over Europe: A systematic study on the effects of using differ-
ent drivers and terrestrial biosphere models, Global Biogeochem.
Cy., 21, GB4021, doi:10.1029/2006GB002915, 2007.
Jung, M., Reichstein, M., Margolis, H. A., Cescatti, A., Richardson
A. D., Arain, M. A., Arneth, A., Bernhofer, C., Bonal, D., Chen
J., Gianelle, D., Gobron, N., Kiely, G., Kutsch, W., Lasslop, G.,
Law, B. E., Lindroth, A., Merbold, L., Montagnani, L., Moors,
E. J., Papale, D., Sottocornola, M., Vaccari, F., and Williams,
C.: Global patterns of land-atmosphere fluxes of carbon diox-
ide, latent heat, and sensible heat derived from eddy covariance,
Biogeosciences, 12, 653–679, 2015 www.biogeosciences.net/12/653/2015/
S. Sitch et al.: Recent trends and drivers of regional sources 675
satellite, and meteorological observations, J. Geophys. Res., 116,
G00J07, doi:10.1029/2010JG001566, 2011.
Kalnay, E., Kanamitsu, M., Kistler, R., Collins, W., Deaven, D.,
Gandin, L., Iredell, M., Saha, S., Woollen, J., Zhu, Y., Chelliah,
M., Ebisuzaki, W., Higgins, W., Janowiak, J., Mo, K. C., Ro-
pelewski, C., Wang, J., Leetmaa, A., Reynolds, R., Jenne, R.,
and Joseph, D.: The NCEP/NCAR 40-year reanalysis project, B.
Am. Meteorol. Soc., 77, 437–471, 1996.
Keeling, C. D., Bacastow, R. B., Bainbridge, A. E., Ekdahl Jr, C.
A., Guenther, P. R., Waterman, L. S., and Chinm J. F. S.: At-
mospheric carbon dioxide variations at Mauna Loa observatory,
Hawaii, Tellus, 28, 538–551, 1976.
Keeling, C. D., Whorf, T. P., Wahlen, M., and van der Plicht, J.:
Interannual extremes in the rate of rise of atmospheric carbon
dioxide since 1980, Nature, 375, 666–670, 1995.
Keenan, T., García, R., Friend, A. D., Zaehle, S., Gracia, C., and
Sabate, S.: Improved understanding of drought controls on sea-
sonal variation in Mediterranean forest canopy CO2 and wa-
ter fluxes through combined in situ measurements and ecosys-
tem modelling, Biogeosciences, 6, 1423–1444, doi:10.5194/bg-
6-1423-2009, 2009.
Keller, K. M., Joos, F., and Raible, C. C.: Time of emergence
of trends in ocean biogeochemistry, Biogeosciences, 11, 3647–
3659, doi:10.5194/bg-11-3647-2014, 2014.
Key, R. M., Kozyr, A., Sabine, C. L., Lee, K., Wanninkhof, R.,
Bullister, J. L., Feely, R. A., Millero, F. J., Mordy, C., and Peng,
T.-H.: A global ocean carbon climatology: results from Global
Data Analysis Project (GLODAP), Global Biogeochem. Cy., 18,
GB4031, doi:10.1029/2004GB002247, 2004.
Khatiwala, S., Primeau, F., and Hall, T.: Reconstruction of the his-
tory of anthropogenic CO2 concentrations in the ocean, Nature,
462, 346–349, doi:10.1038/nature08526, 2009.
Khatiwala, S., Tanhua, T., Mikaloff Fletcher, S., Gerber, M.,
Doney, S. C., Graven, H. D., Gruber, N., McKinley, G. A.,
Murata, A., Ríos, A. F., and Sabine, C. L.: Global ocean stor-
age of anthropogenic carbon, Biogeosciences, 10, 2169–2191,
doi:10.5194/bg-10-2169-2013, 2013.
Kriest, I., Khatiwala, S., and Oschlies, A.: Towards an assessment of
simple global marine biogeochemical models of different com-
plexity, Progr. Oceanogr., 86, 337–360, 2010.
Krinner, G., Viovy, N., de Noblet-Ducoudre, N., Ogee, J., Polcher,
J., Friedlingstein, P., Ciais, P., Sitch, S., and Prentice, I. C.:
A dynamic global vegetation model for studies of the cou-
pled atmosphere-biosphere system, Global Biogeochem. Cy., 19,
Gb1015, doi:10.1029/2003gb002199, 2005.
Kurz, W. A., Dymond, C. C., Stinson, G., Rampley, G. J., Neilson,
E. T., Carroll, A. L., Ebata, T., and Safranyik, L.: Mountain pine
beetle and forest carbon feedback to climate change, Nature, 452,
987–990, doi:10.1038/nature06777, 2008.
Lagergren, F., Jönsson, A. M., Blennow, K., and Smith, B.: Imple-
menting storm damage in a dynamic vegetation model for re-
gional applications in Sweden, Ecol. Model., 247, 71–82, 2012.
Large, W. G. and Yeager, S.: Diurnal to decadal global forcing for
ocean and sea-ice models: The data sets and flux climatologies,
NCAR Tech. Rep. TN-460 _STR, 105 pp., 2004.
Lawrence, D. M., Oleson, K. W., Flanner, M. G., Thornton, P. E.,
Swenson, S. C., Lawrence, P. J., Zeng, X., Yang, Z.-L., Levis, S.,
Sakaguchi, K., Bonan, G. B., and Slater, A. G.: Parameterization
improvements and functional and structural advances in version
4 of the Community Land Model, J. Adv. Model. Earth Syst., 3,
M03001, doi:10.1029/2011ms000045, 2011.
Lenton, A., Tilbrook, B., Law, R. M., Bakker, D., Doney, S. C.,
Gruber, N., Ishii, M., Hoppema, M., Lovenduski, N. S., Matear,
R. J., McNeil, B. I., Metzl, N., Mikaloff Fletcher, S. E., Monteiro,
P. M. S., Rödenbeck, C., Sweeney, C., and Takahashi, T.: Sea-
air CO2 fluxes in the Southern Ocean for the period 1990–2009,
Biogeosciences, 10, 4037–4054, doi:10.5194/bg-10-4037-2013,
2013.
Le Quéré, C. L., Harrison, S. P., Colin Prentice, I. C., Buitenhuis,
E. T., Aumont, O., Bopp, L., Claustre, H., Cotrim Da Cunha, L.,
Geider, R., Giraud, X., Klaas, C., Kohfeld, K. E., Legendre, L.,
Manizza, M., Platt, T., Rivkin, R. B., Sathyendranath, S., Uitz, J.,
Watson, A. J., and Wolf-Gladrow, D.: Ecosystem dynamics based
on plankton functional types for global ocean biogeochemistry
models, Glob. Change Biol., 11, 2016–2040, doi:10.1111/j.1365-
2486.2005.1004.x, 2005.
Le Quéré, C, Rödenbeck, C., Buitenhuis, E. T., Conway, T. J.,
Langenfelds, R., Gomez, A., Labuschagne, C., Ramonet, M.,
Nakazawa, T., Metzl, N., and Gillett, N.: Saturation of the South-
ern ocean CO2 sink due to recent climate change, Science, 316,
1735–1738, doi:10.1126/science.1136188, 2007.
Le Quéré C, Raupach M. R., Canadell, J. G., Marland, G., Bopp,
L., Ciais, P., Conway, T. J., Doney, S. C., Feely, R. A., Foster
P, Friedlingstein, P., Gurney, K., Houghton, R. A., House, J. I.,
Huntingford, C., Levy, P. E., Lomas, M. R., Majkut, J., Metzl,
N., Ometto, J. P., Peters, G. P., Prentice, I. C., Randerson, J. T.,
Running, S. W., Sarmiento, J. L., Schuster, U., Sitch, S., Taka-
hashi, T., Viovy, N., van der Werf , G. R., and Woodward, F. I.:
Trends in the sources and sinks of carbon dioxide, Nat. Geosci.,
2, 831–836, 2009.
Le Quéré, C., Takahashi, T., Buitenhuis, C. E., Rödenbeck, C.,
and Sutherland, S.: Impact of climate change and variability on
the global oceanic sink of CO2, Global Biogeochem. Cy., 24,
GB4007, doi:10.1029/2009GB003599, 2010.
Le Quéré, C., Andres, R. J., Boden, T., Conway, T., Houghton, R.
A., House, J. I., Marland, G., Peters, G. P., van der Werf, G. R.,
Ahlström, A., Andrew, R. M., Bopp, L., Canadell, J. G., Ciais,
P., Doney, S. C., Enright, C., Friedlingstein, P., Huntingford, C.,
Jain, A. K., Jourdain, C., Kato, E., Keeling, R. F., Klein Gold-
ewijk, K., Levis, S., Levy, P., Lomas, M., Poulter, B., Raupach,
M. R., Schwinger, J., Sitch, S., Stocker, B. D., Viovy, N., Zaehle,
S., and Zeng, N.: The global carbon budget 1959–2011, Earth
Syst. Sci. Data, 5, 165–185, doi:10.5194/essd-5-165-2013, 2013.
Levy, P. E., Cannell, M. G. R., and Friend, A. D.: Modelling the
impact of future changes in climate, CO2 concentration and land
use on natural ecosystems and the terrestrial carbon sink, Global
Environ. Chang., 14, 21–30, 2004.
Lewis, S. L., Lopez-Gonzalez, G., Sonké, B., Affum-Baffoe, K.,
Baker, T. R., Ojo, L. O., Phillips, O. L., Reitsma, J. M., White,
L., James, A., Comiskey, K., Djuikouo, M.-N., Ewango, C. E. N.,
Feldpausch, T. R., Hamilton, A. C., Gloor, M., Hart, T., Hladik,
A., Lloyd, J., Lovett, J. C., Makana, J.-R., Malhi, Y., Mbago,
F. M., Ndangalasi, H. J., Peacock, J., Peh, K. S.-H., Sheil, D.,
Sunderland, T., Swaine, M. D., Taplin, J., Taylor, D., Thomas,
S. C., and Wöll, R. V. H.: Increasing carbon storage in intact
African tropical forests, Nature, 457, 1003–1006, 2009a.
www.biogeosciences.net/12/653/2015/ Biogeosciences, 12, 653–679, 2015
676 S. Sitch et al.: Recent trends and drivers of regional sources
Lewis, S. L., Lloyd, J., Sitch, S., Mitchard, E. T. A., and Lau-
rance, W. F.: Changing Ecology of Tropical Forests: Evidence
and Drivers, Annu. Rev. Ecol. Evol. Syst., 40, 529–49, 2009b.
Lovenduski, N. S., Gruber, N., Doney, S. C., and Lima, I. D.: En-
hanced CO2 outgassing in the Southern Ocean from a positive
phase of the Southern Annular Mode, Global Biogeochem. Cy.
21, GB2026, doi:10.1029/2006GB002900, 2007.
Lovenduski, N. S., Gruber, N., and Doney, S. C.: Toward a mecha-
nistic understanding of the decadal trends in the Southern Ocean
carbon sink, Global Biogeochem. Cy., 22, 1–9, 2008.
Lucht, W., Prentice, I. C., Myneni, R. B., Sitch, S., Friedlingstein,
P., Cramer, W., Bousquet, P., Buermann, W., and Smith, B.: Cli-
mate control of the high-latitude vegetation greening trend and
Pinatubo effect, Science, 296, 1687–1689, 2002.
Luo, Y. Q., Randerson, J. T., Abramowitz, G., Bacour, C., Blyth,
E., Carvalhais, N., Ciais, P., Dalmonech, D., Fisher, J. B., Fisher,
R., Friedlingstein, P., Hibbard, K., Hoffman, F., Huntzinger, D.,
Jones, C. D., Koven, C., Lawrence, D., Li, D. J., Mahecha, M.,
Niu, S. L., Norby, R., Piao, S. L., Qi, X., Peylin, P., Prentice, I.
C., Riley, W., Reichstein, M., Schwalm, C., Wang, Y. P., Xia, J.
Y., Zaehle, S., and Zhou, X. H.: A framework for benchmarking
land models, Biogeosciences, 9, 3857–3874, doi:10.5194/bg-9-
3857-2012, 2012.
Luyssaert, S., Abril, G., Andres, R., Bastviken, D., Bellassen, V.,
Bergamaschi, P., Bousquet, P., Chevallier, F., Ciais, P., Corazza,
M., Dechow, R., Erb, K.-H., Etiope, G., Fortems-Cheiney, A.,
Grassi, G., Hartmann, J., Jung, M., Lathière, J., Lohila, A., May-
orga, E., Moosdorf, N., Njakou, D. S., Otto, J., Papale, D., Peters,
W., Peylin, P., Raymond, P., Rödenbeck, C., Saarnio, S., Schulze,
E.-D., Szopa, S., Thompson, R., Verkerk, P. J., Vuichard, N.,
Wang, R., Wattenbach, M., and Zaehle, S.: The European land
and inland water CO2, CO, CH4 and N2O balance between
2001 and 2005, Biogeosciences, 9, 3357–3380, doi:10.5194/bg-
9-3357-2012, 2012.
Manning, A. C. and Keeling, R. F.: Global oceanic and land biota
sinks from the Scripps atmospheric oxygen flask sampling net-
work, Tellus B, 58B, 95–116, 2006.
Matear, R. J., Chamberlain, M. A., Sun, C. and Feng, M.: Cli-
mate change projection of the Tasman Sea from an Eddy-
resolving Ocean Model, J. Geophys. Res.-Oceans, 118, 2961–
2976, doi:10.1002/jgrc.20202, 2013.
Matsumoto, K. and Gruber, N.: How accurate is the estima-
tion of anthropogenic carbon in the ocean?, An evaluation
of the DC* method, Global Biogeochem. Cy., 19, GB3014,
doi:10.1029/2004GB002397, 2005.
McDonald, K. C., Kimball, J. S., Njoke, E., Zimmermann, R., and
Zhao, M.: Variability in springtime thaw in the terrestrial high
latitudes: monitoring a major control on the biospheric assimi-
lation of atmospheric CO2 with spaceborne microwave remote
sensing, Earth Interact., 8, 1–23, 2004.
McDowell, N. G, Pockman, W. T., Allen, C. D., Breshears, D. D.,
Cobb, N., Kolb, T., Plaut, J., Sperry, J., West, A., Williams, D.
G., and Yepez, E. A.: Mechanisms of plant survival and mor-
tality during drought: why do some plants survive while others
succumb to drought?. New Phytol., 178, 719–739, 2008.
McGillicuddy Jr, D. J., Robinson, A. R., Siegel, D. A., Jannasch, H.
W., Johnson, R., Dickey, T. D., McNeil, J., Michaels, A. F., and
Knap, A. H.: Influence of mesoscale eddies on new production
in the Sargasso Sea, Nature, 394, 263–266, 1998.
McGuire, A. D., Christensen, T. R., Hayes, D., Heroult, A., Eu-
skirchen, E., Kimball, J. S., Koven, C., Lafleur, P., Miller, P. A.,
Oechel, W., Peylin, P., Williams, M., and Yi, Y.: An assessment
of the carbon balance of Arctic tundra: comparisons among ob-
servations, process models, and atmospheric inversions, Biogeo-
sciences, 9, 3185–3204, doi:10.5194/bg-9-3185-2012, 2012.
McKinley, G. A., Takahashi, T., Buitenhuis, E., Chai, F., Chris-
tian, J. R., Doney, S. C., Jiang, M.-S., Le Quéré, C., Lima, I.,
Linday, K., Moore, J. K., Murtugudde, R., Shi, L., and Wetzel,
P.: North Pacific carbon cycle response to climate variability on
seasonal to decadal timescales. J. Geophys. Res., 111, C07S06,
doi:10.1029/2005JC003173, 2006.
McKinley, G. A., Fay, A. R., Takahashi, T., and Metzl, N: Con-
vergence of atmospheric and North Atlantic carbon dioxide
trends on multidecadal timescales, Nat. Geosci, 4, 606–610,
doi:10.1038/NGEO1193, 2011.
McNeil, B. I. and Matear, R. J.: The non-steady state oceanic CO2
signal: its importance, magnitude and a novel way to detect it,
Biogeosciences, 10, 2219–2228, doi:10.5194/bg-10-2219-2013,
2013.
Mercado, L. M., Bellouin, N., Sitch, S., Boucher, O., Huntingford,
C., and Cox, P. M.: Impact of Changes in Diffuse Radiation on
the Global Land Carbon Sink, Nature, 458, 1014–1017, 2009.
Mikaloff Fletcher, S. E., Gruber, N., Jacobson, A. R., Doney, S.
C., Dutkiewicz, S., Gerber, M., Follows, M., Joos, F., Lindsay,
K., Menemenlis, D., Mouchet, A., Müller, S. A., and Sarmiento,
J. L.: Inverse estimates of anthropogenic CO2 uptake, transport,
and storage by the oceans, Global Biogeochem. Cy., 20, GB2002,
doi:10.1029/2005GB002530, 2006.
Morales, P., Sykes, M. T., Prentice, I. C., Smith, P., Smith, B.,
Bugmann, H., Zierl, B., Friedlingstein, P., Viovy, N., Sabaté,
S., Sánchez, A., Pla, E., Gracia, C. A., Sitch, S., Arneth, A.,
and Ogee, J.: Comparing and evaluating process-based ecosys-
tem model predictions of carbon and water fluxes in major
European forest biomes, Glob. Change Biol., 11, 2211–2233,
doi:10.1111/j.1365-2486.2005.01036.x, 2005.
Myneni, R. B., Keeling, C. D., Tucker, C. J., Asrar, G., and Nemani,
R. R.: Increased plant growth in the northern high latitudes from
1981 to 1991, Nature, 386, 698–702, doi:10.1038/386698a0,
1997.
Murray-Tortarolo, G., Anav, A., Friedlingstein, P., Sitch, S., Piao,
S., Zhu, Z., Poulter, B., Zaehle, S., Ahlstrom, A., Lomas, M.,
Levis, S., Viovy, N., and Zeng, N.: Evaluation of DGVMs
in reproducing satellite derived LAI over the Northern Hemi-
sphere, Part I: Uncoupled DGVMs, Remote Sens., 5, 4819–4838;
doi:10.3390/rs5104819, 2013.
Müller, S. A., Joos, F., Plattner, G.-K., Edwards, N. R., and Stocker,
T. F.: Modeled natural and excess radiocarbon: Sensitivities
to the gas exchange formulation and ocean transport strength,
Global Biogeochem. Cy., 22, doi:10.1029/2007GB003065,
2008.
Nemani, R. R., Keeling, C. D., Hashimoto, H., Jolly, W. M., Piper,
S. C., Tucker, C. J., Myneni, R. B., and Running, S. W.: Climate-
driven increases in global terrestrial net primary production from
1982 to 1999, Science, 300, 1560–1563, 2003.
New, M. G., Hulme, M., and Jones, P. D.: Representing twentieth-
century space-climate variability, Part II, Development of 1901–
1996 monthly grids of terrestrial surface climate, J. Climate, 13,
2217–2238, 2000.
Biogeosciences, 12, 653–679, 2015 www.biogeosciences.net/12/653/2015/
S. Sitch et al.: Recent trends and drivers of regional sources 677
Norby, R. J., DeLucia, E. H., Gielen, B., Calfapietra, C., Giardina,
C. P., King, J. S., Ledford, J., McCarthy, H. R., Moore, D. J. P.,
Ceulemans, R., De Angelis, P., Finzi, A. C., Karnosky, D. F., Ku-
biske, M. E., Lukac, M., Pregitzer, K. S., Scarascia-Mugnozza,
G. E., Schlesinger, W. H., and Oren, R.: Forest response to ele-
vated CO2 is conserved across a broad range of productivity, P.
Natl. Acad. Sci. USA, 102, 18052–18056, 2005.
Norby, R. J., Warren, J. M., Iversen, C. M., Medlyn, B. E., and
McMurtrie, R. E.: CO2 enhancement of forest productivity con-
strained by limited nitrogen availability, P. Natl. Acad. Sci., 107,
19368–19373, 2010.
Oleson, K. W., Lawrence, D. M., Bonan, G. B., Flanner, M. G.,
Kluzek, E., Lawrence, P. J., Levis, S., Swenson, S. C., and Thorn-
ton, P. E.: Technical description of version 4.0 of the Community
Land Model (CLM), NCAR Tech. Note NCAR/TN-478+STR,
257 pp., 2010.
Pacala, S. W., Hurtt, G. C., Baker, D., Peylin, P., Houghton, R. A.,
Birdsey, R. A., Heath, L., Sundquist, E. T., Stallard, R. F., Ciais,
P., Moorcroft, P., Caspersen, J. P., Shevliakova, E., Moore B.,
Kohlmaier, G., Holland, E., Gloor, M., Harmon, M. E., Fan, S.-
M., Sarmiento, J. L., Goodale, C. L., Schimel, D., and Field, C.
B.: Consistent land- and atmosphere-based US carbon sink esti-
mates, Science, 292, 2316–2320, 2001.
Pan, Y., Birdsey, R.A., Fang, J., Houghton, R., Kauppi, P. E., Kurz,
W. A., Phillips, O. L., Shvidenko, A., Lewis, S. L., Canadell, J.
G., Ciais, P., Jackson, R. B., Pacala, S., McGuire, A. D., Piao, S.,
Rautiainen, A., Sitch, S., Hayes, D., and Watson, C.: A large and
persistent carbon sink in the World’s forests, 1990–2007, Sci-
ence, doi:10.1126/science.1201609, 2011.
Park, G.-H., Wanninkhof, R., Doney, S. C., Takahashi, T., Lee, K.,
Feely, R. A., Sabine, C. L., Triñanes, J., and Lima, I. D.: Variabil-
ity of global net sea-air CO2 fluxes over the last three decades
using empirical relationships, Tellus B, 62, 352–368, 2010.
Patra, P. K., Canadell, J. G., Houghton, R. A., Piao, S. L., Oh, N.-H.,
Ciais, P., Manjunath, K. R., Chhabra, A., Wang, T., Bhattacharya,
T., Bousquet, P., Hartman, J., Ito, A., Mayorga, E., Niwa, Y., Ray-
mond, P. A., Sarma, V. V. S. S., and Lasco, R.: The carbon budget
of South Asia, Biogeosciences, 10, 513–527, doi:10.5194/bg-10-
513-2013, 2013.
Peacock, S.: Debate over the ocean bomb radiocarbon sink:
Closing the gap, Global Biogeochem. Cy., 18, GB2022,
doi:10.1029/2003GB002211, 2004.
Peng S., Ciais, P., Chevallier, F., Peylin, P., Cadule, P., Sitch,
S., Piao, S., Ahlström, A., Levy, P., Lomas, M., Poulter, B.,
Viovy, N., Wang, T., Zaehle, S., Zeng, N., Zhao, F. and Zhao,
H.: Benchmarking the seasonal cycle of CO2 fluxes simulated
by terrestrial ecosystem models, Global Biogeochem. Cy., 29,
doi:10.1002/2014GB004931, 2014.
Peylin, P., Bousquet, P., Le Quéré, C., Sitch, S., Friedling-
stein, P., McKinley, G., Gruber, N., Rayner, P., and Ciais,
P.: Multiple constraints on regional CO2 flux variations over
land and oceans, Global Biogeochem. Cy., 19, GB1011,
doi:10.1029/2003GB002214, 2005.
Peylin, P., Law, R. M., Gurney, K. R., Chevallier, F., Jacobson,
A. R., Maki, T., Niwa, Y., Patra, P. K., Peters, W., Rayner, P.
J., Rödenbeck, C., van der Laan-Luijkx, I. T., and Zhang, X.:
Global atmospheric carbon budget: results from an ensemble of
atmospheric CO2 inversions, Biogeosciences, 10, 6699–6720,
doi:10.5194/bg-10-6699-2013, 2013.
Pfeil, B., Olsen, A., Bakker, D. C. E., Hankin, S., Koyuk, H., Kozyr,
A., Malczyk, J., Manke, A., Metzl, N., Sabine, C. L., Akl, J.,
Alin, S. R., Bates, N., Bellerby, R. G. J., Borges, A., Boutin,
J., Brown, P. J., Cai, W.-J., Chavez, F. P., Chen, A., Cosca, C.,
Fassbender, A. J., Feely, R. A., González-Dávila, M., Goyet,
C., Hales, B., Hardman-Mountford, N., Heinze, C., Hood, M.,
Hoppema, M., Hunt, C. W., Hydes, D., Ishii, M., Johannessen,
T., Jones, S. D., Key, R. M., Körtzinger, A., Landschützer, P.,
Lauvset, S. K., Lefèvre, N., Lenton, A., Lourantou, A., Merlivat,
L., Midorikawa, T., Mintrop, L., Miyazaki, C., Murata, A., Naka-
date, A., Nakano, Y., Nakaoka, S., Nojiri, Y., Omar, A. M., Padin,
X. A., Park, G.-H., Paterson, K., Perez, F. F., Pierrot, D., Poisson,
A., Ríos, A. F., Santana-Casiano, J. M., Salisbury, J., Sarma, V. V.
S. S., Schlitzer, R., Schneider, B., Schuster, U., Sieger, R., Skjel-
van, I., Steinhoff, T., Suzuki, T., Takahashi, T., Tedesco, K., Tel-
szewski, M., Thomas, H., Tilbrook, B., Tjiputra, J., Vandemark,
D., Veness, T., Wanninkhof, R., Watson, A. J., Weiss, R., Wong,
C. S., and Yoshikawa-Inoue, H.: A uniform, quality controlled
Surface Ocean CO2 Atlas (SOCAT), Earth Syst. Sci. Data, 5,
125–143, doi:10.5194/essd-5-125-2013, 2013.
Phillips, O. L., Malhi, Y., Higuchi, N., Laurance, W. F., Nunez, P.
V., Vasquez, R. M., Laurance, S. G., Ferreira, L. V., Stern, M.,
Brown, S., and Grace, J.: Changes in the carbon balance of trop-
ical forests: Evidence from long-term plots, Science, 282, 439–
442, 1998.
Piao, S. L., Fang, J. Y., Ciais, P., Peylin, P., Huang, Y., Sitch, S., and
Wang, T: The carbon balance of terrestrial ecosystems in China,
Nature, 458, 1009–1014, 2009.
Piao, S. L., Sitch, S., Ciais, P., Friedlingstein, P., Peylin, P., Wang,
X. H., Ahlström, A., Anav, A., Canadell, J. G., Huntingford, C.,
Jung, M., Levis, S., Levy, P. E., Li, J. S., Lin, X., Lomas, M. R.,
Lu, M ., Luo, Y. Q., Ma, Y. C., Myneni, R. B., Poulter, B., Sun, Z.
Z., Wang, T., Viovy, N., Zaehle, S., and Zeng, N.: Evaluation of
terrestrial carbon cycle models for their response to climate vari-
ability and to CO2 trends, Glob. Change Biol., 19, 2117–2132,
2013.
Pongratz, J., Reick, C. H., Houghton, R. A., and House, J. I.: Ter-
minology as a key uncertainty in net land use and land cover
change carbon flux estimates, Earth Syst. Dynam., 5, 177–195,
doi:10.5194/esd-5-177-2014, 2014.
Poulter, B., Frank, D. C., Hodson, E. L., and Zimmermann, N.
E.: Impacts of land cover and climate data selection on un-
derstanding terrestrial carbon dynamics and the CO2 airborne
fraction, Biogeosciences, 8, 2027–2036, doi:10.5194/bg-8-2027-
2011, 2011.
Poulter, B., Pederson, N., Liu, H., Zhu, Z., D’Arrigo, R., Ciais, P.,
Davi, N., Frank, D., Leland, C., Myneni, R., Piao, S., and Wang,
T.: Recent trends in Inner Asian forest dynamics to temperature
and precipitation indicate high sensitivity to climate change, Agr.
Forest Meteorol., 178–179, 31–45, 2013.
Poulter, B., Frank, D., Ciais, P., Myneni, R., Andela, N., Bi, J., Bro-
quet, G., Canadell, J. G., Chevallier, F., Liu, Y. Y., Running, S.
W., Sitch, S. and van der Werf, G. R.: Contribution of semi-arid
ecosystems to interannual variability of the global carbon cycle,
Nature, doi:10.1038/nature13376, 2014.
Prentice I. C., Farquhar, G. D., Fasham, M. J. R., Goulden, M. L.,
Heimann, M., Jaramillo, V.J., Kheshgi, H. S., Le Quere, C., Sc-
holes, R. J., Wallace, D. W. R., Contributing Authors Archer,
D., Ashmore, M. R., Aumont, O., Baker, D., Battle, M., Bender,
www.biogeosciences.net/12/653/2015/ Biogeosciences, 12, 653–679, 2015
678 S. Sitch et al.: Recent trends and drivers of regional sources
M., Bopp, L. P., Bousquet, P., Caldeira, K., Ciais, P., Cox, P. M.,
Cramer, W., Dentener, F., Enting, I. G., Field, C. B., Friedling-
stein, P., Holland, E. A., Houghton, R. A., House, J. I., Ishida, A.,
Jain, A. K., Janssens, I. A., Joos, F., Kaminski, T., Keeling, C.
D., Keeling, R. F., Kicklighter, D. W., Kohfeld, K. E., Knorr, W.,
Law, R., Lenton, T. , Lindsay, K., Maier-Reimer, E., Manning,
A. C., Matear, R. J., McGuire, A. D., Melillo, J. M., Meyer, R.,
Mund, M., Orr, J. C., Piper, S., Plattner, K., Rayner, P. J., Sitch,
S., Slater, R., Taguchi, S. , Tans, P. P., Tian, H. Q., Weirig, M.
F., Whorf, T., and Yool, A.: The carbon cycle and atmospheric
carbon dioxide, in. Climate Change 2001: The Scientific Basis
edited by: Houghton, J. T., Cambridge Univ. Press, New York,
183–237, 2001.
Prentice, I. C., Bondeau, A., Cramer, W., Harrison, S. P., Hickler,
T., Lucht, W., Sitch, S., Smith, B., and Sykes, M. T.: Terrestrial
Ecosystems in a changing world, IGBP Book Series, edited by:
Canadell. J., Pitelka, L., and Pataki, D., Springer, Heidelberg,
Germany, pp. 336, 2007.
Quaife, T., Quegan, S., Disney, M., Lewis, P., Lomas, M. R., and
Woodward, F. I.: Impact of land cover uncertainties on esti-
mates of biospheric carbon fluxes, Global Biogeochem. Cy., 22,
GB4016, doi:10.1029/2007GB003097, 2008.
Randerson, J. T., Hoffman, F. M., Thornton, P. E., Mahowald, N.
M., Lindsay, K., Lee, Y.-H., Nevison, C. D., Doney, S. C., Bo-
nan, G., Stoeckli, R., Covey, C., Running, S. W., and Fung, I.
Y.: Systematic assessment of terrestrial biogeochemistry in cou-
pled climate-carbon models, Glob. Change Biol., 15, 2462–2484,
2009.
Raupach, M. R., Canadell, J. G., and Le Quéré, C.: Anthropogenic
and biophysical contributions to increasing atmospheric CO2
growth rate and airborne fraction, Biogeosciences, 5, 1601–1613,
doi:10.5194/bg-5-1601-2008, 2008.
Raupach, M. R., Gloor, M., Sarmiento, J. L., Canadell, J. G.,
Frölicher, T. L., Gasser, T., Houghton, R. A., Le Quéré, C.,
and Trudinger, C. M.: The declining uptake rate of atmospheric
CO2 by land and ocean sinks, Biogeosciences, 11, 3453–3475,
doi:10.5194/bg-11-3453-2014, 2014.
Reichstein, M., Bahn, M., Ciais, P., Frank, D., Mahecha, M. D.,
Seneviratne, S. I., Zscheischler, J., Beer, C., Buchmann, N.,
Frank, D. C., Papale, D., Rammig, A., Smith, P., Thonicke, K.,
van der Velde, M., Vicca, S., Walz, A., and Wattenbach, M.: Cli-
mate extremes and the carbon cycle, Nature, 500, 287–295, 2013.
Roy, T., Bopp, L., Gehlen, M., Schneider, B., Cadule, P., Frölicher,
T. L., Segschneider, J., Tjiputra, J., Heinze, C., and Joos, F.:
Regional Impacts of Climate Change and Atmospheric CO2 on
Future Ocean Carbon Uptake: A Multimodel Linear Feedback
Analysis, J. Climate, 24, 2300–2318, 2011.
Sabine, C. S., Feely, R. A.., Gruber, N. , Key, R. M., Lee, K., Bullis-
ter, J. L., Wanninkhof, R., Wong, C. S., Wallace, D. W. R., Till-
brook, B., Millero, F. J., Peng, T.-H., Kozyr, A., Ono, T., and
Rios, A. F.: The oceanic sink for anthropogenic CO2, Science,
305, 367–371, 2004.
Sarmiento, J. L. and Gruber, N.: Sinks for anthropogenic carbon,
Phys. Today, 55, 30–36, 2002.
Sarmiento, J. L. and Gruber, N.: Ocean Biogeochemical Dynamics,
Princeton Univ. Press, 526 pp., 2006.
Sarmiento, J. L., Orr, J. C., and Siegenthaler, U.: A perturbation
simulation of CO2 uptake in an ocean general circulation model,
J. Geophys. Res., 97, 3621–3645, 1992.
Sarmiento, J. L., Gloor, M., Gruber, N., Beaulieu, C., Jacobson, A.
R., Mikaloff Fletcher, S. E., Pacala, S., and Rodgers, K.: Trends
and regional distributions of land and ocean carbon sinks, Bio-
geosciences, 7, 2351–2367, doi:10.5194/bg-7-2351-2010, 2010.
Schuster, U., McKinley, G. A., Bates, N., Chevallier, F., Doney,
S. C., Fay, A. R., González-Dávila, M., Gruber, N., Jones, S.,
Krijnen, J., Landschützer, P., Lefèvre, N., Manizza, M., Mathis,
J., Metzl, N., Olsen, A., Rios, A. F., Rödenbeck, C., Santana-
Casiano, J. M., Takahashi, T., Wanninkhof, R., and Watson, A.
J.: An assessment of the Atlantic and Arctic sea-air CO2 fluxes,
1990–2009, Biogeosciences, 10, 607–627, doi:10.5194/bg-10-
607-2013, 2013.
Sitch, S., Smith, B., Prentice, I. C., Arneth, A., Bondeau, A.,
Cramer, W., Kaplan, J. O., Levis, S., Lucht, W., Sykes, M. T.,
Thonicke, K., and Venevsky, S.: Evaluation of ecosystem dynam-
ics, plant geography and terrestrial carbon cycling in the LPJ dy-
namic global vegetation model, Glob. Change Biol., 9, 161–185,
doi:10.1046/j.1365-2486.2003.00569.x, 2003.
Sitch, S., McGuire, A. D., Kimball, J., Gedney, N., Gamon, J., En-
gstrom, R., Wolf, A., Zhuang, Q., Clein, J. S., and McDonald,
K. C.: Assessing the carbon balance of circumpolar arctic tun-
dra using remote sensing and process modeling, Ecol. Appl., 17,
213–234, 2007a.
Sitch, S., Cox, P. M., Collins, W. J., and Huntingford., C.:
Indirect radiative forcing of climate change through ozone
effects on the land-carbon sink, Nature, 448, 791–794,
doi:10.1038/nature06059, 2007b.
Sitch, S., Huntingford, C., Gedney, N., Levy, P. E., Lomas, M., Piao,
S., Betts, R., Ciais, P., Cox, P., Friedlingstein, P., Jones, C. D.,
Prentice, I. C., and Woodward, F. I.: Evaluation of the terres-
trial carbon cycle, future plant geography, and climate-carbon
cycle feedbacks using 5 Dynamic Global Vegetation Models
(DGVMs), Glob. Change Biol., 14 1–25, doi:10.1111/j.1365-
2486.2008.01626.x, 2008.
Smith, B., Prentice, I. C., and Sykes, M. T.: Representation of
vegetation dynamics in the modelling of terrestrial ecosystems:
comparing two contrasting approaches within European climate
space, Global Ecol. Biogeogr., 10, 621–637, 2001.
Sokolov, A. P., Kicklighter, D. W., Melillo, J. M., Felzer, B. S.,
Schlosser, C. A., and Cronin, T. W.: Consequences of consid-
ering carbon-nitrogen interactions on the feedbacks between cli-
mate and the terrestrial carbon cycle, J. Climate, 21, 3776–3796,
doi:10.1175/2008JCLI2038.1, 2008.
Stocker, B. D., Feissli, F., Strassmann, K. M., Spahni, R., and
Joos, F.: Past and future carbon fluxes from land use change,
shifting cultivation and wood harvest, Tellus B, 66, 23188,
doi:10.3402/tellusb.v66.23188, 2014.
Stephens, B. B., Gurney, K. R., Tans, P. P., Sweeney, C., Peters, W.,
Bruhwiler, L., Ciais, P., Ramonet, M., Bousquet, P., Nakazawa,
T., Aoki, S., Machida, T., Inoue, G., Vinnichenko, N., Lloyd,
J., Jordan, A., Heimann, M., Shibistova, O., Langenfelds, R. L.,
Steele, L. P., Francey, R. J., and Denning, A. S.: Weak northern
and strong tropical land carbon uptake from vertical profiles of
atmospheric CO2, Science, 316, 1732–1735, 2007.
Sweeney, C., Gloor, E., Jacobson, A. R., Key, R. M., McKin-
ley, G., Sarmiento, J. L., and Wanninkhof, R.: Constrain-
ing global air-sea gas exchange for CO2 with recent bomb14C measurements, Global Biogeochem. Cycl., 21, GB2015,
doi:10.1029/2006GB002784, 2007.
Biogeosciences, 12, 653–679, 2015 www.biogeosciences.net/12/653/2015/
S. Sitch et al.: Recent trends and drivers of regional sources 679
Takahashi, T., Sutherland, S. C., Wanninkhof, R., Sweeney, C.,
Feely, R. A., Chipman, D., Hales, B., Friederich, G., Chavez,
F., Sabine, C., Watson, A., Bakker, D. C. E., Schuster, U., Metzl,
N., Yoshikawa-Inoue, H., Ishii, M., Midorikawa, T., Nojiri, Y.,
Kortzinger, A., Steinhoff, T., Hoppema, M., Olafsson, J., Arnar-
son, T. S., Tilbrook, B., Johannessen, T., Olsen, A., Bellerby, R.,
Wong, C. S., Delille, B., Bates, N. R., and de Baar, H. J. W.: Cli-
matological mean and decadal changes in surface ocean pCO2,
and net sea-air CO2 flux over the global oceans, SOCOVV Sym-
posium Volume, Deep Sea Res.-Pt. II, 810, 554–577, 2009.
Tans, P. P., Fung, I. Y., and Takahashi, T.: Observational constraints
on the global atmospheric CO2 budget, Science, 247, 1431–
1439, doi:10.1126/science.247.4949.1431, 1990.
Thornton, P. E., Lamarque, J. F., Rosenbloom, N. A., and
Mahowald, N. M.: Influence of carbon-nitrogen cycle cou-
pling on land model response to CO2 fertilization and
climate variability, Global Biogeochem. Cy., 21, GB4018,
doi:10.1029/2006GB002868, 2007.
Thornton, P. E., Doney, S. C., Lindsay, K., Moore, J. K., Ma-
howald, N., Randerson, J. T., Fung, I., Lamarque, J.-F., Fed-
dema, J. J., and Lee, Y.-H.: Carbon-nitrogen interactions regu-
late climate-carbon cycle feedbacks: results from an atmosphere-
ocean general circulation model, Biogeosciences, 6, 2099–2120,
doi:10.5194/bg-6-2099-2009, 2009.
Tjiputra, J. F., Assmann, K., and Heinze, C.: Anthropogenic car-
bon dynamics in the changing ocean, Ocean Science, 6, 605–614,
2010.
Tucker, C. J., Slayback, D. A., Pinzon, J. E., Los, S. O., Myneni,
R. B., and Taylor, M. G.: Higher northern latitude normalized
difference vegetation index and growing season trends from 1982
to 1999, Int. J. Biometeorol., 45, 184–190, 2001.
Valentini, R., Arneth, A., Bombelli, A., Castaldi, S., Cazzolla Gatti,
R., Chevallier, F., Ciais, P., Grieco, E., Hartmann, J., Henry, M.,
Houghton, R. A., Jung, M., Kutsch, W. L., Malhi, Y., Mayorga,
E., Merbold, L., Murray-Tortarolo, G., Papale, D., Peylin, P.,
Poulter, B., Raymond, P. A., Santini, M., Sitch, S., Vaglio Laurin,
G., van der Werf, G. R., Williams, C. A., and Scholes, R. J.: A full
greenhouse gases budget of Africa: synthesis, uncertainties, and
vulnerabilities, Biogeosciences, 11, 381–407, doi:10.5194/bg-
11-381-2014, 2014.
Van der Molen, M. K., Dolman, A. J., Ciais, P., Eglin, T., Gob-
ron, N., Law, B. E., Meir, P., Peters, W., Phillips, O. L., Reich-
stein, M., Chen, T., Dekker, S. C., Doubková, M., Friedl, M. A.,
Jung, M., van den Hurk, B. J. J. M., de Jeu, R. A. M., Kruijt, B.,
Ohta, T., Rebel, K. T., Plummer, S., Seneviratne, S. I., Sitch, S.,
Teuling, A. J., van der Werf, G. R., and Wang, G.: Drought and
ecosystem carbon cycling, Agr. Forest Meteorol., 151, 765–773,
doi:10.1016/j.agrformet.2011.01.018, 2011.
Vitousek, P. M. and Howarth, R. W.: Nitrogen limitation on land
and in the sea: How can it occur?, Biogeochemistry, 13, 87–115,
1991.
Wang, Y. P., Law, R. M., and Pak, B.: A global model of carbon,
nitrogen and phosphorus cycles for the terrestrial biosphere, Bio-
geosciences, 7, 2261–2282, doi:10.5194/bg-7-2261-2010, 2010.
Wanninkhof, R.: Relationship between wind speed and gas ex-
change over the ocean, J. Geophys. Res., 97, 7373–7382, 1992.
Wanninkhof, R., Park, G. -H., Takahashi, T., Sweeney, C., Feely, R.,
Nojiri, Y., Gruber, N., Doney, S. C., McKinley, G. A., Lenton,
A., Le Quéré, C., Heinze, C., Schwinger, J., Graven, H., and
Khatiwala, S.: Global ocean carbon uptake: magnitude, variabil-
ity and trends, Biogeosciences, 10, 1983–2000, doi:10.5194/bg-
10-1983-2013, 2013.
Woodward, F. I. and Lomas, M. R.: Vegetation-dynamics-
simulating responses to climate change, Biological Reviews, 79,
643–670, 2004.
Woodward, F. I., Smith, T. M., Emanuel, W. R.: A global land
primary productivity and phytogeography model. Global Bio-
geochem. Cy., 9, 471–490, 1995.
Zaehle, S. and Friend, A. D.: Carbon and nitrogen cycle dynamics
in the O-CN land surface model, I: Model description, site- scale
evaluation and sensitivity to parameter estimates, Global Bio-
geochem. Cy., 24, GB1005, doi:10.1029/2009GB003521, 2010.
Zaehle, S. and Dalmonech, D.: Carbon – nitrogen interactions on
land at global scales: current understanding in modeling climate
biosphere feedbacks, Current Opinion in Environmental Sustain-
ability, 3, 311–320, 2011.
Zaehle, S., Friedlingstein, P., and Friend, A. D.: Terrestrial nitrogen
feedbacks may acccelerate future climate change, Geophys. Res.
Lett., 37, L01401, doi:10.1029/2009GL041345, 2010.
Zaehle, S., Ciais, P., Friend, A. D., and Prieur, V.: Carbon benefits
of anthropogenic reactive nitrogen offset by nitrous oxide emis-
sions, Nat. Geosci., 4, 601–605, doi:10.1038/ngeo1207, 2011.
Zaehle, S., Medlyn, B. E., De Kauwe, M. G., Walker, A. P., Dietze,
M. C., Hickler, T., Luo, Y., Wany, Y.-P., El-Masri, B., Thornton,
P., Jain, A., Wang, S., Warlind, D., Weng, E., Parton, W., Iversen,
C. M., Gallet-Budynek, A., McCarthy, H., Finzi, A., Hanson,
P. J., Prentice, I. C., Oren, R., and Norby, R. J.: Evaluation of
eleven terrestrial carbon-nitrogen cycle models against obser-
vations from two temperate Free-Air CO2 Enrichment Studies,
New Phytologist, 202, 803–822, doi:10.1111/nph.12697, 2014.
Zeng, N.: Glacial-interglacial atmospheric CO2 change – The
glacial burial hypothesis, Adv. Atmos. Sci., 20, 677–673, 2003.
Zeng, N., Mariotti, A., and Wetzel, P.: Terrestrial mechanisms of in-
terannual CO2 variability, Global Biogeochem. Cy., 19, GB1016,
doi:10.1029/2004gb002273, 2005.
Zhang, Q., Wang, Y. P., Matear, R. J., Pitman, A. J., and Dai, Y.
J.: Nitrogen and phosphorous limitations significantly reduce fu-
ture allowable CO2 emissions, Geophys. Res. Lett, 41, 632–637,
doi:10.1002/2013GL058352, 2014.
Zhu, Z., Bi, J., Pan, Y., Ganguly, S., Anav, A., Xu, L., Samanta, A.,
Piao, S., Nemani, R. R., and Myneni, R. B.: Global Data Sets of
Vegetation Leaf Area Index (LAI)3g and Fraction of Photosyn-
thetically Active Radiation (FPAR)3g Derived from Global In-
ventory Modeling and Mapping Studies (GIMMS) Normalized
Difference Vegetation Index (NDVI3g) for the Period 1981 to
2011, Remote Sens., 5, 927–948, 2013.
Zscheischler, J., Mahecha, M. D., von Buttlar, J., Harmeling,
S., Jung, M., Rammig, A., Randerson, J. T., Schoelkopf, B.,
Seneviratne, S. I., Tomelleri, E., Zaehle, S., and Reichstein, M.:
A few extreme events dominate global interannual variability
in gross primary production, Environ. Res. Lett., 9, 035001,
doi:10.1088/1748-9326/9/3/035001, 2014.
www.biogeosciences.net/12/653/2015/ Biogeosciences, 12, 653–679, 2015