Embed Size (px)
Citation preview
Inaugural Gamani Corea Memorial Lecture
Recent Trends in International Trade:Implications for Sri Lanka
by
Saman Kelegama
3 November 2014
GAMANI COREA FOUNDATION
Inaugural Gamani Corea Memorial Lecture
Recent Trends in International Trade:Implications for Sri Lanka
by
Saman Kelegama
3 November 2014
at the
Lakshman Kadirgamar Institute of International Relations andStrategic Studies
Organized by the
GAMANI COREA FOUNDATION
1
RECENT TRENDS IN INTERNATIONAL TRADE: IMPLICATIONS FOR SRI LANKA
Inaugural Gamani Corea Memorial Lecture
Gamani Corea was a unique person who made a lasting impression both in Sri Lanka and overseas. His outstanding contribution to development policy and practice was recognized in Sri Lanka, evidenced by a number of prestigious awards he was awarded, including Deshamanya (1987), Visva Prasadani (1996), Lanka Abimanaya (2003) and the Shabdeen Award (2005). The international image that Gamani Corea built over the years was equally powerful and is best described by the following quotation of the late Minister of Foreign Affairs of Sri Lanka, Lakshman Kadirgamar. His reference was to Gamani Corea holding the position of the Secretary-General of the UNCTAD. “Within weeks of his assuming office, it became clear that he was going to wield significant influence on the development of international economic affairs. His public presentations and speeches were fluent, clear, and elegantly phrased. They drew the admiration of the entire global economic community. They certainly made all the Asian delegations, indeed all Third World delegations extremely proud because in Gamani Corea they had found a man who walked tall, stood his ground and was more than a match for his interlocutors from the developed countries.” (Kadirgamar, 2002: 8). Gamani Corea was the recipient of a number of international awards too, including the ‘Order of Yugoslavia Flag of Ribbon’ in 1985 for promoting international understanding on development issues and the Brazilian Celso Furtado Award in
2
2004 for his enduring struggle for political and economic independence of developing countries. The breadth and depth of his knowledge on development issues and his concern to find practical measures and appropriate national and international policies to try to resolve the many problems confronting developing countries have been widely recognized. In particular, he pursued the idea of international economic reforms that could give the world's poorer nations a better chance of long-term development and more effective results from trade, and paid particular attention to the problems and needs of the Least Developed Countries (LDCs), arguing that they had special concerns and warranted special consideration. Accordingly, he focused on achieving better results for poor countries from trade in commodities. The implications of terms of trade (TOT) deterioration1 for the development efforts of commodity-dependent developing countries was a dominant theme throughout his career. It is he who initiated the annual Trade and Development Report of the UNCTAD in the early 1980s to highlight the issues that the developing countries are facing in global trading. Given his deep passion for trade and development issues, the developments in international trade policy in today’s modern world and its implications for developing countries, including, of course, his home country, would have profoundly engaged his interests. Indeed, I have chosen to focus on this very issue in my lecture today, where I will examine the recent trends in international trade and its implications for Sri Lanka.
1 Terms of trade refer to the value of a country's exports relative to that of its imports. It is calculated by dividing the value of exports by the value of imports, then multiplying the result by 100.
3
1. Recent Trends in International Trade 1.1 Historical Overview A key concern in development circles during the 1950s and 1960s was the rapid decline in TOT for primary commodity exports in developing countries. Decolonization did not automatically bring about a transformation of domestic and international economic structures, and thus developing countries, including Sri Lanka, continued to be heavily dependent on their commodity exports.2 One important theoretical framework proposed in this context was the Prebisch-Singer thesis on ‘TOT pessimism’ of exports (Prebisch, 1950 and Singer, 1950).3 The steep fall in Sri Lanka’s TOT following the ending of the tea boom in 1956 did in fact support this thesis. The World Bank’s World Development Review (1982) has a box on Sri Lanka citing it as a classic example of a country that experienced dramatic TOT declines over 25 years. However, the dramatic shift in the stance of development policy in the early 1970s, with import-substitution being replaced by manufacturing export-led growth driven by East Asian countries, showed that the ‘TOT pessimism’ on exports is to some degree unfounded – that primary-exporting developing countries can achieve TOT gains through diversification into manufactured exports. Indeed, with the embracement of export-led industrialization policies in the late 1970s, this was the experience of Sri Lanka too. An empirical analysis conducted by Athukorala (2004) shows that diversification into manufacturing from structurally weak conventional
2 At this time Sri Lanka was almost entirely dependent on the plantation crops of tea, rubber and coconut for its export revenue. 3This thesis postulates that terms of trade, between primary products and manufactured goods, deteriorate in time. Therefore (developing) countries that export commodities would in time import fewer manufactured goods relative to a given level of exports.
4
commodities has enabled the country to escape from the unequal exchange relations in world trade. Over the years, manufacturing exports based on comparative advantage – mainly in East and Southeast Asian economies – have seen changes from low cost labour to skilled labour to value addition.4 The increased focus on movements in value added, rather than trade flows, accounts for a key development in the recent trade environment – the forming of global and regional value chains. 1.2 Development of Global Value Chains Since its development in the mid-1990s, global value chains (GVCs)5 involving the entire process of producing goods, from raw materials to finished products, have become a central feature of the world economy. International trade is becoming increasingly unbundled, with countries now trading in tasks such as design and assembly rather than in goods. Goods are now being ‘made in the world’ instead of in one country, with parts and components being traded several times across borders before the final product reaches the final consumer. This development was brought about with the increasing emergence of Multinational Enterprises (MNEs), where they obtained various components of the value chain manufactured by different countries and fully assembled the product. While MNE organized GVCs account for 80 per cent of global trade, OECD, WTO and UNCTAD (2013) estimate that the contribution
4 Value added is the amount by which the value of a product is increased at each stage of production, excluding the value of intermediate inputs to that good. 5A global value chain refers to the full range of cross-border value added business activities, which are required to bring a product or service from its conception through design, sourcing raw materials and intermediate inputs, production, marketing, distribution and support to the final consumer.
5
of local firms is considerable, in the range of 40-50 per cent of export value added. At present, about 60 per cent of global trade (over US$ 20 trillion) consists of trade in intermediate goods and services (UNCTAD, 2013). The import content of exports has increased from 20 per cent in the 1990s to a current level of 40 per cent, which the WTO projects to reach 60 per cent by 2030 (WTO, 2013, cited in Standard Chartered Bank, 2014). A striking feature of GVCs is that they include countries at all levels of development, from the poorest to the most developed. Production of goods and services takes place wherever the required skills and inputs are available at a competitive cost and quality. The wide-ranging nature of GVCs has been possible owing to technological advances – such as the container ship and ICT technologies – that have reduced trade and coordination costs. The expansion of operations of MNEs through foreign direct investment (FDI) has also been a major driver of growth of GVCs. The presence of foreign partners is an important factor influencing both imported contents in exports and participation in international production networks (OECD, WTO and UNCTAD, 2013). Some important examples of industries that have become a part of GVCs include the electronics and transport equipment industries, which involve long and sophisticated value chains. Besides these two industries, all manufacturing activities and an increasing number of services sectors also depend on imported inputs. For example, in industries such as mining, textiles and apparel or machinery, more than one-third of imported intermediate inputs are used to produce exports, while some services sectors, such as distribution (wholesale and retail trade), transport, and telecommunication also have high shares (OECD, WTO and UNCTAD, 2013).
6
This growing product fragmentation across borders has important implications for trade and investment patterns and policies and also offers new prospects for growth, development and employment (OECD, WTO and UNCTAD, 2013). For instance, the income from trade flows within GVCs has doubled between 1995 and 2009 (OECD, WTO and UNCTAD, 2013). For China, the increase has been six-fold; for India, five-fold. Income growth has in turn translated to more job growth: in Germany, jobs associated with GVCs have doubled to about 10 million jobs between 1995 and 2008 (OECD, WTO and UNCTAD, 2013). It is encouraging to note that a majority of developing countries are increasingly participating in GVCs. The developing-country share in global value added trade has increased from 20 per cent in 1990 to 30 per cent in 2000 to over 40 per cent today (UNCTAD, 2013a). However, many poorer developing countries are still struggling to gain access to GVCs beyond natural resource exports. Regional value chain links can be easier as well as more important for developing countries to get involved in; but unlike well-developed regional chains in East and Southeast Asia,6 North America and Europe, less developed regions (South Asia, Latin America and Africa) are yet to develop value chains. While GVCs can be an important means of building productive capacity for developing countries, particularly by domestic firms capturing a significant share of the value added, active participation in GVCs requires technology dissemination, skill building and well-developed infrastructure, which calls for significant investment. It also highlights the need for countries
6Over the past decades, East Asia has been the most successful region in the world in building up cross-border supply chains and has subsequently become described as “Factory Asia”.
7
to minimize tariffs and other non-tariff barriers which affect foreign suppliers, investors and domestic producers, and to maintain open, transparent and predictable trade and investment regimes. 1.3 Increased Emphasis on Trade Facilitation The successful participation of countries in GVCs depends crucially, among many other factors, on trade facilitation (TF).7 Since goods cross borders multiple times, first as inputs and then as final products, fast and efficient customs and port procedures are vital in ensuring the smooth operation of supply chains (OECD, WTO and UNCTAD, 2013). When foreign firms seek to outsource various production stages, a country where inputs can be imported and exported within a quick and reliable timeframe will be a far more attractive location compared to a country with cumbersome trading procedures. OECD, WTO and UNCTAD (2013) show that trade cost reductions from practical and relatively low-cost actions could be as high as 16 per cent for some developing countries. The importance of TF in international trade is manifest in its entering into the WTO agenda in July 2004, although it was only discussed at the WTO Singapore Ministerial Conference in December 1996 before. Moreover, TF made a major breakthrough at the Bali Ministerial Conference held in December 2013, where WTO members concluded negotiations on a Trade Facilitation Agreement,8 re-emphasizing its significance in global trade. 7Trade facilitation has been defined by the WTO as, “the simplification and harmonization of international trade procedures”, where trade procedures are the “activities, practices and formalities involved in collecting, presenting, communicating and processing data required for the movement of goods in international trade”. 8The Trade Facilitation Agreement contains provisions for expediting the movement, release and clearance of goods, including goods in transit. It also sets out measures for effective cooperation between customs and other appropriate authorities on trade facilitation and customs
8
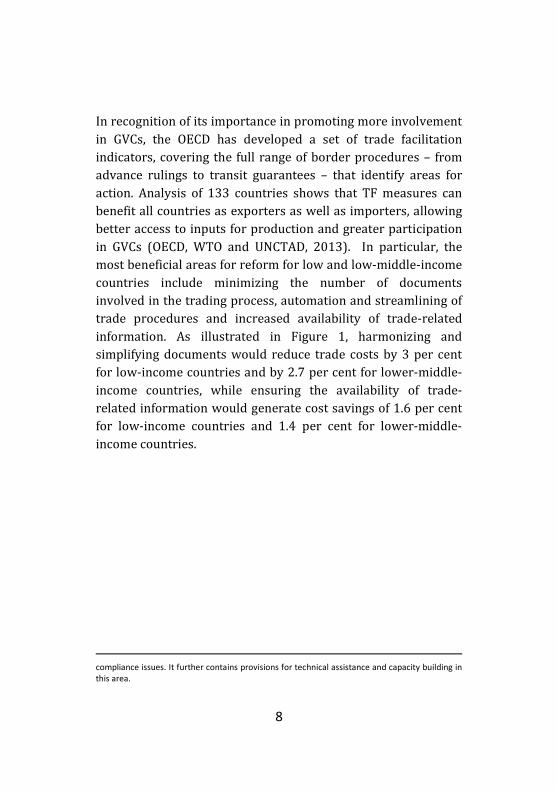
In recognition of its importance in promoting more involvement in GVCs, the OECD has developed a set of trade facilitation indicators, covering the full range of border procedures – from advance rulings to transit guarantees – that identify areas for action. Analysis of 133 countries shows that TF measures can benefit all countries as exporters as well as importers, allowing better access to inputs for production and greater participation in GVCs (OECD, WTO and UNCTAD, 2013). In particular, the most beneficial areas for reform for low and low-middle-income countries include minimizing the number of documents involved in the trading process, automation and streamlining of trade procedures and increased availability of trade-related information. As illustrated in Figure 1, harmonizing and simplifying documents would reduce trade costs by 3 per cent for low-income countries and by 2.7 per cent for lower-middle-income countries, while ensuring the availability of trade-related information would generate cost savings of 1.6 per cent for low-income countries and 1.4 per cent for lower-middle-income countries.
compliance issues. It further contains provisions for technical assistance and capacity building in this area.
9
Figure 1: Trade Facilitation Measures: Potential Cost Reduction in Goods Trade (%), Most Beneficial Areas for Reform Source: OECD (2013) cited in OECD, WTO and UNCTAD, 2013. 1.4 Proliferation of Regional Trade Agreements Compared to the relatively recent emergence of TF as a crucial element in international trade, trade liberalization efforts have been in force for over half a century, which in turn has seen a gradual reduction in nominal tariffs in both developed and developing countries over the years. However, the cost of protectionism is higher in a world dominated by GVCs, since tariffs become cumulative when intermediate inputs are traded across borders multiple times. Firms pay tariffs on imported inputs and then face tariffs again on their final exports which once again include the same imported inputs. Subsequently, tariffs can amount to a considerable amount when the finished good reaches the customer, thus lowering demand and affecting production and investment at all stages of a value chain (OECD, UNCTAD, WTO, 2013). Koopman et el. (2010) (cited in Bruhn,
Low-income countries Lower-middle-income countries
Upper-middle income countries
10
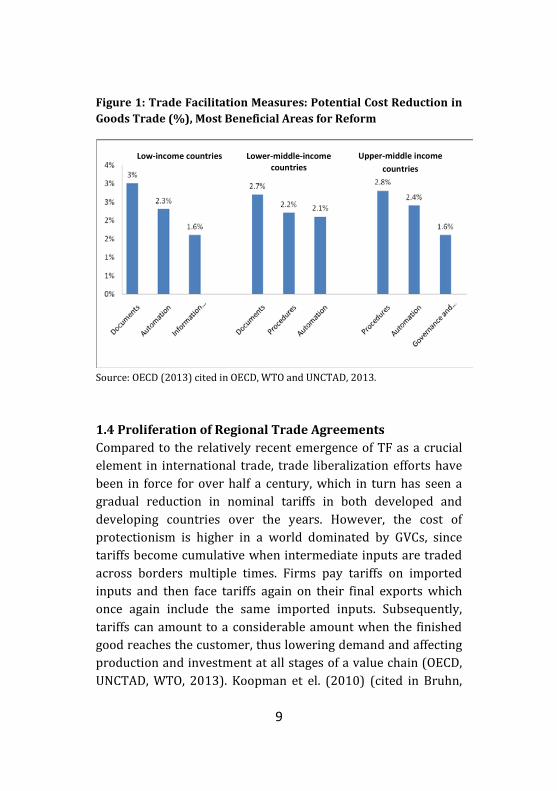
2014) state that this magnification effect of trade costs has a larger adverse impact on developing countries, given that these countries usually have higher tariffs on intermediate imports compared to developed countries. In this context of magnified trade costs and the current standstill of trade liberalization via WTO-headed multilateral negotiations, another key development in international trade has been the increasing proliferation of regional trade agreements (RTAs),9 primarily in the form of free trade agreements (FTAs).10 According to the WTO website, as of June 2014, 585 notifications of RTAs (including goods, services and accessions separately) had been received by the WTO, of which 379 were in force (WTO, 2014). That the ever-growing number of RTAs is a prominent feature of today’s international trade environment is evident from the fact that 37 per cent of global exports and 46 per cent of global imports flows via RTAs (UNESCAP, 2011). The Asia-Pacific region, in particular, has witnessed a dramatic rise in FTAs, with every country in the region, except Mongolia and Timor-Leste, being a member of at least one FTA (Figure 2). Most of the agreements are bilateral FTAs, amounting to 203 (including FTAs under negotiation) as of July 2014, and the majority has been negotiated with partners outside the region (Asia Regional Integration Centre, 2014). The major players in the region including China, India, Japan and South Korea are involved in the bulk of the FTAs. Besides India, Pakistan has also been actively involved in negotiating trade deals in the South
9In the WTO, regional trade agreements are defined as reciprocal trade agreements between two or more partners. They include free trade agreements and customs unions. 10In the WTO, a free-trade agreement is understood to mean a group of two or more customs territories in which the duties and other restrictive regulations of commerce in products are eliminated on substantially all the trade between the partners in such territories.
11
Asia region; however, compared to East and Southeast Asian economies, most agreements involving South Asian countries are shallow in nature –they are largely limited to tariff reductions and have minimal provisions for addressing non-tariff barriers in goods and services and investment. Figure 2: Number of FTAs in Asia, 1980-2014
Source: Asia Regional Integration Centre, 2014. In this context of increasing trade agreements, a common problem which has emerged is the efficient management of the ‘spaghetti-bowl’ or ‘Asian noodle bowl’ effect, which refers to complications created by the many overlapping rules and regulations stipulated in different agreements. Inconsistencies such as different schedules for phasing out tariffs, different rules of origin, exclusion lists, conflicting standards, and differences in rules dealing with anti-dumping and other regulations and policies can significantly raise the costs of doing business and trading especially for small and medium enterprises. Devising appropriate measures to overcome this problem has thus become an important challenge in global trade policy.
12
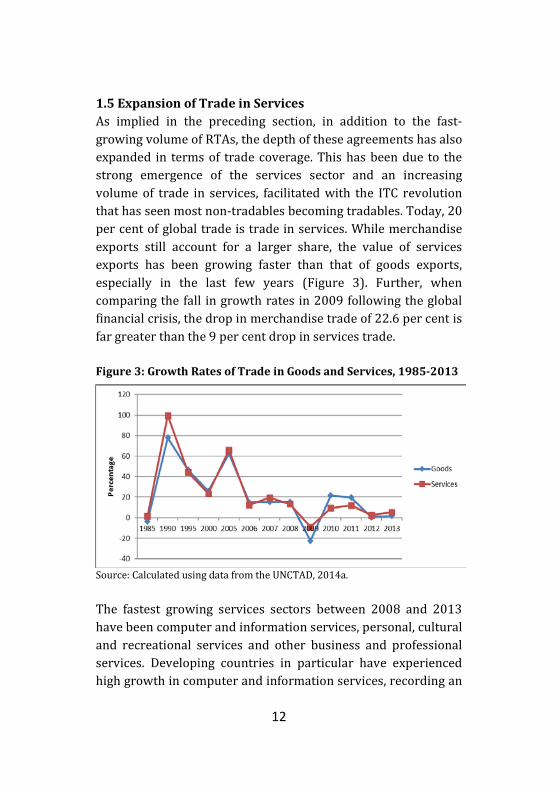
1.5 Expansion of Trade in Services As implied in the preceding section, in addition to the fast-growing volume of RTAs, the depth of these agreements has also expanded in terms of trade coverage. This has been due to the strong emergence of the services sector and an increasing volume of trade in services, facilitated with the ITC revolution that has seen most non-tradables becoming tradables. Today, 20 per cent of global trade is trade in services. While merchandise exports still account for a larger share, the value of services exports has been growing faster than that of goods exports, especially in the last few years (Figure 3). Further, when comparing the fall in growth rates in 2009 following the global financial crisis, the drop in merchandise trade of 22.6 per cent is far greater than the 9 per cent drop in services trade. Figure 3: Growth Rates of Trade in Goods and Services, 1985-2013
Source: Calculated using data from the UNCTAD, 2014a. The fastest growing services sectors between 2008 and 2013 have been computer and information services, personal, cultural and recreational services and other business and professional services. Developing countries in particular have experienced high growth in computer and information services, recording an
13
average annual growth rate of 13 per cent since 2008 compared to a rate of 7.5 per cent for developed countries (UNCTAD, 2014b). Services are also the largest and most dynamic component of economies in both developed and developing countries, accounting, on average for over 50 per cent of GDP. In addition to being of increasing importance, they also function as crucial inputs into the production of most goods. As such, services also play a key role in the context of GVCs. While the spread of GVCs is generally greater in industries such as electronics, garments and automotive where activities can be more easily separated, GVCs now increasingly involve activities in services. Although the share of services in gross exports worldwide is only about 20 per cent, almost half (46 per cent) of value added in exports is contributed by services-sector activities, as most manufacturing exports require services for their production (UNCTAD, 2013a). Consequently, reducing barriers to trade in services has become a key focus in the global trade arena. Whereas services trade entered multilateral trade negotiations under the General Agreement on Trade in Services (GATS) in 2000, with the current deadlock in WTO negotiations, services liberalization has made its way through RTAs, as evident from the increasing number of Comprehensive Economic Partnership Agreements (CEPAs), Comprehensive Economic Cooperation Agreements (CECAs) and Economic Integration Agreements (EIAs) which go beyond standard FTAs to cover a broad spectrum of goods, services and investment liberalization. Currently, 33 per cent of RTAs in force are services agreements (WTO, 2014).
14
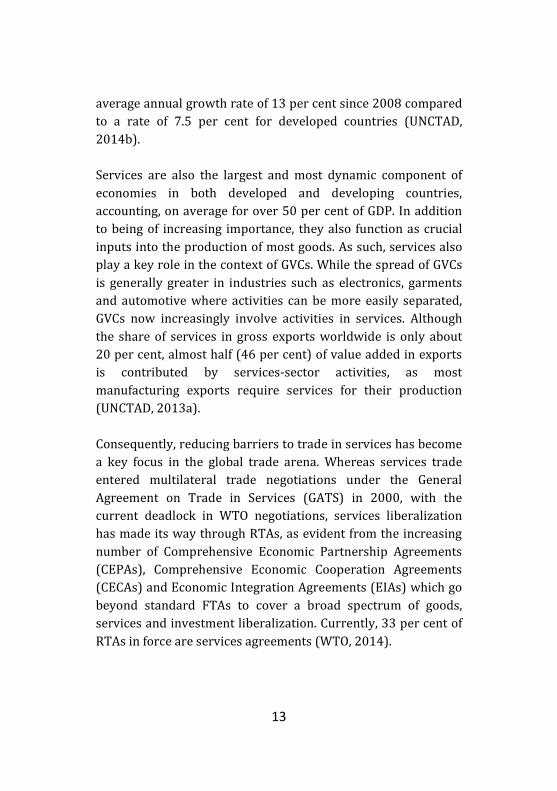
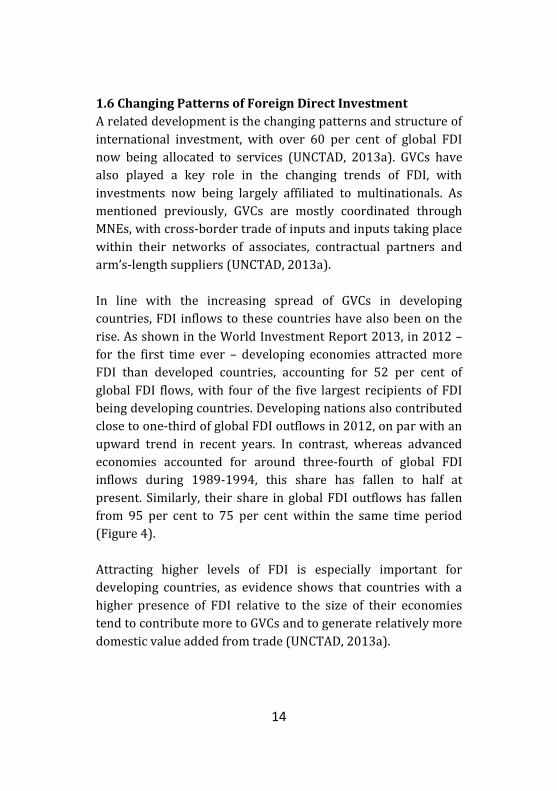
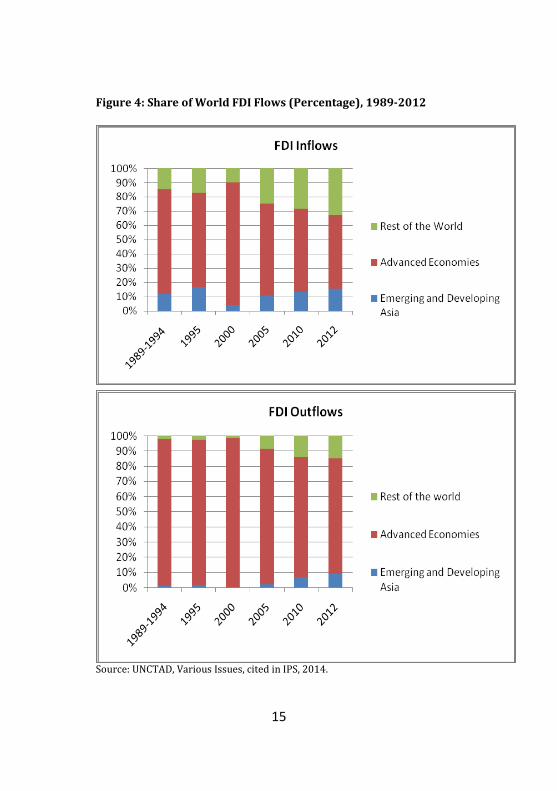
1.6 Changing Patterns of Foreign Direct Investment A related development is the changing patterns and structure of international investment, with over 60 per cent of global FDI now being allocated to services (UNCTAD, 2013a). GVCs have also played a key role in the changing trends of FDI, with investments now being largely affiliated to multinationals. As mentioned previously, GVCs are mostly coordinated through MNEs, with cross-border trade of inputs and inputs taking place within their networks of associates, contractual partners and arm’s-length suppliers (UNCTAD, 2013a). In line with the increasing spread of GVCs in developing countries, FDI inflows to these countries have also been on the rise. As shown in the World Investment Report 2013, in 2012 – for the first time ever – developing economies attracted more FDI than developed countries, accounting for 52 per cent of global FDI flows, with four of the five largest recipients of FDI being developing countries. Developing nations also contributed close to one-third of global FDI outflows in 2012, on par with an upward trend in recent years. In contrast, whereas advanced economies accounted for around three-fourth of global FDI inflows during 1989-1994, this share has fallen to half at present. Similarly, their share in global FDI outflows has fallen from 95 per cent to 75 per cent within the same time period (Figure 4). Attracting higher levels of FDI is especially important for developing countries, as evidence shows that countries with a higher presence of FDI relative to the size of their economies tend to contribute more to GVCs and to generate relatively more domestic value added from trade (UNCTAD, 2013a).
15
Figure 4: Share of World FDI Flows (Percentage), 1989-2012
Source: UNCTAD, Various Issues, cited in IPS, 2014.
16
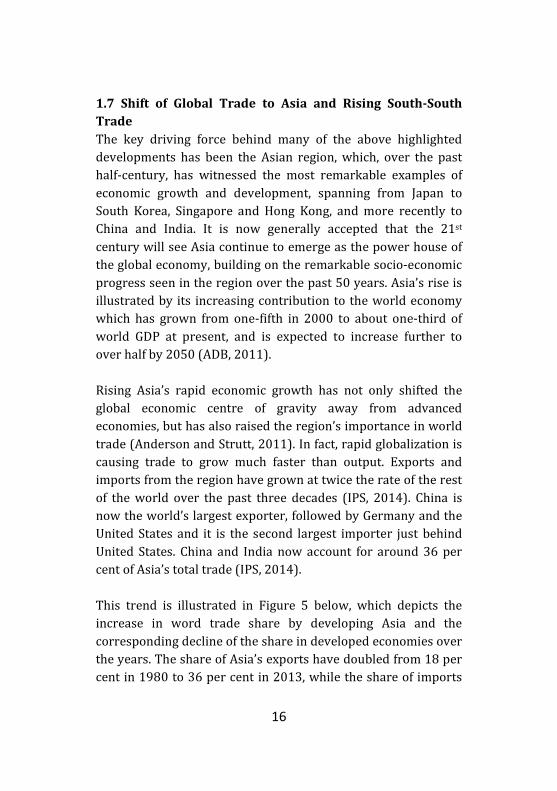
1.7 Shift of Global Trade to Asia and Rising South-South Trade The key driving force behind many of the above highlighted developments has been the Asian region, which, over the past half-century, has witnessed the most remarkable examples of economic growth and development, spanning from Japan to South Korea, Singapore and Hong Kong, and more recently to China and India. It is now generally accepted that the 21st century will see Asia continue to emerge as the power house of the global economy, building on the remarkable socio-economic progress seen in the region over the past 50 years. Asia’s rise is illustrated by its increasing contribution to the world economy which has grown from one-fifth in 2000 to about one-third of world GDP at present, and is expected to increase further to over half by 2050 (ADB, 2011). Rising Asia’s rapid economic growth has not only shifted the global economic centre of gravity away from advanced economies, but has also raised the region’s importance in world trade (Anderson and Strutt, 2011). In fact, rapid globalization is causing trade to grow much faster than output. Exports and imports from the region have grown at twice the rate of the rest of the world over the past three decades (IPS, 2014). China is now the world’s largest exporter, followed by Germany and the United States and it is the second largest importer just behind United States. China and India now account for around 36 per cent of Asia’s total trade (IPS, 2014). This trend is illustrated in Figure 5 below, which depicts the increase in word trade share by developing Asia and the corresponding decline of the share in developed economies over the years. The share of Asia’s exports have doubled from 18 per cent in 1980 to 36 per cent in 2013, while the share of imports
17
has increased from 13 per cent to 33 per cent within the same time period. According to some estimates, developing Asia will continue to increase its share of global trade in the future and account for as much as 40 per cent of world exports and 29 per cent of world imports by 2030 (Anderson and Strutt, 2011). Figure 5: Share of World Trade Flows, 1980-2013
Source: Calculated using data from UNCTAD, 2014.
18
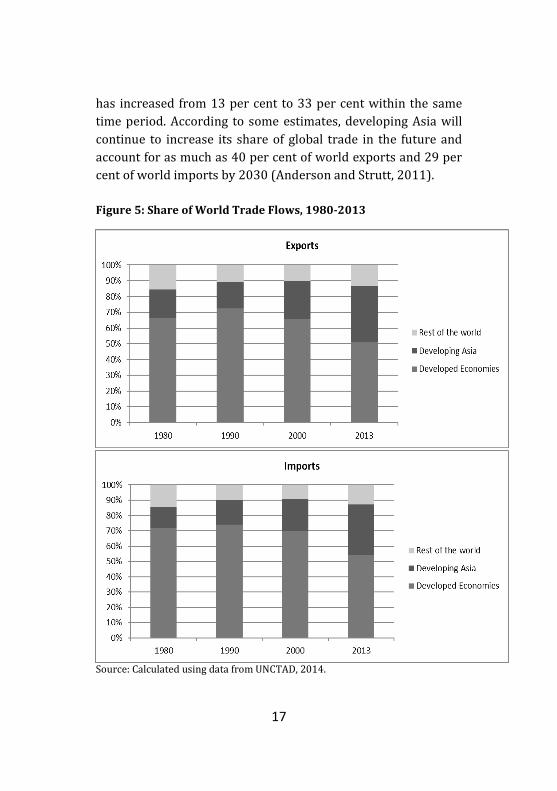
Asia’s growing dominance is not only manifest in its contribution to the world economy; it has also led to a notable rise in South-South trade (S-S trade),11 as economies have become increasingly integrated through trade, investment and financial flows. According to the UNCTAD Handbook of Statistics (2013b), world merchandise exports have more than tripled over the last two decades to reach US$ 18 trillion in 2012, of which US$ 7.4 trillion, or a quarter, comprises exports among developing countries. Figure 6 illustrates the rise of S-S trade in total world trade in both exports and imports over the last two decades. Figure 6: South-South Trade in World Trade, 1990-2009
Source: UN Comtrade Database, cited in Athukorala, 2011. Unsurprisingly, S-S trade has been led by developing Asia, with intra-regional trade within Asia amounting to 3.5 trillion in 2012 (UNCTAD, 2013b). China’s exports to other developing countries alone represent more than 20 per cent of developing countries’ intra-trade. The increasing integration in the region 11 South-South trade refers to trade among developing countries.
19
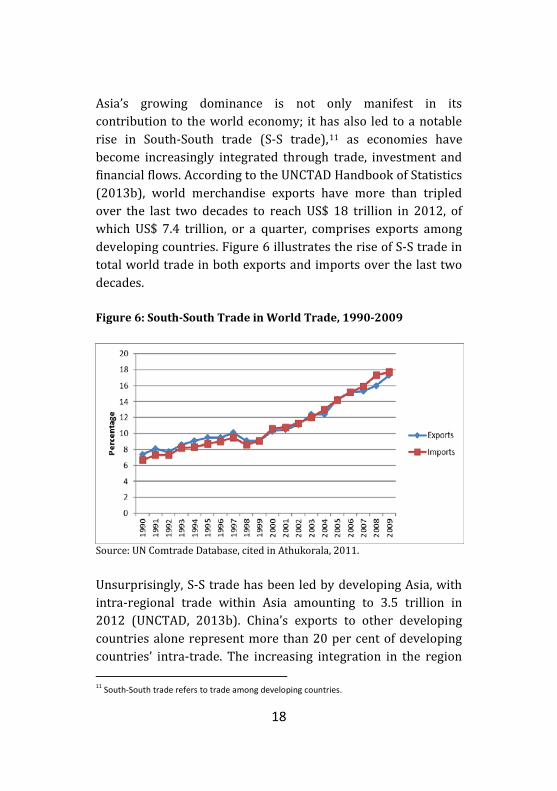
is, however, mostly confined to East and Southeast Asia. Intra-regional integration in trade as a share of total trade in Asia has risen from 45.2 per cent in 1990 to 55.6 per cent in 2010, which is close to the integration in the EU and significantly above North American integration (Table 1). High levels of integration in East Asia have been predominantly driven by manufacturing supply chains which are linked to global markets, mainly in the West (Sally, 2010 cited in IPS, 2014). Table 1: Intra-regional Trade Shares (Percentage), 1990-2010
Region 1990 1995 2000 2005 2010 EU 65.7 65.4 64.1 64.9 64.9 North America
37.2 41.9 46.8 43.0 40.0
Asia 45.2 52.5 53.2 55.1 55.6 East Asia 28.6 35.4 36.8 36.9 36.8 Southeast Asia
16.9 21.0 22.7 24.9 24.6
South Asia 1.9 4.1 3.9 4.3 3.1 Africa 7.8 9.4 8.3 9.3 10.4 Latin America
14.8 18.6 15.4 18.0 19.3
Source: Asia Regional Integration Centre, cited in IPS 2014.
20
2. Implications for Sri Lanka The previous section examined recent developments in international trade which have had an important bearing on the global economy and profound implications for countries across the world, including Sri Lanka. In fact, as a small open economy dependent on external demand to sustain domestic growth, the global environment plays a particularly important role in determining Sri Lanka’s growth prospects.This section looks at how each of the developments explained above could impact Sri Lanka, and whether Sri Lanka is in a position to reap the maximum benefits that these developments have to offer, while managing the inevitable risks of being a part of the globalized world. 2.1 Participation in Global Value Chains The exceptional success of East and Southeast Asian countries in better integrating with themselves and with the world has been primarily owing to their active participation in supply chains. Likewise, the persistently low level of trade integration within South Asia is often attributed to the region not yet being part of GVCs. Sri Lanka’s experience in linking with GVCs has been far from satisfactory. However, one important case stands out – that of Sri Lanka’s apparel industry. With the abolition of the Multi-Fibre Arrangement (MFA)12 in 2005, the widespread expectation was that in a quota-free global apparel market, large low cost countries such as China and India and countries in close proximity to key Western markets such as Mexico, Turkey
12The MFA was a complex system of bilateral import quotas, where developed countries negotiated bilateral agreements with individual trading partners in order to restrict the quantity of exports of specific product categories by their trading partners. The intention of the MFA was to protect domestic producers in the developed countries from market disruptions. The USA, EU, Canada and Norway were some of the key nations that negotiated bilateral agreements.
21
would expand their market share at the expense of countries whose apparel sector was until then protected by the MFA (Athukorala and Ekanayake, 2014). However, the actual outcome has in fact been very different for many of these quota-protected industries, including Sri Lanka. In a case study on the post-MFA performance of the Sri Lankan apparel industry, Athukorala and Ekanayake (2014) show that Sri Lanka has emerged as a successful participant in the global apparel value chain in spite of the loss of guaranteed market access provided by export quotas and significant increases in manufacturing wages relative to other low-wage countries. Despite various adverse events that have occurred in the external environment, the Sri Lankan apparel industry has managed to maintain growth dynamism through a niche carved out in fashion-basic products, in particular intimate apparel (lingerie) and up-market casual wear. A number of large firms in the industry have now become full package manufacturers and offer a full range of services to customers, product development, pattern making, finishing, sourcing, manufacturing and delivery. According to tentative estimates provided by the Joint Apparel Association Forum (JAAF),13 full-package manufacturing firms now account for about 60 per cent of total exports (by value), with the rest coming from package contractors (Athukorala and Ekanayake, 2014).
13 The Joint Apparel Association Forum is the apex body for all textile and apparel-related associations in Sri Lanka.
22
As pointed out by the authors, while foreign buyers played an essential role in linking Sri Lankan firms to the GVC,14 a domestic enabling environment, including a highly skilled domestic workforce, an entrepreneurial class, proactive industry associations, and most importantly, the policy reforms in 1977 that removed many barriers to trade and investment, was also of immense importance. Improvement in the human capital base and design capabilities of the industry has enabled the industry to promptly respond to buyers’ changing demand patterns. In addition, collaborative actions by the industry and the government greatly eased the burden of adjustment to the abolition of MFA quotas, and helped utilize the opportunities that arose in the post-MFA environment. Sri Lanka’s involvement in GVCs in the apparel industry has thus facilitated its strong and sustainable export performance. Given the importance of GVCs in the current trading environment and the many benefits it can bring to a country in terms of development outcomes, Sri Lanka needs to link with more supply chains both within Asia and globally. As evidenced from the apparel industry experience, in addition to sector specific policies, a facilitating domestic environment is crucial. UNCTAD (2013a) highlights some specific policies that developing countries need to implement in encouraging GVC participation, which are important for Sri Lanka too. First, is the need to embed GVCs in industrial development policies (targeting GVC tasks and activities). A conducive environment
14Their role included, (1) setting up buying offices in Sri Lanka which were instrumental in linking local firms with international markets; (2) the developed-country (mostly European) firms that had set up operations in Sri Lanka had already established direct market links with retailers in their countries of origin; (3)based on market links established with the help of initial joint-venture operations with foreign firms, more recently a number of large local firms have begun to deal directly with lead firms.
23
for trade and investment through developing infrastructural prerequisites is another important factor. Building productive capacities in local firms and skill levels of the labour force is also key. Finally, multilateral cooperation can contribute considerably in ensuring a trade and investment policy setting favourable to sustainable GVC growth (OECD, WTO and UNCTAD, 2013). 2.2 Trade Facilitation As discussed in the previous section, TF measures are of extreme importance for countries in ensuring active participation in GVCs, whilst also being recognized as a core factor in promoting greater multilateral cooperation. For Sri Lanka, improving connectivity with other countries of close proximity has long been recognized as an important component of promoting greater intra-regional and investment linkages, and there have been some notable efforts directed towards improving TF mechanisms. Sri Lanka’s initiatives at facilitating trade date back to 1980 with the establishment of the National Trade Facilitation Committee. However this Committee, as well as a Steering Committee on Trade Facilitation appointed in 1996, both died natural deaths, in part due to of lack of Government commitment, and at present there is no government institution driving TF initiatives. Nevertheless, led by private sector initiatives (such as JAAF), there have been some important developments in recent years, including issuance of electronic Certificates of Origin,15 the
15 The Certificate of Origin is a document declaring in which country a good was manufactured. It contains information regarding the product's destination and country of export and is required by many trade agreements before being accepted into another nation.
24
adoption of ASYCUDA World in 201216 and well developed online facilities for export and import procedures at the Customs Department, where a one-stop export cargo facilitation centre (EFC), which will streamline the operational aspects of physical cargo aspects, has been set up recently (Masakorala, 2014).17 Another key development is the improvements in Sri Lanka’s physical infrastructure connectivity, primarily via public investment-led initiatives, in line with its ambitious focus on physical infrastructure development in the post-2005 period. This has included major projects, especially in seaport, airport, and road network development, of which the developments of the Colombo Port is perceived to have important implications for the country’s TF initiatives, given that it handles over 95 per cent of cargo channelled through ports in Sri Lanka, and plays a key role in providing hub services in the South Asia region (Weerakoon and Perera, 2014). The effects of these initiatives are reflected in improved TF indicators for Sri Lanka over the years: the number of documents needed to export and import have declined from 21 in 2007 to 12 in 2013, whereas the number of days required for the trading process has dropped from 52 to 39 within the same period (IPS, 2014). In fact, according to several data sources (World Bank, World Economic Forum, OECD), Sri Lanka out-performs other South Asian and some Southeast Asian countries with regard to several TF indicators, although it lags behind countries such as Thailand, Malaysia and Singapore.
16The Automated System for Customs Data (ASYCUDA) is a computerized system designed by UNCTAD to administer a country's customs. There are three generations of ASYCUDA in use: ASYCUDA 2.7, ASYCUDA++ and ASYCUDA World. 17http://www.ft.lk/2014/09/09/customs-export-facilitation-centre-a-giant-step-in-trade-facilitation/
25
In particular, OECD estimates that Sri Lanka performs better than the averages of Asian and lower-middle-income countries in the areas of involvement of the trade community, appeal procedures and simplification and harmonization of documents, while its performance with respect to information availability, automation and internal border agency co-operation is below the averages of this sample of countries (OECD, undated). Accordingly, they show that Sri Lanka can draw considerable benefits in terms of trade volumes and trade costs from significant improvements in information availability (publication of trade information, including on internet; enquiry points) and automation (electronic exchange of data; automated border procedures; use of risk management). Moreover, sustained efforts in the areas of streamlining of procedures and governance and impartiality would yield further benefits (OECD, undated). Additionally, from a macroeconomic point of view, given the fact that significant improvements in physical infrastructure connectivity has not translated into corresponding progress in strengthening trade and investment links with other South and Southeast Asian economies, Sri Lanka needs to focus on two priority areas: engaging private investment in infrastructure by strengthening the country’s institutional and regulatory environment; and implementing a more strategic trade policy geared to enhance regional integration efforts (Weerakoon and Perera, 2004). 2.3 Linkages to Rising Asia and Regional Trade Agreements Asia’s increasing dominance in world output and trade has profound implications for Sri Lanka. Strategically located in Asia next to the Indian sub-continent and in close proximity to
26
Southeast Asia, coupled with a long history of engagement with the region, Sri Lanka is in an ideal position to foster strong linkages with rising Asia. More importantly, the need to do so is crucial – Sri Lanka’s exports continue to be concentrated both in terms of products and markets,18 and in the context of lacklustre export growth, Sri Lanka should seize new and expanding opportunities in trading goods and services with emerging Asia, which will enable the country to diversify its dependence away from Western economies and reduce its vulnerability to adverse developments in these markets. Sri Lanka’s strategy toward fostering regional connectivity has, in fact, focused on strengthening trade with its neighbours in Asia. Since the mid-1990s, bilateral and regional trade agreements have been pursued, not only as a means of accessing markets and diversifying the export base, but also to attract FDI flows. India is already a major trade and investment partner, while Sri Lanka’s trade and investment links with other emerging Asian economies such as China, Malaysia and Singapore are also gaining momentum. However, as shown in Table 2, these trade links are mainly limited to import flows – with the exception of India, exports to other countries are marginal. Further, there has been negligible growth in export shares to these markets between 2000 and 2013.
18 The US and EU continue to be the major export destinations, accounting for over 50 per cent of total exports; clothing exports continue to dominate with a share of 40 per cent of total exports.
27
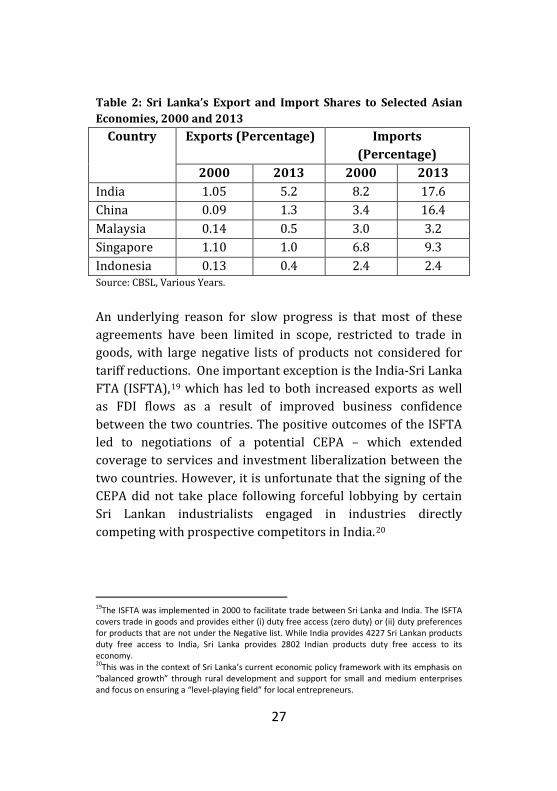
Table 2: Sri Lanka’s Export and Import Shares to Selected Asian Economies, 2000 and 2013
Country Exports (Percentage) Imports (Percentage)
2000 2013 2000 2013 India 1.05 5.2 8.2 17.6 China 0.09 1.3 3.4 16.4 Malaysia 0.14 0.5 3.0 3.2 Singapore 1.10 1.0 6.8 9.3 Indonesia 0.13 0.4 2.4 2.4 Source: CBSL, Various Years. An underlying reason for slow progress is that most of these agreements have been limited in scope, restricted to trade in goods, with large negative lists of products not considered for tariff reductions. One important exception is the India-Sri Lanka FTA (ISFTA),19 which has led to both increased exports as well as FDI flows as a result of improved business confidence between the two countries. The positive outcomes of the ISFTA led to negotiations of a potential CEPA – which extended coverage to services and investment liberalization between the two countries. However, it is unfortunate that the signing of the CEPA did not take place following forceful lobbying by certain Sri Lankan industrialists engaged in industries directly competing with prospective competitors in India.20
19The ISFTA was implemented in 2000 to facilitate trade between Sri Lanka and India. The ISFTA covers trade in goods and provides either (i) duty free access (zero duty) or (ii) duty preferences for products that are not under the Negative list. While India provides 4227 Sri Lankan products duty free access to India, Sri Lanka provides 2802 Indian products duty free access to its economy. 20This was in the context of Sri Lanka’s current economic policy framework with its emphasis on “balanced growth” through rural development and support for small and medium enterprises and focus on ensuring a “level-playing field” for local entrepreneurs.
28
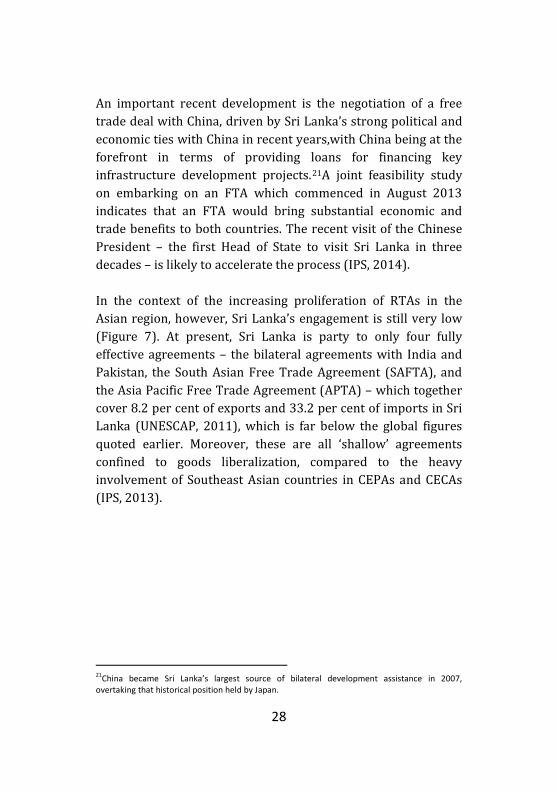
An important recent development is the negotiation of a free trade deal with China, driven by Sri Lanka’s strong political and economic ties with China in recent years,with China being at the forefront in terms of providing loans for financing key infrastructure development projects.21A joint feasibility study on embarking on an FTA which commenced in August 2013 indicates that an FTA would bring substantial economic and trade benefits to both countries. The recent visit of the Chinese President – the first Head of State to visit Sri Lanka in three decades – is likely to accelerate the process (IPS, 2014). In the context of the increasing proliferation of RTAs in the Asian region, however, Sri Lanka’s engagement is still very low (Figure 7). At present, Sri Lanka is party to only four fully effective agreements – the bilateral agreements with India and Pakistan, the South Asian Free Trade Agreement (SAFTA), and the Asia Pacific Free Trade Agreement (APTA) – which together cover 8.2 per cent of exports and 33.2 per cent of imports in Sri Lanka (UNESCAP, 2011), which is far below the global figures quoted earlier. Moreover, these are all ‘shallow’ agreements confined to goods liberalization, compared to the heavy involvement of Southeast Asian countries in CEPAs and CECAs (IPS, 2013). 21China became Sri Lanka’s largest source of bilateral development assistance in 2007, overtaking that historical position held by Japan.
29
Figure 7: Number of FTAs by Country, 2014
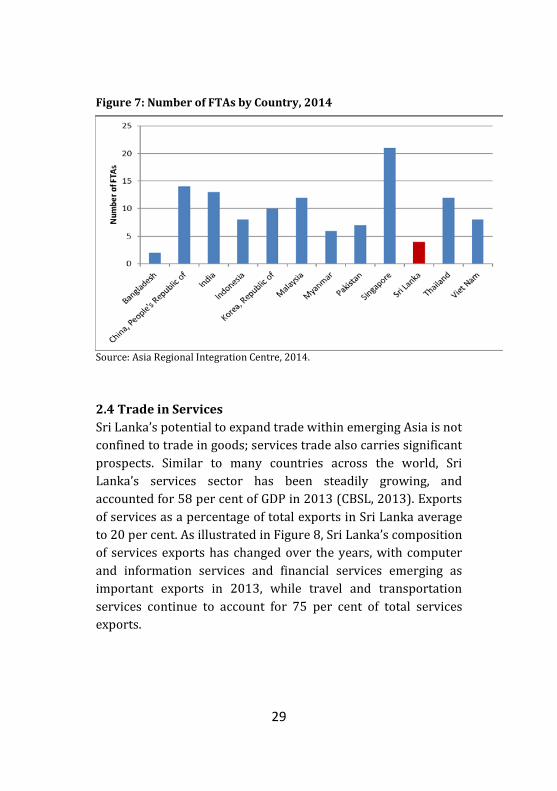
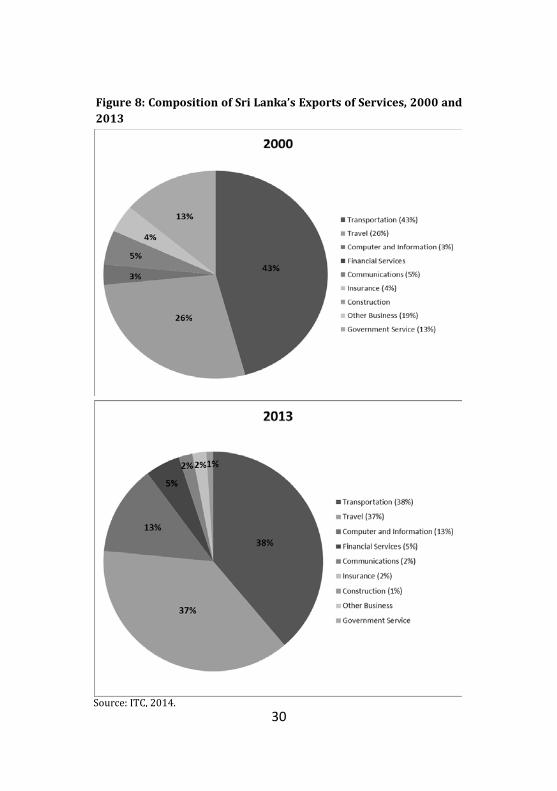
Source: Asia Regional Integration Centre, 2014. 2.4 Trade in Services Sri Lanka’s potential to expand trade within emerging Asia is not confined to trade in goods; services trade also carries significant prospects. Similar to many countries across the world, Sri Lanka’s services sector has been steadily growing, and accounted for 58 per cent of GDP in 2013 (CBSL, 2013). Exports of services as a percentage of total exports in Sri Lanka average to 20 per cent. As illustrated in Figure 8, Sri Lanka’s composition of services exports has changed over the years, with computer and information services and financial services emerging as important exports in 2013, while travel and transportation services continue to account for 75 per cent of total services exports.
30
Figure 8: Composition of Sri Lanka’s Exports of Services, 2000 and 2013
Source: ITC, 2014.
31
Intra-regional trade in services in Asia is projected to grow significantly from 2010 to 2020, mainly in the financial, computer and information, communication and travel and transport sectors (IPS, 2014), thus offering considerable potential for Sri Lanka’s emerging services exports. The demand for travel and tourism services is also likely to increase within Asia with its growing affluence, as suggested by growing numbers of outbound tourist numbers from the region (IPS, 2014). In fact, 40 per cent of tourist arrivals in Sri Lanka are from Asia; India is the largest source, whereas there has been a dramatic increase in arrivals from China in recent years (IPS, 2014). The growing importance attached to services trade is also evident in increased services trade liberalization in the region via RTAs, as shown earlier. Sri Lanka’s interest in services trade liberalization was seen in the negotiations of a CEPA with India, and technical-level negotiations on a CEPA with Pakistan which commenced in 2008, while negotiations on a SAARC Agreement on Trade in Services (SATIS) was signed in 2010. Increasing trade liberalization in services is particularly important for Sri Lanka in the context of the government’s vision of developing the country into a ‘dynamic hub’ in the areas of shipping, aviation, commerce, energy and knowledge. A number of countries in East and Southeast Asia (Hong Kong, China, Singapore, South Korea and Malaysia) have already developed into hubs in similar areas, which can be a cause for concern in terms of competing interests. Comparative statistics of Sri Lanka and other countries in the region reveal that Sri Lanka lags far behind its neighbouring countries in terms of all identified areas (Abeyratne, 2014 cited in IPS, 2014). While Sri
32
Lanka’s performance in shipping is relatively good owing to recent developments in the Colombo Port which ranks 29th among 125 ports in the world, there are 19 other Asian ports handling larger volumes (American Association of Port Authorities, 2011 cited in IPS, 2014). Aviation, energy and knowledge are far behind shipping and require major developments in reaching comparable levels to other Southeast Asian economies. Despite infrastructural development in airports, Sri Lanka is ranked low in terms of carrier departures. Similarly, while the government has taken some important initiatives towards developing the country as a knowledge hub,22 developments in tertiary education have been stagnant and far behind those in other Asian countries. Although the US, UK and Australia have been the traditional destinations of higher education, Asian countries including Singapore, Malaysia, China, Hong Kong and India have embarked on several reforms to create global educational hubs (IPS, 2014). Thus, Sri Lanka faces stiff competition from its neighbouring countries which are already far ahead. Developing the economy as a services hub calls for more aggressive services trade liberalization; given the slow progress of both the SAARC process and bilateral CEPA negotiations, Sri Lanka will have to devise new strategies in liberalizing services trade. One avenue to exploit is the recent increases in services FDI, particularly from India, as shown in the following section.
22 Such initiatives include establishment of new faculties and higher education institutes, introduction of new degree courses, invitations to foreign universities to set up new campuses etc.
33
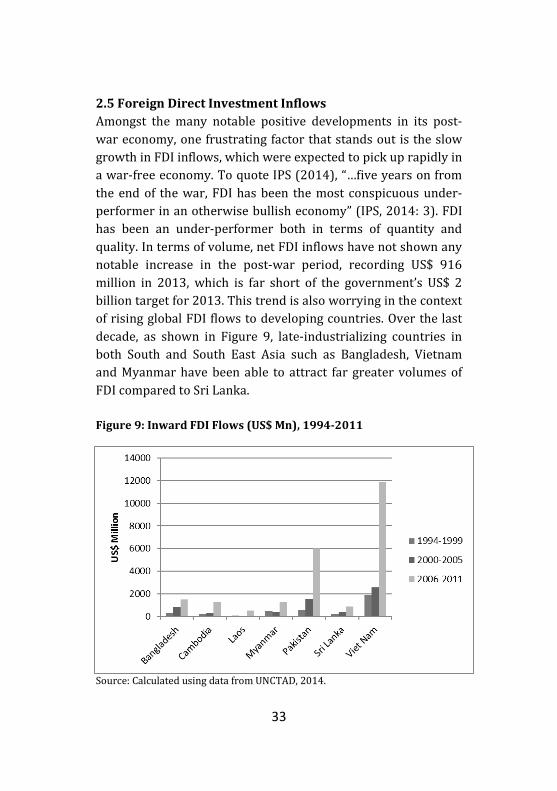
2.5 Foreign Direct Investment Inflows Amongst the many notable positive developments in its post-war economy, one frustrating factor that stands out is the slow growth in FDI inflows, which were expected to pick up rapidly in a war-free economy. To quote IPS (2014), “…five years on from the end of the war, FDI has been the most conspicuous under-performer in an otherwise bullish economy” (IPS, 2014: 3). FDI has been an under-performer both in terms of quantity and quality. In terms of volume, net FDI inflows have not shown any notable increase in the post-war period, recording US$ 916 million in 2013, which is far short of the government’s US$ 2 billion target for 2013. This trend is also worrying in the context of rising global FDI flows to developing countries. Over the last decade, as shown in Figure 9, late-industrializing countries in both South and South East Asia such as Bangladesh, Vietnam and Myanmar have been able to attract far greater volumes of FDI compared to Sri Lanka. Figure 9: Inward FDI Flows (US$ Mn), 1994-2011
Source: Calculated using data from UNCTAD, 2014.
34
On the other hand, most of the recent FDI has been in mixed property development projects,23 which, while spurring growth in the short-term through construction and related sectoral growth and in the medium term through related services and employment creation, has minimal impact on technology transfer that is needed for long-term growth through positive spillovers on labour force skills and productivity of local firms (IPS, 2014). On a more positive note, Sri Lanka’s main sources of FDI have seen changes in recent years, with India, China, Malaysia, Hong Kong and Singapore being the largest investors at present (IPS, 2014), suggestive of growing investment linkages with rising Asian powers. Malaysia has been a prominent investor in the country with major investments in Dialog Axiata, the cellular mobile telephone network and Merbok MDF Lanka which manufactures MDF boards. India is also an important FDI source – a positive spillover of the ISFTA – with a highly diversified investment profile. The composition of FDI has shifted from manufacturing in the late 1990s to services such as hospitals, restaurants, retail trade and oil distribution. Some of the most visible investments include the Indian Oil Corporation, Tata, Bhareti Airtel, Aditya Birla Group, Ambuja, CEAT, Ashok Leyland and Hero (IPS, 2014). China is also emerging as an important investor in Sri Lanka, mainly targeting infrastructure development by Chinese state-owned enterprises. The importance of FDI is not limited to technology spillovers and related benefits, but is also essential in facilitating more
23These include the ‘Altair Tower’ set to be Sri Lanka’s tallest building, a US$ 600+ million mixed-used development by the country’s leading conglomerate, a 5-star Shangri-La Hotel and ITC Hotel.
35
participation in GVCs. In addition, as the most stable form of capital, FDI is assumed to be a stabilizing factor during financial crises in emerging and developing economies, since FDI is motivated by a positive long-term outlook about the recipient country and thus more difficult to reverse compared to other capital flows (Rummel, 2010). Therefore, the need for Sri Lanka to attract more FDI cannot be overemphasized. Sri Lanka can draw lessons from Southeast Asian countries in designing a more attractive policy package to entice FDI. In Myammar, for example, political and economic reforms coupled with improved international relations have brought about vast improvements to the country’s investment environment. The notable volume of FDI into Bangladesh has been driven by an emerging trend of re-allocation of efficiency-seeking FDI away from China and other emerging markets and towards frontier markets with vast untapped labour pools, low costs and market opportunities (IPS, 2013).
36
3. Conclusion The global economy has witnessed many important developments in international trade in the past decade, most importantly the development of GVCs, trade facilitation coming into the global trade agenda, increased regional integration via RTAs in the face of stalled multilateral negotiations, the emergence of trade in services, and the shift of global trade to Asia and a rise in S-S trade amidst the region’s seemingly relentless economic rise. As a small open economy dependent on external demand for sustaining long-term growth, the implications of these developments for Sri Lanka are profound. The above analysis shows that Sri Lanka has indeed been affected by the developments in the global trade arena, while also being an active participant in these developments – the country has made some inroads, albeit minimally, in linking with GVCs; implementing some trade facilitation measures, it has entered into some RTAs in the Asian region, while negotiations are underway for several more; trade in services has demonstrated growth in recent years; and some attempts are being made to shift its trade partners from the West to rising Asia. Nevertheless, it is also clear that Sri Lanka has not fully utilized the tremendous opportunities available in an increasingly globalized world, and has yet a long way to go. There are several areas in which urgent policy action is required – the most conspicuous being the need to boost export and FDI performance – so that the country can fully reap the benefits offered by these opportunities, whilst also achieving long-term sustained growth in its post-war economy. As a champion of trade and development issues and his deep passion for problems facing developing countries, had Dr. Corea been alive, in the absence of interventions such as commodity

37
market stabilization schemes in the modern world, Sri Lanka’s attempts to gain more access to growing Asian markets is a stride that he would have welcomed and encouraged. He would have taken full cognizance of Sri Lanka’s current standing in the global context, and given valuable advice on devising appropriate strategies to exploit the available opportunities while minimizing inherent risks.
38
References Abeyratne, S. 2014. Employment Implications of the Five-Hubs Strategy of Sri Lanka. Colombo: International Labour Organization. ADB. 2011. Asia 2050: Realizing the Asian Century. Manila: Asian Development Bank. Available: http://www.iopsweb.org/researchandworkingpapers/48263622.pdf. American Association of Port Authorities. 2011. World Port Rankings. Available: http://www.aapa-ports.org/Industry/content.cfm?ItemNumber=9000#Statistics. Anderson, Kym and Anna Strutt. 2011. Asia’s Changing Role in World Trade: Prospects for South–South Trade Growth to 2030. ADB Working Paper No. 264. Manila: Asian Development Bank. Available: http://www10.iadb.org/intal/intalcdi/PE/2011/08978.pdf. Asia Regional Integration Centre. 2014. Free Trade Agreements. Manila: Asian Development Bank. Available: http://aric.adb.org/fta. Athukorala, Prema-chandra. 2004. “Growth of Manufactured Exports and Terms of Trade: Pessimism Confounded”, in Saman Kelegama (ed) Economic Policy in Sri Lanka: Issues and Debates. New Delhi: Sage Publications. _______. 2011. South–South Trade: An Asian Perspective. ADB Working Paper No. 265. Manila: Asian Development Bank. Available: http://www.adb.org/sites/default/files/pub/2011/Economics-WP265.pdf. Athukorala, Prema-chandra and Raveen Ekanayake. 2014. Repositioning in the Global Apparel Value Chain in the Post-MFA Era: Strategic Issues and Evidence from Sri Lanka, Unpublished Draft. Bruhn, Dominique. 2014. Global Value Chains and Deep Preferential Trade Agreements: Promoting Trade at the Cost of Domestic Policy Autonomy? Discussion Paper. Bonn: German Development Institute. Available: http://www.die-gdi.de/uploads/media/DP_23.2014_01.pdf. CBSL Various Issues, Annual Report. Colombo: Central Bank of Sri Lanka. IPS. 2013. Sri Lanka: State of the Economy 2013. Colombo: Institute of Policy Studies of Sri Lanka.
39
_______. 2014. Sri Lanka: State of the Economy 2014. Colombo: Institute of Policy Studies of Sri Lanka. ITC. 2014. Trade Map. Geneva: International Trade Centre. Available: http://www.trademap.org/Service_SelCountry_TS.aspx. Kadirgamar, Lakshman. 2002. “Gamani Returns to the Third World” in The Sunday Times. 20 October 2002. Colombo. Koopman, R., W. Powers, Z. Wang and S. Wei. 2010. Give Credit where Credit is Due: Tracing Value Added in Global Production Chains. NBER Working Paper Series 16426. Massachusetts: National Bureau of Economic Research. Available: http://www.nber.org/papers/w16426. Masakorala, Rohan. 2014. “Customs Export Facilitation Centre- A Giant Step in Trade Facilitation” in DailyFT. 9 September 2014. Available: http://www.ft.lk/2014/09/09/customs-export-facilitation-centre-a-giant-step-in-trade-facilitation/. OECD. Undated. OECD Trade Facilitation Indicators – Sri Lanka. OECD Trade and Agriculture Directorate (TAD). Available: http://www.oecd.org/tad/facilitation/Sri-Lanka_OECD-Trade-Facilitation-Indicators.pdf. OECD, WTO and UNCTAD. 2013. Implications of Global Value Chains for Trade, Investment, Development and Jobs. Report prepared for the G-20 Leaders Summit. Saint Petersburg (Russian Federation). Available: http://www.oecd.org/sti/ind/G20-Global-Value-Chains-2013.pdf. Prebisch, Raul. 1950. The Economic Development of Latin America and its Principal Problems. New York: UN Commission for Latin America. Rummel, Ole. 2010. Relationship between Capital Flows and Exchange Rates. Bank of England. Available: http://www.pftac.org/filemanager/files/Macro_Training/CCBS_2010/2_6292025_1.PDF. Sally, R. 2010. Regional Economic Integration in Asia: The Track Record and Prospects. ECIPE Occasional Paper No. 2/2010. Brussels.
40
Singer, Hans W. 1950. “The Distribution of Gains between Investing and Borrowing Countries”. American Economic Review, 40(2): 473-85. Standard Chartered Bank. 2014. Global Trade Unbundled. Special Report. Available: https://www.sc.com/en/resources/global-en/pdf/Research/2014/Global_trade_unbundled_10_04_14.pdf. United Nations. 2013. The Millennium Development Goals Report 2013. New York: United Nations. Available: http://www.un.org/millenniumgoals/pdf/report-2013/mdg-report-2013-english.pdf. UNCTAD. 2013a. World Investment Report 2013: Global Value Chains: Investment and Trade for Development.Geneva: United Nations. Available: http://unctad.org/en/publicationslibrary/wir2013_en.pdf. ______. 2013b. Handbook of Statistics 2013. Geneva: United Nations. Available: http://unctad.org/en/PublicationsLibrary/tdstat38_en.pdf. ______. 2014a. UNCTADSTAT. Available: http://unctadstat.unctad.org/wds/TableViewer/tableView.aspx?ReportId=101. ______. 2014b. Statistics at a Glance. Available: http://unctad.org/en/pages/Statistics.aspx. UNESCAP. 2011. Asia-Pacific Trade and Investment Report 2011: Post-Crisis Trade and Investment Opportunities. Bangkok: United Nations. Available: http://www.unescap.org/sites/default/files/0%20-%20Full%20Report_21.pdf. Weerakoon, Dushni and Nipuni Perera. 2014. The Role of Sri Lanka in Enhancing Connectivity between South Asia and Southeast Asia. ADBI Working Paper No. 487. Tokyo: Asian Development Bank Institute. Available: http://www.adbi.org/workingpaper/2014/06/30/6349.sri.lanka.role.connectivity/. WTO. 2013. World Trade Report 2013: Factors Shaping the Future of World Trade. Geneva: World Trade Organization. WTO. 2014. Regional Trade Agreements: Facts and Figures. Available: http://www.wto.org/english/tratop_e/region_e/region_e.htm.

41
Saman Kelegama is the Executive Director of the Institute of Policy Studies of Sri Lanka
Gamani Corea
Dr. Corea was born on 4 November 1925 . He obtained his bachelor's and master's degrees from both the University of Oxford and the University of Cambridge between 1945 and 1952, followed by a doctorate in economics from Oxford. He worked as an economist in various capacities in Sri Lanka before becoming Sri Lanka's Ambassador to the European Economic Community, Belgium, and Luxembourg, in 1973.
His work with UNCTAD dates back to the organization's founding, when he helped to create the Group of 77 developing countries, at the first session of UNCTAD which took place in 1964. Dr. Corea, served as Secretary-General of UNCTAD from 1974 to 1984. He was known for his vision of a rebalanced international economic order that would provide fairer treatment to developing countries.
After leaving the UNCTAD, Dr. Corea continued to pursue his vision of a revamped international economic order, serving with the South Commission from 1987 to 1990, and as a member of the Committee of the South Centre from 1995 to 1998. He went on to serve as President of the Committee from 1998 to 2001.
In Sri Lanka, he founded and chaired the Institute of Policy Studies in its formative years. He also founded the Sri Lanka Economic Association with fellow economists, which he chaired from 1985 to 1991. He passed-away on 03 November 2013.
GAMANI COREA FOUNDATION11, R G. Senanayake Mawatha
(Gregory’s Road)Colombo 7