Embed Size (px)
Citation preview

University of North DakotaUND Scholarly Commons
Undergraduate Theses and Senior Projects Theses, Dissertations, and Senior Projects
2009
Recent two-feldspar, Ti-in-biotite, and garnet-biotite geothermometry of the Frontenac terraneand Adirondack Lowlands, Grenville Province,Canada and the United StatesAshley Russell
Follow this and additional works at: https://commons.und.edu/senior-projects
This Thesis is brought to you for free and open access by the Theses, Dissertations, and Senior Projects at UND Scholarly Commons. It has beenaccepted for inclusion in Undergraduate Theses and Senior Projects by an authorized administrator of UND Scholarly Commons. For moreinformation, please contact [email protected].
Recommended CitationRussell, Ashley, "Recent two-feldspar, Ti-in-biotite, and garnet-biotite geothermometry of the Frontenac terrane and AdirondackLowlands, Grenville Province, Canada and the United States" (2009). Undergraduate Theses and Senior Projects. 102.https://commons.und.edu/senior-projects/102

Recent two-feldspar, Ti-in-biotite, and garnet-biotite geothermometry of the
Frontenac terrane and Adirondack Lowlands, Grenville Province, Canada and the
United States
Ashley Russell
A Thesis Submitted to the University of North Dakota
Honors Program Committee
In Partial Fulfillment of the Requirements For Graduation
As a Scholar in the Honors Program
Grand Forks, North Dakota
Table of Contents
1. Executive Summary 1
2. Abstract 6
3. Introduction 6
4. Geological Setting 7
a. The Grenville Province 7
b. Determining Terranes of the Grenville 8
c. The Adirondack Region 9
d. The Adirondack Highlands-Lowlands Boundary 10
e. The Adirondack Lowlands-Frontenac Terrane Boundary 11
f. The Black Lake Shear Zone 12
5. Previous Studies of the Region 13
6. Samples and Analyses 15
7. Petrology 16
a. Adirondack Lowlands 16
b. Frontenac terrane 17
8. Phase Equilibria 17
9. Geochemistry 19
10. Metamorphic Temperatures 20
a. Ti-in-biotite results 21
b. Two-feldspar results 22
c. Garnet-biotite results 23
11. Discussion 25
a. Geothermometry 25
b. Geochemistry 28
12. Conclusion 29
13. Acknowledgements 30
14. References 31
15. Tables 34

1
Executive Summary
Relatively young rocks (geologically) and other materials make up the outer edges of
continents. In contrast, the interiors of many continents contain the world’s oldest rocks,
many of which formed during the Precambrian (4600 to 542 million years ago). These
ancient interiors are composed of diverse regions with different geology that geoscientists
call "terranes". In the Precambrian, continental drift and plate tectonics caused these
individual terranes to join to produce large continents with boundaries that were at first
sharp and recognizable. With continued tectonism, however, these boundaries became
obscure. Rocks composing these terranes were metamorphosed and deformed and, in
many cases, can no longer be associated with any specific geologic setting. Still, if we
are to understand the evolution of North America, it is important to reconstruct how these
terranes came together to produce the continent we know today.
The region including the Adirondack Mountains in Upstate New York and southern
Ontario is composed of several of these Precambrian terranes – the Adirondack
Lowlands, the Adirondack Highlands, and the Frontenac terrane (see Figure 1).
Uncertainty exists as to how the terranes were “sutured” together and how the
Adirondacks were actually “attached” to the rest of the continent. The Black Lake Shear
Zone (BLSZ), a 10-km wide area of mangled, partially melted rocks, is one possible
candidate for a major suture. A 2008/2009 Keck Geology Consortium project was
devoted to collecting data in the Adirondack Lowlands and into the Ontario Frontenac

2
terrane to investigate whether the BLSZ is the tectonic boundary representing the welding
of the Adirondacks onto the rest of the North American Precambrian core.
To test this hypothesis, we looked for evidence of any sort of discontinuity across the
BLSZ. This thesis presents results of the analysis of aluminous metamorphic rocks
(metapelites) from either side of the BLSZ. Metamorphic rocks can record tectonic
history determined by calculating the peak temperature conditions they underwent. To
allow calculation of peak temperatures, the mineral assemblages in the rocks, and the
composition of individual minerals, need to be determined. If the patterns of these peak
temperatures, when plotted on a regional map, show a discontinuity, it would be evidence
supporting the hypothesis that the BLSZ is a major tectonic boundary. We also studied
the geochemistry of the metapelites to determine protolith, or rock type before
metamorphism.
We used a variety of methods while completing this investigation. First, we collected
samples in the field from either side of the BLSZ. We obtained geochemical analyses
(for major elements) by making glass disks from each sample and analyzing them with a
Philips PW2404 X-ray fluorescence spectrometer at Colgate University. Trace element
concentrations were measured for 12 samples using pressed powder disks and a Philips
PW2404 X-ray fluorescence spectrometer, and rare-earth-element concentrations,
thought to be immobile during metamorphism, were measured for five samples. We
compared geochemical concentrations and chemical signatures from shales, called the
3
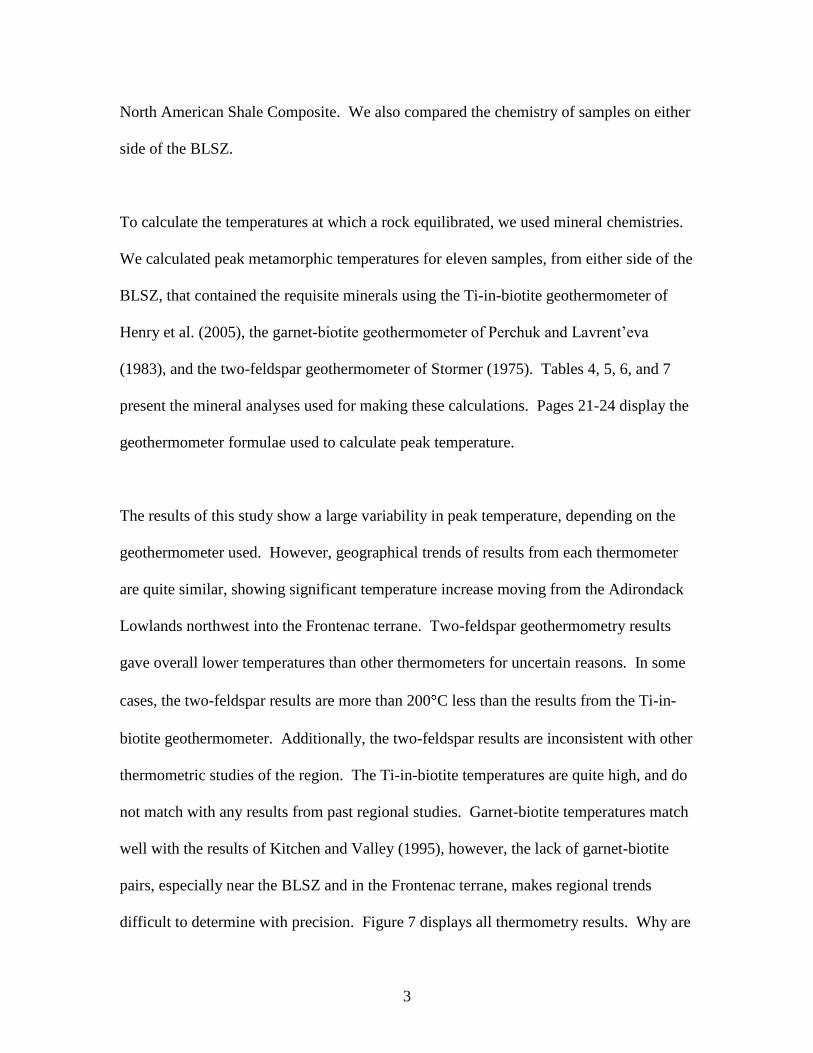
North American Shale Composite. We also compared the chemistry of samples on either
side of the BLSZ.
To calculate the temperatures at which a rock equilibrated, we used mineral chemistries.
We calculated peak metamorphic temperatures for eleven samples, from either side of the
BLSZ, that contained the requisite minerals using the Ti-in-biotite geothermometer of
Henry et al. (2005), the garnet-biotite geothermometer of Perchuk and Lavrent’eva
(1983), and the two-feldspar geothermometer of Stormer (1975). Tables 4, 5, 6, and 7
present the mineral analyses used for making these calculations. Pages 21-24 display the
geothermometer formulae used to calculate peak temperature.
The results of this study show a large variability in peak temperature, depending on the
geothermometer used. However, geographical trends of results from each thermometer
are quite similar, showing significant temperature increase moving from the Adirondack
Lowlands northwest into the Frontenac terrane. Two-feldspar geothermometry results
gave overall lower temperatures than other thermometers for uncertain reasons. In some
cases, the two-feldspar results are more than 200 C less than the results from the Ti-in-
biotite geothermometer. Additionally, the two-feldspar results are inconsistent with other
thermometric studies of the region. The Ti-in-biotite temperatures are quite high, and do
not match with any results from past regional studies. Garnet-biotite temperatures match
well with the results of Kitchen and Valley (1995), however, the lack of garnet-biotite
pairs, especially near the BLSZ and in the Frontenac terrane, makes regional trends
difficult to determine with precision. Figure 7 displays all thermometry results. Why are

4
the results discordant? The reasons for the extreme variability in thermometry results
may be due to poor calibrations of the geothermometers for the rocks studied, from fluid
infiltration along the BLSZ, or from retrogression (chemical re-equilibration) after the
peak of metamorphism.
Results from all geothermometers demonstrated the same NNW-SSE trend. This trend
shows higher temperatures in the Frontenac terrane, dropping to a low west of
Gouverneur, NY, and then increasing again near another shear zone, the Carthage-Colton
Mylonite Zone (CCMZ) to the southeast. This trend is consistent with the previous study
of Kitchen and Valley (1995). However, the results near the BLSZ are too ambiguous to
determine if there is a discontinuity or not. The ambiguity is mainly due to the lack of
outcrop near the BLSZ.
The rock geochemistry reflects a shale protolith for the metapelites of the Adirondack
Lowlands, and shale is the probable protolith of Frontenac terrane metapelites as well.
Small differences are present in the geochemical signatures of the two regions, but due to
the small number of samples from the Frontenac terrane, no firm conclusions are possible
based on geochemical continuity. Figures 8 and 9 show these correlations.
Determining the nature of contacts between Precambrian terranes is difficult, but
important to develop the history of the assembly of North America and for understanding
ancient plate tectonic interactions. Unfortunately, the results of this study did not answer
the original question posed, and ended up creating more questions about the region
5
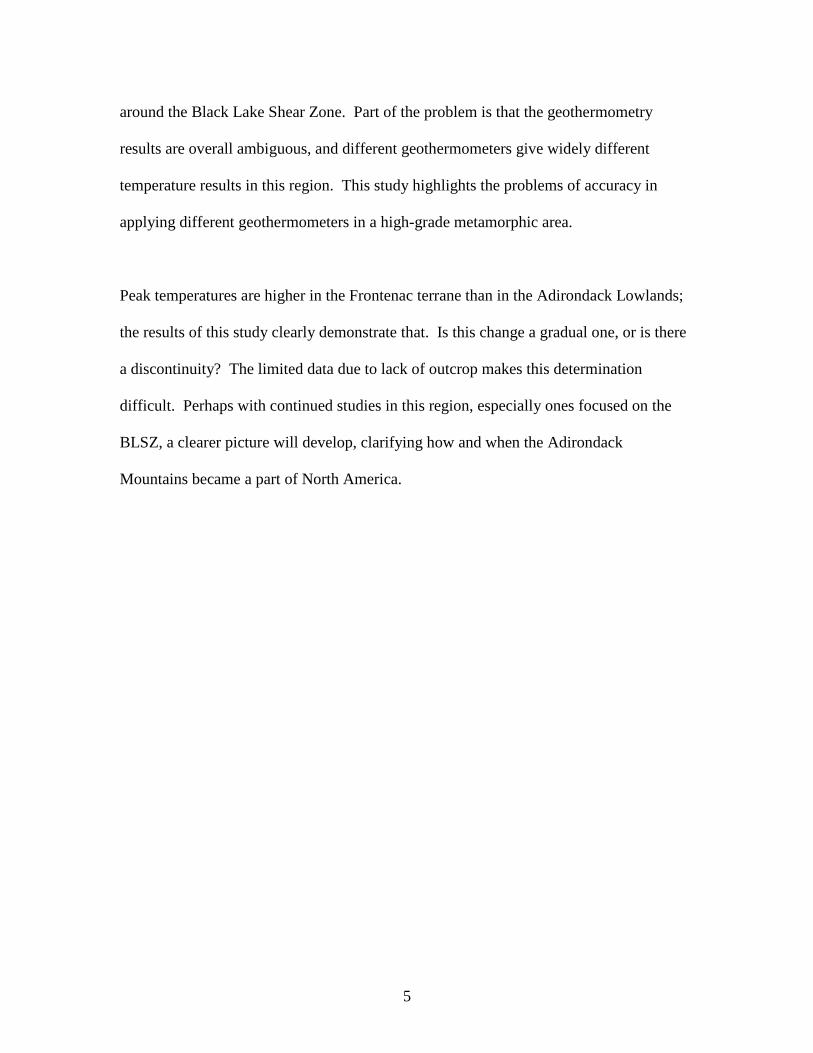
around the Black Lake Shear Zone. Part of the problem is that the geothermometry
results are overall ambiguous, and different geothermometers give widely different
temperature results in this region. This study highlights the problems of accuracy in
applying different geothermometers in a high-grade metamorphic area.
Peak temperatures are higher in the Frontenac terrane than in the Adirondack Lowlands;
the results of this study clearly demonstrate that. Is this change a gradual one, or is there
a discontinuity? The limited data due to lack of outcrop makes this determination
difficult. Perhaps with continued studies in this region, especially ones focused on the
BLSZ, a clearer picture will develop, clarifying how and when the Adirondack
Mountains became a part of North America.
6
Abstract
Reconstructing the assembly of the Middle Proterozoic
Adirondack Mountains and surrounding regions is difficult due to high-
grade metamorphism, igneous intrusions, faulting, erosion, and dense
cover. A 2008/2009 Keck Geology Consortium Project devoted itself to
collecting petrological and structural data in the Adirondack Lowlands and
into the Frontenac terrane of Ontario with the hypothesis that a shear zone
near the St. Lawrence River, the Black Lake Shear Zone (BLSZ), may be
a tectonic boundary representing the welding of the Adirondacks onto the
rest of the Precambrian core. In this study, to determine if or if not the
BLSZ is a discontinuity, we used garnet-biotite, Ti-in-biotite, and two-
feldspar geothermometry and we examined the geochemistry of
Adirondack Lowlands and Frontenac terrane pelites. Rare-earth elements
and trace element concentrations reveal a shale protolith for the
Adirondack Lowlands pelites and most likely for the Frontenac terrane
pelites. The mineralogy reflects upper amphibolite facies conditions in the
Adirondack Lowlands and granulite facies conditions in the Frontenac
terrane. Geothermometry from all three thermometers confirmed higher
temperatures in the Frontenac terrane than in the Adirondack Lowlands,
but lack of samples due to cover near the BLSZ makes it difficult to
determine if this temperature difference is gradual or abrupt. Temperature
results varied greatly between geothermometers with Ti-in-biotite results
being approximately 200°C higher than two-feldspar temperature results.
These inconsistencies between geothermometers may be due to problems
with calibrations or fluid infiltration in association with the shear zone.
The region requires more work as every new study helps to construct the
history of the Adirondack Mountains.
Introduction
Many continents are composed of an ancient core of discrete tectonic terranes, adjacent
pieces of crust that have distinctly different geologic histories. When individual terranes
join to produce large continents, the boundaries are at first sharp and recognizable. With
continued tectonism, however, they become more obscure, especially because the
boundaries may be neither planar nor vertical. Recognizing terranes and terrane
boundaries today in these ancient settings is often difficult because of high-grade
7
metamorphism, igneous intrusions, faulting, erosion, and dense cover. Finding outcrop
where one would like can sometimes be difficult.
The geologic terranes including and surrounding the Adirondack Mountains in Upstate
New York exemplify this type of situation. Some areas have been intensely eroded by
glacial periods leaving no outcrop to study, the cover is dense due to a mild and wet
climate, and up to three orogenic periods have been recorded in the region resulting in
rocks that demonstrate intense metamorphism, infiltration of fluids, the intrusion of
plutonic suites, and abundant faulting, including the presence of several shear zones. Due
to these complications, reconstructing the history of the Adirondacks has been difficult.
Today, a full picture of the Adirondacks’ construction is far from complete.
For this reason, a 2008/2009 Keck Geology Consortium project was devoted to collecting
petrological and structural data in the Adirondack Lowlands and into Ontario with the
hypothesis that a shear zone near the St. Lawrence River, the Black Lake Shear Zone
(BLSZ), may be a tectonic boundary representing the welding of the Adirondacks onto
the rest of the Precambrian core. Out of this research, nine different projects formed
focusing on characterizing the BLSZ and finding discontinuities across the zone. This
thesis presents one of those projects.
Geological Setting
The Grenville Province

8
The Grenville Province is the youngest portion of the Canadian Shield formed by
accretionary orogeny in the middle to late Mesoproterozoic along the eastern margin of
Laurentia. This accretionary orogeny was due to the closure of an ocean and a following
continental collision (Davidson 1998). These collisionary tectonics are estimated to have
taken place between 1.3 and 1.0 Ga and are called the “Grenville orogenic cycle”
(Davidson 1998), ending with the exhumation of highly deformed and metamorphosed
rocks. Three zones divide the Grenville Province dependent on geochronology and
orogenic influence. The northwestern zone contains rocks consisting of reworked
equivalents from older portions of the shield. The central zone contains rocks deformed
in pre-Grenvillian orogeny, but that have no equivalents in the older parts of the shield.
The southeastern zone consists of supracrustal and plutonic rocks with only Grenville-age
signatures (Davidson 1998). Distinct terranes, with boundaries composed typically of
shear zones, further subdivide the three zones. This makes the Grenville Province a large
aggregate of many regions, with differing lithological properties, that may, or may not,
represent exotic additions to Laurentia.
Determining Terranes of the Grenville
Geoscientists employ several geological and geophysical methods to denote specific
terranes, classify the bounding shear zones, and determine whether the terranes are exotic
additions, rearranged blocks, or pre-Grenvillian incorporations. Structural style
(Davidson 1984), the ages of igneous suites (Corriveau and van Breemen 1990),
geophysical seismic studies of the Canadian Lithoprobe project (Carr et al. 2000), source
rock mapping (Peck et al. 2004), age of peak metamorphism (Mezger et al. 1992),
9
cooling rates (Mezger et al. 1991), and peak metamorphic conditions (Bohlen 1985,
Anovitz and Essene 1990, Valley et al. 1990, Streepy et al. 1997) are all used, and often
integrated, to define terranes.
Many of the shear zones throughout the Grenville Province separate terranes with
differing peak metamorphic temperatures and pressures. For instance, the Maberly Shear
Zone (MSZ), seen in Figure 1, separates the granulite facies Frontenac terrane from the
upper greenschist to amphibolite facies Sharbot Lake terrane (Davidson 1998). A
compilation of peak metamorphic thermobarometry data by Streepy et al. 1997 showed
that zones of ductile shear greatly affect peak metamorphic temperature and pressure
gradients in the southeastern zone of the Grenville. Coupled with other information listed
above, we can determine if shear zones juxtapose regions with different tectonic histories.
The Adirondack Region
The region of the Grenville Province southeastern zone in southern Ontario and northeast
New York State consists of several areas with contrasting geology: the Frontenac terrane,
the Adirondack Lowlands, and the Adirondack Highlands, with the Frontenac terrane and
the Adirondack Lowlands straddling the St. Lawrence River. Technically, the Frontenac
terrane extends from the Maberly Shear Zone in Ontario, southeast across the St.
Lawrence River in the Thousand Islands region, into the Adirondack Lowlands, and ends
at the Carthage-Colton Mylonite Zone (CCMZ). The Frontenac terrane and the
Adirondack Lowlands are typically referred to however as separate entities with the
Frontenac terrane in Canada and the Adirondack Lowlands in the United States. The
CCMZ then separates the Adirondack Lowlands from the Adirondack Highlands to the
10
east (Figure 1). It is, according to Wasteneys et al. (1999), a NE-trending fault and major
terrane boundary characterized by low-angle extensional faulting that down-dropped the
Adirondack Lowlands at the end of the Ottawan Orogeny (1090 Ma-1035 Ma).
The Adirondack Highlands-Lowlands Boundary
The Adirondack Lowlands-Highlands Boundary
The Adirondack Lowlands and Highlands appear to be two distinct terranes that reached
peak metamorphism at different times. The Adirondack Lowlands had a peak in
metamorphism at 1140-1160 Ma, and the Adirondack Highlands peaked at 1030 Ma
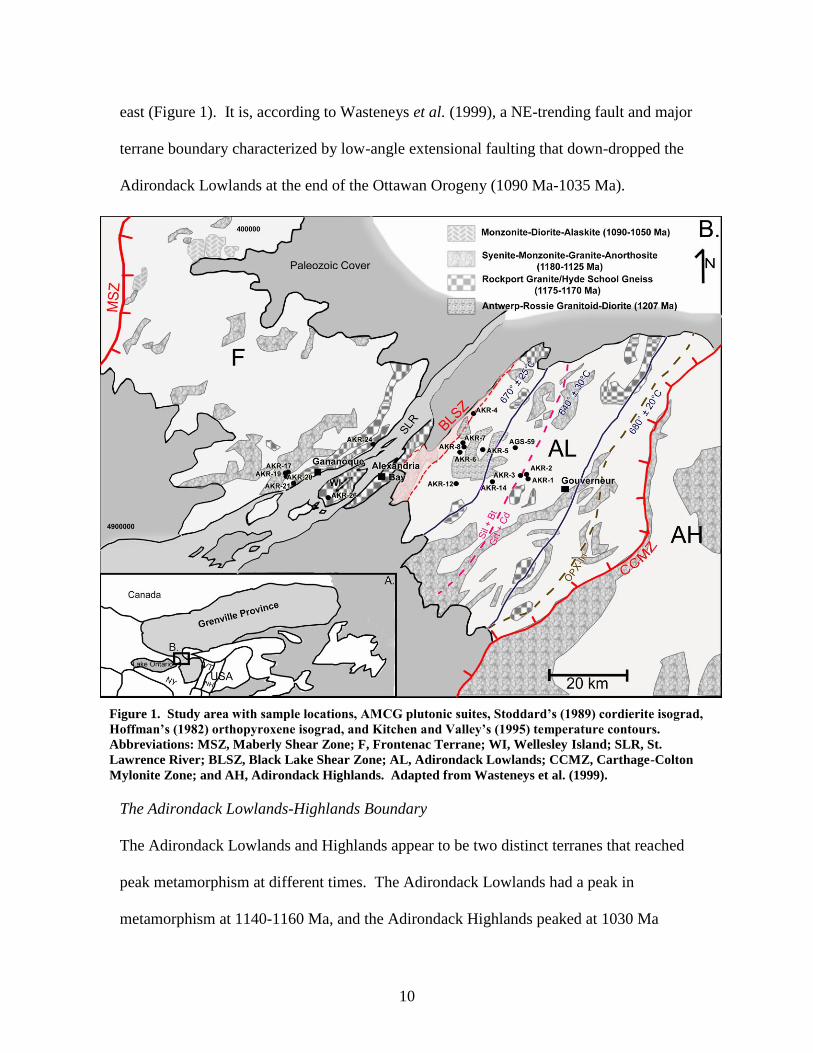
Figure 1. Study area with sample locations, AMCG plutonic suites, Stoddard’s (1989) cordierite isograd,
Hoffman’s (1982) orthopyroxene isograd, and Kitchen and Valley’s (1995) temperature contours.
Abbreviations: MSZ, Maberly Shear Zone; F, Frontenac Terrane; WI, Wellesley Island; SLR, St.
Lawrence River; BLSZ, Black Lake Shear Zone; AL, Adirondack Lowlands; CCMZ, Carthage-Colton
Mylonite Zone; and AH, Adirondack Highlands. Adapted from Wasteneys et al. (1999).
11
(Mezger et al. 1991, 1993). Peak metamorphism and anatexis of the Frontenac terrane,
including the Adirondack Lowlands, resulted from the accretionary events of the
Elzevirian Orogeny (1350-1220 Ma) (Tollo et al. 2004) and the Shawinigan Orogeny
from 1210 to 1160 Ma (Corrigan 1995), whereas peak metamorphism in the Adirondack
Highlands was due to the 1090-1035 Ma Ottawan Orogeny (Tollo et al. 2004). The
1160-1145 Ma anorthosite-mangerite-charnokite-granite (AMCG) suite intruded the
Adirondack Highlands, Adirondack Lowlands, and Frontenac terrane.
Lithologically, the Adirondack Highlands and Lowlands are also different. The
Adirondack Highlands contain mainly granulite facies intrusive rocks, including rocks of
the AMCG suite, and although there are AMCG rocks in the Lowlands, they intrude into
amphibolite facies metasedimentary rocks, primarily marble and metapelite, and some
orthogneiss and amphibolite (Kitchen and Valley 1995). The possibility that the
Adirondack Lowlands represents a higher crustal portion located next to the Adirondack
Highlands, a deeper portion of the same crustal block, may explain the differences in
lithology. Vertical juxtaposition, by the CCMZ, moved these two parts of the
"Adirondack crustal block" to their current locations.
The Adirondack Lowlands – Frontenac Terrane Boundary
Most workers place the boundary between the Adirondack Lowlands and the Frontenac
terrane at the St. Lawrence River, however some place the boundary at the Black Lake
Shear Zone, also called the Black Creek Shear Zone (Davidson 1998, McLelland et al.
2006). Evidence exists that both supports and refutes the continuity of these two terranes.
12
Currently, most authors consider the two continuous due to metamorphic timing, similar
lithologies, and magmatic crystallization ages (Peck et al. 2004). However, the limitation
of the Kingston Dike Swarm (1160 Ma) to the west side of the Black Lake Shear Zone,
the absence of Elzevirian magmatism from the Frontenac terrane, the absence of potassic
plutonics in the Adirondack Lowlands, and the abundance of quartzite in the Frontenac
terrane in comparison with the abundance of marble in the Adirondack Lowlands
(Davidson 1998, McLelland et al. 2006) all support the presence of a terrane boundary
separating the two regions. High-grade metamorphism and deformation however, have
made discerning this terrane boundary difficult, if one exists at all.
The Black Lake Shear Zone
Some evidence suggests that the 10-km wide, mylonitic Black Lake Shear Zone may be a
terrane boundary. Not only does it truncate the Kingston Dike Swarm, but it also limits
the presence of the 1210 Ma Antwerp-Rossie suite, calc-alkaline plutons thought to be
associated with westward subduction underneath the Lowlands. One way to test this
hypothesis is to examine in detail the variations in metamorphic grade and lithologies
across the region. Discontinuities may characterize the Black Lake Shear Zone if it is
indeed a terrane boundary. The goals of this study were to determine peak metamorphic
temperature of the Adirondack Lowlands near the Black Lake Shear Zone and in the
Frontenac terrane across the St. Lawrence River, and to determine the provenance of
metapelites from both regions.
13
Previous Studies of the Region
Some previous investigators studied metamorphic mineral assemblages to place
constraints on the peak pressure and temperature of metamorphism in the Frontenac
terrane and Adirondack Lowlands. Hoffman (1982) placed an orthopyroxene isograd
marking the change from amphibolite to granulite facies, parallel to strike and near the
CCMZ. Stoddard (1989) mapped a cordierite isograd, based on a sillimanite + biotite =
garnet + cordierite reaction, about 25 km farther west. Figure 1 shows both isograds.
A compilation by Streepy, Essene, and van der Plujim (1997) gives overall metamorphic
temperatures of 700-750ºC in the Ontario Frontenac terrane and 650-700ºC in the
Adirondack Lowlands. Estimations of pressure are ~6 kilobars for both areas increasing
to 7-8 kilobars nearing the CCMZ. Several major studies have contoured metamorphic
temperature in the Adirondack Lowlands.
Bohlen et al. (1985) completed the first temperature contours of the Adirondacks and
found temperatures in the Adirondack Lowlands around 600ºC increasing to the north to
725ºC near the town of Colton. Bohlen et al. (1985) based their temperature contours on
two-feldspar, magnetite-ilmenite, calcite-dolomite, and garnet-clinopyroxene
thermometry. In the Adirondack Lowlands, their contours cut perpendicular across the
NNE structural trend.
Edwards and Essene (1988) revised Bohlen’s et al. (1985) temperature contours by
adding their results from two-feldspar and garnet-biotite thermometry from the
14
Adirondack Lowlands near the CCMZ. Their results agreed with Bohlen et al. (1985),
but the study found significant differences between temperatures given by the garnet-
biotite thermometer and the two-feldspar thermometer. They also remarked that for
temperatures over 650ºC, different calibrations of the garnet-biotite thermometer gave
widely different results.
Kitchen and Valley (1995) used calcite-graphite thermometry data to again revise the
peak metamorphic temperature contours in the Adirondack Lowlands. Their results
differed completely from the previous studies. Kitchen and Valley’s contours (Figure 1)
followed along trend, temperatures were up to 75ºC higher than Bohlen et al. (1985), and
the study found a trough of low temperature (640 ± 30ºC) centered just west of
Gouverneur (Figure 1). Temperatures to the west and east of this trough were 30-40ºC
greater. A study done by Will and Dunn (2009) found temperatures similar to Kitchen
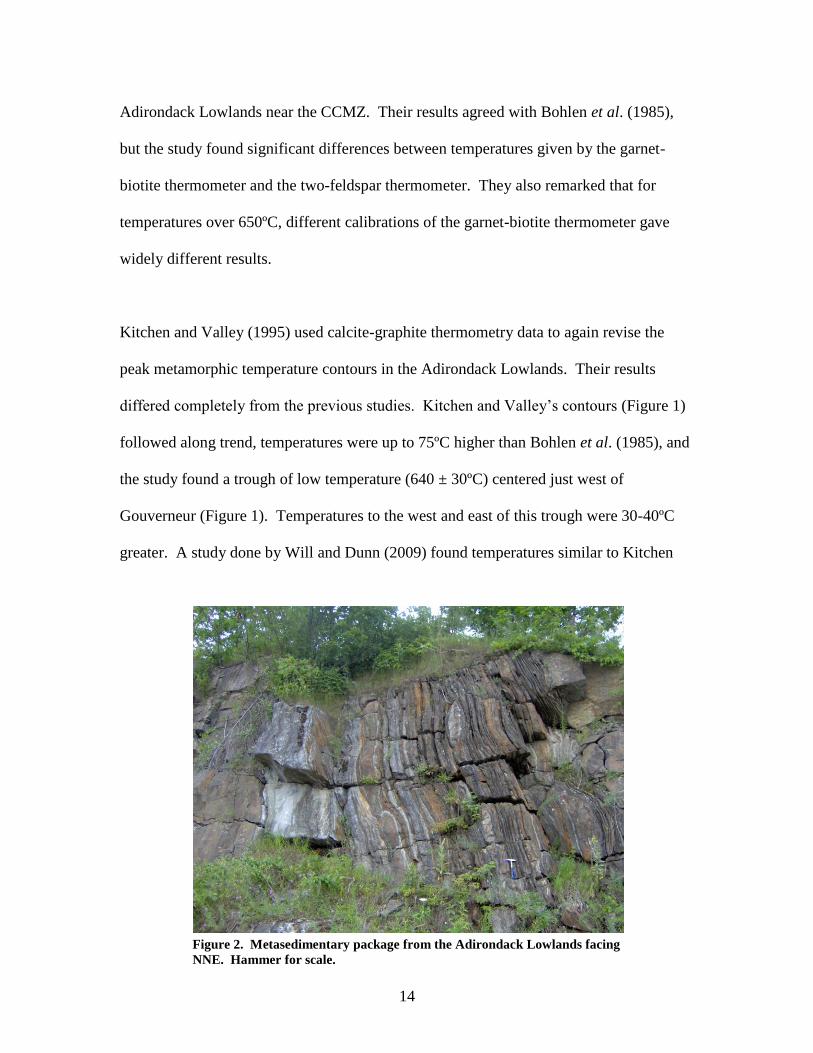
Figure 2. Metasedimentary package from the Adirondack Lowlands facing
NNE. Hammer for scale.

15
and Valley’s (1995) results, but found higher temperatures closer to the BLSZ, pulling
their 675ºC contour toward the NNW.
Samples and Analyses
The goals of this study were to determine peak metamorphic temperature as well as
protolith of Frontenac metapelites. To that end, I collected 17 metapelite samples from a
60-km wide region west of Gouverneur, New York, and extending just over the St.
Lawrence River into Canada (Figure 1). Some samples are from sedimentary packages
that also included marble and quartzite (Figure 2). A thin section was made from each
sample and all samples were analyzed for major elements, and some samples for minor
elements. We examined thin sections using a petrographic microscope and a Hitachi
Scanning Electron Microscope S-2300 with energy dispersive X-ray spectroscopy at the
University of North Dakota. Analysis of glass disks at Colgate University using a Philips
PW2404 X-ray fluorescence spectrometer obtained major element concentrations.
ACME Labs, Vancouver, British Columbia obtained trace element compositions in five
Adirondack Lowlands samples using four-acid Ultrace inductively coupled plasma mass
spectrometry. Detection limits ranged from 2 ppm to 0.001 ppm depending on the
element. We analyzed trace elements for another 12 samples at Colgate University on
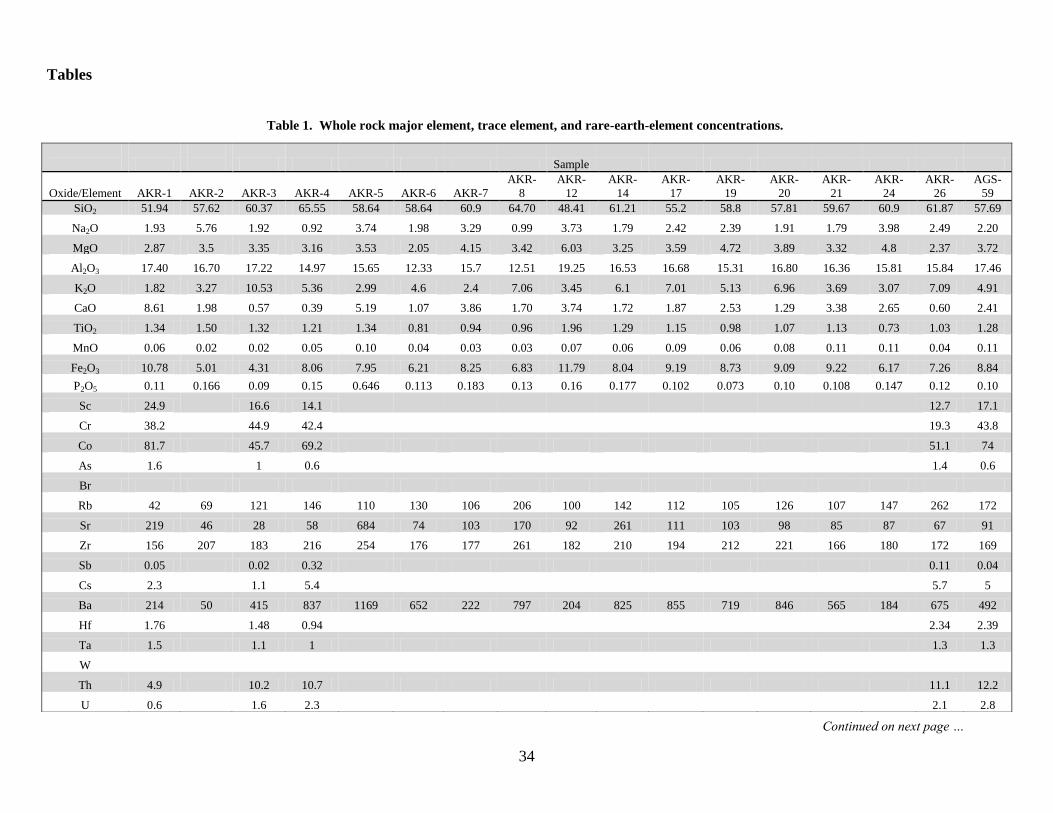
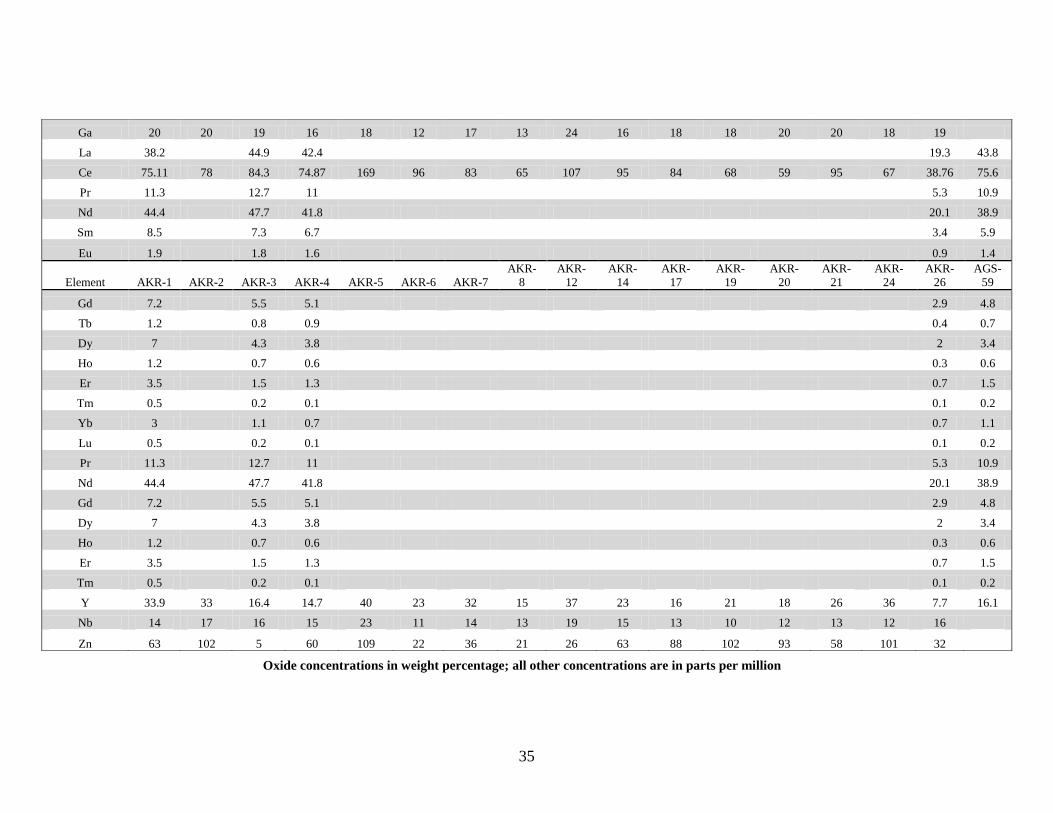
pressed powder disks, using a Philips PW2404 X-ray fluorescence spectrometer. Table 1
presents the chemical analyses. Samples chosen for geothermometry had mineral
chemistries analyzed with a Cameca SX100 electron microprobe at the University of
Michigan.

16
Petrology
Adirondack Lowlands
Upper amphibolite facies minerals and textures (Figure 3) characterize the samples from
the Adirondack Lowlands. Metamorphic textures include mineral lineations,
metamorphic “eyes”, symplectites, and biotite alteration to chlorite. Common mineral
assemblages were quartz + plagioclase + K-feldspar + biotite, however, we found garnet-
bearing, sillimanite-bearing, kyanite-bearing, cordierite-bearing, and muscovite-bearing
samples within the study area. We found one cordierite-bearing assemblage (AKR-3) in
the Adirondack Lowlands on Stoddard’s (1989) proposed cordierite isograd. The
“eyeschists”, first described by Buddington in 1934 all include the mineral sillimanite.
An eyeschist, from the interior of Wellesley Island, contains the assemblage orthoclase +
albite + quartz + biotite + muscovite + sillimanite + chlorite. The muscovite in this
17
sample appears to be in equilibrium with quartz, sillimanite, and orthoclase. Almost
every sample contains ilmenite and/or magnetite, and many contain tourmaline. Any
chlorite present in the samples is secondary.
Frontenac Terrane
The metapelites from the Frontenac terrane show the increase in grade from the upper
amphibolite facies conditions in the Adirondack Lowlands (Figure 3). Northwestern-
most samples have cordierite, orthopyroxene, and sillimanite present. The sample to the
south (AKR-21) is garnet-bearing. Garnets are almandine in composition with slight
pyrope enrichment at the rims. The northernmost sample contains both cordierite and
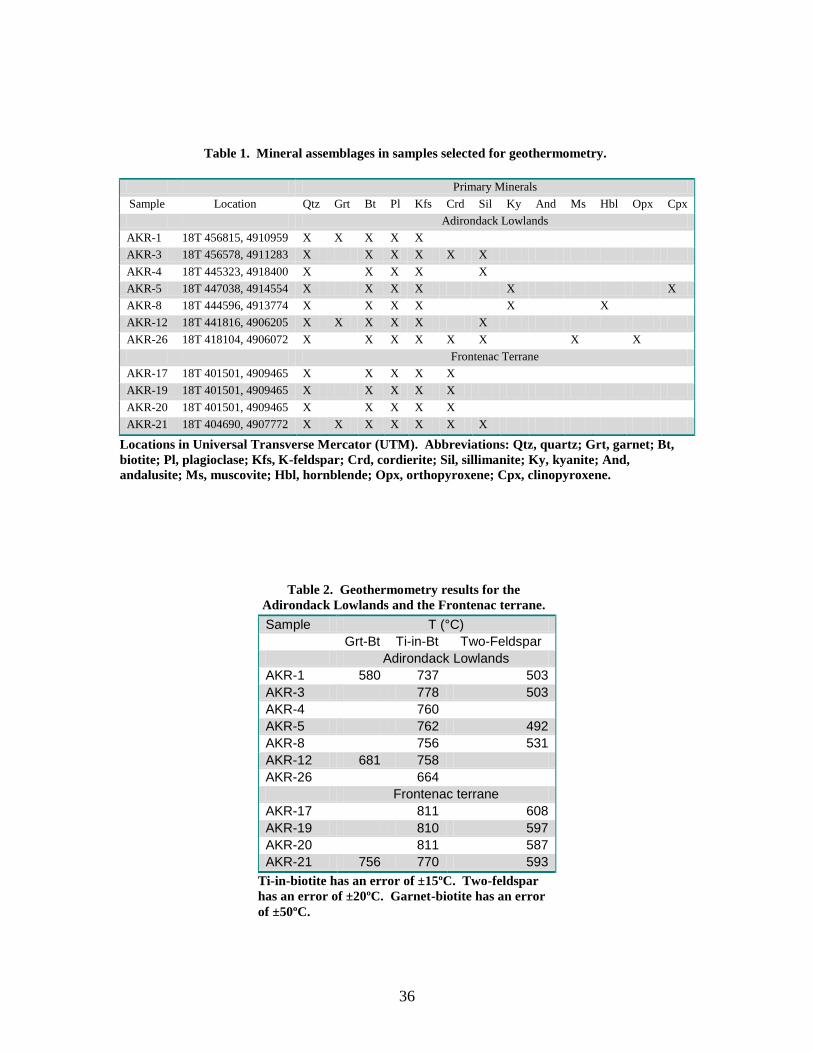
orthopyroxene. All samples have ilmenite and magnetite. Table 2 shows the mineral
assemblages of all the Frontenac terrane and Adirondack Lowlands samples used for
thermometry.
Phase Equilibria
Assuming peak metamorphism of the Adirondack Lowlands and Frontenac terrane was
water-saturated and accompanied by partial melting (Heumann et al. 2006), modeling is
possible of the metamorphic phase equilibria by the systems KFMASH, KFASH, and
KMASH, as outlined by Spear (1999). It is important to note that the exact fluid
composition is unknown in the Adirondack Lowlands and Frontenac terrane. Lower
water activity would move dehydration reactions to the left into lower temperatures. The
reactions characterizing the samples collected are as follows:
18
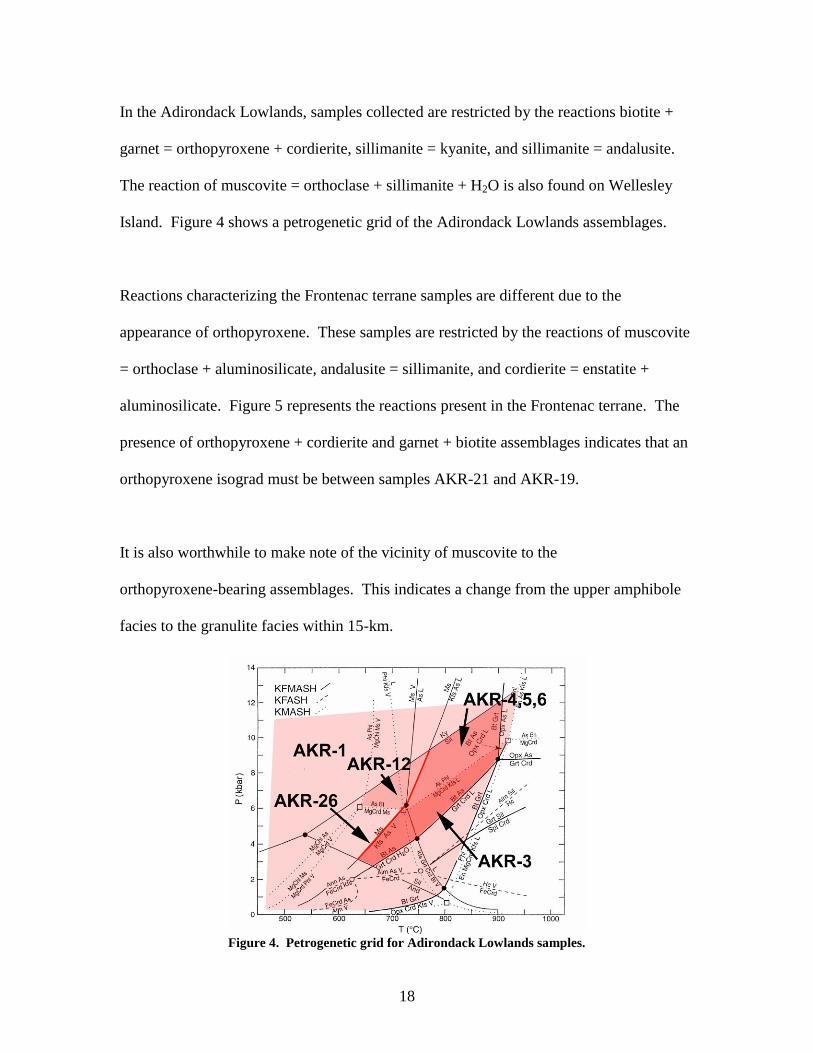
In the Adirondack Lowlands, samples collected are restricted by the reactions biotite +
garnet = orthopyroxene + cordierite, sillimanite = kyanite, and sillimanite = andalusite.
The reaction of muscovite = orthoclase + sillimanite + H2O is also found on Wellesley
Island. Figure 4 shows a petrogenetic grid of the Adirondack Lowlands assemblages.
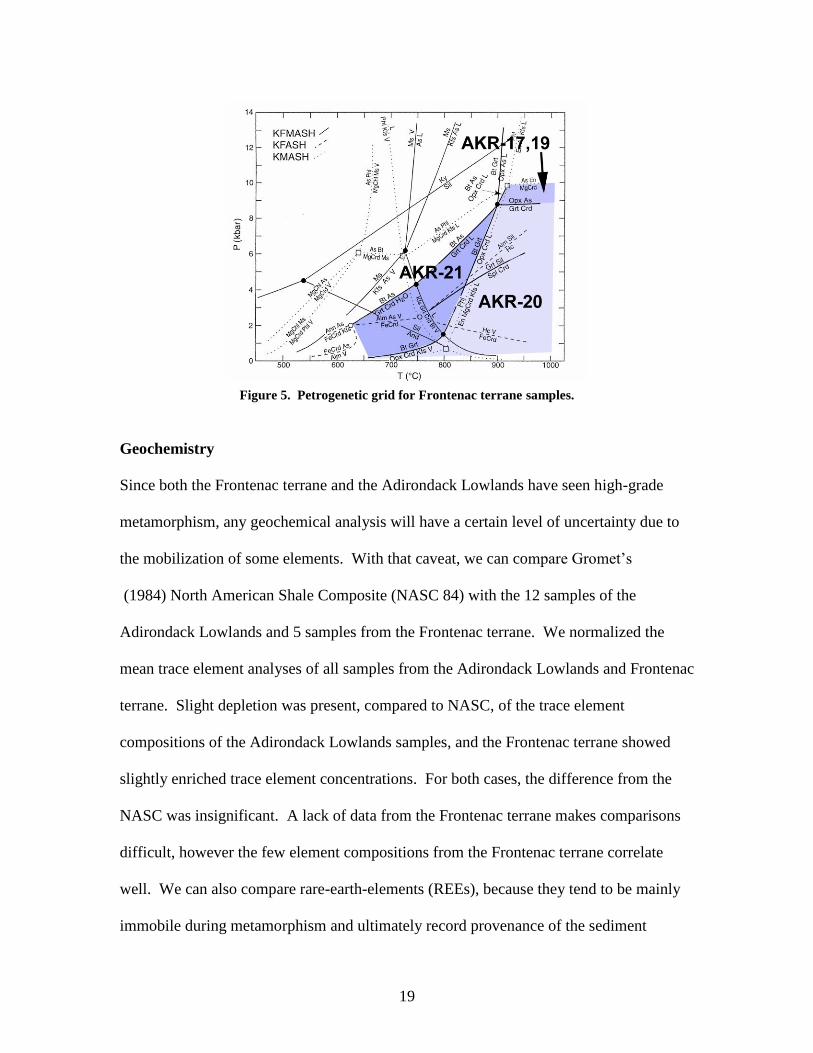
Reactions characterizing the Frontenac terrane samples are different due to the
appearance of orthopyroxene. These samples are restricted by the reactions of muscovite
= orthoclase + aluminosilicate, andalusite = sillimanite, and cordierite = enstatite +
aluminosilicate. Figure 5 represents the reactions present in the Frontenac terrane. The
presence of orthopyroxene + cordierite and garnet + biotite assemblages indicates that an
orthopyroxene isograd must be between samples AKR-21 and AKR-19.
It is also worthwhile to make note of the vicinity of muscovite to the
orthopyroxene-bearing assemblages. This indicates a change from the upper amphibole
facies to the granulite facies within 15-km.
Figure 4. Petrogenetic grid for Adirondack Lowlands samples.
19
Figure 5. Petrogenetic grid for Frontenac terrane samples.
Geochemistry
Since both the Frontenac terrane and the Adirondack Lowlands have seen high-grade
metamorphism, any geochemical analysis will have a certain level of uncertainty due to
the mobilization of some elements. With that caveat, we can compare Gromet’s
(1984) North American Shale Composite (NASC 84) with the 12 samples of the
Adirondack Lowlands and 5 samples from the Frontenac terrane. We normalized the
mean trace element analyses of all samples from the Adirondack Lowlands and Frontenac
terrane. Slight depletion was present, compared to NASC, of the trace element
compositions of the Adirondack Lowlands samples, and the Frontenac terrane showed
slightly enriched trace element concentrations. For both cases, the difference from the
NASC was insignificant. A lack of data from the Frontenac terrane makes comparisons
difficult, however the few element compositions from the Frontenac terrane correlate
well. We can also compare rare-earth-elements (REEs), because they tend to be mainly
immobile during metamorphism and ultimately record provenance of the sediment

20
(Rollinson 1993). We normalized five Adirondack Lowlands REE analyses to chondrite
(Taylor and McLennan 1985) and compared with NASC (Figure 4). The Adirondack
Lowlands samples showed slightly enriched Pr, Nd, Tb, and Yb concentrations, in
comparison with NASC, and had a stronger Eu anomaly. Overall, the REE composition
of the Adirondack Lowlands matched that of NASC.
Metamorphic Temperatures
We calculated peak metamorphic temperatures using three different geothermometers for
seven Adirondack Lowlands samples and four Frontenac terrane samples. Depending on
available mineral assemblages, we used the Ti-in-biotite (Henry et al. 2005), two-feldspar
(Stormer 1975, Haselton et al 1983), and garnet-biotite (Thompson 1976, Hold and Lee
Figure 6. Geothermometry results. Garnet-biotite results in italics; Ti-in-biotite results in
parentheses.
21
1977, Ferry and Spear 1978, Hodges and Spear 1982, Perchuk and Lavrent’eva 1983,
Dasgupta et al. 1991, Bhattacharya et al. 1992) geothermometers. Table 3 and Figure 6
show these results.
Ti-in-Biotite Results
We chose the recent Ti-in-biotite thermometer of Henry et al. (2005) for application in
this study due to its precision and application for calculating peak temperature for
ilmenite or rutile bearing metapelites. The basis of this thermometer is on the concept
that as temperatures increase, the Ti concentration in magnesian biotites increases as
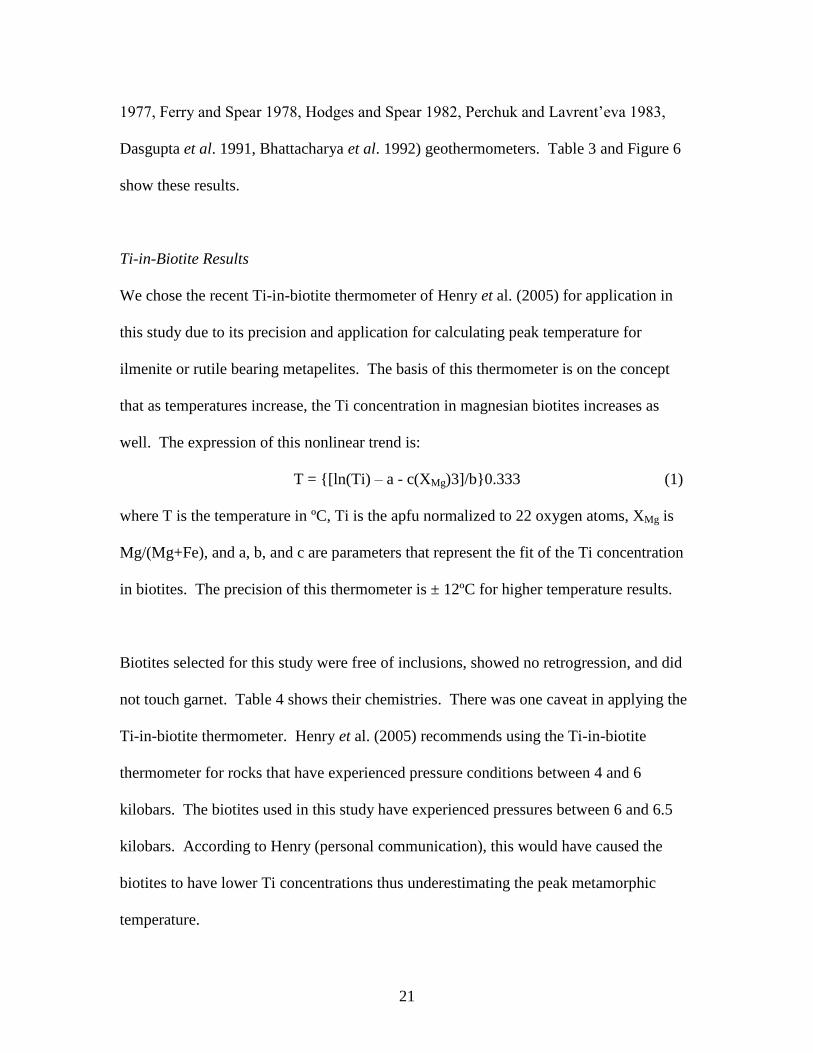
well. The expression of this nonlinear trend is:
T = {[ln(Ti) – a - c(XMg)3]/b}0.333 (1)
where T is the temperature in ºC, Ti is the apfu normalized to 22 oxygen atoms, XMg is
Mg/(Mg+Fe), and a, b, and c are parameters that represent the fit of the Ti concentration
in biotites. The precision of this thermometer is ± 12ºC for higher temperature results.
Biotites selected for this study were free of inclusions, showed no retrogression, and did
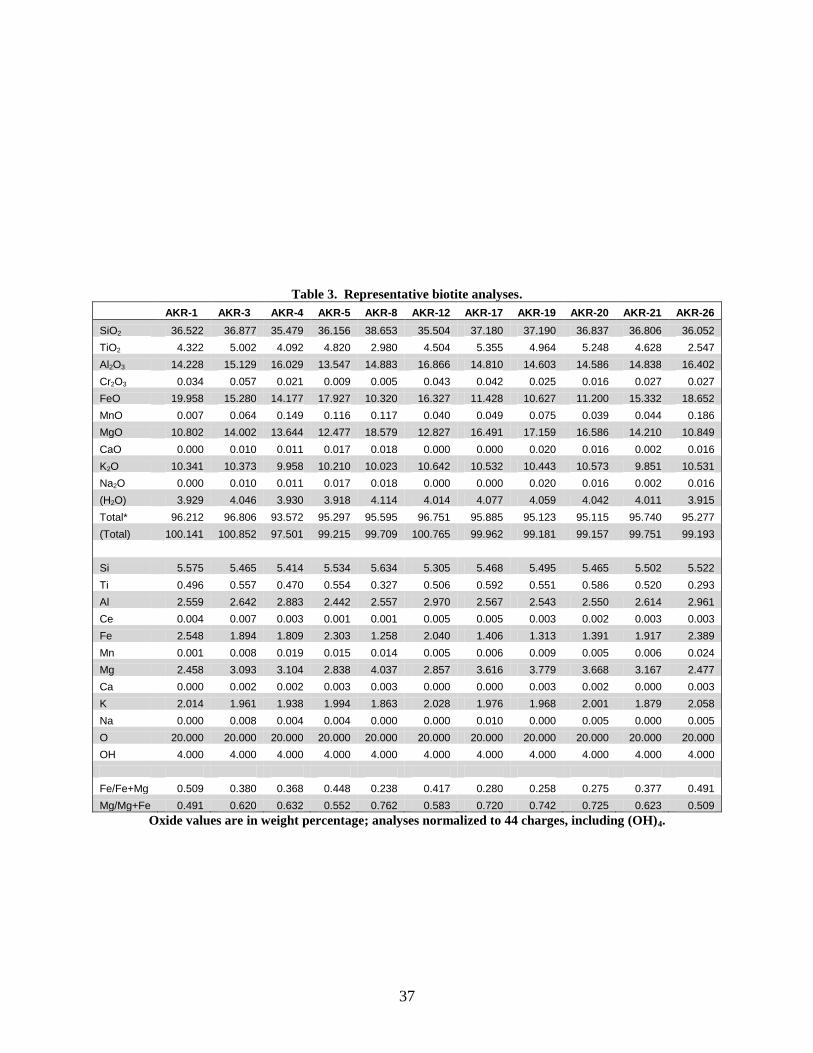
not touch garnet. Table 4 shows their chemistries. There was one caveat in applying the
Ti-in-biotite thermometer. Henry et al. (2005) recommends using the Ti-in-biotite
thermometer for rocks that have experienced pressure conditions between 4 and 6
kilobars. The biotites used in this study have experienced pressures between 6 and 6.5
kilobars. According to Henry (personal communication), this would have caused the
biotites to have lower Ti concentrations thus underestimating the peak metamorphic
temperature.
22
All 11 samples chosen for thermometry gave temperature results using the Ti-in-biotite
thermometer. Temperatures were overall too high in comparison with previous studies.
In the Adirondack Lowlands, temperatures ranged from 778ºC just west of Gouverneur
and decreased trending NNW to a low of 664ºC on Wellesley Island in the St. Lawrence
River. In one case, the results had discrepancies of about 50ºC between samples
collected less than one kilometer apart. In the Frontenac terrane, there were no
discrepancies for closely collected samples, but the temperatures were also very high.
Calculations resulted in temperatures of 770ºC along the St. Lawrence River increasing to
811ºC to the northwest.
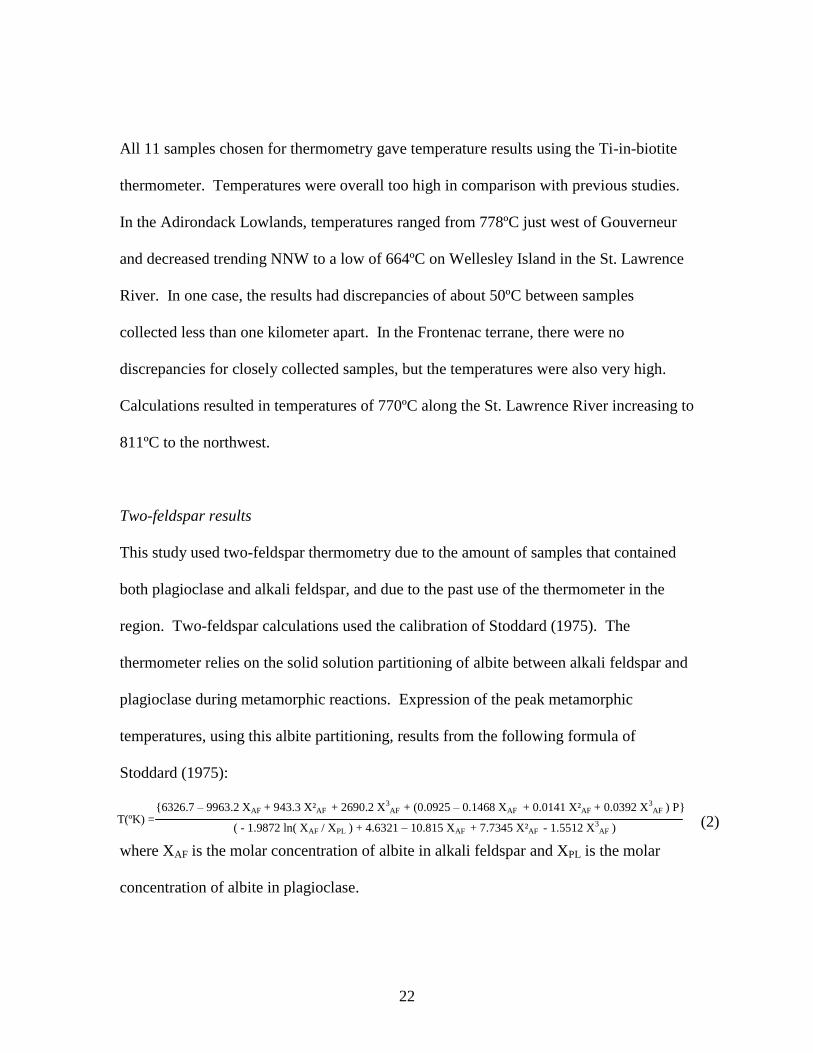
Two-feldspar results
This study used two-feldspar thermometry due to the amount of samples that contained
both plagioclase and alkali feldspar, and due to the past use of the thermometer in the
region. Two-feldspar calculations used the calibration of Stoddard (1975). The
thermometer relies on the solid solution partitioning of albite between alkali feldspar and
plagioclase during metamorphic reactions. Expression of the peak metamorphic
temperatures, using this albite partitioning, results from the following formula of
Stoddard (1975):
{6326.7 – 9963.2 XAF + 943.3 X²AF + 2690.2 X3AF + (0.0925 – 0.1468 XAF + 0.0141 X²AF + 0.0392 X3
AF ) P}
( - 1.9872 ln( XAF / XPL ) + 4.6321 – 10.815 XAF + 7.7345 X²AF - 1.5512 X3AF )
where XAF is the molar concentration of albite in alkali feldspar and XPL is the molar
concentration of albite in plagioclase.
T(ºK) = (2)
23
Feldspars analyzed for this study were free of inclusions and showed as little alteration as
possible. We took mineral chemistry analyses from the “cleanest” part of each feldspar.
For each sample, we analyzed at least three plagioclase feldspars and three alkali
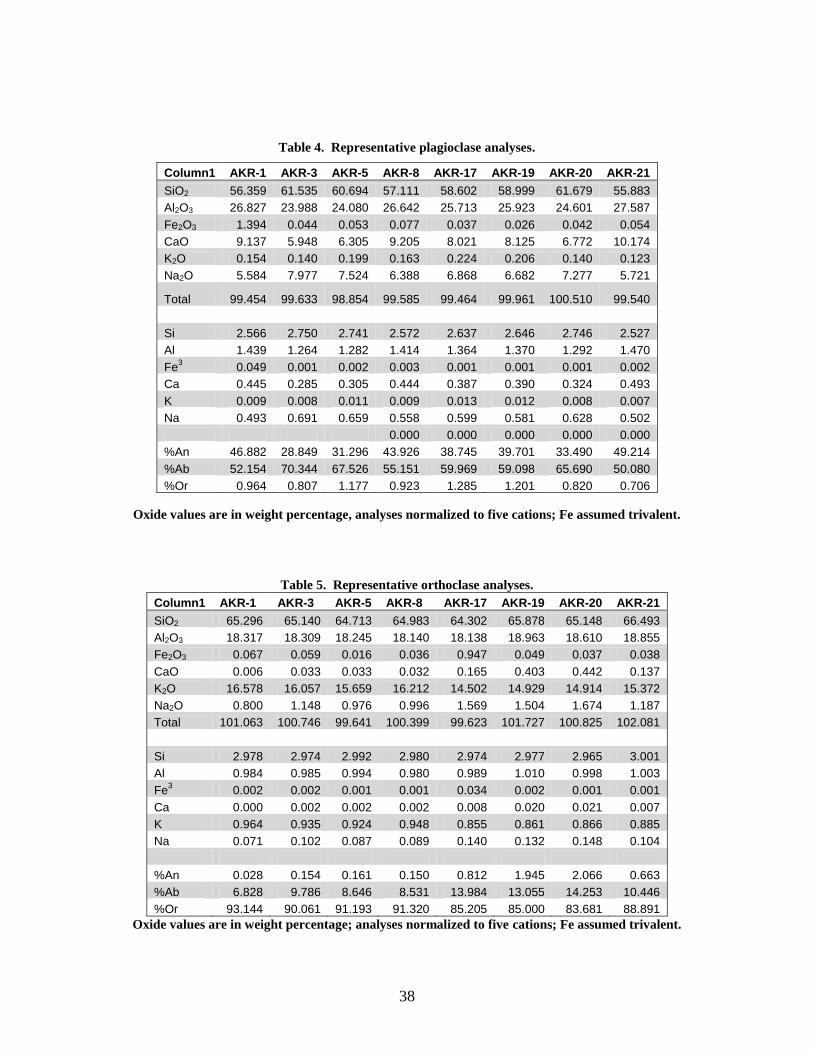
feldspars for each sample and averaged the results. Table 5 shows averaged plagioclase
chemistries and Table 6 shows averaged alkali feldspar chemistries.
Using the Stoddard (1975) thermometer, geothermometry was determined for four
Adirondack Lowlands samples and for four Frontenac terrane samples. Results were
overall lower than that of previous workers. In the Adirondack Lowlands, temperature
calculations gave 503ºC for the pelites just west of Gouverneur and showed an increase
to a calculated temperature of 531ºC near the BLSZ. In the Frontenac terrane, samples
showed no clear pattern; 593ºC was recorded from the western side of the St. Lawrence
River, and western-most samples averaged approximately 600ºC. In the Adirondack
Lowlands, closely collected samples had the same temperature results; in the Frontenac
terrane, closely collected samples differed at most by 20ºC.
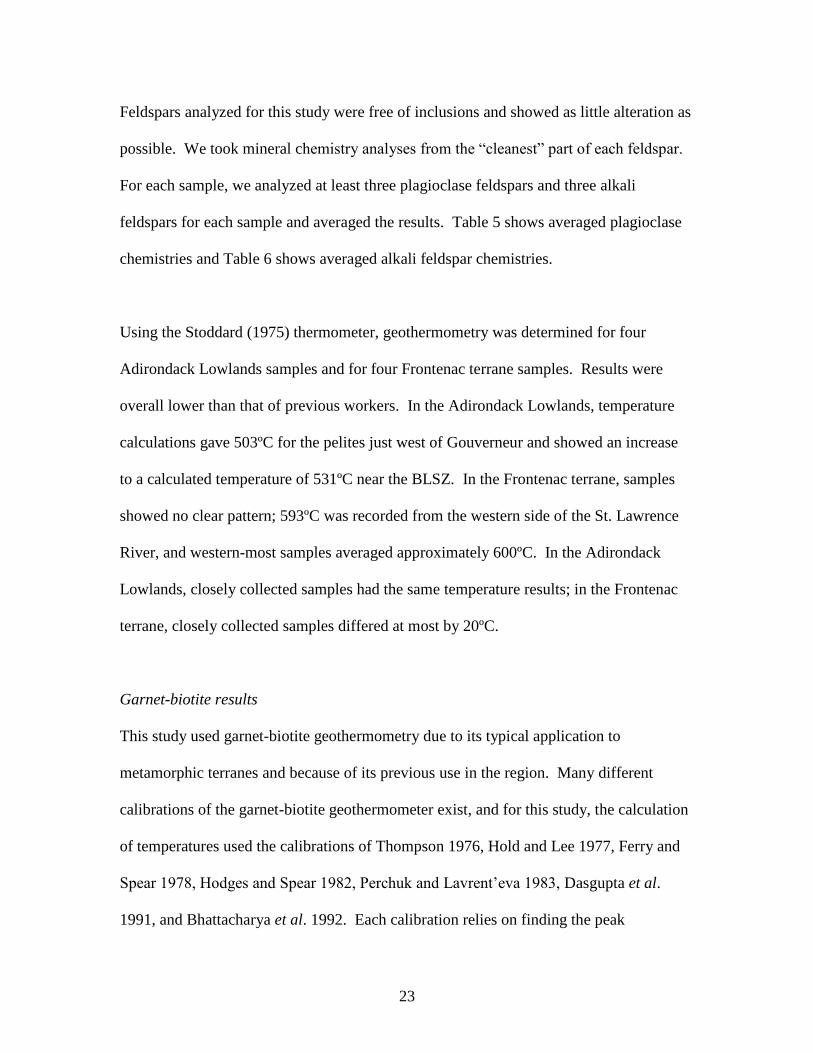
Garnet-biotite results
This study used garnet-biotite geothermometry due to its typical application to
metamorphic terranes and because of its previous use in the region. Many different
calibrations of the garnet-biotite geothermometer exist, and for this study, the calculation
of temperatures used the calibrations of Thompson 1976, Hold and Lee 1977, Ferry and
Spear 1978, Hodges and Spear 1982, Perchuk and Lavrent’eva 1983, Dasgupta et al.
1991, and Bhattacharya et al. 1992. Each calibration relies on finding the peak
24
metamorphic temperature due to the exchange of magnesium and iron between garnet
and biotite. Metamorphic temperature correlates to this distribution of magnesium and
iron between the two minerals. Cautions with this thermometer are pressure sensitivity
and the substitution of Ti and Al into biotites throwing off the Mg and Fe concentrations.
Results of this study for each calibration varied greatly. Several of the thermometers
(Dasgupta et al. 1991, Ferry and Spear 1978, Hodges and Spear 1982, Thompson 1976)
gave unreasonable results (temperatures over 850ºC). The other three thermometers
(Perchuk and Lavrent’eva 1983, Bhattacharya et al. 1992, Hold and Lee 1977) gave
similar results (less than 40ºC difference). Due to the commonality of the garnet-biotite
geothermometer calibration and its statistical precision (Chipera and Perkins 1988), the
Perchuk and Lavrent’eva (1983) calibration was determined to give the most accurate
results. The formula is as follows:
((3873 + 0.0124)1000)P)
(ln((1-XMg garnet)/(XMg garnet))((XMg biotite)/(1-XMg biotite)) + 2.868) – 273
where P is the pressure in kilobars, XMg garnet is the Mg/Mg + Fe ratio in garnet, and
XMg biotite is the Mg/Mg + Fe ratio in biotite.
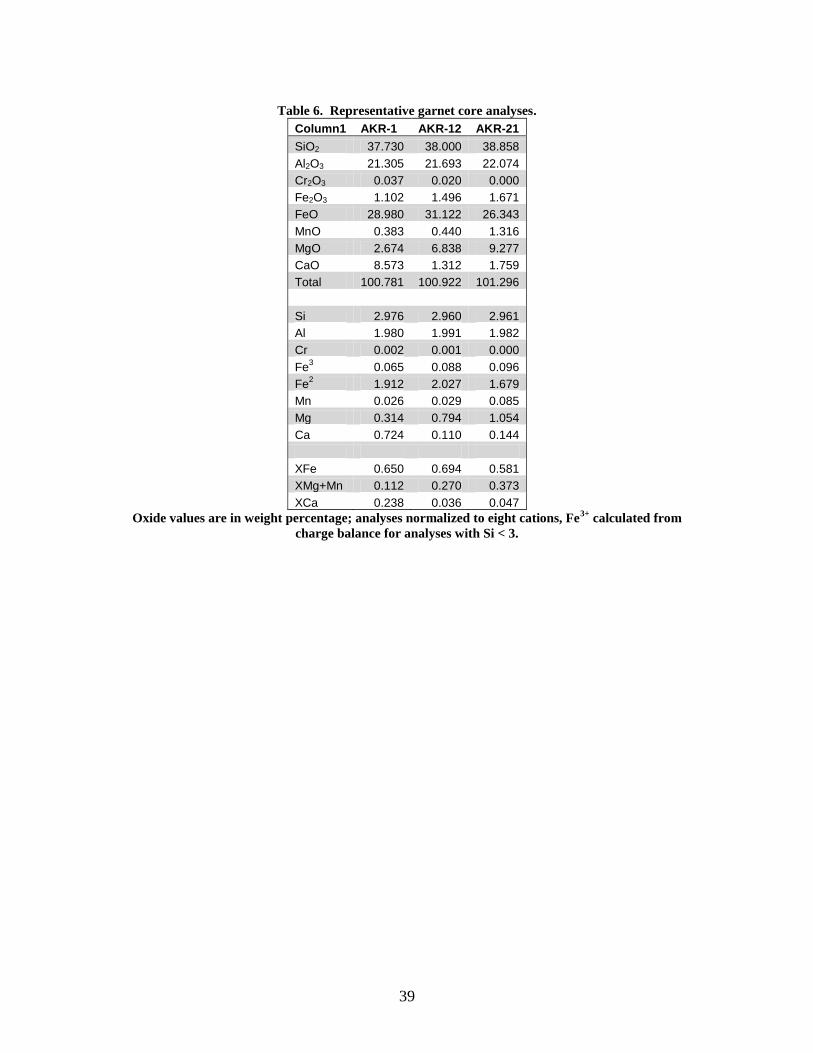
We analyzed garnet chemistries on areas free of inclusions and within the core of the
garnet as some of the samples displayed zoning. Biotites and garnets used for
geothermometry were not touching. Table 7 shows averaged garnet chemistries. Table 4
shows averaged biotite chemistries.
T(Cº) = (3)
25
We obtained temperature results from the Perchuk and Lavrent’eva (1983) garnet-biotite
thermometry calibration from two Adirondack Lowlands samples and one Frontenac
terrane sample. West of Gouverneur, a temperature of 580ºC was calculated. A higher
temperature of 681ºC was determined from near the Black Lake Shear Zone. On the
Canadian side of the St. Lawrence River, in the Frontenac terrane, one sample recorded a
temperature of 756ºC.
Discussion
Geothermometry
Results of this study show a large variability in peak temperature determinations between
different geothermometers. However, geographical trends of results from each
thermometer are quite similar. Figure 7 shows the extrapolation of all thermometry onto
a NNW-SSE trend, perpendicular to the structural trend of the Frontenac terrane and the
Adirondack Lowlands. This is a possible application due to previous work (Kitchen and
Valley 1995) that showed changes in metamorphic temperature were parallel the
structural trend. Figure 7 also shows Edwards and Essene’s (1988) two-feldspar and
garnet-biotite results added to the trend to give an idea of the change in peak temperature
from just inside the Frontenac terrane to the CCMZ. We calculated Ti-in-biotite
temperatures using Edwards and Essene’s (1988) data. The addition of second order
polynomial trend lines clarifies the pattern of the peak temperature results.
26
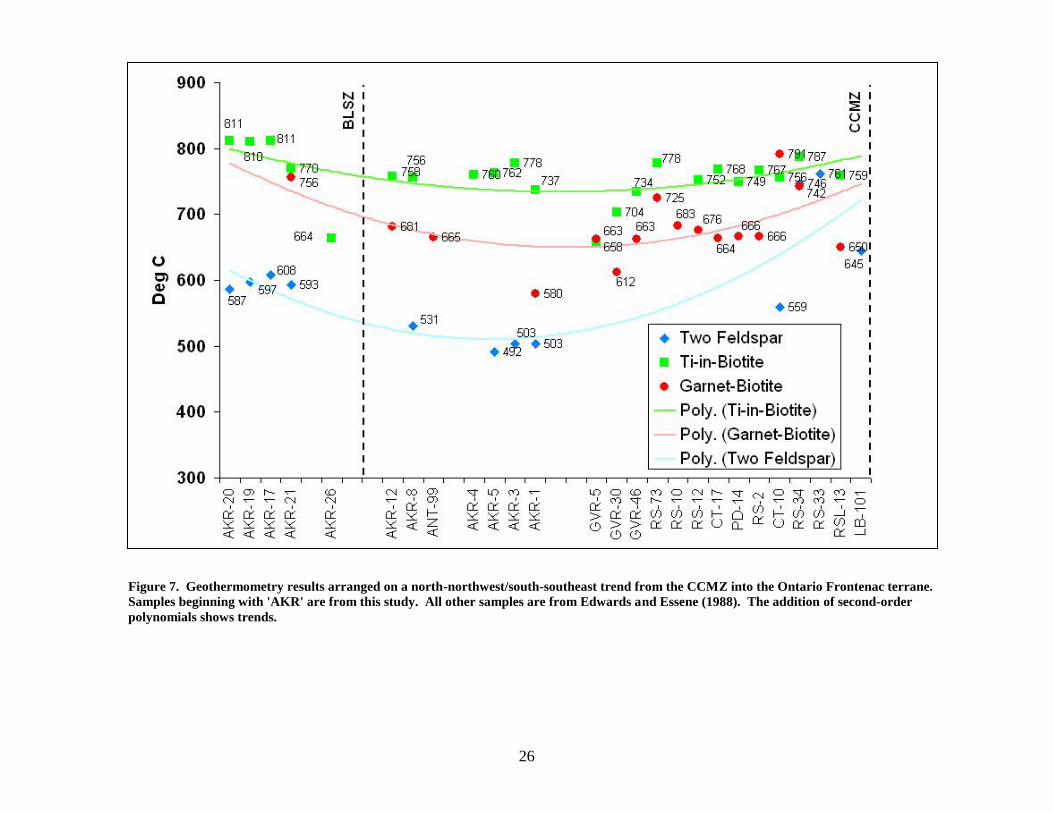
Figure 7. Geothermometry results arranged on a north-northwest/south-southeast trend from the CCMZ into the Ontario Frontenac terrane.
Samples beginning with 'AKR' are from this study. All other samples are from Edwards and Essene (1988). The addition of second-order
polynomials shows trends.
27
Figure 7 shows the high variability of temperature results from different
geothermometers. Two-feldspar geothermometry results are overall lower than compared
to previous workers, and in some samples, are more than 200°C less than the results from
the Ti-in-biotite geothermometer. The Ti-in-biotite results are quite high, and do not
seem to comply with any results from past regional studies. Garnet-biotite results
correlate the best with Kitchen and Valley (1995), however, the lack of garnet-biotite
thermometry, especially near the BLSZ and in the Frontenac terrane makes this trend
difficult to apply. Reasons for this extreme variability in thermometry results may be
from incorrect calibrations of these geothermometers in application to high-grade
metamorphic terranes. For instance, Stormer (1975) calibrated the two-feldspar
thermometer on igneous rocks, and the Ti-in-biotite geothermometer is relatively new
and may not yet be well calibrated. The various calibrations of garnet-biotite
geothermometry all gave different temperature results illustrating the sensitivity of
different calibrations to geologic settings. Fluid interactions near shear zones may also
affect mineral chemistries creating problems in determining peak temperature.
Results from all three geothermometers all demonstrated the same NNW-SSE trend.
This trend shows higher temperatures in the Frontenac terrane, dropping to a low west of
Governor, and then increasing again near the CCMZ. This trend agrees with that of
Kitchen and Valley (1995). Results are too ambiguous across the BLSZ to determine if
there is a discontinuity or not. This ambiguity is mainly due to the lack of outcrop near
the BLSZ.
28
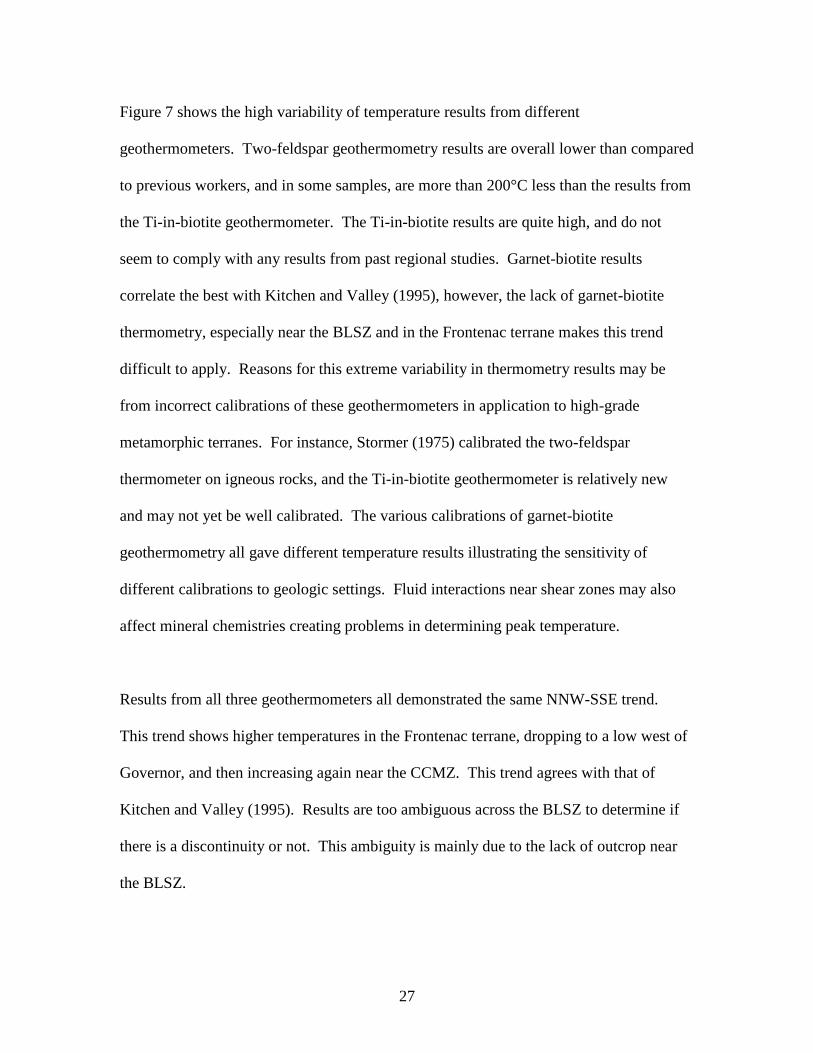
Geochemistry
Geochemistry reflects a shale protolith of the Adirondack Lowlands and is probable for
the Frontenac terrane metapelites as well. Small differences in the geochemical
signatures of the two regions exist, but due to the small set of geochemical data from the
Frontenac terrane, nothing conclusive is reachable on geochemical continuity across the
St. Lawrence River. Figure 8 shows the correlation between the Adirondack Lowlands
samples and NASC 84. Figure 9 shows the correlation between the Frontenac terrane
samples and NASC 84.
Figure 8. Trace element comparisons between the Frontenac terrane, the Adirondack Lowlands, and
NASC 84. Concentrations in parts per million
29
Conclusion
Determining separations between Precambrian terranes is difficult, but important to
determine in order to develop the history of the assembly of North America and ancient
plate tectonic interactions. The results of this Keck project ended up creating more
questions about the region around the Black Lake Shear Zone. The results are overall
ambiguous, and different geothermometers give widely different temperature results in
this region. This study highlights the problems of accuracy in applying different
geothermometers in a high-grade metamorphic area.
A recent study by Tortorello and Peck (unpublished data) reveals preliminary calcite-
graphite geothermometry results from the southern and middle Frontenac terrane, adding
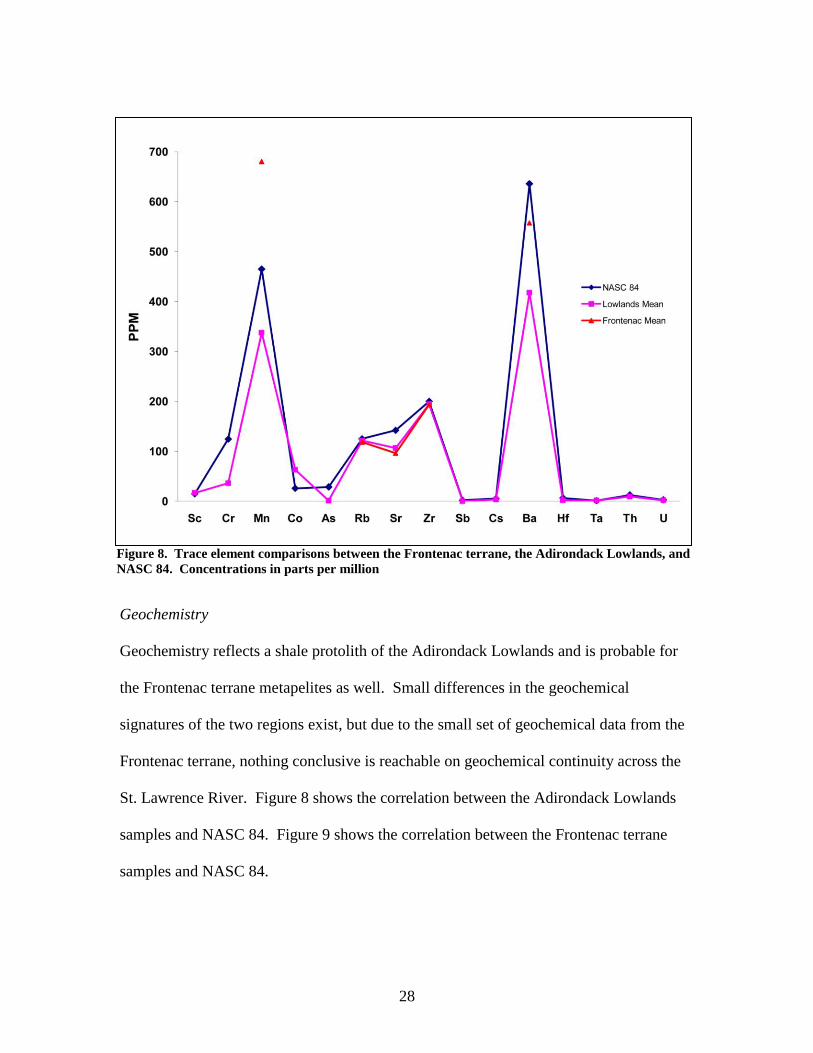
Figure 9. Rare-earth element comparisons between NASC 84 and the mean of five
Adirondack Lowlands samples. Normalized to chondrite of Taylor and McClennan (1985)
30
to the NNW-SSE trend formed by this study. These preliminary results reveal a much
hotter Frontenac terrane with temperatures of 800°C plus. This may imply that not only
is the Ti-in-biotite geothermometer accurate, at least in the Frontenac terrane, but that a
large difference in temperature (approximately 150°C) exists between these results and
Kitchen and Valley’s (1995) calcite-graphite results in the Adirondack Lowlands.
Peak temperatures are higher in the Frontenac terrane than in the Adirondack Lowlands.
Is this change simply a gradual one, or does it indicate a discontinuity? The lack of data
in this study and lack of outcrop makes this determination difficult, but with continued
studies in this region, especially ones classifying the BLSZ, perhaps a clearer picture will
form on how, and when the Adirondack Mountains became a part of North America.
Acknowledgements
I gratefully acknowledge the funding provided by the GGE Kohanowski Fund, the Hugh
and Ruth Palmer Thesis Scholarship, and the Keck Geology Consortium (NSF-REU:
0648782). Many thanks go to Dave Henderson at the University of Michigan for
microprobe and photomicrograph assistance. A big thank you to Bruce Selleck, Martin
Wong, Dave Linsley, and William Peck at Colgate University for fostering this project
and providing all the help I could ask for. Thank you to Darrell Henry for assistance in
understanding his thermometer and to Celina Will for all the fun in the field and
countless discussions on trying to figure out our data. I also thank Darin Buri, Joe
Hartman, and the rest of the department for all the support, editing, printing, opinions,
and good times. Thank you to Brian Schill and Brad Rundquist for all the help on the
31
Honors side. My biggest thanks go to Dexter Perkins for everything he has done for me
and for this project.
References
Anovitz, L.M., and Essene, E.J., 1990, Thermobarometry and pressure-temperature
paths in the Grenville Province of Ontario: Journal of Petrology,
v. 31, p. 197–241.
Bohlen, S.R., Valley, J., Essene, E., 1985, Metamorphism in the Adirondacks: Petrology,
pressure, and temperature: Journal of Petrology, v. 26, p. 971-992.
Buddington, A.F., 1934, Geology and Mineral Resources of the Hammond, Antwerp and
Lowville Quadrangles: New York State Museum Bulletin 296, 251 p.
Carr, S., Easton, R.M., Jamieson, R.A., and Culshaw, N.G., 2000, Geologic transect
across the Grenville orogen of Ontario and New York: Canadian Journal
of Earth Sciences, v. 37, p. 193–216.
Chipera, S., and Perkins, D., 1988, Evaluation of biotite-garnet geothermometers:
application to the English River subprovince, Ontario: Contributions to
Mineralogy and Petrology, v. 98, p. 40-48.
Corrigan, D., 1995, Mesoproterozoic evolution of the south-central Grenville orogen;
structural, metamorphic, and geochronological constraints from the Mauricie
transect [Ph. D. thesis]: Ottawa, Ontario, Carleton University, 308 p.
Corriveau, L., and van Breemen, O., 2000, Docking of the Central Metasedimentary
Belt to Laurentia in geon 12: Evidence for the 1.17–1.16 Ga
Chevreuil intrusive suite and host gneisses, Quebec: Canadian Journal of
Earth Sciences, v. 37, p. 253–269.
Davidson, A., 1984, Tectonic boundaries within the Grenville Province of the
Canadian Shield: Journal of Geodynamics, v. 1, p. 433–444.
Davidson, A., 1998, An overview of Grenville Province geology, Canadian Shield;
Chapter 3 in, Lucas, S.B., and St-Onge, M.R., eds., Geology of the Precambrian
Superior and Grenville Provinces and Precambrian Fossils in North America;
Geological Survey of Canada, Geology of Canada, n. 7, p. 205-270.
Edwards, L.R., and Essene, E.J., 1988, Pressure, Temperature, and C-O-H Fluid
Fugacities across the Amphibolite-Granulite Transition, Northwest Adirondack
Mountains, New York: Journal of Petrology, v. 29, p. 39-72.
32
Gromet, L.P., Dymek, R.F., Haskin, L.A., and Korotev, R.L., 1984, The “North
American Shale Composite”: its compilation, major and trace element
characteristics: Geochim. Cosmochim. Acta, v. 48, p. 2469-2482.
Henry, D., Guidotti, C., Thomson, J., 2005, The Ti-saturation surface for low-to-medium
pressure metapelitic biotites: Implications for geothermometry and Ti-substitution
mechanisms: American Mineralogist, v. 90, p 316-328.
Heumann, M.J., et al., 2006, Timing of anatexis in metapelites from the Adirondack
lowlands and southern highlands: A manifestation of the Shawinigan orogeny and
subsequent anorthosite-mangerite-charnockite-granite magmatism: GSA Bulletin,
November 2006, v. 118, no. 11-12.
Hoffman, K. S., 1982, Investigation of the orthopyroxene isograd, NW Adirondacks.
MSc thesis, University of Michigan.
Kitchen, N.E., and Valley, J.W., 1995, Carbon isotope thermometry in marbles of the
Adirondack Mountains, New York: Journal of Metamorphic Geology, v. 13, p.
577-594.
McLelland, J.M., Selleck, B., Peck, W.H., and Bickford, M.E., 2006, Synthesis of
regional Ottawan shear zones in the Adirondack and Morin terranes: Toward a
unified tectonic model: Geological Society of America Abstracts with Programs,
v. 38, n. 7, p. 384.
Mezger, K., Rawnsley, C.M., Bohlen, S.R., and Hanson, G.N., 1991, U-Pb garnet,
sphene, monazite, and rutile ages: implications for the duration of high grade
metamorphism and cooling history, Adirondack Mountains, New York: The
Journal of Geology, v. 99, p. 415-428.
Mezger, K., van der Pluijm, B.A., Essene, E.J., and Halliday, A.N., 1992, The
Carthage-Colton mylonite zone (Adirondack Mountains, New York): The
site of a cryptic suture in the Grenville Orogen? Journal of Geology, v. 100,
p. 630–638.
Peck, W.H., Valley, J.W., Corriveau, L., Davidson, A., McLelland, J., and Farber, D.A.,
2004, Oxygen-isotope constraints on terrane boundaries and origin of 1.18-1.13
Ga granitoids in the southern Grenville Province, in Tollo, R.P., Corriveau, L.,
McLelland, J., and Bartholomew, M.J., eds., Proterozoic tectonic evolution of the
Grenville orogen in North America: Boulder, Colorado, Geological Society of
America Memoir 197, p. 163-182.
Perchuk, L.L., Lavrent’eva, I.V., 1983, Experimental investigation of exchange equilibria
in the system cordierite-garnet-biotite, in Saxena, SK., ed., Kinetics and
equilibrium in mineral reactions: Berlin, Heidelberg, New York, Springer, p. 199-
239.

33
Rollinson, H., 1993, Using Geochemical Data: Evaluation, Presentation, Interpretation.
Longman Publishing Group, Essex.
Spear, F.S., Kohn, M.J., and Cheney, J.T., 1999, P-T paths from anatectic pelites:
Contributions to Mineralogy and Petrology, v. 134, p. 17-32.
Stormer, J.C., 1975, A Practical Two-Feldspar Geothermometer: American Mineralogist,
v. 60, p. 667-674.
Streepy, M., Essene, E.J., and van der Pluijm, B.A., 1997, A Compilation of
Thermobarometric Data from the Metasedimentary Belt of the Grenville
Province, Ontario and New York State: The Canadian Mineralogist, v. 35, p.
1237-1247.
Stoddard, E.F., 1989, Distribution and significance of cordierite in the northwest
Adirondack Lowlands: Northeastern Geology, v. 11, n. 1, p. 40-49.
Taylor, S.R., and McLennan, S.M., 1985, The continental crust: its composition and
evolution. Blackwell, Oxford.
Tollo, R.P., Corriveau, L., McLelland, J., and Bartholomew, M.J., 2004, Proterozoic
tectonic evolution of the Grenville orogen in North America: An introduction, in
Tollo, R.P., Corriveau, L., McLelland, J., and Bartholomew, M.J., eds.,
Proterozoic tectonic evolution of the Grenville orogen in North America: Boulder,
Colorado, Geological Society of America Memoir 197, p. 1-18.
Valley, J.W., Bohlen, S.R., Essene, E.J., and Lamb, W., 1990, Metamorphism in the
Adirondacks, II: The role of fluids: Journal of Petrology, v. 31, p. 555–596.
Wasteneys, H., McLelland, J., and Lumbers, S., 1999, Precise zircon geochronology in
the Adirondack Lowlands and implications for revising plate tectonic models of
the Central Metasedimentary Belt and Adirondack Mountains, Grenville
Province, Ontario, and New York: Canadian Journal of Earth Sciences, v. 36, p.
967-984.
Will, C., and Dunn, S., Calcite-graphite isotope thermometry near the Black Lake Shear
Zone, Adirondack Lowlands, NY, in de Wet, D., ed., Keck Geology Consortium
Proceedings of the Twenty-Second Annual Keck Research Symposium in
Geology, April 2009, p. 60-63.
34
Sample
Oxide/Element AKR-1 AKR-2 AKR-3 AKR-4 AKR-5 AKR-6 AKR-7
AKR-
8
AKR-
12
AKR-
14
AKR-
17
AKR-
19
AKR-
20
AKR-
21
AKR-
24
AKR-
26
AGS-
59
SiO2 51.94 57.62 60.37 65.55 58.64 58.64 60.9 64.70 48.41 61.21 55.2 58.8 57.81 59.67 60.9 61.87 57.69
Na2O 1.93 5.76 1.92 0.92 3.74 1.98 3.29 0.99 3.73 1.79 2.42 2.39 1.91 1.79 3.98 2.49 2.20
MgO 2.87 3.5 3.35 3.16 3.53 2.05 4.15 3.42 6.03 3.25 3.59 4.72 3.89 3.32 4.8 2.37 3.72
Al2O3 17.40 16.70 17.22 14.97 15.65 12.33 15.7 12.51 19.25 16.53 16.68 15.31 16.80 16.36 15.81 15.84 17.46
K2O 1.82 3.27 10.53 5.36 2.99 4.6 2.4 7.06 3.45 6.1 7.01 5.13 6.96 3.69 3.07 7.09 4.91
CaO 8.61 1.98 0.57 0.39 5.19 1.07 3.86 1.70 3.74 1.72 1.87 2.53 1.29 3.38 2.65 0.60 2.41
TiO2 1.34 1.50 1.32 1.21 1.34 0.81 0.94 0.96 1.96 1.29 1.15 0.98 1.07 1.13 0.73 1.03 1.28
MnO 0.06 0.02 0.02 0.05 0.10 0.04 0.03 0.03 0.07 0.06 0.09 0.06 0.08 0.11 0.11 0.04 0.11
Fe2O3 10.78 5.01 4.31 8.06 7.95 6.21 8.25 6.83 11.79 8.04 9.19 8.73 9.09 9.22 6.17 7.26 8.84
P2O5 0.11 0.166 0.09 0.15 0.646 0.113 0.183 0.13 0.16 0.177 0.102 0.073 0.10 0.108 0.147 0.12 0.10
Sc 24.9
16.6 14.1
12.7 17.1
Cr 38.2
44.9 42.4
19.3 43.8
Co 81.7 45.7 69.2 51.1 74
As 1.6
1 0.6
1.4 0.6
Br
Rb 42 69 121 146 110 130 106 206 100 142 112 105 126 107 147 262 172
Sr 219 46 28 58 684 74 103 170 92 261 111 103 98 85 87 67 91
Zr 156 207 183 216 254 176 177 261 182 210 194 212 221 166 180 172 169
Sb 0.05 0.02 0.32 0.11 0.04
Cs 2.3
1.1 5.4
5.7 5
Ba 214 50 415 837 1169 652 222 797 204 825 855 719 846 565 184 675 492
Hf 1.76
1.48 0.94
2.34 2.39
Ta 1.5 1.1 1 1.3 1.3
W
Th 4.9 10.2 10.7 11.1 12.2
U 0.6
1.6 2.3
2.1 2.8
Table 1. Whole rock major element, trace element, and rare-earth-element concentrations.
Tables
Continued on next page …
35
Ga 20 20 19 16 18 12 17 13 24 16 18 18 20 20 18 19
La 38.2
44.9 42.4
19.3 43.8
Ce 75.11 78 84.3 74.87 169 96 83 65 107 95 84 68 59 95 67 38.76 75.6
Pr 11.3
12.7 11
5.3 10.9
Nd 44.4 47.7 41.8 20.1 38.9
Sm 8.5
7.3 6.7
3.4 5.9
Eu 1.9 1.8 1.6 0.9 1.4
Element AKR-1 AKR-2 AKR-3 AKR-4 AKR-5 AKR-6 AKR-7
AKR-
8
AKR-
12
AKR-
14
AKR-
17
AKR-
19
AKR-
20
AKR-
21
AKR-
24
AKR-
26
AGS-
59
Gd 7.2 5.5 5.1 2.9 4.8
Tb 1.2
0.8 0.9
0.4 0.7
Dy 7 4.3 3.8 2 3.4
Ho 1.2
0.7 0.6
0.3 0.6
Er 3.5 1.5 1.3 0.7 1.5
Tm 0.5
0.2 0.1
0.1 0.2
Yb 3 1.1 0.7 0.7 1.1
Lu 0.5
0.2 0.1
0.1 0.2
Pr 11.3 12.7 11 5.3 10.9
Nd 44.4
47.7 41.8
20.1 38.9
Gd 7.2 5.5 5.1 2.9 4.8
Dy 7
4.3 3.8
2 3.4
Ho 1.2 0.7 0.6 0.3 0.6
Er 3.5
1.5 1.3
0.7 1.5
Tm 0.5 0.2 0.1 0.1 0.2
Y 33.9 33 16.4 14.7 40 23 32 15 37 23 16 21 18 26 36 7.7 16.1
Nb 14 17 16 15 23 11 14 13 19 15 13 10 12 13 12 16
Zn 63 102 5 60 109 22 36 21 26 63 88 102 93 58 101 32
Oxide concentrations in weight percentage; all other concentrations are in parts per million
(ppm).
36
Primary Minerals
Sample Location Qtz Grt Bt Pl Kfs Crd Sil Ky And Ms Hbl Opx Cpx
Adirondack Lowlands
AKR-1 18T 456815, 4910959 X X X X X
AKR-3 18T 456578, 4911283 X X X X X X
AKR-4 18T 445323, 4918400 X X X X X
AKR-5 18T 447038, 4914554 X X X X X X
AKR-8 18T 444596, 4913774 X X X X X X
AKR-12 18T 441816, 4906205 X X X X X X
AKR-26 18T 418104, 4906072 X X X X X X X X
Frontenac Terrane
AKR-17 18T 401501, 4909465 X X X X X
AKR-19 18T 401501, 4909465 X X X X X
AKR-20 18T 401501, 4909465 X X X X X
AKR-21 18T 404690, 4907772 X X X X X X X
Table 1. Mineral assemblages in samples selected for geothermometry.
Locations in Universal Transverse Mercator (UTM). Abbreviations: Qtz, quartz; Grt, garnet; Bt,
biotite; Pl, plagioclase; Kfs, K-feldspar; Crd, cordierite; Sil, sillimanite; Ky, kyanite; And,
andalusite; Ms, muscovite; Hbl, hornblende; Opx, orthopyroxene; Cpx, clinopyroxene.
Sample T (°C)
Grt-Bt Ti-in-Bt Two-Feldspar
Adirondack Lowlands
AKR-1 580 737 503
AKR-3 778 503
AKR-4 760
AKR-5 762 492
AKR-8 756 531
AKR-12 681 758
AKR-26 664
Frontenac terrane
AKR-17 811 608
AKR-19 810 597
AKR-20 811 587
AKR-21 756 770 593
Ti-in-biotite has an error of ±15ºC. Two-feldspar
has an error of ±20ºC. Garnet-biotite has an error
of ±50ºC.
Table 2. Geothermometry results for the
Adirondack Lowlands and the Frontenac terrane.
37
Table 3. Representative biotite analyses.
AKR-1 AKR-3 AKR-4 AKR-5 AKR-8 AKR-12 AKR-17 AKR-19 AKR-20 AKR-21 AKR-26
SiO2 36.522 36.877 35.479 36.156 38.653 35.504 37.180 37.190 36.837 36.806 36.052
TiO2 4.322 5.002 4.092 4.820 2.980 4.504 5.355 4.964 5.248 4.628 2.547
Al2O3 14.228 15.129 16.029 13.547 14.883 16.866 14.810 14.603 14.586 14.838 16.402
Cr2O3 0.034 0.057 0.021 0.009 0.005 0.043 0.042 0.025 0.016 0.027 0.027
FeO 19.958 15.280 14.177 17.927 10.320 16.327 11.428 10.627 11.200 15.332 18.652
MnO 0.007 0.064 0.149 0.116 0.117 0.040 0.049 0.075 0.039 0.044 0.186
MgO 10.802 14.002 13.644 12.477 18.579 12.827 16.491 17.159 16.586 14.210 10.849
CaO 0.000 0.010 0.011 0.017 0.018 0.000 0.000 0.020 0.016 0.002 0.016
K2O 10.341 10.373 9.958 10.210 10.023 10.642 10.532 10.443 10.573 9.851 10.531
Na2O 0.000 0.010 0.011 0.017 0.018 0.000 0.000 0.020 0.016 0.002 0.016
(H2O) 3.929 4.046 3.930 3.918 4.114 4.014 4.077 4.059 4.042 4.011 3.915
Total* 96.212 96.806 93.572 95.297 95.595 96.751 95.885 95.123 95.115 95.740 95.277
(Total) 100.141 100.852 97.501 99.215 99.709 100.765 99.962 99.181 99.157 99.751 99.193
Si 5.575 5.465 5.414 5.534 5.634 5.305 5.468 5.495 5.465 5.502 5.522
Ti 0.496 0.557 0.470 0.554 0.327 0.506 0.592 0.551 0.586 0.520 0.293
Al 2.559 2.642 2.883 2.442 2.557 2.970 2.567 2.543 2.550 2.614 2.961
Ce 0.004 0.007 0.003 0.001 0.001 0.005 0.005 0.003 0.002 0.003 0.003
Fe 2.548 1.894 1.809 2.303 1.258 2.040 1.406 1.313 1.391 1.917 2.389
Mn 0.001 0.008 0.019 0.015 0.014 0.005 0.006 0.009 0.005 0.006 0.024
Mg 2.458 3.093 3.104 2.838 4.037 2.857 3.616 3.779 3.668 3.167 2.477
Ca 0.000 0.002 0.002 0.003 0.003 0.000 0.000 0.003 0.002 0.000 0.003
K 2.014 1.961 1.938 1.994 1.863 2.028 1.976 1.968 2.001 1.879 2.058
Na 0.000 0.008 0.004 0.004 0.000 0.000 0.010 0.000 0.005 0.000 0.005
O 20.000 20.000 20.000 20.000 20.000 20.000 20.000 20.000 20.000 20.000 20.000
OH 4.000 4.000 4.000 4.000 4.000 4.000 4.000 4.000 4.000 4.000 4.000
Fe/Fe+Mg 0.509 0.380 0.368 0.448 0.238 0.417 0.280 0.258 0.275 0.377 0.491
Mg/Mg+Fe 0.491 0.620 0.632 0.552 0.762 0.583 0.720 0.742 0.725 0.623 0.509
Oxide values are in weight percentage; analyses normalized to 44 charges, including (OH)4.
38
Table 4. Representative plagioclase analyses.
Oxide values are in weight percentage, analyses normalized to five cations; Fe assumed trivalent.
Table 5. Representative orthoclase analyses.
Column1 AKR-1 AKR-3 AKR-5 AKR-8 AKR-17 AKR-19 AKR-20 AKR-21
SiO2 65.296 65.140 64.713 64.983 64.302 65.878 65.148 66.493
Al2O3 18.317 18.309 18.245 18.140 18.138 18.963 18.610 18.855
Fe2O3 0.067 0.059 0.016 0.036 0.947 0.049 0.037 0.038
CaO 0.006 0.033 0.033 0.032 0.165 0.403 0.442 0.137
K2O 16.578 16.057 15.659 16.212 14.502 14.929 14.914 15.372
Na2O 0.800 1.148 0.976 0.996 1.569 1.504 1.674 1.187
Total 101.063 100.746 99.641 100.399 99.623 101.727 100.825 102.081
Si 2.978 2.974 2.992 2.980 2.974 2.977 2.965 3.001
Al 0.984 0.985 0.994 0.980 0.989 1.010 0.998 1.003
Fe3
0.002 0.002 0.001 0.001 0.034 0.002 0.001 0.001
Ca 0.000 0.002 0.002 0.002 0.008 0.020 0.021 0.007
K 0.964 0.935 0.924 0.948 0.855 0.861 0.866 0.885
Na 0.071 0.102 0.087 0.089 0.140 0.132 0.148 0.104
%An 0.028 0.154 0.161 0.150 0.812 1.945 2.066 0.663
%Ab 6.828 9.786 8.646 8.531 13.984 13.055 14.253 10.446
%Or 93.144 90.061 91.193 91.320 85.205 85.000 83.681 88.891
Oxide values are in weight percentage; analyses normalized to five cations; Fe assumed trivalent.
Column1 AKR-1 AKR-3 AKR-5 AKR-8 AKR-17 AKR-19 AKR-20 AKR-21
SiO2 56.359 61.535 60.694 57.111 58.602 58.999 61.679 55.883
Al2O3 26.827 23.988 24.080 26.642 25.713 25.923 24.601 27.587
Fe2O3 1.394 0.044 0.053 0.077 0.037 0.026 0.042 0.054
CaO 9.137 5.948 6.305 9.205 8.021 8.125 6.772 10.174
K2O 0.154 0.140 0.199 0.163 0.224 0.206 0.140 0.123
Na2O 5.584 7.977 7.524 6.388 6.868 6.682 7.277 5.721
Total 99.454 99.633 98.854 99.585 99.464 99.961 100.510 99.540
Si 2.566 2.750 2.741 2.572 2.637 2.646 2.746 2.527
Al 1.439 1.264 1.282 1.414 1.364 1.370 1.292 1.470
Fe3
0.049 0.001 0.002 0.003 0.001 0.001 0.001 0.002
Ca 0.445 0.285 0.305 0.444 0.387 0.390 0.324 0.493
K 0.009 0.008 0.011 0.009 0.013 0.012 0.008 0.007
Na 0.493 0.691 0.659 0.558 0.599 0.581 0.628 0.502
0.000 0.000 0.000 0.000 0.000
%An 46.882 28.849 31.296 43.926 38.745 39.701 33.490 49.214
%Ab 52.154 70.344 67.526 55.151 59.969 59.098 65.690 50.080
%Or 0.964 0.807 1.177 0.923 1.285 1.201 0.820 0.706
39
Table 6. Representative garnet core analyses.
Column1 AKR-1 AKR-12 AKR-21
SiO2 37.730 38.000 38.858
Al2O3 21.305 21.693 22.074
Cr2O3 0.037 0.020 0.000
Fe2O3 1.102 1.496 1.671
FeO 28.980 31.122 26.343
MnO 0.383 0.440 1.316
MgO 2.674 6.838 9.277
CaO 8.573 1.312 1.759
Total 100.781 100.922 101.296
Si 2.976 2.960 2.961
Al 1.980 1.991 1.982
Cr 0.002 0.001 0.000
Fe3
0.065 0.088 0.096
Fe2
1.912 2.027 1.679
Mn 0.026 0.029 0.085
Mg 0.314 0.794 1.054
Ca 0.724 0.110 0.144
XFe 0.650 0.694 0.581
XMg+Mn 0.112 0.270 0.373
XCa 0.238 0.036 0.047
Oxide values are in weight percentage; analyses normalized to eight cations, Fe3+
calculated from
charge balance for analyses with Si < 3.