Embed Size (px)
Citation preview
RECHARGING THE FRACTURED AQUIFER THROUGH DEFUNCT BORE WELL FOR
SUSTAINABLE DRINKING WATER DEVELOPMENT IN PUDUCHATRAM BLOCK – NAMAKKAL DISTRICT-TAMILNADU
Research and Development Cell Tamilnadu Water supply and Drainage Board
31,Kamarajar salai, Chepauk Chennai 600005
Tamilnadu
RESEARCH & DEVELOPMENT CELL, HYDROGEOLOGY WING
FINAL REPORT
RECHARGING THE FRACTURED AQUIFER THROUGH DEFUNCT BORE WELL
FOR SUSTAINABLE DRINKING WATER DEVELOPMENT IN PUNDUCHATRAM BLOCK,
NAMAKKAL DISTRICT- TAMILNADU
FUNDED BY
RAJIVGANDHI NATIONAL DRINKING WATER MISSION
DEPARTMENT OF DRINKING WATER SUPPLY MINISTRY OF RURAL DEVELOPMENT
GOVERNMENT OF INDIA
OCTOBER 2007
TAMILNADU WATER SUPPLY AND DRAINAGE BOARD

Acknowledgement
The R&D Cell of Hydrogeology wing TWAD Board thankfully acknowledges the support
extended by the Managing Director for taking up Research and Developmental activities
to improve the groundwater potential and quality for sustainable drinking water
development in rural areas.
The R&D unit whole heartedly thanks the Mission Director RGNDWM and Secretary
Department of Drinking water supply Ministry of Rural Development Government of India
foe sanctioning the project.
Thanks are due to the Executive Engineer, Rural water supply Division TWAD Board
Namakkal for shouldering the responsibility of executing the civil works.
Thanks are due to all those who have contributed directly or indirectly in all stages of
implementation of this R&D project.
M.Devarajan Project Coordinator
Deputy Hydrogeologist R&D TWAD Board,Chennai.5
RECHARGING THE FRACTURED AQUIFER THROUGH DEFUNCT BORE WELL FOR SUSTAINABLE DRINKING WATER DEVELOPMENT IN PUNDUCHATRAM BLOCK, NAMAKKAL DISTRICT- TAMILNADU
Sanction order NO.W-11046/33/2001-TMII (R&D) dated 5th February 2003 Government of India
Ministry of Rural Development Department of Drinking water supply
Rajiv Gandhi National Drinking Water Mission
Approved cost of the project : Rs.5.070 Lakhs Advance Fund released : Rs.4.056 Lakhs
Research and Development Cell Tamilnadu Water Supply and Drainage Board
31, Kamarajar Salai Chepauk, Chennai-600005
Tamilnadu
CONTENT Acknowledgement Sanction order Chapter I 1-4 1.1.0.Introduction 1.1.0.Need for the study 1.2.0.Earliar study 1.3.0.Present water position Chapter II 5-7 2.1.0.Administartive details 2.2.0. Project area Chapter III 8-14 3.0.0.Research Input 3.1.0.Global Positioning System 3.2.0.Geographical Information System 3.3.0.Geophysics 3.4.0.Geochemistry 3.4.0.Hydraulics 3.6.0.Recharge 3.6.1.Natural recharge 3.6.2.Artificial recharge 3.6.3.Goals for recharge programs 3.7.1. Recharge System component 3.7.2.Clogging Issues for Surface Infiltration Systems 3.8.0. Recharge processes and rates of recharge 3.8.1.Capillarity Chapter IV 15-16 4.0.0. Objective & methodology 4.1.0.Objective 4.2.0.Methodology 4.3.0. Execution 4.3.1.Phase – I 4.3.2.Phase – Ii 4.3.3.Phase – Iii Chapter V 17-26 5.0.0.Technical Input 5.1.0.Geology 5.2.0.Hydrogeology 5.3.0.Field Survey Using Global Positioning System( GPS) 5.3.1.Elevation Contour 5.3.2.Weathering Thickness 5.4.0.Geophysical Survey 5.4.0.Rainfall 5.6.0.Observation Wells 5.6.1.Water level monitoring 5.6.2. Water quality
Chapter VI 27-45 6.0.0.Design & Estimate 6.1.0.Recharge wells 6.2.0.Implementation of civil works 6.2.1.Filter arrangement 6.2.2. Connecting bore wells 6.3.0.Recharge process Chapter VII 46 - 65 7.0.0.Assessment: 7.1.0.Extent of the project area 7.2.1.Rainfall- Season wise 7.2.1.Run off estimation 7.2.2.Storm run off in mm 7.2.3.Quantity of run off in m3 7.2.4. Annual runoff 7.2.4.Season wise quantification of Runoff 7.2.6.Month wise run off in m3 7.3.0. Water level rise in m 7.4.0.Fluctuation & Recharge 7.4.1.Recharge quantification and % Chapter VIII 66 - 92 8.0.0.Data Analysis 8.1.0. Rainfall 8.2.0. Water level 8.2.1. Open wells 8.2.2. Deep bore wells 8.2.3. Comparison of water levels 8.2.4. Comparison in bore wells 8.2.4 Weathering &rise in water level 8.3.0. Water quality changes 8.4.1. Water level projection in deep bore wells 8.2.2. Water level projection in open wells 8.2.4. Water level predicted with out recharge 8.2.4. Water level predicted with recharge 8.3.1. Rainfall vs. water level: (Distance source) 8.6.1.Rise & Fall analysis 8.6.2.Rise in open wells Chapter IX 93 -101 9.0.0. Findings 9.1.0. Recommendations Chapter X 102-139 x.Album Annexure Xa.plates,Tables,Graphs,contours Xb.References

Chapter I INTRODUCTION
FINAL REPORT
1.0.0.Introduction:
Ground water is a dynamic resource with an integral link in the hydrological
cycle. . Any imbalance in management of ground water resource is reflected in the form
of waterlogged areas at one extreme and an acute shortage of water at the other end.
The need for enhanced recharge of ground water is increasing worldwide as populations
and water demands increase. The magnitude of replenishment or recharging of ground
water storage is explicitly controlled by the topographical geological and hydrological
situation of an area.
The increasing demand for water has increased awareness towards the use of
artificial recharge to augment ground water supplies. Artificial recharge is a process by
which excess surface water is directed into the ground – either by spreading on the
surface, by using recharge wells, or by altering natural conditions to increase infiltration
– to replenish an aquifer. It refers to the movement of water through man-made systems
from the surface of the earth to underground water-bearing strata where it is stored for
future use. Artificial recharge through surface spreading methods like Percolation ponds
and Check dams are relatively enhances the fracture systems that lie in proximity to
surface or the shallow groundwater domain. Rarely the infiltrated water reaches the
deeper fracture systems. Often lenses of low permeability lie between the land surface
and the fracture system that prevents the vertical movement of infiltrated water. In such
situations artificial recharge systems such as pits and shafts could penetrate the less
permeable strata in order to access the dewatered aquifer. A research and development
project proposal intended to adopt a different technique where in defunct bore wells
(deep bore wells, which have become defunct due to lowering of water table )have been
taken as a means to facilitate recharge to deep seated fracture system to make the
drinking water sources sustainable. The village taken for this project is Karukurichi in
Puduchatram block of Namakkal district –Tamilnadu. Detailed field investigation has
been undertaken in the village where the water level is deep and surface recharge
techniques to recharge the deep fractured aquifer will not give promising results. Since
the technique of providing recharge shaft around (backfilled with porous material) the
defunct bore well to convert it as recharge bore well is new in hard rock terrain, this R&D
project is thought of and carried out with utmost commitment. The selection of defunct
wells methodology in providing the shaft, facilitating interconnection with the storage
pond and the shaft, filter arrangement provided are reliably fool proof. The observation
wells and periodical monitoring of water level fluctuation before and after the intervention
Research & Development cell, Tamilnadu water supply and Drainage Board 1
FINAL REPORT
helped in establishing the impact. Pumping test carried out to ascertain the hydraulic
properties of the deep-seated fracture system provided opportunity to cross check the
results. Water quality Analysis carried out before and after provides additional
information to establish the impact of rainwater added to the fracture system. As the final
output seems to be encouraging the techniques could be adopted at ease with minimum
budget to develop the deep fracture aquifer system wherever needed.
Periodical monitoring in the identified observation wells before and after the
intervention has been carried out. The impact assessment integrating other collateral
data collected from the field explains the success of the project. The present project
succeeded with the alternate technology in improving the deeper fracture system that
rarely get replenished by Natural or by surface artificial recharge means. The work has
been carried out with selective R&D inputs adopted for the first time in this state and the
output satisfied the objectives earmarked so that the purpose for which RGNDWM
accorded sanction justifying its replicable options and extension possibilities.
1.1.0. Need for the study: Nearly 80% of the drinking water demand mostly emanating from rural areas is being
met from groundwater resources and the remaining 20% is served from the surface
water sources. The ever growing demand of water for the various multifaceted
developmental activities such as Drinking Water, Industries, and Irrigation etc. have
resulted in considerable depletion of ground water levels. Erratic rainfall makes the
problem more serious. It is therefore needless to say that much attention has to be
made for proper conservation and effective management for the sustainability of the
drinking water sources. Rainwater is the only source for recharging the ground water.
As the water level is deep during summer and winter, surface recharge techniques not
adequately permits the recharged water down to the deep-seated fracture system.
Advance technological improvement in farm machinery sector, adoption of rural villages
by lead banks and reliability in repayment capacity of the villagers resulted in optimal
agricultural activity with the provision of deep bore wells. Maximum numbers of bore
wells are drilled in the fractured and highly fractured zones. Indiscriminate deep drilling
of bore wells and over draft leads the lowering of water level and water quality
deterioration. Poor recharge conditions further lowering of water potential that are
created in the Fractured zones (Lineaments). Hence water supply schemes, which are
depending on the fracture system affected during summer. About 2.5 Lakhs bore wells
were drilled so far in Tamilnadu for water supply under different programs and about 10
Research & Development cell, Tamilnadu water supply and Drainage Board 2
FINAL REPORT
–15% of them have become defunct or unsustainable. Artificial recharge is one of the
alternatives to make ground water sources sustainable. The heterogeneity in geological
characteristics is ideal to provide different type of recharge structures. Different type of
recharge measures has to be carried out in suitable geological and geomorphologic
units.
Puduchatram block is one of the over exploited block and water level is deeper where
surface recharge techniques will not be conducive. The new techniques like recharge
well coupled with storage pond may be a solution to recharge deep fractured aquifer.
The out come of the project will give a good solution to recharge deeper aquifer using
the defunct bore wells thereby making the drinking water sources sustainable.
1.2.0. Earlier study: Earlier study in one of the UNICEF assisted project titled “Deep fracture system study
in Valayappatti area” conducted during 1999 by the R&D cell concluded with the
following points that holds good for the present project also.
• Limited weathering thickness controls the infiltration and saturation of the
weathered zone.
• Low potential of the shallow fractures indicates the poor replenishment due to
partially altered rock formation.
• Medium and deep-seated fractures act as high potential zone and the intermittent
fractures irrespective of depth and thickness is poor in potential.
• Ridges and slopes limit the extent of fracture system and potential of the
formation.
• Thickness and the depth of fractures have no bearing on its potential.
• Geophysical and litho logical data are useful in determining the boundary of the
potential fracture system.
• Treatment of lineament in the catchment area and desalting of riverbeds may
enrich the contribution through infiltration.
• Enriching the unproductive lineaments may be helpful in improving the water
level and water quality.
Further it was found in the study that Fracture system exists in between 70 to 90 m bgl
makes the zone as a potential pocket of ground water. Most of the bore wells drilled up
to or beyond this depth yield considerably. More than 40% of the bore wells have yielded
Research & Development cell, Tamilnadu water supply and Drainage Board 3
FINAL REPORT
greater than 100 lpm. Shallow fractures have low potential. The hand pumps drilled up to
60 m depth have become defunct.
A large quartzite ridge runs NNW-SSE from Dhuruvamalai and Thalamalai having a
minimum and maximum elevation of 187 m and 382 m above MSL play vital role in
deciding the surface and subsurface flow conditions. However these findings have been
brought down because of more draft and poor replenishment to the deeper fractures.
Changes in seasonal rainfall pattern further deteriorate the overall ground water potential
of this area. This has made to think over the application of alternate methodology to
improve the deep-seated fracture system on which large number of water supply
schemes depends up.
1.3.0. Present water supply position: The population of the habitation is 2310 as per 1991 census. This habitation comes
under partially covered category and the level of supply is 30 LPCD. There are 4 bore
wells and one open well in the habitation meant for drinking water purpose. There are
around 12 irrigation wells in the vicinity of the habitation. The yield of the only power
pump source (functioning) is not sufficient to cater to the drinking water need of the
habitation. Instead of drilling more number of bore wells, augmenting the existing source
is the better choice. There are number of open wells, and in well bore wells. All the open
wells used for agriculture are power driven. The earlier drilled bore wells with lesser
depth (220 m & 250 m) found to be defunct. The bore well with 280 m depth drilled of
late is used as the source for the village water supply scheme, which is also not
sustainable during summer since the water level is deep and the quantum of recharge
by natural means to the fracture system is not sufficient. As the defunct bore wells are
deep and terminate in the fracture system the present attempt could recharge the
fracture system and improve the ground water potential of the area in general.
Research & Development cell, Tamilnadu water supply and Drainage Board 4
Chapter II PROJECT DETAILS
FINAL REPORT
Defunct bore with MS casing
Rusted casing removed and
Defunct bore with PVC
With PVC casing Background around the defunct
Research & Development cell, Tamilnadu water supply and Drainage Board 5
FINAL REPORT
2.1.0. Project details:
The proposal for this R&D project forwarded to RGNDWM for an amount of
Rs.5.070 lakhs on 11.7.2001 drafted for presentation before the Research Advisory
committee on 25th July 2002. Formal approval to carry out this project under R&D was
issued vide Sanction order No.W-11046 / 33 /2001-TMII(R&D) dated 5th February
2003 with a release of Rs.4.056 lakhs.
The officials drafted for this project are as follows
Principal Investigator S.Thiruvikraman.Sr Hydrogeologist (Retd)
Project Coordinator M.Devarajan Deputy Hydro geologist R&D
Project officials A.Solai & V Pugazendi
Assistant Hydro geologists.R&D
Project started on 1.4.2003
Water level monitoring From June 2003 – Sep 2006
Water samples collected on 2.6.2003 & 6/2006
Interim Report I sent on 20.11.2003
Water samples collected on 18.12.2003
Estimate for construction of
Shafts received from Executive
Engineer / RWS / Namakkal 7.4.2005
Fund released to EE RWS
Namakkal 11.4.2005
Works completed on 26. 9.2005
Interim Report II sent on 8.12.2005
Delay due to Site acquisition, Monsoon failure
Civil works executed by Panchayat-Karukurichy
Technical supervision RWS Division.TWAD Board, Namakkal. Final report prepared by M.Devarajan. Manager-GIS & Deputy Hydrogeologist R&D Project coordinator
Research & Development cell, Tamilnadu water supply and Drainage Board 6

FINAL REPORT
2.2.0. Project area:
Karukurichi habitation belongs to Puduchatram block, Namakkal district of
Tamilnadu. It falls within East Longitude 78°4’30” to 78°14’00” and North Latitude
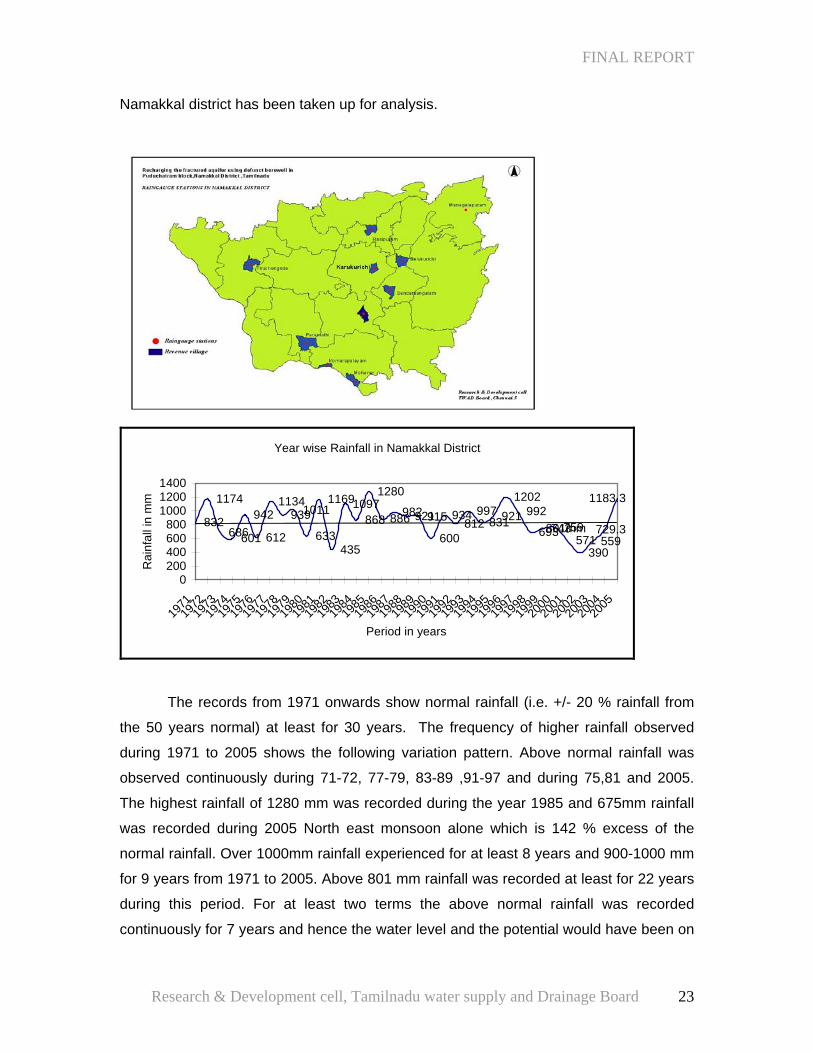
11°16’30” to 11°25’30”. It is about 10 km north from Namakkal town. It is well connected
with transport network from all side and lies on NH 47. (Plate-I)
2.2.1.Climate and Monsoon: On account of the general dryness of the atmosphere, comparatively cool nights and the
appreciable drop in temperature from June following the onset of the monsoon season,
the climate of this area is more pleasant. Generally dry climate prevails over major part
of the year in plains. The year may conveniently be divided into four main seasons, the
dry season from January to March, the hot season during April and May, the Southwest
monsoon season from June to September and the Northeast monsoon season from
October to December. The average mean maximum and minimum temperature for the
district have been 34.00 C and 21.60 C, respectively
2.2.2.Humidity: The area on the whole enjoys a dry climate. The driest months are from January to
April, the average relative humidity in the afternoon being less than 40 percent. Even
during the rainy months the average humidity is appreciably below the saturation level.
2.2.3.Winds: From October to March winds blow mainly from north easterly-to-easterly directions. In
April winds from directions between south and west are also common. From May to
September southwesterly and western lies predominant. The wind speeds are least in
October with maximum in May. It is interesting to note that the primary and secondary
rainfall maxim occur in these months. 2.2.4.Rainfall: The monthly average annual rainfall in the district is worked out and it is 804 mm. The
months of June to October receive a rainfall that is more than the annual average.
Research & Development cell, Tamilnadu water supply and Drainage Board 7

Chapter III RESEARCH INPUT

FINAL REPORT
3.0.0.Research input: As it is a research project innovative option available to make precise location
information as well as experimented guidelines to ascertain the effects of the
intervention were adopted. Accordingly Global positioning system satellite based
equipment has been used to acquire location information. Thematic maps based on non
spatial data have been accomplished with the help of Geographical information system
(GIS ). The subsurface fracture characteristics and its spread have been identified with
the help of Geophysical survey. Hydro geochemical information has been generated with
sampling helped in determining the interactive dynamics of the recharged and the insitu
water. Well hydraulics has been studied with the data to determine the hydraulic
properties.
3.1.0. Global Positioning System: Global Positioning System (GPS) instrument Trimble’s Geo Explorer-3. is a satellite
based data collection system used to capture point, line and polygon data. Geo explorer
3 data collection system is an integrated GPS receiver and data logger for mapping,
relocating and updating Geographical Information System (GIS) and spatial data. The
primary functions of the system is collecting geographical data and navigating in the
field. It can be used with a real-time source of differential corrections.
It has an internal antenna and power source, and high-performance 12 channel GPS
receiver. The Geo explorer-3 data collection system can be used as a rover receiver or
as bases station. It is used to accurately and efficiently collect the attributes and GPS
positions of geographic point, lines and areas. The information is stored in one or more
data files that can be transferred to Trimble’s Pathfinder office software for post
processing and editing. The data can be exported into wide range of GIS compatible
formats. The equipment can be used to update from an existing GIS or CAD database.
The data can be reviewed, edited and updated. Latitude, longitude and elevation with
respect to height above mean sea level (MSL)
3.2.0. Geographical Information System Geographic information system (GIS) is a computer system capable of capturing,
storing, analyzing, and displaying geographically referenced information; that is, data
identified according to location. This technology can be used for scientific investigations,
resource management, and development planning. The power of a GIS comes from the
Research & Development cell, Tamilnadu water supply and Drainage Board 8
FINAL REPORT
ability to relate different information in a spatial context and to reach a conclusion about
this relationship. When rainfall information is collected, it is important to know where the
rainfall is located. Using a location reference system, such as longitude and latitude, and
perhaps elevation, does this. Comparing the rainfall information with other information,
such as the location of high water table fluctuation may show that certain area receive
little rainfall. This fact may indicate that these locations are likely to dry up, and this
inference can help us make the most appropriate decisions about how humans should
interact with the location. A GIS, therefore, can reveal important new information that
leads to better decision-making. Different kinds of data in map form can be entered into
a GIS. A GIS can also convert existing digital information, which may not yet be in map
form, into forms it can recognize and use. Hydrologic tabular data can be converted to a
map like form and serve as layers of thematic information in a GIS.
3.3.0. Geophysics: The geophysical survey refer to the scientific measurements of physical properties of the
earth crust with the intention of detecting differences in the same which may be
interpreted in terms of geological structure, rock type and porosity, water content and
quality. This method is most applicable in hard rock areas that can give direct
confirmation of the presence of drinkable water.
There are various geophysical methods of which are generally used for ground water
prospecting. The simple economic method, which is suitable for the condition of this
area, is electrical resistivity method and magnetic method.
Resistivity of rock formation vary over a wide range depending upon the material,
density, porosity, size, shape, Water content, Water quality and temperature. Presence
of fractures in hard rock without any moisture can show low conductivity whereas
presence of moisture or water can give high conducting power.
There are two different techniques of carrying out resistivity investigations. One is
horizontal profiling and other is the vertical electrical sounding (VES) or vertical profiling.
The horizontal profile is of immense one in deciphering horizontal structural variation like
fault zone, shear zone, jointed areas which shows very low resistivity due to the
presence of large number of fractures filled with ground water. Contrary to the horizontal
profiling in which the apparent resistivity is studied directly and qualitative conclusion are
drawn about the geological subsurface conditions, the method of electrical sounding or
Research & Development cell, Tamilnadu water supply and Drainage Board 9
FINAL REPORT
vertical profiling furnished the detailed information on the vertical succession of different
conducting zones and their individual thickness and true resistivity.
3.4.0. Geochemistry: One of the most unusual characteristics of water is its ability to dissolve a greater range
of substances than any other liquid. The slow percolation of water through the ground
results in prolonged contact of water with minerals in the soil and bedrock. The water is
then saturated with dissolved solids derived from these minerals. This ability of water to
dissolve minerals determines the chemical nature of groundwater. Some of these
dissolved minerals are essential for good health. Water quality is a term used to describe
the chemical, physical, and biological characteristics of water, usually in respect to its
suitability for a particular purpose. The vulnerability of surface water and ground water to
degradation depends on a combination of natural landscape features, such as geology,
topography, and soils; climate and atmospheric contributions; and human activities
related to different land uses and land-management practices.
Water quality has become a very big issue today, partly because of the tremendous
growth of the Nation’s population and urban expansion and development. Rural areas
can also contribute to water-quality problems. Excess nutrients used for various activities
have the potential to degrade water quality if incorporated into runoff from farms into
streams and lakes. All this growth puts great stress on the natural water resources, and,
if we are not diligent, the quality of our waters will suffer. Mixing of water from different
sources clearly has chemical and microbiological effects, although prediction of many of
these effects can be fairly straightforward in the vicinity of artificial recharge projects,
experience has shown that more widespread and long-term effects are sometimes
difficult to foresee.
3.5.0. Hydraulics: The hydraulic properties of an aquifer system, along with the distribution of stress,
determine the direction and rate of saturated flow. The estimation of storage and
transmissive properties of parts the saturated aquifer system generally is done through
some combination of laboratory analysis of core samples, borehole geophysics and
velocity logs, multi- or single-well aquifer tests, as well as other methods. Depending on
the purpose of the artificial recharge project, heads may show seasonal fluctuations or
relatively long-term trends. Potential hydraulic effects of these changes, which may be
Research & Development cell, Tamilnadu water supply and Drainage Board 10
FINAL REPORT
positive, negative, or neutral, include change in aquifer storage; changes in base flow in
streams and on the rates of gain or loss from other surface-water bodies; changes in
evapo transpiration, and other sources of recharge and discharge and several effects
related to a shallow water table.
3.6.0. Recharge: 3.6.1. Natural recharge: Natural recharge to aquifers is vital in order to maintain the groundwater and to replenish
the discharges from the aquifer, either natural or resulting from Man’s activities. When
more water is removed from an aquifer than is replenished by recharge then the
groundwater level falls and storage is depleted. Recharge occurs periodically, usually
seasonally even in temperate climates, but less frequently in arid and semi-arid regions.
Recharge is either natural (mainly via direct infiltration of rainfall into permeable soils but
also from surface flow), or can be managed (by contour ploughing, building bunds/dams,
ponds, diversion channels and wells to enhance recharge), or may be incidental.
In developing countries aquifers provide a store of groundwater, which, if utilized and
managed effectively, can play a vital role in Poverty reduction/ livelihood stability, Risk
reduction, increased yields resulting from reliable irrigation, increased economic returns,
distributive equity (higher water levels mean more access for everyone) and reduced
vulnerability (to drought, variations in precipitation)
3.6.2. Artificial recharge: Artificial recharge is one method of modifying the hydrological cycle and thereby
providing groundwater in excess of that available by natural process. It can be
accomplished by a number of methods broadly classified into two categories. One is
Surface infiltration, which uses infiltration basins, or impoundments, to percolate water
into the ground. Second is subsurface infiltration, which uses vadose zone (unsaturated
zone) wells or trenches to introduce water into the unsaturated zone below the ground
surface to facilitate infiltration;
This study would require detailed hydro geological information to fully evaluate the
technical feasibility of recharge and storage, including recharge water availability, its
quality and compatibility with the native groundwater and aquifer mass, aquifer
boundaries, Hydraulic continuity with surface water, Recharge and storage capacity of
the aquifer; and potential effects on other groundwater users.
Research & Development cell, Tamilnadu water supply and Drainage Board 11
FINAL REPORT
3.6.3. Goals for recharge programs: Artificial recharge projects have been designed to accomplish many goals. These goals
include: a) Water supply management to balance short-term or long-term imbalances in
water supply b) Restoration or protection of aquifers by restoring groundwater levels,
limiting compaction, or preventing salt-water intrusion and c) Environmental protection,
such as restoring wetlands, enhancing habitat, or controlling the migration of
contaminated groundwater
The most likely objectives of a potential artificial recharge project would be to restore
water levels in a partially depleted aquifer, Increase the sustainable yield of a well field,
supplement the base flow to a stream, wetland, spring, or lake and to manage storm
water to limit peak flows in streams.
3.7.1. Recharge System component: The recharge system must also be designed to fit the geologic conditions of the site.
Every recharge system has three basic elements such as surface soil layer, deep
vadose—or unsaturated—zone, and aquifer. The surface soil layer is usually thin
enough that it can be removed if it has a lower permeability than the deep vadose zone.
If the vadose zone is permeable a surface recharge system is usually the most
economic option. If the deep vadose zone contains a low permeability zone that is
relatively shallow, trenches or infiltration pits may be needed. If the deep vadose zone
has a low permeability perching zone at greater depth, dry wells or deeper trenches may
be appropriate.
Factors such as swelling clays, or the precipitation or dissolution of minerals, may make
contact with the recharge water with the vadose zone undesirable. If the deep vadose
zone has low permeability, or is geo chemically incompatible with the recharge water,
injection well or direct recharge methods may be necessary. The choice of recharge
method has a significant impact on the land requirements, construction costs, and
operation and maintenance.
Several other factors must be considered when designing a recharge system. The depth
to the zone of saturation will affect the performance of a recharge system. If the vadose
zone is relatively thin, the groundwater mounding that occurs during recharge may
cause pooling in the recharge structure and reduce the recharge rate.
Research & Development cell, Tamilnadu water supply and Drainage Board 12
FINAL REPORT
3.7.2. Clogging Issues for Surface Infiltration Systems: Most sources of recharge water carry some level of suspended particles. These particles
collect at the bottom of the recharge structure and cause clogging. Biological growth,
including bacteria and algae, can also cause clogging. Eventually the clogging problems
reduce the permeability of the recharge face and reduce the recharge rate through the
structure.
Chemical reactions between the recharge water and the soils or native groundwater can
cause clay minerals to swell or minerals to precipitate. These problems can generally be
removed if they occur at or near the bottom of the recharge structure. However, said
clogging can occur at significant depth below the bottom of the recharge structure. Many
of these reactions are irreversible and may eventually cause the recharge system to fail.
Many sources of recharge water contain dissolved gases that are unstable in the
subsurface. This excess air leaves solution and collects as air bubbles in the pore space
of the saturated portion of the recharge system.
For the most part, the unsaturated zone provides the underground storage space for
recharge, although the amount of storage is dependent on the water retention
characteristics and the natural recharge occurring at the site. The hydrologic properties
of an unsaturated zone help determine the suitability of a particular location for artificial
recharge. Optimally, areas used for artificial recharge should have high permeability
soils, the capacity for horizontal movement of water in the unsaturated zone and in the
receiving aquifer, a lack of impeding layers, and a thick unsaturated zone. Under optimal
conditions, water should reach the top of the saturated zone and spread laterally rather
than building up a column of water toward the surface, which would greatly reduce
recharge (Freeze and Cherry, 1979).
The Research activities carried out in this context will integrate the entire spectrum of
activities and disciplines needed to achieve the objectives, and range from basic
research through development to demonstration.
3.8.0. Recharge processes and rates of recharge: Processes to be considered include direct recharge from land infiltration and indirect
recharge from the beds of watercourses in the recharge area. This type of data is quite
helpful for exploring links between recharge rates, land use and final water quality.
Information on groundwater recharge processes is also important for evaluating the
possible advisability of actions aimed at improving natural recharge. Improving natural
Research & Development cell, Tamilnadu water supply and Drainage Board 13
FINAL REPORT
recharge can cost significantly less than implementing artificial recharge. The rate of
recharge will be limited to the ability of the aquifer to transmit the water from the site into
the local groundwater flow system for sites where groundwater is near the surface. If the
vadose zone is too deep, the vertical transit time to the aquifer may be too long or large
volumes of water may be needed to overcome the partial pore pressure in the
unsaturated soils to allow the water to reach the aquifer. Heterogeneous vadose zone
soils exacerbate these problems by encouraging perching or pooling of water in the
unsaturated zone. Heterogeneous soils also increase the lateral dispersion of the
recharging water thereby increasing the time and distance the water must travel.
Conversely, very uniform soils can increase the problems of air entrainment in the
vadose zone that can dramatically reduce recharge rates.
3.8.1. Capillarity: The phenomenon of water rising through interstices of small dimensions against the
force of gravity is called capillarity, which is due to surface tension in water and adhesive
forces exerted by the rock surface within the voids. The gravitational water is subjected
to gravitational forces saturates the voids completely has an internal pore water pressure
greater than atmospheric pressure and flows in lateral direction The upper surface of the
zone of full saturation of the soil is called the water table or pheratic surface. The soil
above the water table would be perfectly dry. However in reality every soil in the field is
completely saturated up to some height above the water table and partially to some
more height. This is an attributed phenomenon of capillarity in soils.
The height to which the water will rise in a uniform tubular opening is a function of the
size of the tube and the density of the water. The height of capillarity rise of water in
rocks related to the dimensions of the voids, cleanness of the walls of the interstices,
temperature and mineral content of the water and relative altitude of the rock where the
capillarity phenomena are operative. For a given area the height to which water will rise
by capillarity is largely a function of the dimension of the pores, which depends on the
width of the open joints, and the size and assortment of particles of materials filling up
such joints. Capillary water is held above the water table by surface tension, a fluid
property which is the alternative force exerted at the interface between materials in
different physical states i.e. liquid/gas solid / liquid. In case of soils it occurs between
surfaces of water, mineral grains and air.
Research & Development cell, Tamilnadu water supply and Drainage Board 14

Chapter IV OBJECTIVE &
METHODOLOGY

FINAL REPORT
4.1.0. Objective: The objectives of the project are as follows:
• To estimate the quantity of rainwater from the rooftop and storm water collected
with in the habitation.
• To estimate the flow direction and flow accumulation based on topographical
elevation data (Global Positioning System (GPS)
• To study the fracture systems of the project area.
• To assess the extent of the fracture system and it’s interconnectivity with the
other sources.
• To assess the quantity and quality of deep fractured aquifer of the project area.
• Finding the feasibility of diverting the rainwater to the defunct drinking water
source.
• Rejuvenate the defunct drinking water supply sources and to secure the
functioning water supply sources so as to ensure sustainable drinking water
supply in the village.
4.2.0. Methodology:
To achieve the above objective, the project has been carried out in a phased
manner. The activities of the different phases are detailed below:
• Identification of observation wells to monitor the hydrological characteristics
before and after the intervention.
• Conducting detailed Geophysical survey in a grid patterns to ascertain different
fracture system of the project area.
• Conduct electrical logging in the defunct bore wells to ascertain the exact fracture
depths.
• Providing infra structure to convert the defunct well as recharge well
• Facilitating infiltration of surface runoff through the defunct wells
• Flushing to improve the infiltration.
• Monitoring the improvement from observation wells by conducting pumping test
before and after facilitating infiltration.
Research & Development cell, Tamilnadu water supply and Drainage Board 15

FINAL REPORT
4.3.0. Execution: The activities have been carried out in a phased manner as detailed below
4.3.1. PHASE - I
• Preparation of cadastral level base map containing the land parcels of the
habitation and its household, streets, location of ground water abstraction
structures using Global Positioning System (GPS). (Plate 4)
• Derivation of elevation contour based on GPS data to find out the flow direction
and flow accumulation. (Fig.5)
• Estimation of roof catchment of households and street, open area catchment.
• Fixing up of observation wells for water level & water quality monitoring for
impact assessment. ( Plate 5 )
• Periodical water level and water quality monitoring for assessment purpose
4.3.2. PHASE - II
• Conducting geophysical survey for ascertaining the sub surface characteristics.
• Conducting pumping test to ascertain the aquifer characteristics.
• Identification of fractured zone, depth and yield.
• Construction of storage pond to impound the rainfall runoff.
• Construction of shaft around the defunct bore wells and other facilities to connect
the shaft and the pond.
• Diverting the roof water to the storage pond through conduit wherever possible
• Ground water level and quality monitoring.
4.3.3. PHASE – III
• Studying the rainfall data and analysis.
• Water level and water quality analysis for impact assessment.
• Conducting pumping test to analyze post project improvement.
• Preparation and presentation of final report.
Research & Development cell, Tamilnadu water supply and Drainage Board 16
Chapter V TECHNICAL INPUT
FINAL REPORT
5.0.0. TECHNICAL INPUT: 5.1.0.Geology: Geologically the area comprises of granitic gneiss, charnockite, Hornblende gneiss and
granitic gneiss with minor quartzite and pegmatite intrusions. The weathered zone varies
form 12 to 25 m as observed from the existing bore well records as well as from the
inventory report. Northeast - Southwest lineaments are identified in the field. Some
minor and major lineaments are found in the area .The foliation direction of the formation
is NE-SW and dipping towards SE. Quartzite intrusion is noticed along the foliation of
the country rock. Characterization of the geology is important in determining the viability
of any type of recharge project, particularly where significant lateral and (or) vertical
ground-water flow is required between recharge and discharge locations. Key features
such as faults with significant offset, folds, and aerially extensive coarse- or fine-grained
units can exert dominant controls on a flow system and on the fate of water from artificial
recharge projects.
5.2.0.Hydrogeology: The western part of the study area is formed of series of outcrops structurally disturbed
and acts as water divide for the adjacent karaipottanar watershed. The slopes found to
be divergent on both sides. The major out crop Nainar malai South west of the project
area and two different outcrops found in the northern side of the hill is of same origin and
litho logical characteristics. The 20 m contour drawn over the area dips towards NW of
Nainar malai and depicts a particular depression pattern. A number of regional
lineaments have been interpreted from satellite imagery. The important feature is that
where fractures are present the bedrock is expected to be more strongly weathered to a
greater depth than where it is unfractured. Large number of bore wells had been drilled
in this area and they are deep in nature (90-300 m depth below ground level
The water bearing properties of rocks depend on the shape size, arrangement,
interconnection and extensiveness of the voids in which the water can accumulate and
move. Rocks differ greatly in their water bearing properties. Ground water occurs under
water table conditions in weathered zones. Water level varies from 12 to 25m below
ground level. The winter and summer water level varies from 7 to 15m and 15 to 29m in
Puduchatram block. The water level data of the observation well from this block
indicates that there is a declining trend during summer and there is no remarkable
increasing trend during winter i.e. during the rainy season. Owing to poor recharge
Research & Development cell, Tamilnadu water supply and Drainage Board 17
FINAL REPORT
conditions the bore wells located in the lineaments are not supplying sufficiently during
summer months.
5.3.0.Field survey using Global Positioning System (GPS): Using Trimble Global Positioning System (GPS) the geo coordinates of the observation
wells and all other infrastructures at closer interval along with the elevation at different
location within the project area has been picked up. The aerial extent regarding the built
up area, street, open area has been assessed based on the data collected using GPS
from the field and from the base map.
5.3.1.Elevation contour In order to assess the flow accumulation in the project area elevation above
mean sea level (point elevation) has been picked up using GPS. The point elevation
data picked up using GPS has been matched with cadastral level map for generating
elevation contour. Using the Geographical Information System software the elevation
contour has been computed. The maximum elevation is 218.2 m and the minimum
elevation is 211.0 m with an elevation drop of 7.2m. One third of the surface area of the
habitation having slope towards the defunct bore well (Proposed recharge bore well).
The slope in the northeastern and northwestern side of the habitation is away from the
proposed recharge site. The southeastern side of the settlement also slopes away from
the target i.e. the defunct bore wells. Since the elevation difference is 0.5 to 1.0 m a
small earthwork would make up the slope so that it can facilitate smooth sloping towards
the defunct bore wells. The elevation contour is presented in Fig.5
A large area of the settlement lies in the contour of 217 to 215 m above MSL having a
converging slope towards the project site. The path / road that leads to the fields away
from the village almost lie in the lower level compared with the area of the settlement.
The site chosen for constructing the storage pond lies almost in the lower elevation
compared with the adjoining area of the village. GPS has helped exactly to pin point the
lowest level point as well as the running slope, which facilitated in harvesting the
rainwater so as to recharge the fractures for making the ground water potential and the
drinking water sustainable.
Research & Development cell, Tamilnadu water supply and Drainage Board 18
FINAL REPORT
5.3.2.Weathering Thickness: The over burden thickness is necessary to assess the infiltration rate of the formation
and its hydraulic connectivity. The details about the over burden and the weathered
thickness of the project area has been collected from the open wells and from the
records of the bore wells. As the weathered thickness is sufficient, the wells located in
the study area have the hydraulic connectivity. The iso-weathered thickness contour
generated is presented in Fig.6 The weathered thickness contour depicts that maximum
weathering (10 – 12 m) is noticed with in the habitation and around the proposed
recharge bore well site.
Dynamic Natural recharge takes place only after satisfying the vadose zone when there
is enough precipitation. Weathering thickness is the primary factor in recharging the
formation as well as to effect movement of ground water. Unless other wise there is
connectivity through fractures to the deeper depth infiltrated water does not reach the
deep-seated fractures.
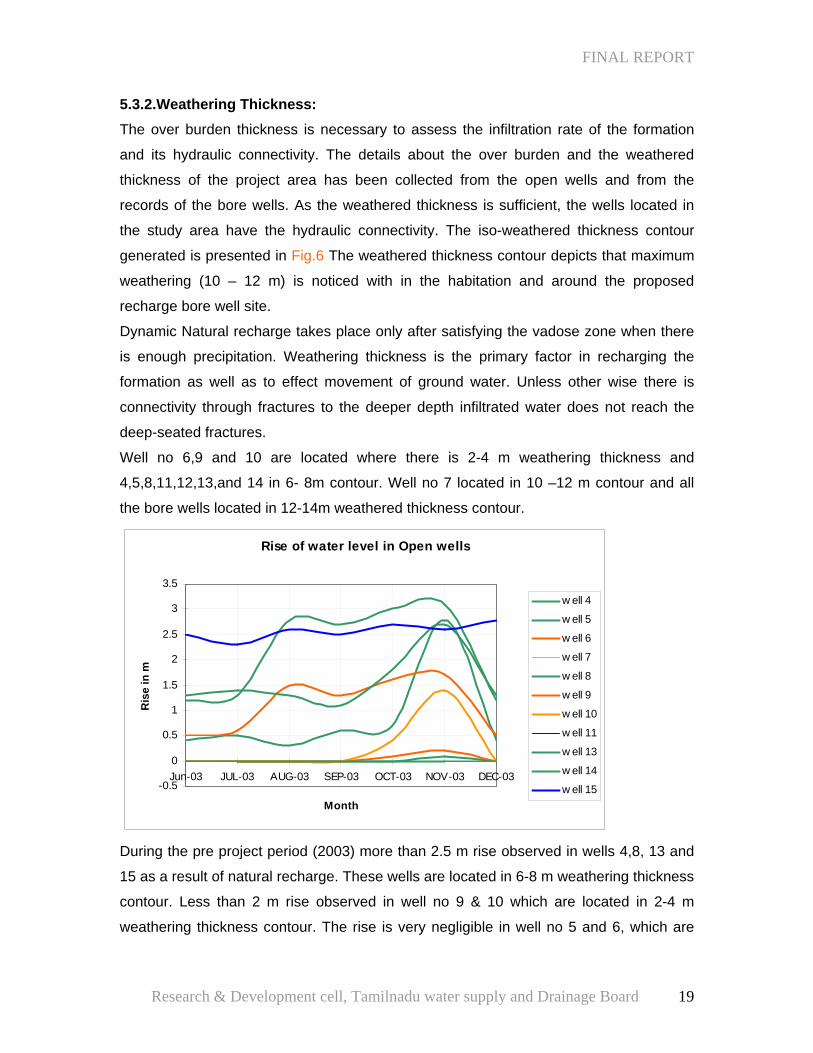
Well no 6,9 and 10 are located where there is 2-4 m weathering thickness and
4,5,8,11,12,13,and 14 in 6- 8m contour. Well no 7 located in 10 –12 m contour and all
the bore wells located in 12-14m weathered thickness contour.
Rise of water level in Open wells
-0.5
0
0.5
1
1.5
2
2.5
3
3.5
Jun-03 JUL-03 AUG-03 SEP-03 OCT-03 NOV-03 DEC-03
Month
Ris
e in
m
w ell 4
w ell 5
w ell 6
w ell 7
w ell 8
w ell 9
w ell 10
w ell 11
w ell 13
w ell 14
w ell 15
During the pre project period (2003) more than 2.5 m rise observed in wells 4,8, 13 and
15 as a result of natural recharge. These wells are located in 6-8 m weathering thickness
contour. Less than 2 m rise observed in well no 9 & 10 which are located in 2-4 m
weathering thickness contour. The rise is very negligible in well no 5 and 6, which are
Research & Development cell, Tamilnadu water supply and Drainage Board 19
FINAL REPORT
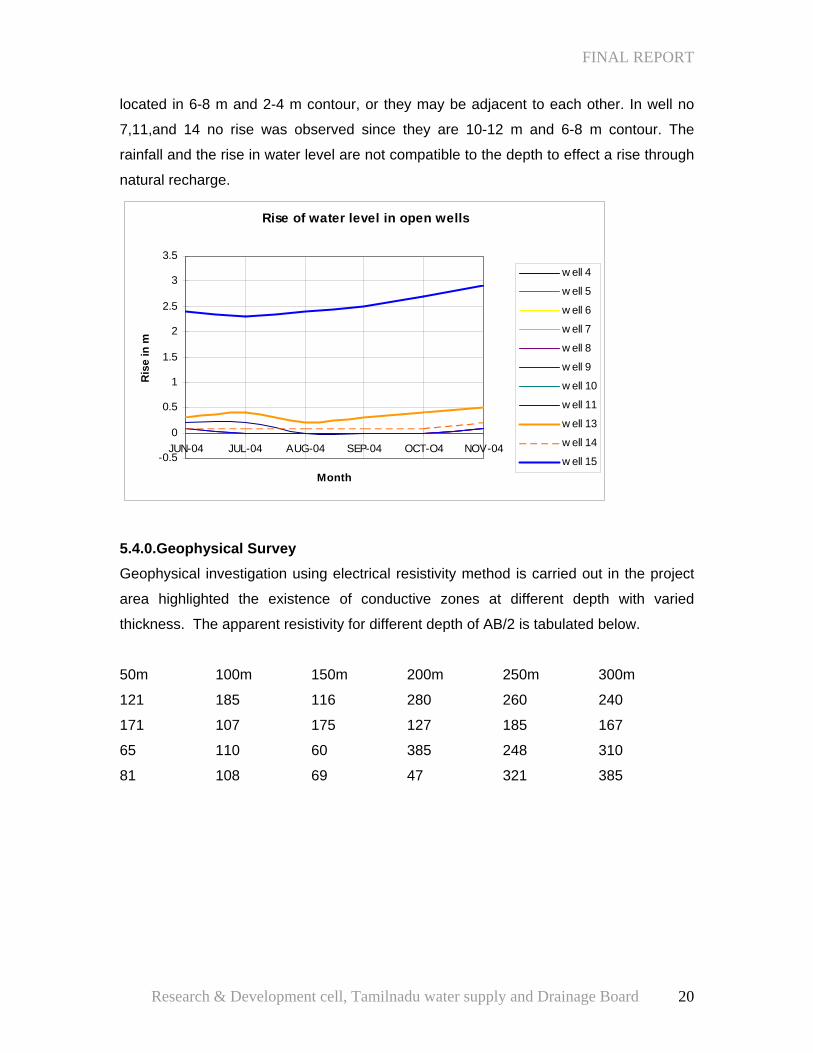
located in 6-8 m and 2-4 m contour, or they may be adjacent to each other. In well no
7,11,and 14 no rise was observed since they are 10-12 m and 6-8 m contour. The
rainfall and the rise in water level are not compatible to the depth to effect a rise through
natural recharge.
Rise of water level in open wells
-0.5
0
0.5
1
1.5
2
2.5
3
3.5
JUN-04 JUL-04 AUG-04 SEP-04 OCT-O4 NOV-04
Month
Ris
e in
m
w ell 4
w ell 5
w ell 6
w ell 7
w ell 8
w ell 9
w ell 10
w ell 11
w ell 13
w ell 14
w ell 15
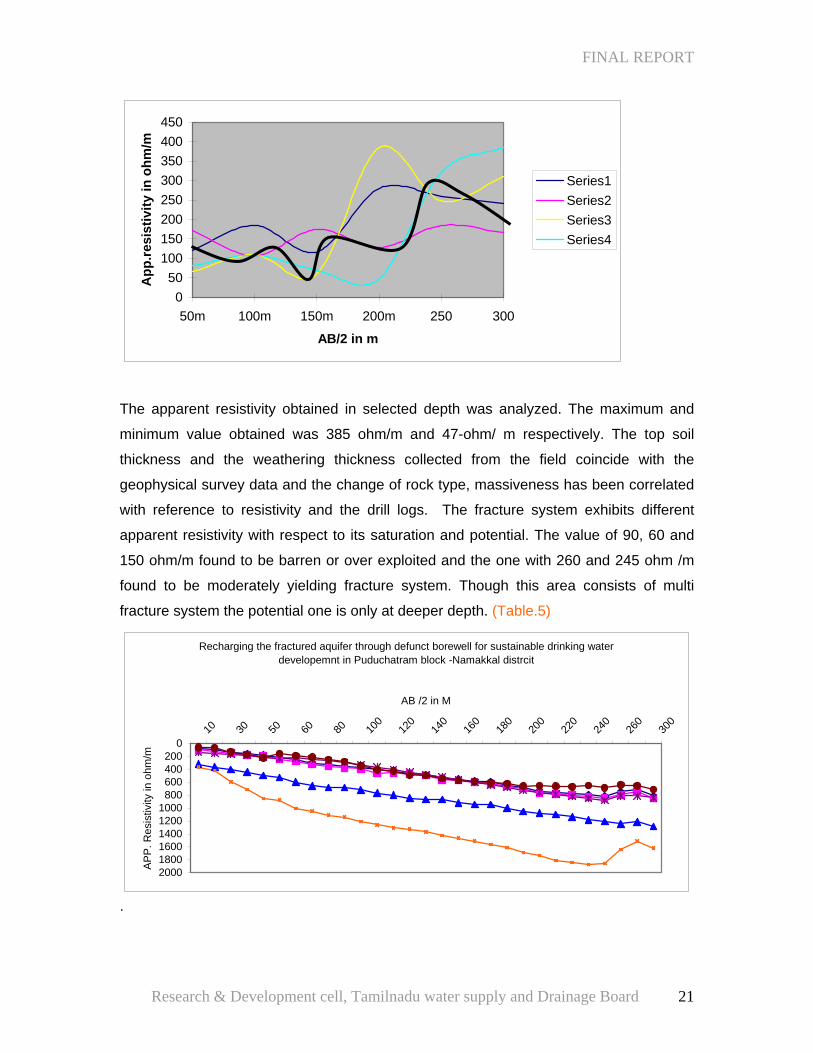
5.4.0.Geophysical Survey Geophysical investigation using electrical resistivity method is carried out in the project
area highlighted the existence of conductive zones at different depth with varied
thickness. The apparent resistivity for different depth of AB/2 is tabulated below.
50m 100m 150m 200m 250m 300m
121 185 116 280 260 240
171 107 175 127 185 167
65 110 60 385 248 310
81 108 69 47 321 385
Research & Development cell, Tamilnadu water supply and Drainage Board 20
FINAL REPORT
050
100150200250300350400450
50m 100m 150m 200m 250 300
AB/2 in m
App
.resi
stiv
ity in
ohm
/m
Series1Series2Series3Series4
The apparent resistivity obtained in selected depth was analyzed. The maximum and
minimum value obtained was 385 ohm/m and 47-ohm/ m respectively. The top soil
thickness and the weathering thickness collected from the field coincide with the
geophysical survey data and the change of rock type, massiveness has been correlated
with reference to resistivity and the drill logs. The fracture system exhibits different
apparent resistivity with respect to its saturation and potential. The value of 90, 60 and
150 ohm/m found to be barren or over exploited and the one with 260 and 245 ohm /m
found to be moderately yielding fracture system. Though this area consists of multi
fracture system the potential one is only at deeper depth. (Table.5)
Recharging the fractured aquifer through defunct borewell for sustainable drinking water developemnt in Puduchatram block -Namakkal distrcit
0200400600800
100012001400160018002000
10 30 50 60 80 100
120
140
160
180
200
220
240
260
300
AB /2 in M
AP
P. R
esis
tivity
in o
hm/m
.
Research & Development cell, Tamilnadu water supply and Drainage Board 21
FINAL REPORT
The survey was conducted to establish the extent, depth and thickness of the fracture
system but it is out of scope for this particular project to ascertain the actual extent of the
fracture system, which need further detailed study. There are number of small and
medium thickness fracture systems and most of the top fractures found to be barren
since exploited and the natural recharge in the form of rainfall infiltration is not sufficient
to cope up with the drawl. The fracture depth is established at 56m, 98m, 154m, 230m
and at 276m. However the fractures met with up to 154 m do not found to be potential
and the one met at 230 m was not sustainable before the intervention of this project. The
fractures below 270 m found to be potential but not sustainable since bore wells drilled
beyond this depth and in proximity to the water sources makes it erratic in supply.
The deeper fracture system delineated runs across SE – NW direction from Nainar malai
to beyond Puduchatram town which is 3.7 km from Karukurichi. The periodical water
level observed in one of the network well situated in Puduchatram displays a fairly good
impact of the recharge measures undertaken in Karukurichi. There is a marked
difference in the water level observed before and after the project undertaken. More
study is required to exactly establish the fracture depth, its thickness extension, potential
and the catchment characteristics.
5.5.0.RAINFALL Most hydrologic problems require knowledge of the average depth of rainfall over a
significant area. Some procedure must be used to connect the rainfall measured at rain
gauges to aerial averages. The average depth of rainfall also termed, as equivalent
uniform depth of rainfall. It is never possible to determine exactly the average depth of
rainfall over a given area. There are three methods of treating the rain gauge records to
arrive at an approximate answer and in general the three methods give three different
approximations. They are arithmetic mean, Thiessen weighted mean, and Isohyetal
method. The first two methods are purely mechanical processes requiring no special skill
or judgment .on the other hand results obtained by the third method which perhaps
should be the most accurate, depend for their accuracy upon the good judgment of the
person making the computations. There are 6 rain gauge stations functioning in this
district. They are Namakkal,Paramathi,Rasipuram,Sendamanagalam,and Tiruchengode.
The average rainfall worked out for the district is based on the arithmetic mean of the
said stations..50 years normal rainfall for the district worked out to 804 mm. In the
present study the rainfall as published by IMD and given in the government website for
Research & Development cell, Tamilnadu water supply and Drainage Board 22
FINAL REPORT
Namakkal district has been taken up for analysis.
Year wise Rainfall in Namakkal District
832
1174
686601
942
612
11349391011
633
1169
435
1097868
1280
886982921915
600
934812
997831921
1202992
693743759571
390559
729.3
1183.3
0200400600800
100012001400
197119
7219
7319
7419
7519
7619
7719
7819
7919
8019
8119
8219
8319
8419
8519
8619
8719
8819
8919
9019
9119
9219
9319
9419
9519
9619
9719
9819
9920
0020
0120
0220
0320
0420
05
Period in years
Rai
nfal
l in
mm
801mm
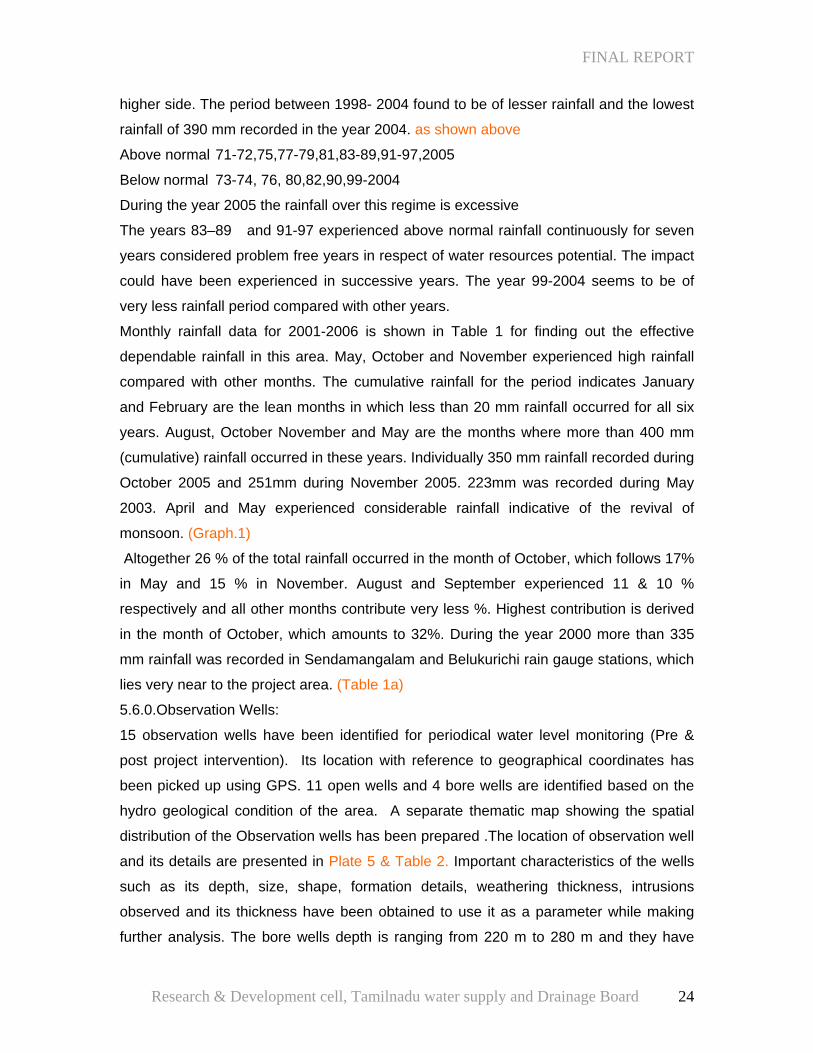
The records from 1971 onwards show normal rainfall (i.e. +/- 20 % rainfall from
the 50 years normal) at least for 30 years. The frequency of higher rainfall observed
during 1971 to 2005 shows the following variation pattern. Above normal rainfall was
observed continuously during 71-72, 77-79, 83-89 ,91-97 and during 75,81 and 2005.
The highest rainfall of 1280 mm was recorded during the year 1985 and 675mm rainfall
was recorded during 2005 North east monsoon alone which is 142 % excess of the
normal rainfall. Over 1000mm rainfall experienced for at least 8 years and 900-1000 mm
for 9 years from 1971 to 2005. Above 801 mm rainfall was recorded at least for 22 years
during this period. For at least two terms the above normal rainfall was recorded
continuously for 7 years and hence the water level and the potential would have been on
Research & Development cell, Tamilnadu water supply and Drainage Board 23
FINAL REPORT
higher side. The period between 1998- 2004 found to be of lesser rainfall and the lowest
rainfall of 390 mm recorded in the year 2004. as shown above
Above normal 71-72,75,77-79,81,83-89,91-97,2005
Below normal 73-74, 76, 80,82,90,99-2004
During the year 2005 the rainfall over this regime is excessive
The years 83–89 and 91-97 experienced above normal rainfall continuously for seven
years considered problem free years in respect of water resources potential. The impact
could have been experienced in successive years. The year 99-2004 seems to be of
very less rainfall period compared with other years.
Monthly rainfall data for 2001-2006 is shown in Table 1 for finding out the effective
dependable rainfall in this area. May, October and November experienced high rainfall
compared with other months. The cumulative rainfall for the period indicates January
and February are the lean months in which less than 20 mm rainfall occurred for all six
years. August, October November and May are the months where more than 400 mm
(cumulative) rainfall occurred in these years. Individually 350 mm rainfall recorded during
October 2005 and 251mm during November 2005. 223mm was recorded during May
2003. April and May experienced considerable rainfall indicative of the revival of
monsoon. (Graph.1)
Altogether 26 % of the total rainfall occurred in the month of October, which follows 17%
in May and 15 % in November. August and September experienced 11 & 10 %
respectively and all other months contribute very less %. Highest contribution is derived
in the month of October, which amounts to 32%. During the year 2000 more than 335
mm rainfall was recorded in Sendamangalam and Belukurichi rain gauge stations, which
lies very near to the project area. (Table 1a)
5.6.0.Observation Wells:
15 observation wells have been identified for periodical water level monitoring (Pre &
post project intervention). Its location with reference to geographical coordinates has
been picked up using GPS. 11 open wells and 4 bore wells are identified based on the
hydro geological condition of the area. A separate thematic map showing the spatial
distribution of the Observation wells has been prepared .The location of observation well
and its details are presented in Plate 5 & Table 2. Important characteristics of the wells
such as its depth, size, shape, formation details, weathering thickness, intrusions
observed and its thickness have been obtained to use it as a parameter while making
further analysis. The bore wells depth is ranging from 220 m to 280 m and they have
Research & Development cell, Tamilnadu water supply and Drainage Board 24
FINAL REPORT
been drilled in different periods. Three of them located near the temple of which two bore
wells have been abandoned. One bore well abandoned since it has failed to yield and
the other one is not giving sustained yield. Hence the third bore well which is functioning
now also unable to cope up with the present demand. Further the non-replenishment of
deeper fractures on which the bore well depends makes the yield inadequate and non
sustainable during summer months. The open wells chosen are used for agricultural
activities and most of them are power driven. The depth of wells is ranging from 13.5 m
to 22.7 m bgl. Some of the open wells found to be dry almost all the months before
construction of the recharge shaft around the defunct bore wells.
5.6.1.Water level monitoring: The impact of the recharge structure on ground water can be assessed only when the
water level data for the pre and post project implementation periods are available.
Hence, observation wells in the project area have been fixed for periodic water level
monitoring. Water level at 30 days frequency is collected from June 2003 onwards from
the observation wells. Six periods of pre and post monsoon water level data have been
collected since the project started. All the bore wells used for drinking purpose have
been taken as observation wells. Two of them defunct and chosen for converting it in to
recharge bore well, one of the bore well has been converted in to mini pump scheme
and put in to use.
5.3.0 Water quality: The vulnerability of surface water and ground water to degradation depends on a
combination of natural landscape features, such as geology, topography, and soils;
climate and atmospheric contributions; and human activities related to different land
uses and land-management practices. More nitrogen and phosphorous can be used by
crops or animals. All this growth puts great stress on the natural water resources, The
ground water samples from the three drinking water sources and other observation wells
have been tested for physical and chemical quality. The quality of the defunct source
found to be not potable during the pre project period. TDS, Total hardness and
calcium(Ca) Sulphate (So4) and Nitrate ( No3) found to be excessive and makes the
quality of the water not potable.
Research & Development cell, Tamilnadu water supply and Drainage Board 25
FINAL REPORT
Nitrate is found to be excessive in the defunct bore wells and in the public open well.
These excess nutrients have the potential to degrade water quality if incorporated into
runoff. The quality of the defunct bore well chosen for conversion as recharge bore well
and existing drinking water source in use is found to be potable. The water quality data
after the construction of the recharge shaft shows that a considerable improvement in
the TDS Hardness and calcium in all the observation wells.
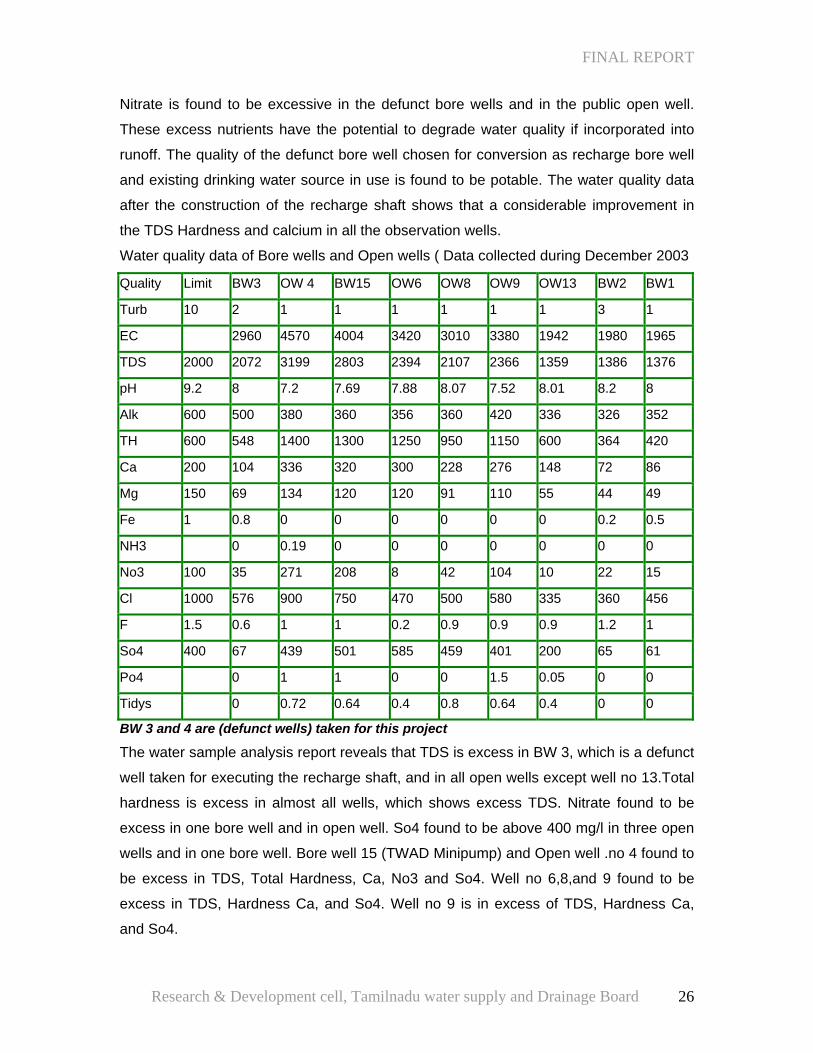
Water quality data of Bore wells and Open wells ( Data collected during December 2003
Quality Limit BW3 OW 4 BW15 OW6 OW8 OW9 OW13 BW2 BW1
Turb 10 2 1 1 1 1 1 1 3 1
EC 2960 4570 4004 3420 3010 3380 1942 1980 1965
TDS 2000 2072 3199 2803 2394 2107 2366 1359 1386 1376
pH 9.2 8 7.2 7.69 7.88 8.07 7.52 8.01 8.2 8
Alk 600 500 380 360 356 360 420 336 326 352
TH 600 548 1400 1300 1250 950 1150 600 364 420
Ca 200 104 336 320 300 228 276 148 72 86
Mg 150 69 134 120 120 91 110 55 44 49
Fe 1 0.8 0 0 0 0 0 0 0.2 0.5
NH3 0 0.19 0 0 0 0 0 0 0
No3 100 35 271 208 8 42 104 10 22 15
Cl 1000 576 900 750 470 500 580 335 360 456
F 1.5 0.6 1 1 0.2 0.9 0.9 0.9 1.2 1
So4 400 67 439 501 585 459 401 200 65 61
Po4 0 1 1 0 0 1.5 0.05 0 0
Tidys 0 0.72 0.64 0.4 0.8 0.64 0.4 0 0
BW 3 and 4 are (defunct wells) taken for this project
The water sample analysis report reveals that TDS is excess in BW 3, which is a defunct
well taken for executing the recharge shaft, and in all open wells except well no 13.Total
hardness is excess in almost all wells, which shows excess TDS. Nitrate found to be
excess in one bore well and in open well. So4 found to be above 400 mg/l in three open
wells and in one bore well. Bore well 15 (TWAD Minipump) and Open well .no 4 found to
be excess in TDS, Total Hardness, Ca, No3 and So4. Well no 6,8,and 9 found to be
excess in TDS, Hardness Ca, and So4. Well no 9 is in excess of TDS, Hardness Ca,
and So4.
Research & Development cell, Tamilnadu water supply and Drainage Board 26
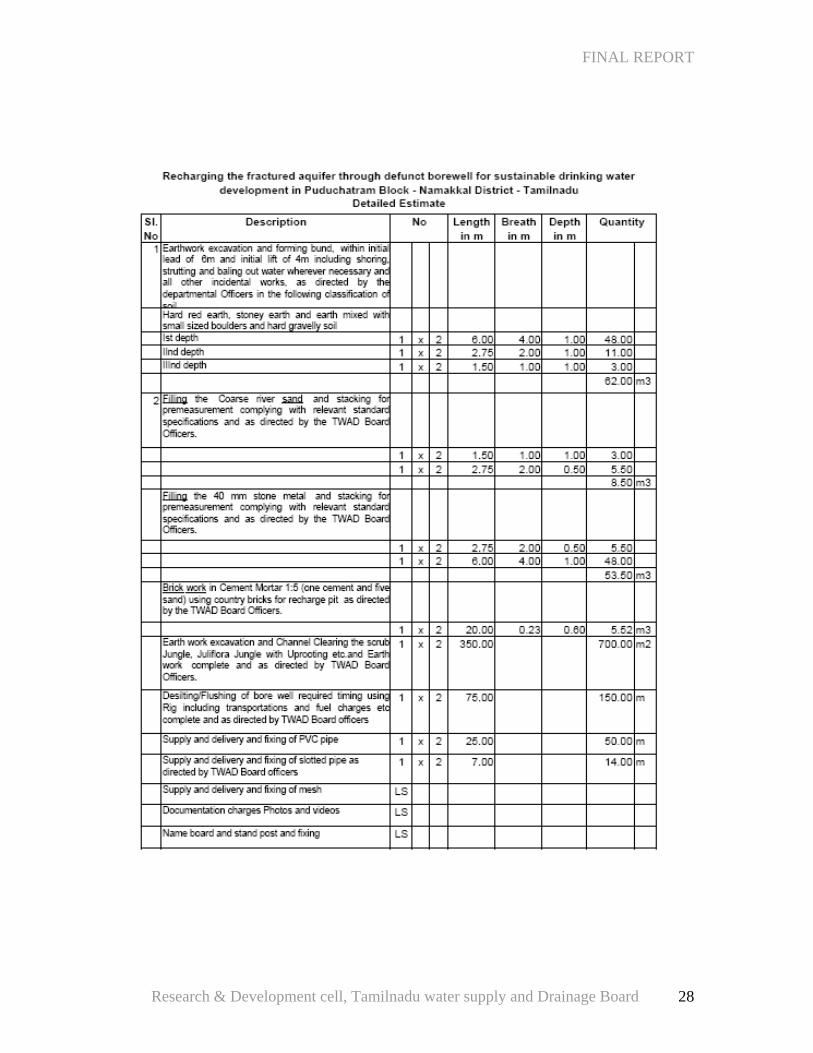
Chapter VI IMPLEMENTATION
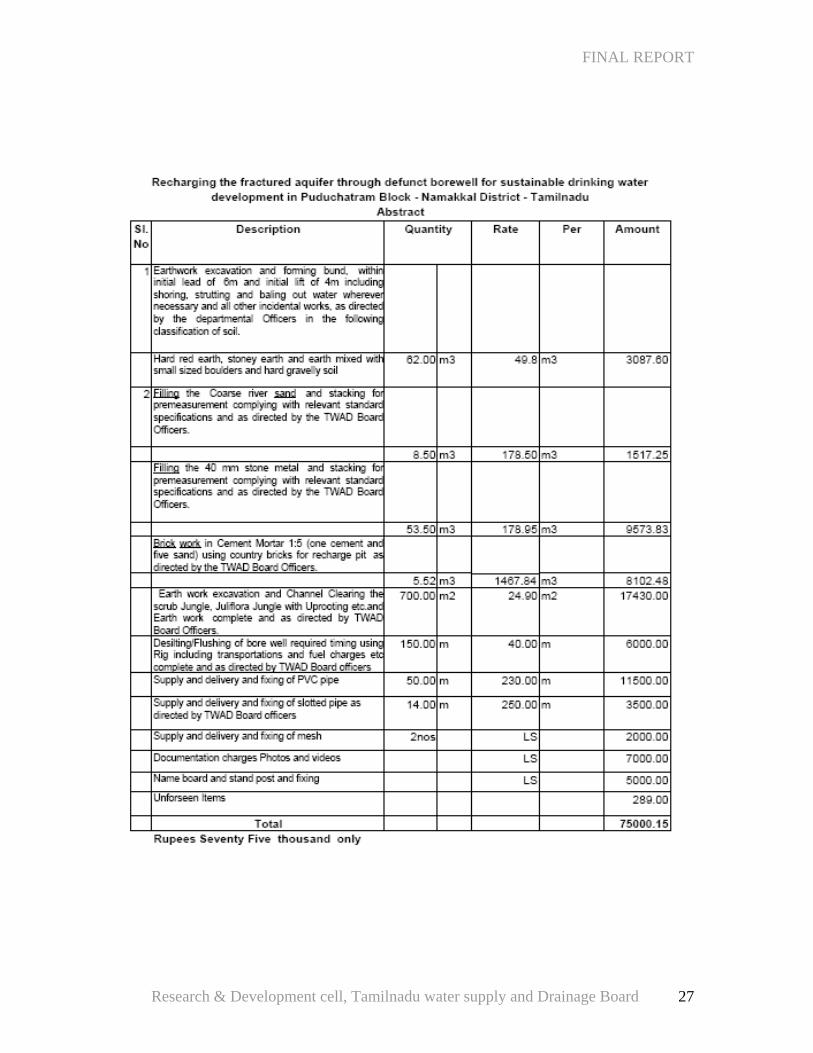
FINAL REPORT
Research & Development cell, Tamilnadu water supply and Drainage Board 27
FINAL REPORT
Research & Development cell, Tamilnadu water supply and Drainage Board 28
FINAL REPORT
Research & Development cell, Tamilnadu water supply and Drainage Board 29
FINAL REPORT
6.1.0.Recharge wells :
A recharge well is that one used for the purpose of increasing the ground water supply
by feeding water in to an aquifer. The movement of water in a recharge well is in the
reverse direction to that of an ordinary well. The recharge rate depends on the specific
capacity of a well and the pressure head. The available pressure head of a recharge well
is the vertical distance between the ground surface and the water level in the well. The
available pressure head of a recharge well is functionally the converse of the available
draw down in pumping well. when a well is recharged a recharge cone or cone of
impression is formed which is similar in shape to but the reverse in configuration of a
cone of depression around a pumping well. The rate of intake Q1 by a fully penetrating
well is given by
Q1 = 2 π Kb (hw-h0)/ In (r0 / rw)
Where
rw= dia of the well
r0 = distance between the well and the limb on water table
h0 = water column (static water level)
hw=water column
b = aquifer column
The recharge capacity of a well is the maximum rate at which it can take in and dispose
of water admitted at or near its upper end. It is approximately equal to the product of the
specific capacity multiplied by the available pressure head. Although theoretically for the
same recharge cone and drawdown cone the rate of intake and discharge of a well
should be equal.
Recharge rates vary widely the common range being 0.2 to 2 million l /day. In this
project n new infrastructures has been created instead a borewell already kept idle and
defunct has been rejuvenated and converted as recharge well. only the shaft around the
bore wells interlinking arrangements and a storage pond for collecting the rainwater
have been provided at minimum cost.
The design aspect of the project was conceived by the R&D cell and the execution has
been done by the panchayat itself with the technical supervision of Rural water supply
Division TWAD board Namakkal.
Research & Development cell, Tamilnadu water supply and Drainage Board 30
FINAL REPORT
6.2.0. Implementation of civil works: The work has been entrusted to the president Karukurichi panchayat since the project
has aimed to involve the local public (of the panchayat) so as to create a feeling of
ownership to the villagers that could help in maintaining the infrastructures in the post
project period. The area where the bore wells located belongs to the village temple and
hence there is no problem in taking possession for further work. However the location
identified for creating a storage pond, which would be connected with the defunct bore
wells was under encroachment and the villagers persuaded the individual by convening
a meeting and explained the benefit of the scheme if implemented. The details of the
project and its objectives were explained and the present condition of the deep fracture
system on which a number of bore wells drilled for agriculture has been put forth with
scientific reasons. Further it has been explained that the major benefits derived out of
the project would be for the farmers who depends on the deep bore wells for their
livelihood. The public themselves interchanged their views on the enrichment of the
aquifer system, water level rise, duration and quantity of pumping and extension of
cultivation and cultivable lands. In the initial stage itself the whole public is united for a
common cause.
Location of the project site in KARUKURICHI Village
Defunct bore
The defunct bore wells were drilled during d
Indiscriminate drilling around the area for agricul
Research & Development cell, Tamilnadu w
Site chosen for storagepond
ifferent periods with different depth.
tural purpose, deeper depth and failure
ater supply and Drainage Board 31
FINAL REPORT
of seasonal monsoon made the bore wells defunct. The bore well provided with MS
casing pipe drilled to a depth of 240 m more than a decade ago. Since this bore well is
unable to supply the required yield another bore well was drilled nearby with PVC casing
to a depth of 260 m. This was also unable to withstand the over extraction and
groundwater depletion due to monsoon failure. The third bore well drilled in front of the
temple at a distance of 40 m to a depth of 280 m is functioning with less yield. This is the
actual target of the project and the very objective is to enhance the potential of the
formation from which it draws water for the village water supply scheme.
Defunct bore wells- preferred for converting in to recharge bore wells.
Jungle clearance has been done in the area where the defunct bore wells exist and in
the proposed location for storage pond. A deep well rig has been employed to flush the
defunct bore well to make them fit for recharge by removing all the silts accumulated in
the bore well over the years. The full depth of the bore well has been flushed and the
yield of the bore well also ascertained as on the date of flushing. This has been utilized
while making impact assessment. Pumping test details collected in other wells has been
correlated with the flushing data for further analysis to bring out the Transmissivity and
Storage coefficient, which decides the discharge conditions of the formation. The same
could be employed to evaluate the recharge conditions of any formations.
Research & Development cell, Tamilnadu water supply and Drainage Board 32
FINAL REPORT
Site cleared for the construction:
A deep well rig has flushed the bore wells
Research & Development cell, Tamilnadu water supply and Drainage Board 33
FINAL REPORT
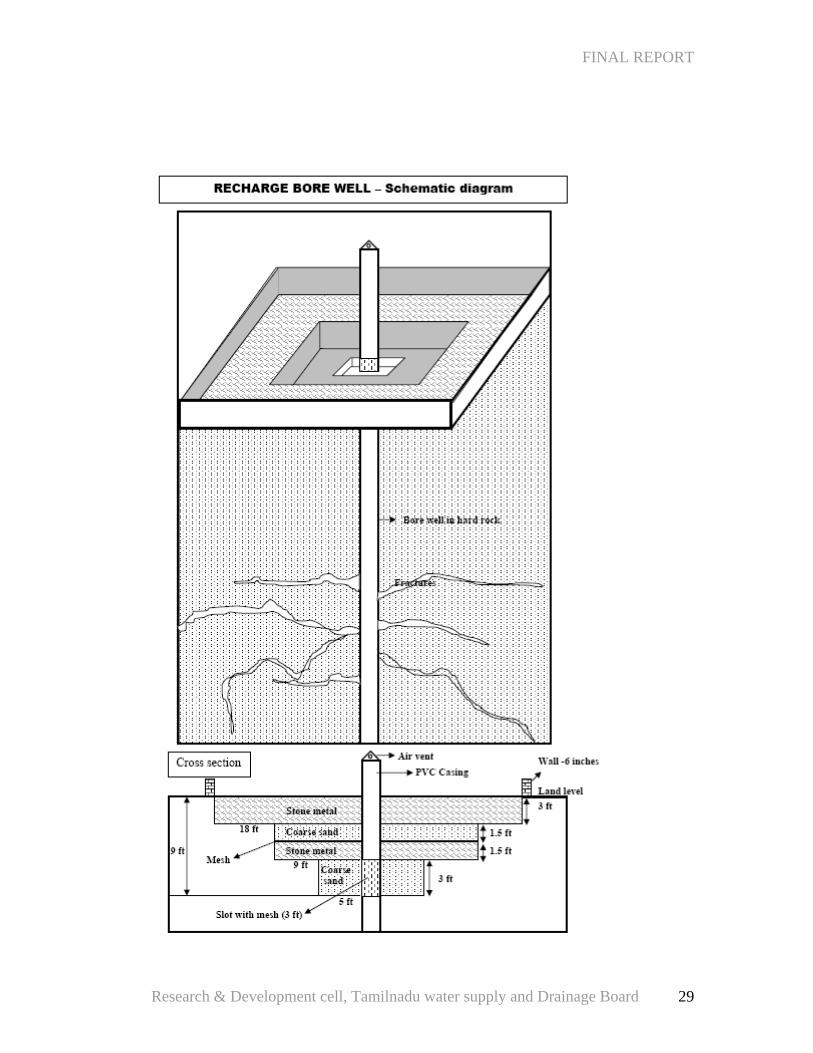
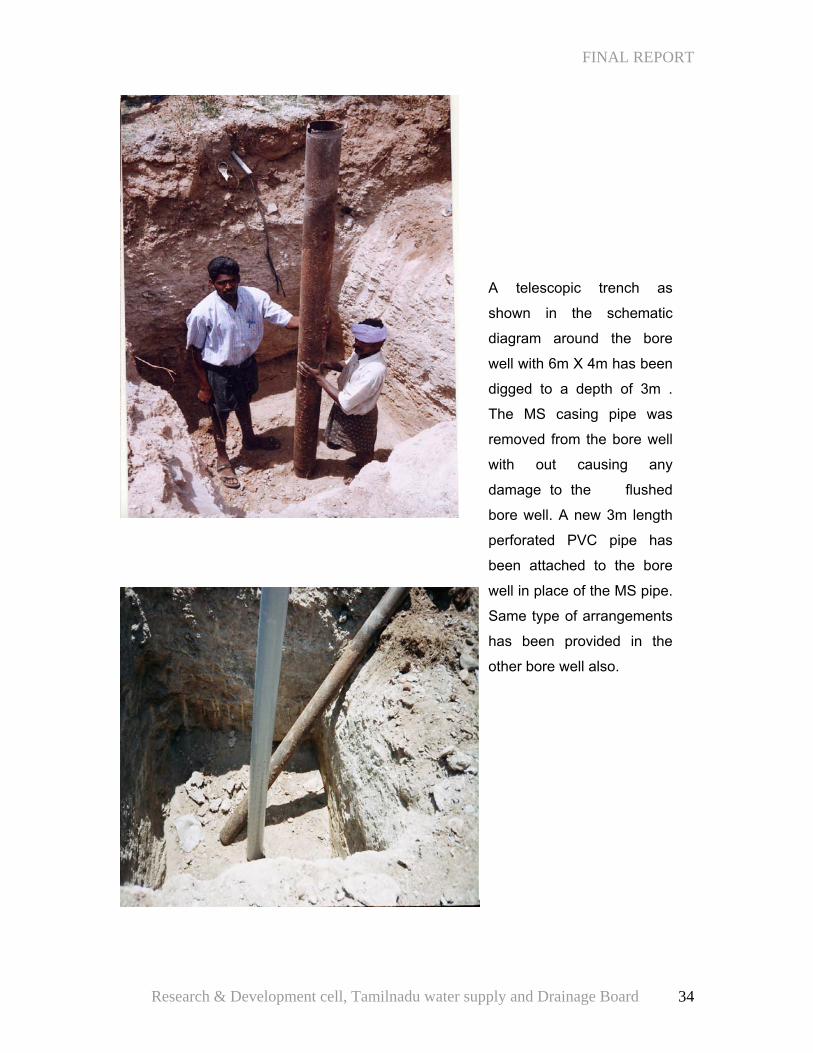
A telescopic trench as
shown in the schematic
diagram around the bore
well with 6m X 4m has been
digged to a depth of 3m .
The MS casing pipe was
removed from the bore well
with out causing any
damage to the flushed
bore well. A new 3m length
perforated PVC pipe has
been attached to the bore
well in place of the MS pipe.
Same type of arrangements
has been provided in the
other bore well also.
Research & Development cell, Tamilnadu water supply and Drainage Board 34
FINAL REPORT
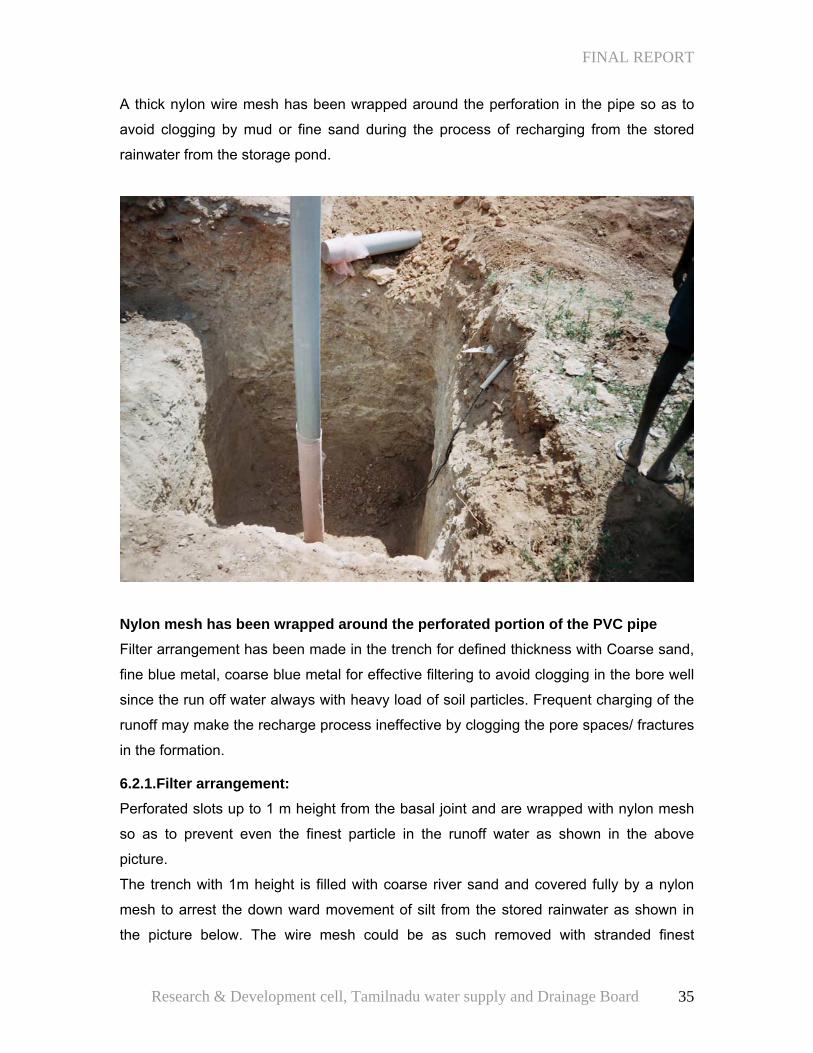
A thick nylon wire mesh has been wrapped around the perforation in the pipe so as to
avoid clogging by mud or fine sand during the process of recharging from the stored
rainwater from the storage pond.
Nylon mesh has been wrapped around the perforated portion of the PVC pipe Filter arrangement has been made in the trench for defined thickness with Coarse sand,
fine blue metal, coarse blue metal for effective filtering to avoid clogging in the bore well
since the run off water always with heavy load of soil particles. Frequent charging of the
runoff may make the recharge process ineffective by clogging the pore spaces/ fractures
in the formation.
6.2.1.Filter arrangement: Perforated slots up to 1 m height from the basal joint and are wrapped with nylon mesh
so as to prevent even the finest particle in the runoff water as shown in the above
picture.
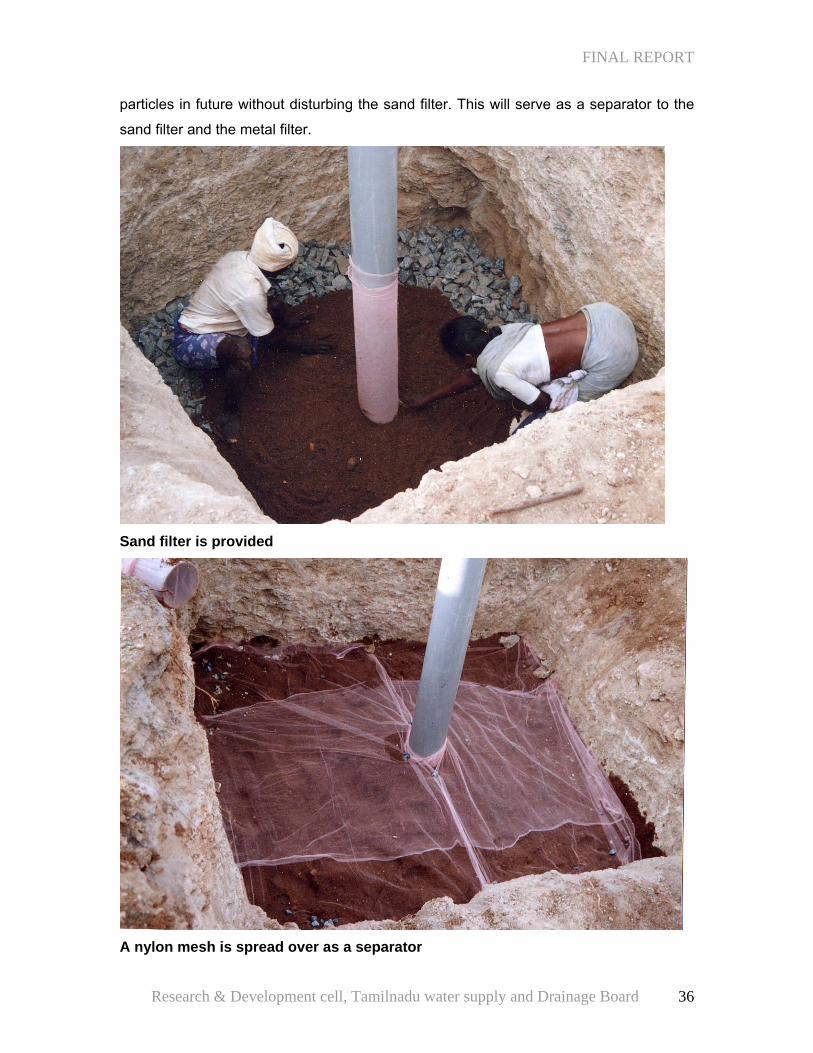
The trench with 1m height is filled with coarse river sand and covered fully by a nylon
mesh to arrest the down ward movement of silt from the stored rainwater as shown in
the picture below. The wire mesh could be as such removed with stranded finest
Research & Development cell, Tamilnadu water supply and Drainage Board 35
FINAL REPORT
particles in future without disturbing the sand filter. This will serve as a separator to the
sand filter and the metal filter.
Sand filter is provided
A nylon mesh is spread over as a separator
Research & Development cell, Tamilnadu water supply and Drainage Board 36
FINAL REPORT
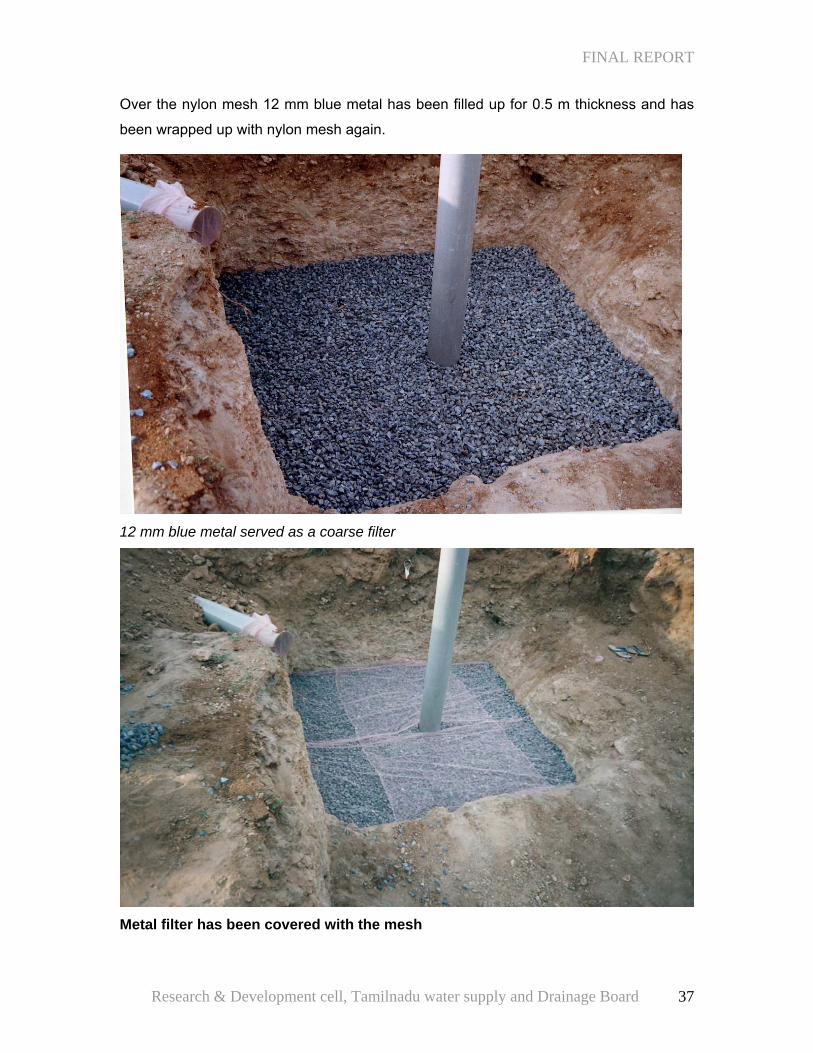
Over the nylon mesh 12 mm blue metal has been filled up for 0.5 m thickness and has
been wrapped up with nylon mesh again.
12 mm blue metal served as a coarse filter
Metal filter has been covered with the mesh
Research & Development cell, Tamilnadu water supply and Drainage Board 37
FINAL REPORT
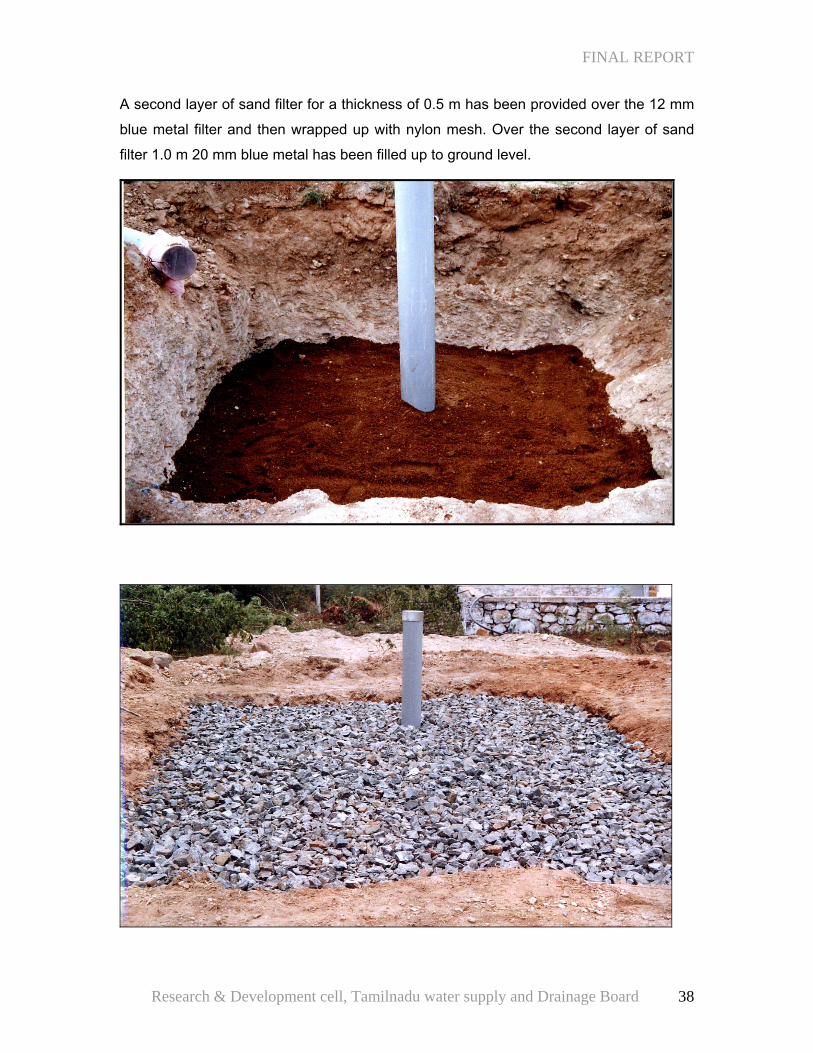
A second layer of sand filter for a thickness of 0.5 m has been provided over the 12 mm
blue metal filter and then wrapped up with nylon mesh. Over the second layer of sand
filter 1.0 m 20 mm blue metal has been filled up to ground level.
Research & Development cell, Tamilnadu water supply and Drainage Board 38
FINAL REPORT
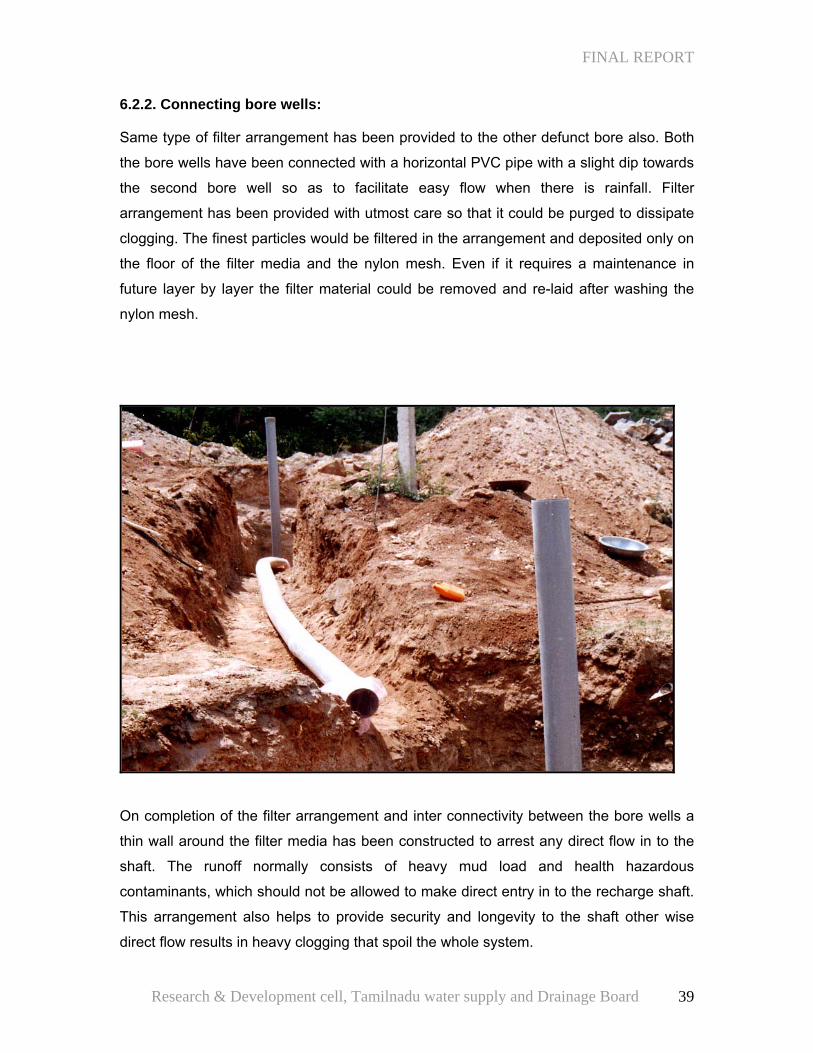
6.2.2. Connecting bore wells:
Same type of filter arrangement has been provided to the other defunct bore also. Both
the bore wells have been connected with a horizontal PVC pipe with a slight dip towards
the second bore well so as to facilitate easy flow when there is rainfall. Filter
arrangement has been provided with utmost care so that it could be purged to dissipate
clogging. The finest particles would be filtered in the arrangement and deposited only on
the floor of the filter media and the nylon mesh. Even if it requires a maintenance in
future layer by layer the filter material could be removed and re-laid after washing the
nylon mesh.
On completion of the filter arrangement and inter connectivity between the bore wells a
thin wall around the filter media has been constructed to arrest any direct flow in to the
shaft. The runoff normally consists of heavy mud load and health hazardous
contaminants, which should not be allowed to make direct entry in to the recharge shaft.
This arrangement also helps to provide security and longevity to the shaft other wise
direct flow results in heavy clogging that spoil the whole system.
Research & Development cell, Tamilnadu water supply and Drainage Board 39
FINAL REPORT
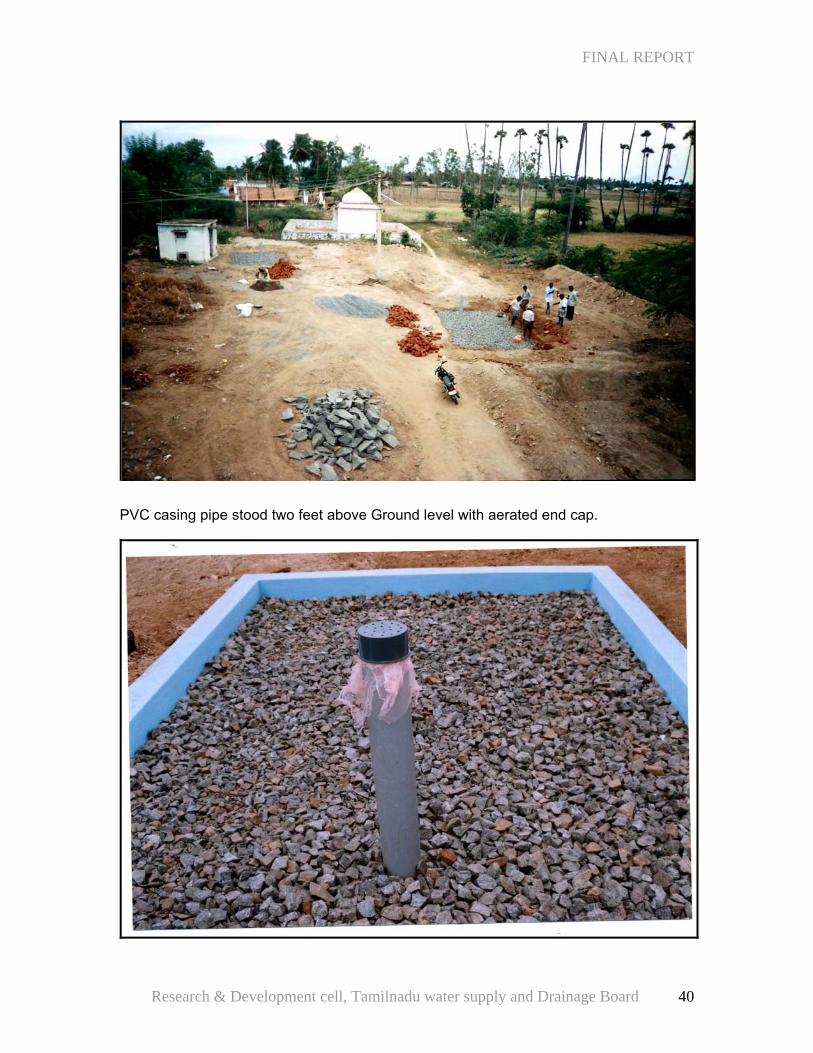
PVC casing pipe stood two feet above Ground level with aerated end cap.
Research & Development cell, Tamilnadu water supply and Drainage Board 40
FINAL REPORT
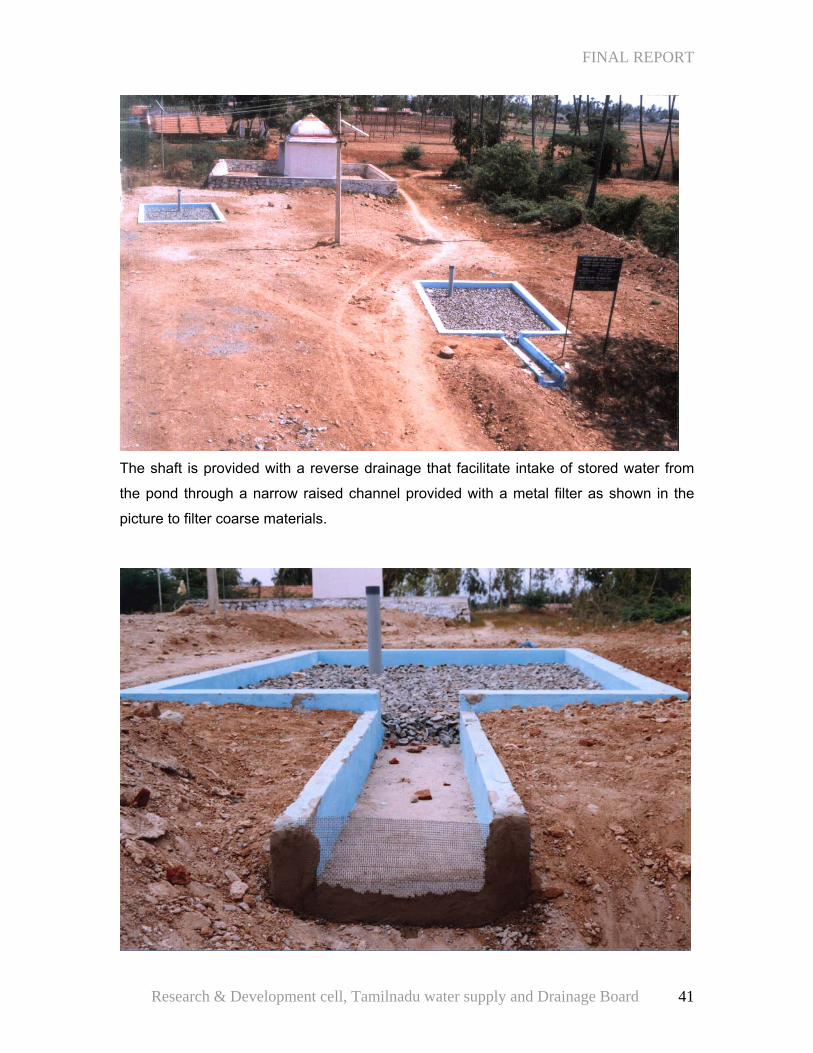
The shaft is provided with a reverse drainage that facilitate intake of stored water from
the pond through a narrow raised channel provided with a metal filter as shown in the
picture to filter coarse materials.
Research & Development cell, Tamilnadu water supply and Drainage Board 41
FINAL REPORT
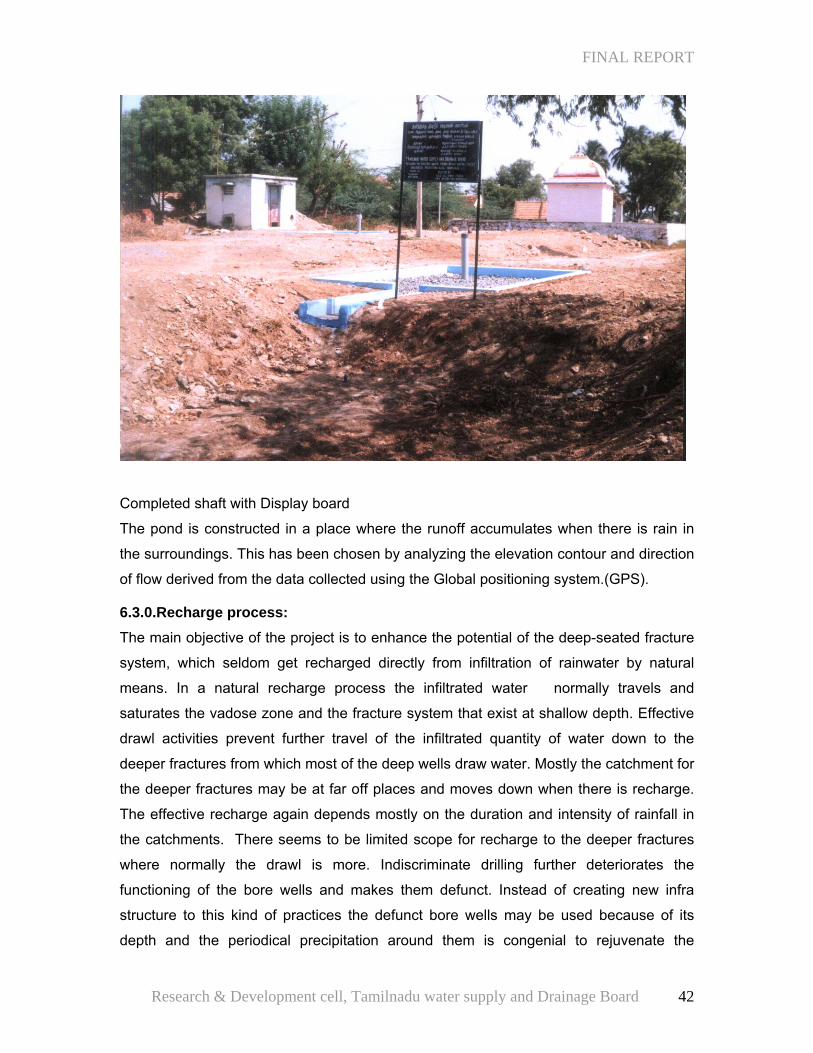
Completed shaft with Display board
The pond is constructed in a place where the runoff accumulates when there is rain in
the surroundings. This has been chosen by analyzing the elevation contour and direction
of flow derived from the data collected using the Global positioning system.(GPS).
6.3.0.Recharge process: The main objective of the project is to enhance the potential of the deep-seated fracture
system, which seldom get recharged directly from infiltration of rainwater by natural
means. In a natural recharge process the infiltrated water normally travels and
saturates the vadose zone and the fracture system that exist at shallow depth. Effective
drawl activities prevent further travel of the infiltrated quantity of water down to the
deeper fractures from which most of the deep wells draw water. Mostly the catchment for
the deeper fractures may be at far off places and moves down when there is recharge.
The effective recharge again depends mostly on the duration and intensity of rainfall in
the catchments. There seems to be limited scope for recharge to the deeper fractures
where normally the drawl is more. Indiscriminate drilling further deteriorates the
functioning of the bore wells and makes them defunct. Instead of creating new infra
structure to this kind of practices the defunct bore wells may be used because of its
depth and the periodical precipitation around them is congenial to rejuvenate the
Research & Development cell, Tamilnadu water supply and Drainage Board 42
FINAL REPORT
sources around. The program is implemented in such a way that even if there is
minimum rainfall the runoff takes place has been directed to flow towards the storage
pond situated in a optimal location with necessary slope to flow down without any
hindrance is collected at the pond. Enough provision with respect to depth is given for
collection and settling the mud load.
Once the tank get filled up {(25 m *14 m * 1.5 m)= 525m3} 20 % of its volume, the
floating water starts to flow through the metal filter in to the narrow channel protruding
out of the shaft. The depth of the storage pond facilitates for shedding of the mud load
from the stored water. The water free from or with less mud load flows through filter in to
the shaft. The coarse impurities get filtered and the rainwater enters in to the shaft
slowly. The 20 mm metal filter allows the water collected from the pond to the sand filter
through the nylon mesh. 20 % of the mud load that dissolved in the runoff get filtered
through the metal and sand filter and enters through the nylon mesh. The PVC duct
connected with the other bore well (below the first layer of filter material) collects some
quantity of water from the first sand filter there by reducing the velocity of water where
that sheds its load of impurities. The same type of process is active in the other bore well
(shaft) also. Thus the quantity of water that enters gets equally distributed when it
reaches the second filter arrangement. Continuous supply of stored water slowly gets
filtered and enters the bore well. The load exerts extra pressure in the static water level
and the cone of impression slowly pushes the filtered water first to the deeper fracture
system. Depending on the intensity of rainfall and quantity collected in the shaft diffuses
the impression limb results in raising the water level in conjunction with capillary action.
This automatically alters the natural conditions to increase infiltration to replenish the
fractures that mostly acts as conduits for ground water movements. Once the water
barren fractures are differentiated from the water bearing ones then these fractures can
be used for effective recharge, as it will be a best recharge media as there is no
evaporation loss and contamination.
Details of the storage pond
Capacity of the Storage Tank = 20m*7m* 1.5m =210 m3
0.5 m storage (dead storage) = 70 m3
Volume of the bore wells = 280m* 3.14*0.075^2= 5m3*2= 10m3
Quantity added for a filling = 60 % of 210 m3 = 126m3-70m3 = 56m3
Research & Development cell, Tamilnadu water supply and Drainage Board 43
FINAL REPORT
Area of the free catchment = 11.55 km2
Rainfall stabilized =11.55*0.804*0.18= 1.67mcm
Quantity added to Groundwater = 1.67*15% =0.25 MCM
Quantity of rainfall in Project area = 48169 * 0.804 * 0.18 = 6971 m3
Quantity added as infiltration = 6971 * 15% = 1045m3
Total quantity added = 250727 m3 + 1045 = 251773 m3
For normal rainfall 251773 m3 would be added through natural recharge and as well
as by the shaft provided.
The slow intake process influence the extension of impression limb in the shallow zone
(Weathered) which alters the formation by recharge. This allows not only the deeper
Zone recharge but also the shallow zone. Once the deeper zone saturated the rise in
Water level automatically enriches the shallow formation.
Research & Development cell, Tamilnadu water supply and Drainage Board 44

Chapter VII ASSESSMENT
FINAL REPORT
7.0.0. Assessment: Most ground water assessment studies involve correlation of water table fluctuations as
recorded from the wells with climatic elements such as rainfall, hydrologic influences
such as fluctuation of surface water bodies and application of irrigation water, artificial
recharge, and withdrawal from wells etc. Water table fluctuation is governed by the
specific yield of the material in the zone of water table fluctuation. It is inversely
proportional to specific yield. The water level does not commence immediately with the
onset of rainy season, as the initial rains have to satisfy the soil moisture deficit, which is
at maximum at the end of a dry spell.
7.1.0.Extent of the project area:
In order to find out the total roof, street, open area catchments the cadastral level map of
the habitation and its built up areas have been prepared. (Plate III) The area covered by
each category has been listed below.
Description Area in Sq.M.
House hold 28045.08 Open area 20590.06 Road and Streets 11576.92 Total 60212.06 80 % of the effective area 48169.65
The area of the settlement of Karukurichi village is – 48169.65 Sq.M (4.82 hectare)
which has been estimated from the field survey using GPS and with the help of GIS. For
estimating the rainfall stabilization, storage and recharge to the ground water this extent
has been taken in to consideration. The hydraulic gradient is gentle with in the habitation
and around the proposed recharge site where as the hydraulic gradient is steep in the
western side of the project area.
7.2.1.Rainfall- Season wise : The normal rainfall of the project area is 804 mm and the predominant season for
effective rainfall is North East monsoon (October to November.) During this period
recharge would be maximum since the Southwest monsoon facilitates the vadose zone
saturation. The normal rainfall for different seasons as well as the actual rainfall occurred
is as given below.
Research & Development cell, Tamilnadu water supply and Drainage Board 46
FINAL REPORT
Season Months Normal rainfall
South West June to September 342.3 mm
North East October to December 293.4 mm
Winter January to February 17.7 mm
Summer March to May 151.3 mm
Actual Rainfall (Normal for South west: 342.3 mm)
Year June July August September Total for
South west
in mm
2001 85 58.3 104.2 122.3 369.8
2002 46.3 8.6 30.6 56.9 142.4
2003 38.3 40.4 98.9 34.2 211.8
2004 6.8 24.7 11 130.3 172.8
2005 15.6 47.2 137.2 76.6 276.6
As far as South west monsoon is concerned only during 2001 it is above normal and rest
of the years it is below normal. For North east also except for the year 2005 the rain fall
is below normal.
Actual Rainfall (Normal for North East: 293.4 mm)
Year October November December Total for North
East in mm
2001 73.4 76.7 14.6 164.7
2002 145.8 28.9 5.8 180.5
2003 167.8 50.1 13.8 231.7
2004 127.3 119 0 246.3
2005 348 199.02 128 675.02
The rainfall for summer months is quite contrary to the monsoon months where in most
of the years the rainfall is above normal. This help to saturate the vadose zone partially
and the monsoon rain that occur immediately try to influence the recharge to ground
water.
Research & Development cell, Tamilnadu water supply and Drainage Board 47
FINAL REPORT
Actual Rainfall (Normal for Winter: 17.7 mm)
Year January February Total for Winter in mm
2002 0 2.6 2.6 2003 0 8.7 8.7 2004 3.50 0 3.5 2005 2.8 0 2.8 2006 0 15 15
Actual Rainfall (Normal for summer: 151.3 mm) Year March April May Total for
summer in mm
2002 13.4 2.1 60.7 66.2 2003 15.2 22.8 90.8 129.6 2004 0 51.8 229 280.8 2005 14.1 119.8 94.8 228.7 2006 27.2 37.5 89.8 154.5
7.2.1.Run off estimation: Many methods are available for estimating storm run off and SCS method is used here
to calculate the runoff in mm:
(I- 0.2S) 2
Q= ---------------
I + 0.8 S
Where
Q = direct surface runoff depth in mm
I = Storm rainfall in mm
S = maximum potential difference between Rainfall & runoff in mm starting at the time of
Storm begins.
‘S’ is calculated by the given formula where in N stands for the curve number based on
average value for annual floods for soil group ‘C’.
S= 25400
------------------- 254
N
Research & Development cell, Tamilnadu water supply and Drainage Board 48
FINAL REPORT
Soil group C Moderately high runoff potential composes of shallow soils containing clay and colloids
though less than the group D. this group has below average infiltration after pre
saturation.
Infiltration rate for the group is 1-4 mm /h
S= 25 400
------------------- 254
N
Catchment type area (A) SqM -S.Km soil group curve no (N) NA House hold 28045 (0.028045) C 92 258.01
Open area 20590 (0.020590) C 86 177.07
Roads & streets 11577 (0.011577) C 92 106.51
Total 0.060212 541.59
Weighted curve no = 541.59 / 6.02 = 90
S= (25 400/ 90 ) – 254 =28.2 mm
Based on the above formula the depth of storm run off is calculated as below for
individual monthly rainfall from 2001 to 2005..
7.2.2.Storm run off in mm :
Year June July August September October November December
2001 58.55 34.29 76.63 93.95 47.85 50.87 2.16 2002 24.01 0.28 11.72 33.07 116.68 10.51 0.00 2003 17.53 19.19 71.61 14.37 138.14 27.20 1.83 2004 0.05 7.69 0.86 101.66 98.77 90.78 1.41 2005 2.60 24.76 108.34 50.78 316.31 168.77 99.44
The quantity of run off for individual monthly rainfall occurrence is calculated and given
below. This is the quantity available for recharge during the given period for natural
recharge or for artificial recharge if stored in vantage point.
Research & Development cell, Tamilnadu water supply and Drainage Board 49
FINAL REPORT
7.2.3. Quantity of run off stabilized for the project area in m3:
Year June July August September October
November
December Total
2001 2820 1652 3691 4525 2305 2450 104 17548 2002 1156 14 565 1593 5621 506 0 9454 2003 844 924 3449 692 6654 1310 88 13963 2004 2 370 41 4897 4757 4373 68 14509 2005 125 1193 5219 2446 15236 8129 4790 37138 For effective recharge the annual rainfall need not be considered as such but seasonal
rainfall has to be considered even for designing the storage structure and the recharge
to ground water. 2500-3000 cum is stabilized during the monsoon seasons.
Year wise run off in m3
05000
10000150002000025000300003500040000
2001 2002 2003 2004 2005
Year
Rai
nfal
l in
m3
More than 500 m3 is stabilized almost all the months during the monsoon period during
2001 and 2005. Rest of the years this quantity stabilized in one or two months only.
September and October are the months that contributed more than 500 m3 almost all
the years.
Research & Development cell, Tamilnadu water supply and Drainage Board 50
FINAL REPORT
Estimation of Monsoon Runoff
02000400060008000
10000120001400016000
2001 2002 2003 2004 2005
Year
Run
off i
n m
3
JuneJulyAugustSeptemberOctoberNovemberDecember
August and November contributes that quantity but not during all the years. More than
1000 m3 stabilized during the month of October except the year 2001. This quantity is
very much helps the replenishment of ground water if properly harvested.
Estimation of monsoon runoff
02000400060008000
10000120001400016000
June
Ju
ly
Augus
t
Septem
ber
Octobe
r
Novem
ber
Decem
ber
Month
Run
off i
n m
3 20012002200320042005
Research & Development cell, Tamilnadu water supply and Drainage Board 51
FINAL REPORT
7.2.4. Annual runoff Runoff = runoff depth Q in m X area in M2
2001 (364.31/ 1000) * 48169 = 17548 m3
2002 (196.28 / 1000) * 48169 = 9454 m3
2003 (289.27 / 1000) * 48169 = 13963 m3
2004 (301.21 / 1000) * 48169 = 14509 m3
2005 (770.99 / 1000) * 48169 = 37138 m3
7.2.5.Season wise quantification of Runoff:
Season wise rainfall run off estimated for the given areas is as detailed below. The
maximum run off stabilized only during North East monsoon. Summer rains also
considerably good during these years. Water level rise have been compared with the
runoff from 2003 onwards and found to be coinciding with each other.
7.2.6. Month wise Run off in M3:
Year June July August SeptemberOctober November December
2003 844 924 3449 692 6654 1310 88
2004 2 370 41 4897 4757 4373 68
2005 125 1193 5219 2446 15236 8129 4790
Run off vs Rise in water level
y = 2423.1x + 1503.7
01000200030004000500060007000
0 0.2 0.4 0.6 0.8 1
Rise in level in m
Run
off
in m
3
Runoff required to raise 1m water level is 3927 m3 7.3.0. Water level rise in m :
Research & Development cell, Tamilnadu water supply and Drainage Board 52
FINAL REPORT
Year June July Aug Sep Oct Nov Dec OW 2003-04 16.09 0.02 0.24 0.21 0.40 0.79 0.03 2004-05 -0.25 -0.26 -0.29 -0.27 -0.25 -0.18 -0.24 2005-06 -0.01 -0.09 -0.17 -0.05 0.52 2.11 9.81 BW 2003-04 38.25 0.17 -0.08 -0.25 0.27 0.92 0.00 2004-05 -1.78 -1.90 -1.88 -1.88 -1.75 -1.43 -1.58 2005-06 -1.13 -1.38 -1.45 -1.25 -0.92 19.33 31.70
The run off quantity and the rise observed from the open wells for the monsoon months
during the year 2003 have been analyzed and it is found that at least 410 m3 runoff is
required to effect a rise in water level. (0.1 M) and 2879 m3 for 1m rise.
Run off vs Rise of waterlevel in Open wells during 2003
y = 2743.2x - 135.75
0.00
1000.00
2000.00
3000.00
4000.00
5000.00
6000.00
7000.00
0.00 0.20 0.40 0.60 0.80 1.00 1.20 1.40
Rise in water level in m
Run
off
in m
3
The thresh hold rainfall worked out to stabilize the quantity of 410 m3 is 27 mm to effect
a rise in water level. If there is 2879m3 runoff 1 m rise in water level will be effected and
the rainfall needed for this effect is 83 mm.
This has been correlated with the run off and the water level rise observed for the year
2005 where the thresh hold run off required to effect rise is 940 m3 since there is no rise
in water level observed in any of the month during the year 2004-05. It is as double as
the quantity that stabilized during the year 2003.
Research & Development cell, Tamilnadu water supply and Drainage Board 53
FINAL REPORT
Run off vs rise in waterlevel during 2005 in Open wells
y = 82.657x + 5118
0.002000.004000.006000.008000.00
10000.0012000.0014000.0016000.00
0.00 2.00 4.00 6.00 8.00 10.00 12.00
Rise of waterlevel in m
Run
off i
n m
3
The same type of analysis was made for the data available for the bore wells in the
project area for the year 2003. The quantity of run off required to effect rise in water level
in the bore wells is 1958 m3 and 2518 m3 for 1m rise for which the actual rainfall
required is 64.8 mm
Runoff vs Rise in borewells during 2003y = 629.18x + 1889.1
0.00
1000.00
2000.00
3000.00
4000.00
5000.00
6000.00
7000.00
-0.40 -0.20 0.00 0.20 0.40 0.60 0.80 1.00
Rise in water level in m
Run
off
in m
3
For the data pertaining to the year 2005 the threshold quantity required is 5002 m3 for
effecting rise (0.1m) and 5039 m3 for 1m rise in water level for which the rainfall
required to stabilize the run off is 128 mm. The reason for the higher quantity is
Research & Development cell, Tamilnadu water supply and Drainage Board 54
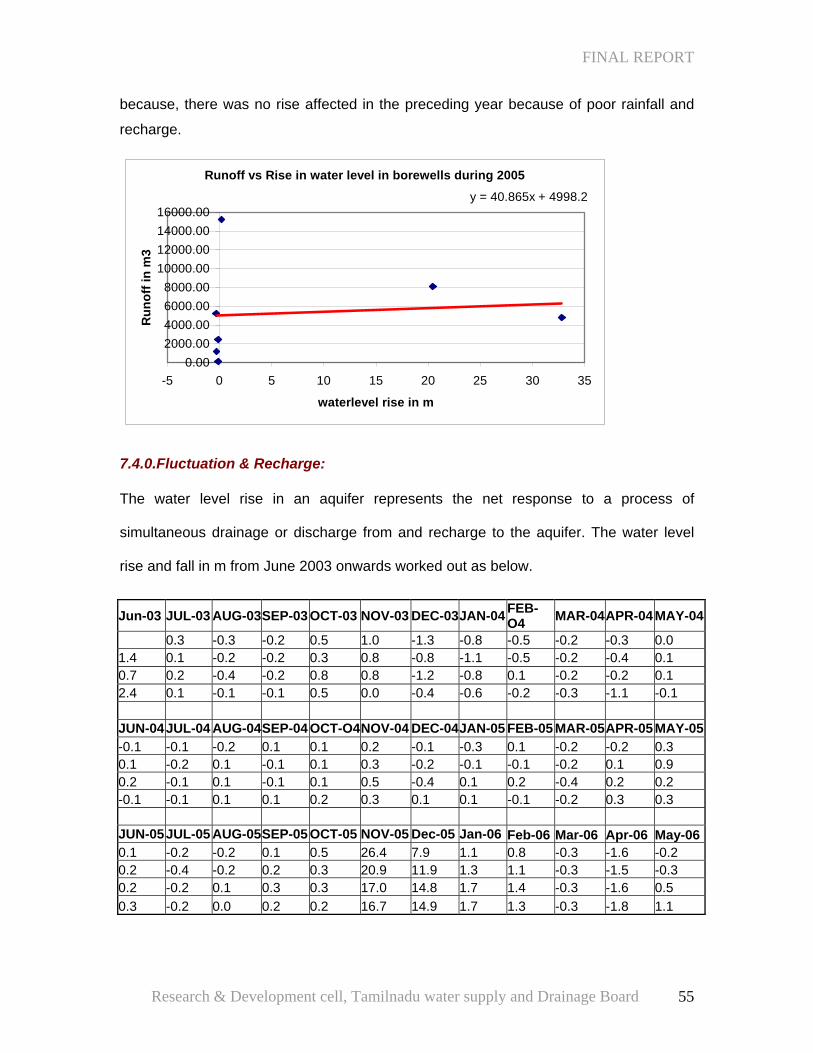
FINAL REPORT
because, there was no rise affected in the preceding year because of poor rainfall and
recharge.
Runoff vs Rise in water level in borewells during 2005
y = 40.865x + 4998.2
0.002000.004000.006000.008000.00
10000.0012000.0014000.0016000.00
-5 0 5 10 15 20 25 30 35
waterlevel rise in m
Run
off i
n m
3
7.4.0.Fluctuation & Recharge: The water level rise in an aquifer represents the net response to a process of
simultaneous drainage or discharge from and recharge to the aquifer. The water level
rise and fall in m from June 2003 onwards worked out as below.
Jun-03 JUL-03 AUG-03SEP-03 OCT-03 NOV-03 DEC-03JAN-04 FEB-O4 MAR-04 APR-04 MAY-04
0.3 -0.3 -0.2 0.5 1.0 -1.3 -0.8 -0.5 -0.2 -0.3 0.0 1.4 0.1 -0.2 -0.2 0.3 0.8 -0.8 -1.1 -0.5 -0.2 -0.4 0.1 0.7 0.2 -0.4 -0.2 0.8 0.8 -1.2 -0.8 0.1 -0.2 -0.2 0.1 2.4 0.1 -0.1 -0.1 0.5 0.0 -0.4 -0.6 -0.2 -0.3 -1.1 -0.1 JUN-04 JUL-04 AUG-04SEP-04 OCT-O4NOV-04 DEC-04JAN-05 FEB-05 MAR-05 APR-05 MAY-05-0.1 -0.1 -0.2 0.1 0.1 0.2 -0.1 -0.3 0.1 -0.2 -0.2 0.3 0.1 -0.2 0.1 -0.1 0.1 0.3 -0.2 -0.1 -0.1 -0.2 0.1 0.9 0.2 -0.1 0.1 -0.1 0.1 0.5 -0.4 0.1 0.2 -0.4 0.2 0.2 -0.1 -0.1 0.1 0.1 0.2 0.3 0.1 0.1 -0.1 -0.2 0.3 0.3 JUN-05 JUL-05 AUG-05SEP-05 OCT-05 NOV-05 Dec-05 Jan-06 Feb-06 Mar-06 Apr-06 May-060.1 -0.2 -0.2 0.1 0.5 26.4 7.9 1.1 0.8 -0.3 -1.6 -0.2 0.2 -0.4 -0.2 0.2 0.3 20.9 11.9 1.3 1.1 -0.3 -1.5 -0.3 0.2 -0.2 0.1 0.3 0.3 17.0 14.8 1.7 1.4 -0.3 -1.6 0.5 0.3 -0.2 0.0 0.2 0.2 16.7 14.9 1.7 1.3 -0.3 -1.8 1.1
Research & Development cell, Tamilnadu water supply and Drainage Board 55
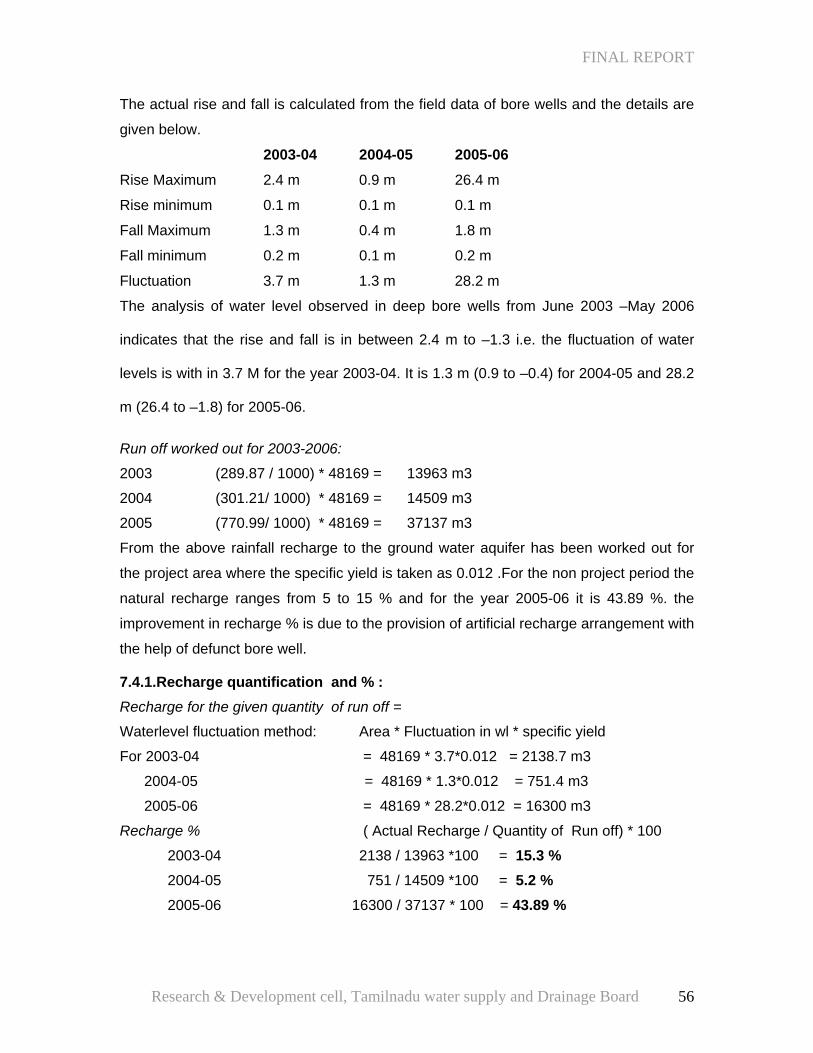
FINAL REPORT
The actual rise and fall is calculated from the field data of bore wells and the details are
given below.
2003-04 2004-05 2005-06 Rise Maximum 2.4 m 0.9 m 26.4 m
Rise minimum 0.1 m 0.1 m 0.1 m
Fall Maximum 1.3 m 0.4 m 1.8 m
Fall minimum 0.2 m 0.1 m 0.2 m
Fluctuation 3.7 m 1.3 m 28.2 m
The analysis of water level observed in deep bore wells from June 2003 –May 2006
indicates that the rise and fall is in between 2.4 m to –1.3 i.e. the fluctuation of water
levels is with in 3.7 M for the year 2003-04. It is 1.3 m (0.9 to –0.4) for 2004-05 and 28.2
m (26.4 to –1.8) for 2005-06.
Run off worked out for 2003-2006:
2003 (289.87 / 1000) * 48169 = 13963 m3
2004 (301.21/ 1000) * 48169 = 14509 m3
2005 (770.99/ 1000) * 48169 = 37137 m3
From the above rainfall recharge to the ground water aquifer has been worked out for
the project area where the specific yield is taken as 0.012 .For the non project period the
natural recharge ranges from 5 to 15 % and for the year 2005-06 it is 43.89 %. the
improvement in recharge % is due to the provision of artificial recharge arrangement with
the help of defunct bore well.
7.4.1.Recharge quantification and % : Recharge for the given quantity of run off =
Waterlevel fluctuation method: Area * Fluctuation in wl * specific yield
For 2003-04 = 48169 * 3.7*0.012 = 2138.7 m3
2004-05 = 48169 * 1.3*0.012 = 751.4 m3
2005-06 = 48169 * 28.2*0.012 = 16300 m3
Recharge % ( Actual Recharge / Quantity of Run off) * 100
2003-04 2138 / 13963 *100 = 15.3 %
2004-05 751 / 14509 *100 = 5.2 %
2005-06 16300 / 37137 * 100 = 43.89 %
Research & Development cell, Tamilnadu water supply and Drainage Board 56
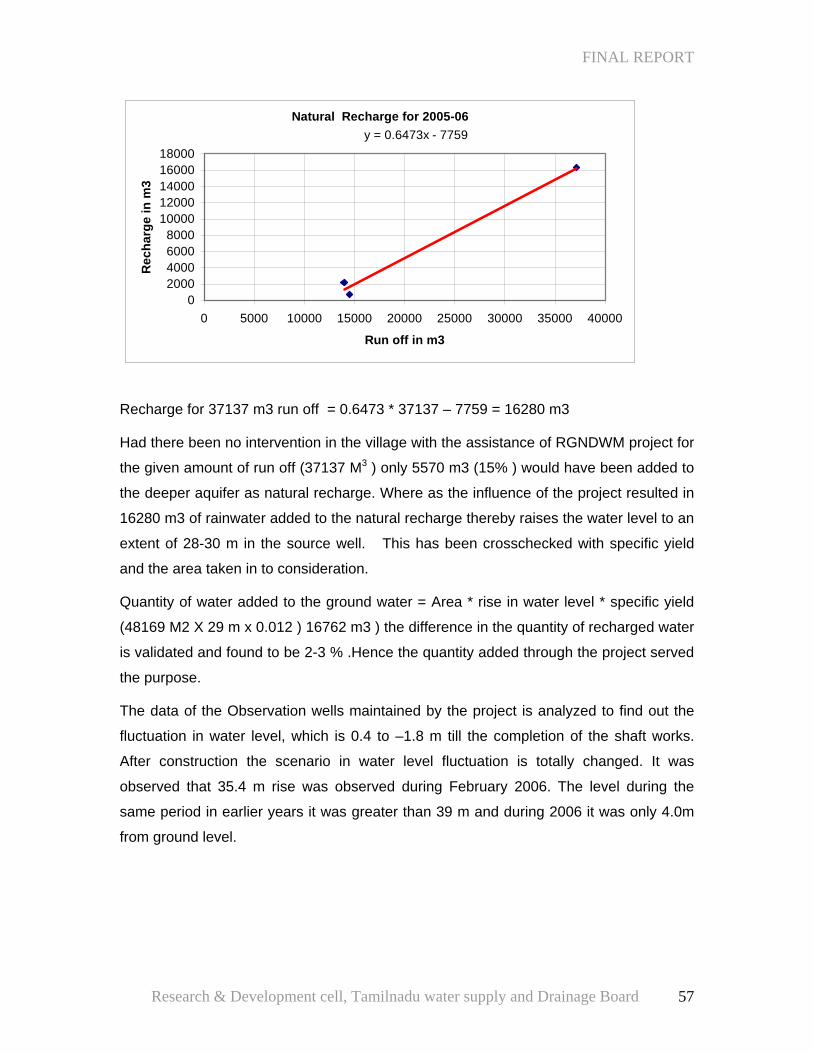
FINAL REPORT
Natural Recharge for 2005-06 y = 0.6473x - 7759
02000400060008000
1000012000140001600018000
0 5000 10000 15000 20000 25000 30000 35000 40000
Run off in m3
Rec
harg
e in
m3
Recharge for 37137 m3 run off = 0.6473 * 37137 – 7759 = 16280 m3
Had there been no intervention in the village with the assistance of RGNDWM project for
the given amount of run off (37137 M3 ) only 5570 m3 (15% ) would have been added to
the deeper aquifer as natural recharge. Where as the influence of the project resulted in
16280 m3 of rainwater added to the natural recharge thereby raises the water level to an
extent of 28-30 m in the source well. This has been crosschecked with specific yield
and the area taken in to consideration.
Quantity of water added to the ground water = Area * rise in water level * specific yield
(48169 M2 X 29 m x 0.012 ) 16762 m3 ) the difference in the quantity of recharged water
is validated and found to be 2-3 % .Hence the quantity added through the project served
the purpose.
The data of the Observation wells maintained by the project is analyzed to find out the
fluctuation in water level, which is 0.4 to –1.8 m till the completion of the shaft works.
After construction the scenario in water level fluctuation is totally changed. It was
observed that 35.4 m rise was observed during February 2006. The level during the
same period in earlier years it was greater than 39 m and during 2006 it was only 4.0m
from ground level.
Research & Development cell, Tamilnadu water supply and Drainage Board 57
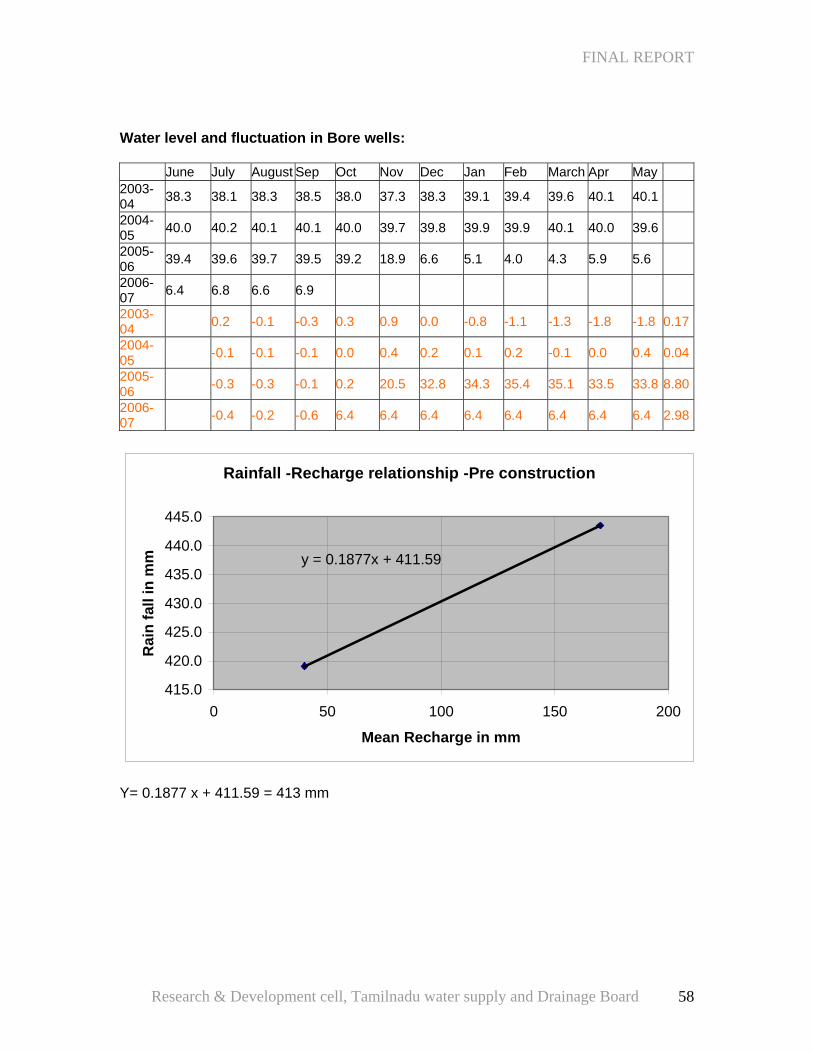
FINAL REPORT
Water level and fluctuation in Bore wells: June July August Sep Oct Nov Dec Jan Feb March Apr May 2003-04 38.3 38.1 38.3 38.5 38.0 37.3 38.3 39.1 39.4 39.6 40.1 40.1
2004-05 40.0 40.2 40.1 40.1 40.0 39.7 39.8 39.9 39.9 40.1 40.0 39.6
2005-06 39.4 39.6 39.7 39.5 39.2 18.9 6.6 5.1 4.0 4.3 5.9 5.6
2006-07 6.4 6.8 6.6 6.9
2003-04 0.2 -0.1 -0.3 0.3 0.9 0.0 -0.8 -1.1 -1.3 -1.8 -1.8 0.17
2004-05 -0.1 -0.1 -0.1 0.0 0.4 0.2 0.1 0.2 -0.1 0.0 0.4 0.04
2005-06 -0.3 -0.3 -0.1 0.2 20.5 32.8 34.3 35.4 35.1 33.5 33.8 8.80
2006-07 -0.4 -0.2 -0.6 6.4 6.4 6.4 6.4 6.4 6.4 6.4 6.4 2.98
Rainfall -Recharge relationship -Pre construction
y = 0.1877x + 411.59
415.0
420.0
425.0
430.0
435.0
440.0
445.0
0 50 100 150 200
Mean Recharge in mm
Rai
n fa
ll in
mm
Y= 0.1877 x + 411.59 = 413 mm
Research & Development cell, Tamilnadu water supply and Drainage Board 58
FINAL REPORT
Rainfall -Recharge relationship-Post construction
y = 0.1418x - 296.14
0.0
200.0
400.0
600.0
800.0
1000.0
0 2000 4000 6000 8000 10000
Mean Recharge in mm
Rai
nfal
l in
mm
Y= 0.1418 x + 296.14 = 297 mm The rise in water level and the seasonal rainfall is analyzed for the project and non-
project period. In the pre project period minimum rainfall required to effect rise in water
level in the deep bore wells is around 413 mm where as it is only 297 mm after the
construction of shaft in the project area.
The pre project water level variation is only due to natural recharge and the variation in
water level after the project is cumulative of natural recharge in the free catchment and
the water added to the deep fractures through the facility provided for artificial recharge.
70 % of normal rainfall is enough to effect raise in water level in the catchment (project
area)
Water level in open wells Year w-depth June July Aug Sep Oct Nov Dec Jan Feb Mar Apr May 2003-04 16.2 16.1 16.1 15.9 15.9 15.7 15.3 16.1 16.2 16.3 16.3 16.4 16.4 2004-05 16.2 16.3 16.4 16.4 16.4 16.3 16.3 16.3 16.3 16.4 16.4 16.3 16.3 2005-06 16.2 16.1 16.2 16.3 16.1 15.6 14.0 6.3 3.7 5.2 5.7 7.3 6.7
Research & Development cell, Tamilnadu water supply and Drainage Board 59
FINAL REPORT
Rainfall-Recharge relationship for 2003-2006 ( open wells )
y = 0.2656x + 268.25
0100200300400500600700800900
1000
0 500 1000 1500 2000 2500
Mean recharge in mm
Rai
nfal
l ( s
easo
nal )
in m
m
Y= 0.2656 x + 268.25 = 271 mm
Rainfall -Recharge relationship -pre construction period
y = 0.1525x + 403.85
415
420
425
430
435
440
445
0 50 100 150 200 250 300Mean recharge in mm
Rai
nfal
l in
mm
Y = 0.1525 x + 403.85 = 405 mm
Research & Development cell, Tamilnadu water supply and Drainage Board 60
FINAL REPORT
Rainfall - Recharge Relationship
y = 72.251x + 214.55
0.0
100.0
200.0
300.0
400.0
500.0
600.0
700.0
800.0
900.0
1000.0
0.00 1.00 2.00 3.00 4.00 5.00 6.00 7.00 8.00 9.00 10.00
Mean Recharge in m
Rai
nfal
l in
mm
221 mm rainfall is the threshold for effecting recharge
Y= 72.251 x + 214.55 = 221 mm where x = 0.1m
Year June July August SeptemberOctober November DecemberRf in mm 2001 85 58.3 104.2 122.3 73.4 76.7 14.6 2002 46.3 8.6 30.6 56.9 145.8 28.9 5.8 2003 38.3 40.4 98.9 34.2 167.8 50.1 13.8 2004 6.8 24.7 11 130.3 127.3 119 0 2005 15.6 47.2 137.2 76.6 348 199.02 128 Roff in mm2001 58.55 34.29 76.63 93.95 47.85 50.87 2.16 2002 24.01 0.28 11.72 33.07 116.68 10.51 0.00 2003 17.53 19.19 71.61 14.37 138.14 27.20 1.83 2004 0.05 7.69 0.86 101.66 98.77 90.78 1.41 2005 2.60 24.76 108.34 50.78 316.31 168.77 99.44 Roff in m3 2001 2820.46 1651.95 3691.36 4525.46 2304.75 2450.44 104.07 2002 1156.47 13.54 564.51 1592.86 5620.53 506.43 0.04 2003 844.24 924.41 3449.25 692.22 6653.95 1310.42 88.21 2004 2.21 370.27 41.24 4896.98 4757.49 4372.67 67.92 2005 125.22 1192.65 5218.52 2446.01 15236.15 8129.43 4790.02
Research & Development cell, Tamilnadu water supply and Drainage Board 61
FINAL REPORT
Rainfall during June to December
0100200300400500600700800900
1000
2001 2002 2003 2004 2005 2006
Year
rain
fall
in m
m
Rainfall vs Runoff during 2003y = 0.0228x + 17.783
020406080
100120140160180
0 1000 2000 3000 4000 5000 6000 7000
Runoff in m3
Rai
nfal
l in
mm
For effecting 1000 m3 runoff the rainfall required is 40.6 mm, 32.8mm, 42.5mm
respectively during 2003,2004 and 2005. Though the rainfall is low during 2004
Research & Development cell, Tamilnadu water supply and Drainage Board 62
FINAL REPORT
compared with the preceding year, which has been contributed for holding the soil
moisture. However the effect of low rainfall felt during the year 2005 since for the same
amount of runoff at least 42.5 mm rainfall is needed which is comparatively more than
the year 2003 and 2004.
The rise observed in bore wells has been analyzed with ref to the runoff stabilized during
the year 2003 to 2005 .For effecting 0.1 m rise in water level in the bore well the
requirement is 1952 m3 runoff for the year 2003 and its 3032 m3 and 5002 m3 during
2004 and 2005 respectively
As the rise in water level is the result of saturated soil moisture, evaporation and other
losses the earlier years rainfall contributed for succeeding years. The meager rainfall
during 2004 reflected in the runoff for raising the water level which comparatively higher
than 2003 and 2004.
Rainfall vs Runoff during 2004
y = 0.0253x + 7.4834
0
20
40
60
80
100
120
140
0 1000 2000 3000 4000 5000 6000
Runoff in m3
Rai
nfal
l in
mm
Research & Development cell, Tamilnadu water supply and Drainage Board 63
FINAL REPORT
Rainfall vs Run off during 2005
y = 0.0217x + 20.81
050
100150200250300350400
0 5000 10000 15000 20000
Runoff in m3
Rai
nfal
l in
mm
Runoff vs Rise in borewells during 2003y = 629.18x + 1889.1
0
1000
2000
3000
4000
5000
6000
7000
-0.40 -0.20 0.00 0.20 0.40 0.60 0.80 1.00
Rise in water level in m
Run
off
in m
3
Y = 629.18 x + 1889.1 = 1952 m3 ( for 0.1m rise )
Research & Development cell, Tamilnadu water supply and Drainage Board 64
FINAL REPORT
Runoff vs Rise in water levels during 2004y = 10720x + 1960.1
0
1000
2000
3000
4000
5000
6000
-0.2 -0.1 0 0.1 0.2 0.3 0.4
water llevel rise in m
Run
off
in m
3
Y = 10720 *x + 1960.1 = 3032m3 ( X = 0.1m)
Runoff vs Rise in water level in borewells during 2005y = 40.865x + 4998.2
02000400060008000
10000120001400016000
-5 0 5 10 15 20 25 30 35
waterlevel rise in m
Run
off i
n m
3
Y = 40.865 x + 4998.2 = 5002m3 ( for 0.1 m rise )
Research & Development cell, Tamilnadu water supply and Drainage Board 65

Chapter VIII ANALYSIS
FINAL REPORT
8.0.0.Data Analysis: When rain falls on dry ground, some of the water soaks in, or infiltrates the soil. Some
water that infiltrates will remain in the shallow soil layer, where it will gradually move
down through the soil. Some of the water may infiltrate much deeper, recharging ground-
water aquifers. Water may travel long distances or remain in storage for long periods
before returning to the surface. The amount of water that will soak in over time depends
on several parameters. Soils absorbing less water results in more runoff overland into
streams. soil already saturated from previous rainfall can't absorb much more ... thus
more rainfall will become surface runoff. Some land covers have a great impact on
infiltration and rainfall runoff. The root systems of plants absorb water from the
surrounding soil in various amounts. Most of this water moves through the plant and
escapes into the atmosphere through the leaves. Transpiration is controlled by the same
factors as evaporation, and by the characteristics and density of the vegetation.
Vegetation slows runoff and allows water to seep into the ground. Village ponds store
water and increase the amount of water that evaporates and infiltrates.
The water level does not commence immediately with the onset of rainy season, as the
initial rains have to satisfy the soil moisture deficit, which is at maximum at the end of a
dry spell. Rainfall amounts in excess of the threshold value contribute to an increase in
groundwater storage.
8.1.0. Rainfall: Monthly rainfall data for 2001-2006 is shown in Table 1 for finding out the effective
dependable rainfall in this area. May, October and November experienced high rainfall
compared with other months. The cumulative rainfall for the period indicates January
and February are the lean months in which less than 20 mm rainfall occurred for all six
years. August, October November and May are the months where more than 400 mm
(cumulative) rainfall occurred in these years. Individually 350 mm rainfall recorded during
October 2005 and 251mm during November 2005. 223mm was recorded during May
2003. April and May experienced considerable rainfall indicative of the revival of
monsoon.
Altogether 26 % of the total rainfall occurred in the month of October, which follows 17%
in May and 15 % in November. August and September experienced 11 & 10 %
respectively and all other months contribute very less %. Highest contribution is derived
in the month of October, which amounts to 32%. During the year 2000 more than 335
Research & Development cell, Tamilnadu water supply and Drainage Board 66
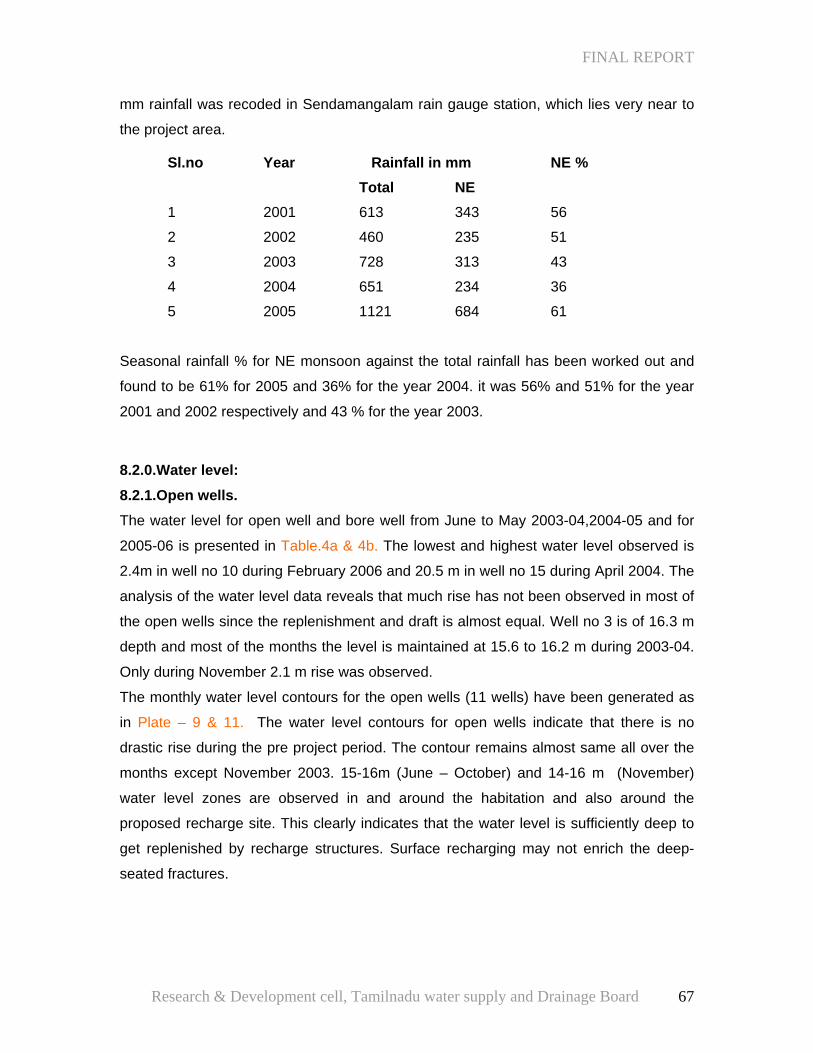
FINAL REPORT
mm rainfall was recoded in Sendamangalam rain gauge station, which lies very near to
the project area.
Sl.no Year Rainfall in mm NE % Total NE
1 2001 613 343 56
2 2002 460 235 51
3 2003 728 313 43
4 2004 651 234 36
5 2005 1121 684 61
Seasonal rainfall % for NE monsoon against the total rainfall has been worked out and
found to be 61% for 2005 and 36% for the year 2004. it was 56% and 51% for the year
2001 and 2002 respectively and 43 % for the year 2003.
8.2.0.Water level: 8.2.1.Open wells. The water level for open well and bore well from June to May 2003-04,2004-05 and for
2005-06 is presented in Table.4a & 4b. The lowest and highest water level observed is
2.4m in well no 10 during February 2006 and 20.5 m in well no 15 during April 2004. The
analysis of the water level data reveals that much rise has not been observed in most of
the open wells since the replenishment and draft is almost equal. Well no 3 is of 16.3 m
depth and most of the months the level is maintained at 15.6 to 16.2 m during 2003-04.
Only during November 2.1 m rise was observed.
The monthly water level contours for the open wells (11 wells) have been generated as
in Plate – 9 & 11. The water level contours for open wells indicate that there is no
drastic rise during the pre project period. The contour remains almost same all over the
months except November 2003. 15-16m (June – October) and 14-16 m (November)
water level zones are observed in and around the habitation and also around the
proposed recharge site. This clearly indicates that the water level is sufficiently deep to
get replenished by recharge structures. Surface recharging may not enrich the deep-
seated fractures.
Research & Development cell, Tamilnadu water supply and Drainage Board 67
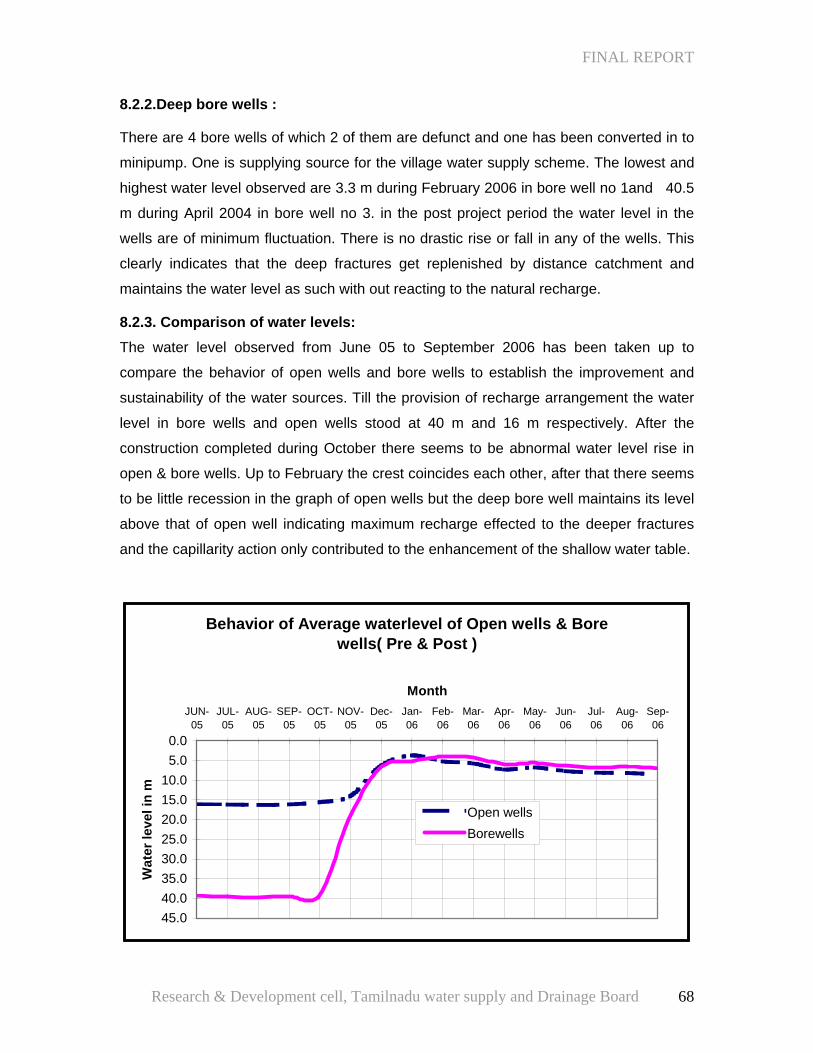
FINAL REPORT
8.2.2.Deep bore wells :
There are 4 bore wells of which 2 of them are defunct and one has been converted in to
minipump. One is supplying source for the village water supply scheme. The lowest and
highest water level observed are 3.3 m during February 2006 in bore well no 1and 40.5
m during April 2004 in bore well no 3. in the post project period the water level in the
wells are of minimum fluctuation. There is no drastic rise or fall in any of the wells. This
clearly indicates that the deep fractures get replenished by distance catchment and
maintains the water level as such with out reacting to the natural recharge.
8.2.3. Comparison of water levels: The water level observed from June 05 to September 2006 has been taken up to
compare the behavior of open wells and bore wells to establish the improvement and
sustainability of the water sources. Till the provision of recharge arrangement the water
level in bore wells and open wells stood at 40 m and 16 m respectively. After the
construction completed during October there seems to be abnormal water level rise in
open & bore wells. Up to February the crest coincides each other, after that there seems
to be little recession in the graph of open wells but the deep bore well maintains its level
above that of open well indicating maximum recharge effected to the deeper fractures
and the capillarity action only contributed to the enhancement of the shallow water table.
Behavior of Average waterlevel of Open wells & Bore wells( Pre & Post )
0.05.0
10.015.020.025.030.035.040.045.0
JUN-05
JUL-05
AUG-05
SEP-05
OCT-05
NOV-05
Dec-05
Jan-06
Feb-06
Mar-06
Apr-06
May-06
Jun-06
Jul-06
Aug-06
Sep-06
Month
Wat
er le
vel i
n m
Open wellsBorewells
Research & Development cell, Tamilnadu water supply and Drainage Board 68
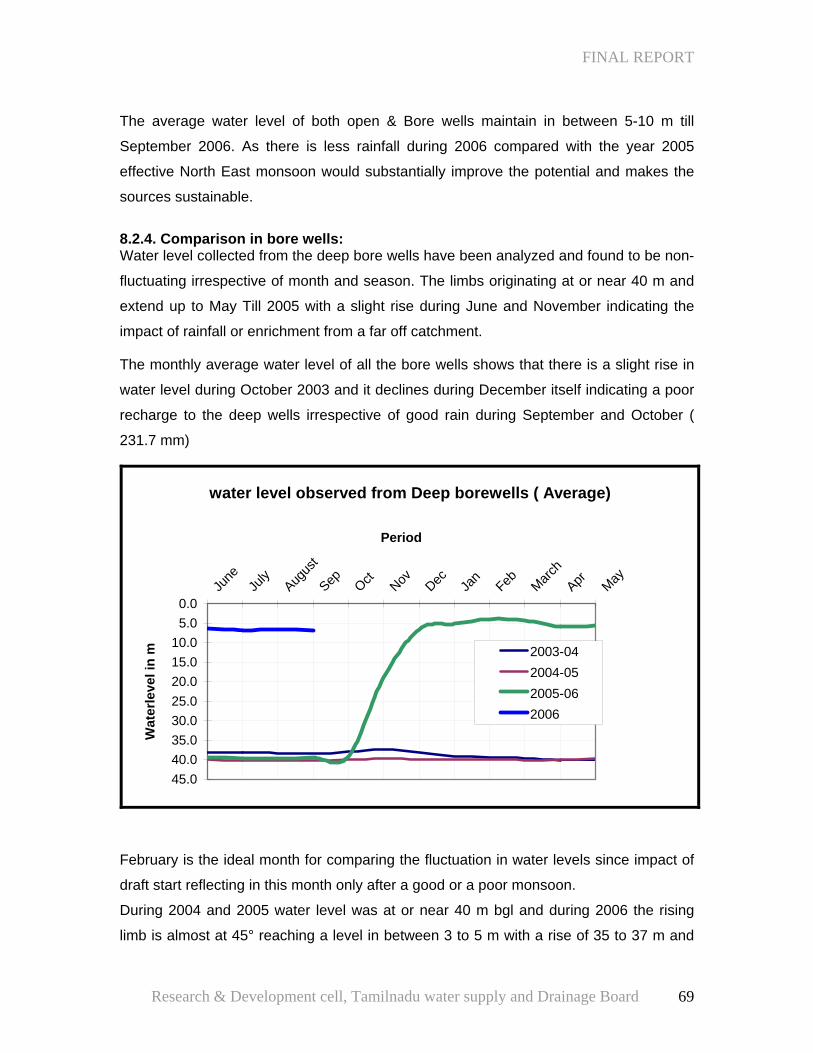
FINAL REPORT
The average water level of both open & Bore wells maintain in between 5-10 m till
September 2006. As there is less rainfall during 2006 compared with the year 2005
effective North East monsoon would substantially improve the potential and makes the
sources sustainable. 8.2.4. Comparison in bore wells: Water level collected from the deep bore wells have been analyzed and found to be non-
fluctuating irrespective of month and season. The limbs originating at or near 40 m and
extend up to May Till 2005 with a slight rise during June and November indicating the
impact of rainfall or enrichment from a far off catchment.
The monthly average water level of all the bore wells shows that there is a slight rise in
water level during October 2003 and it declines during December itself indicating a poor
recharge to the deep wells irrespective of good rain during September and October (
231.7 mm)
water level observed from Deep borewells ( Average)
0.05.0
10.015.020.025.030.035.040.045.0
June
July
Augus
t
Sep Oct Nov Dec Jan
Feb March
Apr May
Period
Wat
erle
vel i
n m 2003-04
2004-052005-062006
February is the ideal month for comparing the fluctuation in water levels since impact of
draft start reflecting in this month only after a good or a poor monsoon.
During 2004 and 2005 water level was at or near 40 m bgl and during 2006 the rising
limb is almost at 45° reaching a level in between 3 to 5 m with a rise of 35 to 37 m and
Research & Development cell, Tamilnadu water supply and Drainage Board 69
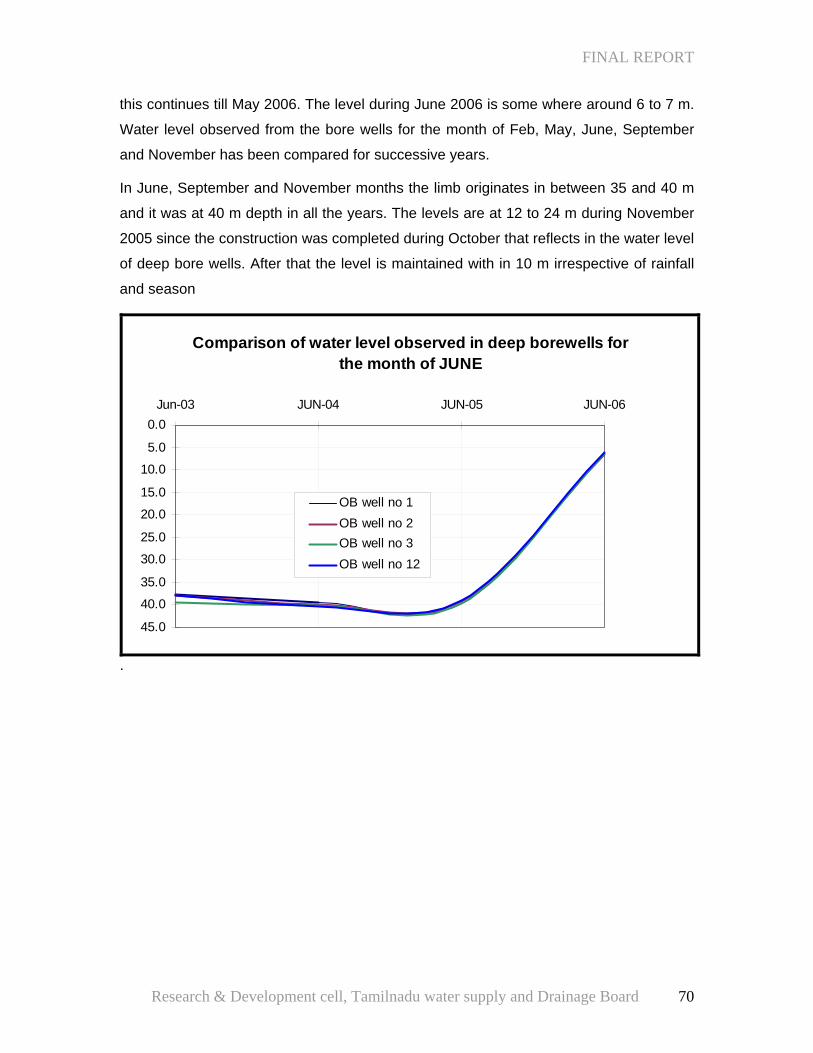
FINAL REPORT
this continues till May 2006. The level during June 2006 is some where around 6 to 7 m.
Water level observed from the bore wells for the month of Feb, May, June, September
and November has been compared for successive years.
In June, September and November months the limb originates in between 35 and 40 m
and it was at 40 m depth in all the years. The levels are at 12 to 24 m during November
2005 since the construction was completed during October that reflects in the water level
of deep bore wells. After that the level is maintained with in 10 m irrespective of rainfall
and season
Comparison of water level observed in deep borewells for the month of JUNE
0.0
5.0
10.0
15.0
20.0
25.0
30.0
35.0
40.0
45.0
Jun-03 JUN-04 JUN-05 JUN-06
OB well no 1OB well no 2OB well no 3OB well no 12
.
Research & Development cell, Tamilnadu water supply and Drainage Board 70
FINAL REPORT
Comparison of water level observed from Deep borewells for the month of September
0.05.0
10.015.020.025.030.035.040.045.0
SEP-03 SEP-04 SEP-05 Sep-06
YearW
ater
leve
l in
m OB well no 1OB well no 2OB well no 3OB well no 12
During 2004-05 even the slight fluctuation is not repeated. The situation is same till the
completion of the recharge arrangement in October. Abnormal rise in water level
observed from October 2005 onwards and it maintained till September 2006. The water
level during September 2006 is at 6 m and subsequent rainfall may further improve the
water level to the level of Feb. 2006
Comparison of water level observed from deep borewells for the month of November
0.05.0
10.015.020.025.030.035.040.045.0
NOV-03 NOV-04 NOV-05
Year
Wat
er le
vel i
n m OB well no 1
OB well no 2OB well no 3OB well no 12
Research & Development cell, Tamilnadu water supply and Drainage Board 71
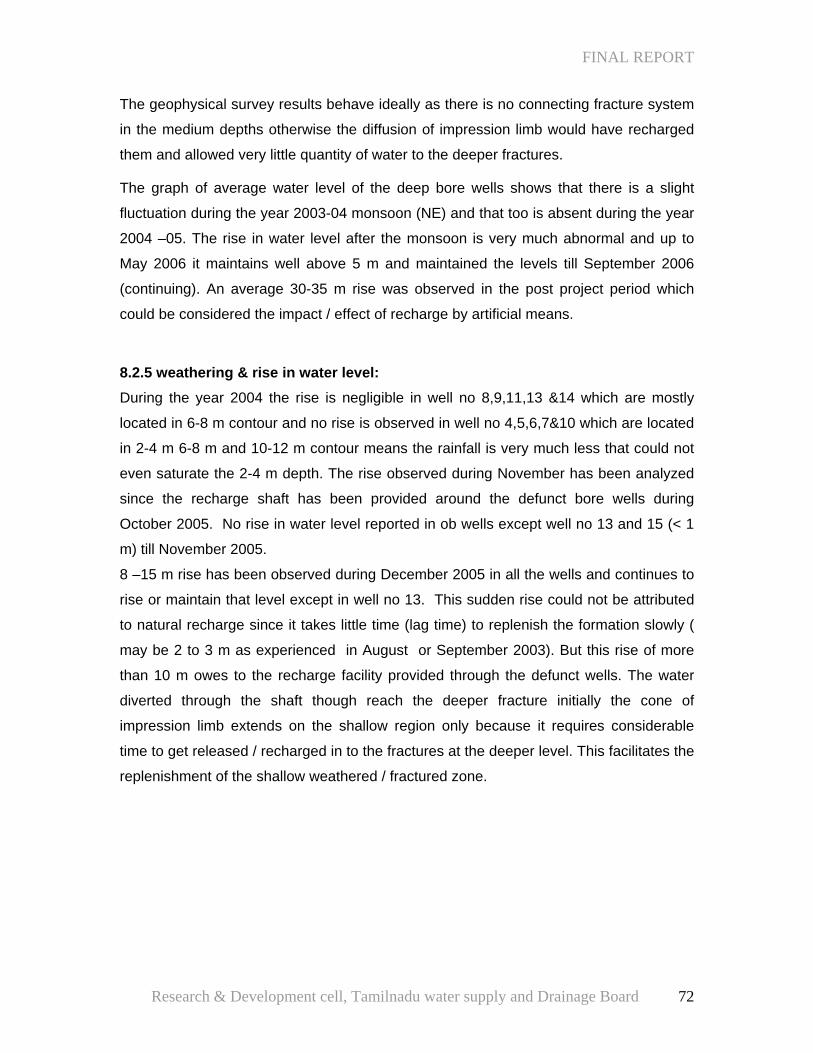
FINAL REPORT
The geophysical survey results behave ideally as there is no connecting fracture system
in the medium depths otherwise the diffusion of impression limb would have recharged
them and allowed very little quantity of water to the deeper fractures.
The graph of average water level of the deep bore wells shows that there is a slight
fluctuation during the year 2003-04 monsoon (NE) and that too is absent during the year
2004 –05. The rise in water level after the monsoon is very much abnormal and up to
May 2006 it maintains well above 5 m and maintained the levels till September 2006
(continuing). An average 30-35 m rise was observed in the post project period which
could be considered the impact / effect of recharge by artificial means.
8.2.5 weathering & rise in water level: During the year 2004 the rise is negligible in well no 8,9,11,13 &14 which are mostly
located in 6-8 m contour and no rise is observed in well no 4,5,6,7&10 which are located
in 2-4 m 6-8 m and 10-12 m contour means the rainfall is very much less that could not
even saturate the 2-4 m depth. The rise observed during November has been analyzed
since the recharge shaft has been provided around the defunct bore wells during
October 2005. No rise in water level reported in ob wells except well no 13 and 15 (< 1
m) till November 2005.
8 –15 m rise has been observed during December 2005 in all the wells and continues to
rise or maintain that level except in well no 13. This sudden rise could not be attributed
to natural recharge since it takes little time (lag time) to replenish the formation slowly (
may be 2 to 3 m as experienced in August or September 2003). But this rise of more
than 10 m owes to the recharge facility provided through the defunct wells. The water
diverted through the shaft though reach the deeper fracture initially the cone of
impression limb extends on the shallow region only because it requires considerable
time to get released / recharged in to the fractures at the deeper level. This facilitates the
replenishment of the shallow weathered / fractured zone.
Research & Development cell, Tamilnadu water supply and Drainage Board 72
FINAL REPORT
Rise of water level in open wells
-5
0
5
10
15
20
25
JUN-05 JUL-05 AUG-05 SEP-05 OCT-05 NOV-05 Dec-05 Jan-06
Month
Ris
e in
m
well 4well 5well 6well 7well 8well 9well 10well 11well 13well 14well 15
The diffusion of the impression limb and the natural recharge due to infiltration optimally
saturates the weathered zone help to maintain the water level well with in 6- 11 m in
spite of known draft till the revival of monsoon ( in the month of May ). The almost
horizontal line graph confirms the replenishment that holds the drafts and recharge in
tandem. However the behavior of well no 13 is quite contradictory to other wells since
there may be absence hydraulic connectivity due to subsurface anomaly that separate it
from the other wells. Except this well other wells in this particular contour behaves with
respect recharge and related with weathering thickness.
The monsoon rainfall accounted to 400 to 900 mm except for the year 2002.Less than
300 mm rainfall recorded for the particular year. There seems to be well-defined impact
of the rainfall over the water level where less than 200mm rainfall does not make any
impact on the water level in deep bore wells (observation well). 5 to 6 m rise has been
observed during the year 2004 when the rainfall crosses 300mm. However 200mm
rainfall seldom makes any impact on the water level during may 2005. The pre monsoon
water level touches 35 m bgl during May 2003.Below normal rainfall during the year
2000-2002 felt in the succeeding years where the water level for both seasons went
down below 20m marks for pre monsoon and below 15 m even during post monsoon
period.
Research & Development cell, Tamilnadu water supply and Drainage Board 73
FINAL REPORT
Rise of water level in open wells
0
2
4
6
8
10
12
14
16
18
26.6.06 27.7.06 10.8.06 27.9.06
Month
Ris
e in
m
well 4well 5well 6well 7well 8well 9well 10well 11well 13well 14well 15
700mm rainfall results in 12.5 m and 15.5m water level in post and pre monsoon with a
minimum fluctuation of 3m and 2m. However the rainfall contains the depletion of water
level in the succeeding years. Very less rainfall in 2002-03 is unable to contain the
depletion of water level with the natural recharge condition. The data pertaining to 2003
shows 559mm rainfall resulted in a change of 3 m and 10m for both seasons with a
fluctuation (rise) of 7m and 10m.The year 2005 experienced 52% excess rainfall from
the normal and the surface flow is properly impounded at vantage points with shaft
arrangement resulted in 24m and 15m difference with arise mismatching with natural
recharge condition. The exorbitant rise in water level in the said ob well may be due to
the provision of facility that recharged the deeper fracture system which extends up to /
beyond the location of the observation well taken for the analysis. the intervention
helped to maintain the potential and the levels in higher level other wise the condition
prevailed in 2000 to 2003 would have been revived.
Research & Development cell, Tamilnadu water supply and Drainage Board 74
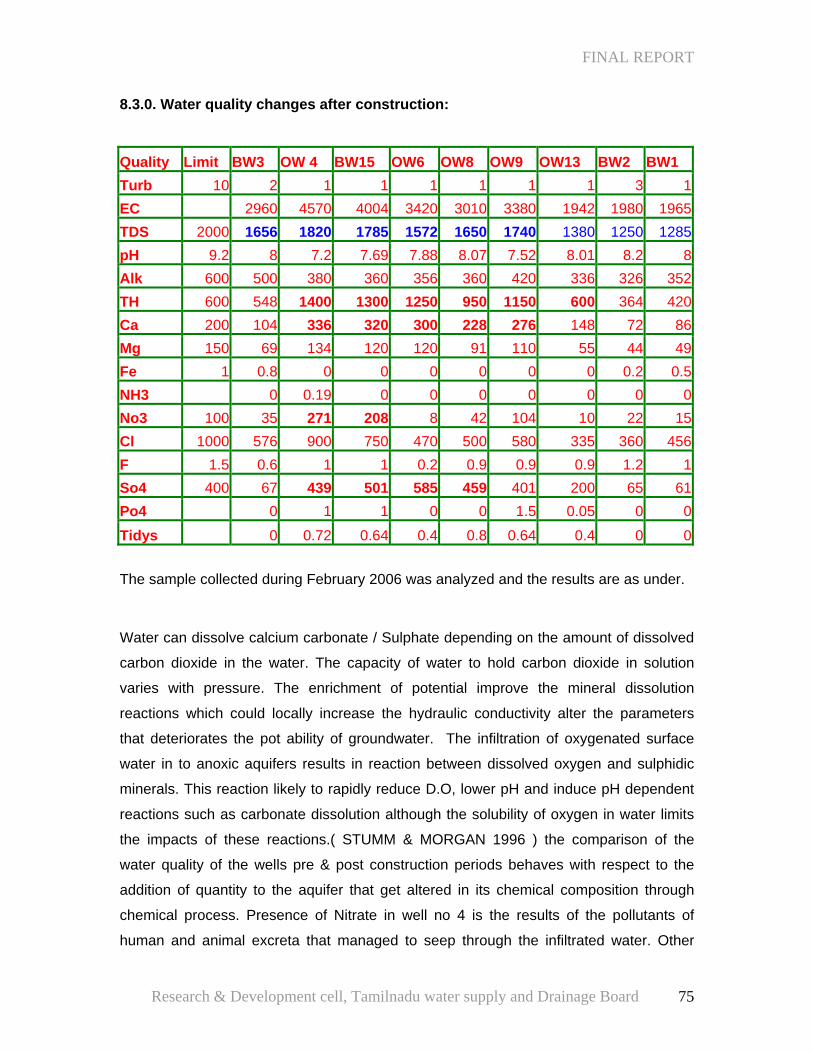
FINAL REPORT
8.3.0. Water quality changes after construction:
Quality Limit BW3 OW 4 BW15 OW6 OW8 OW9 OW13 BW2 BW1 Turb 10 2 1 1 1 1 1 1 3 1EC 2960 4570 4004 3420 3010 3380 1942 1980 1965TDS 2000 1656 1820 1785 1572 1650 1740 1380 1250 1285pH 9.2 8 7.2 7.69 7.88 8.07 7.52 8.01 8.2 8Alk 600 500 380 360 356 360 420 336 326 352TH 600 548 1400 1300 1250 950 1150 600 364 420Ca 200 104 336 320 300 228 276 148 72 86Mg 150 69 134 120 120 91 110 55 44 49Fe 1 0.8 0 0 0 0 0 0 0.2 0.5NH3 0 0.19 0 0 0 0 0 0 0No3 100 35 271 208 8 42 104 10 22 15Cl 1000 576 900 750 470 500 580 335 360 456F 1.5 0.6 1 1 0.2 0.9 0.9 0.9 1.2 1So4 400 67 439 501 585 459 401 200 65 61Po4 0 1 1 0 0 1.5 0.05 0 0
Tidys 0 0.72 0.64 0.4 0.8 0.64 0.4 0 0
The sample collected during February 2006 was analyzed and the results are as under.
Water can dissolve calcium carbonate / Sulphate depending on the amount of dissolved
carbon dioxide in the water. The capacity of water to hold carbon dioxide in solution
varies with pressure. The enrichment of potential improve the mineral dissolution
reactions which could locally increase the hydraulic conductivity alter the parameters
that deteriorates the pot ability of groundwater. The infiltration of oxygenated surface
water in to anoxic aquifers results in reaction between dissolved oxygen and sulphidic
minerals. This reaction likely to rapidly reduce D.O, lower pH and induce pH dependent
reactions such as carbonate dissolution although the solubility of oxygen in water limits
the impacts of these reactions.( STUMM & MORGAN 1996 ) the comparison of the
water quality of the wells pre & post construction periods behaves with respect to the
addition of quantity to the aquifer that get altered in its chemical composition through
chemical process. Presence of Nitrate in well no 4 is the results of the pollutants of
human and animal excreta that managed to seep through the infiltrated water. Other
Research & Development cell, Tamilnadu water supply and Drainage Board 75
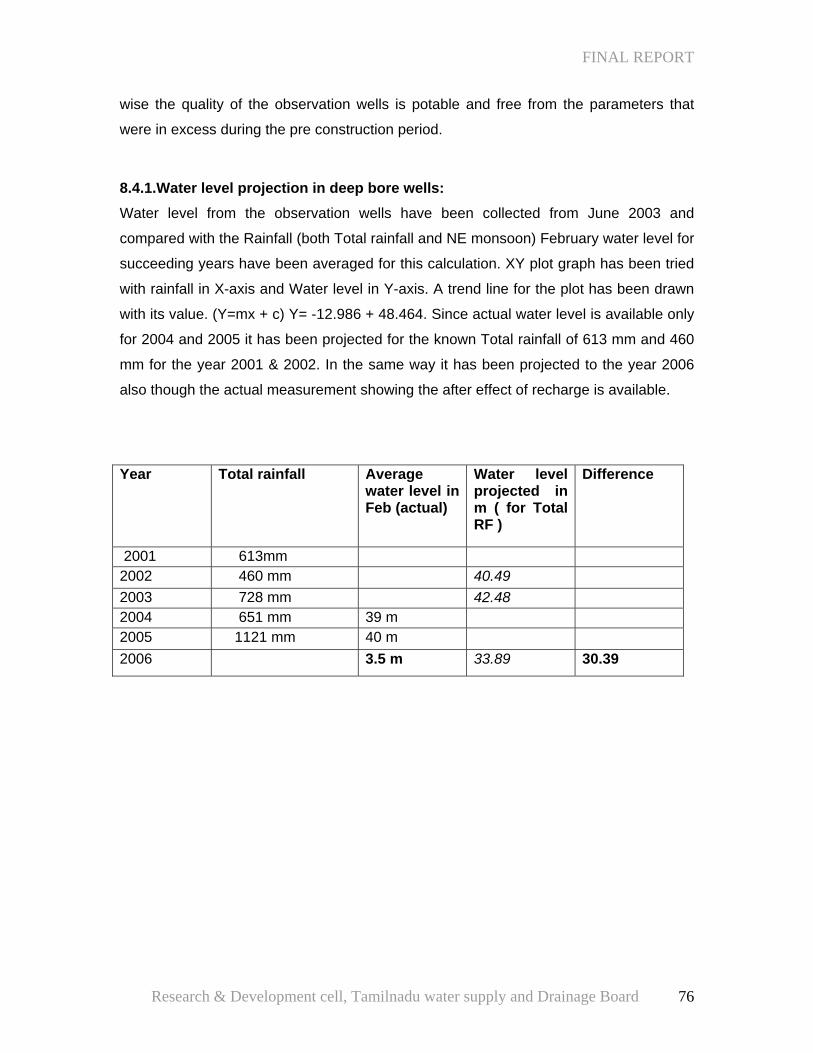
FINAL REPORT
wise the quality of the observation wells is potable and free from the parameters that
were in excess during the pre construction period.
8.4.1.Water level projection in deep bore wells: Water level from the observation wells have been collected from June 2003 and
compared with the Rainfall (both Total rainfall and NE monsoon) February water level for
succeeding years have been averaged for this calculation. XY plot graph has been tried
with rainfall in X-axis and Water level in Y-axis. A trend line for the plot has been drawn
with its value. (Y=mx + c) Y= -12.986 + 48.464. Since actual water level is available only
for 2004 and 2005 it has been projected for the known Total rainfall of 613 mm and 460
mm for the year 2001 & 2002. In the same way it has been projected to the year 2006
also though the actual measurement showing the after effect of recharge is available.
Year Total rainfall Average
water level in Feb (actual)
Water level projected in m ( for Total RF )
Difference
2001 613mm 2002 460 mm 40.49 2003 728 mm 42.48 2004 651 mm 39 m 2005 1121 mm 40 m 2006 3.5 m 33.89 30.39
Research & Development cell, Tamilnadu water supply and Drainage Board 76
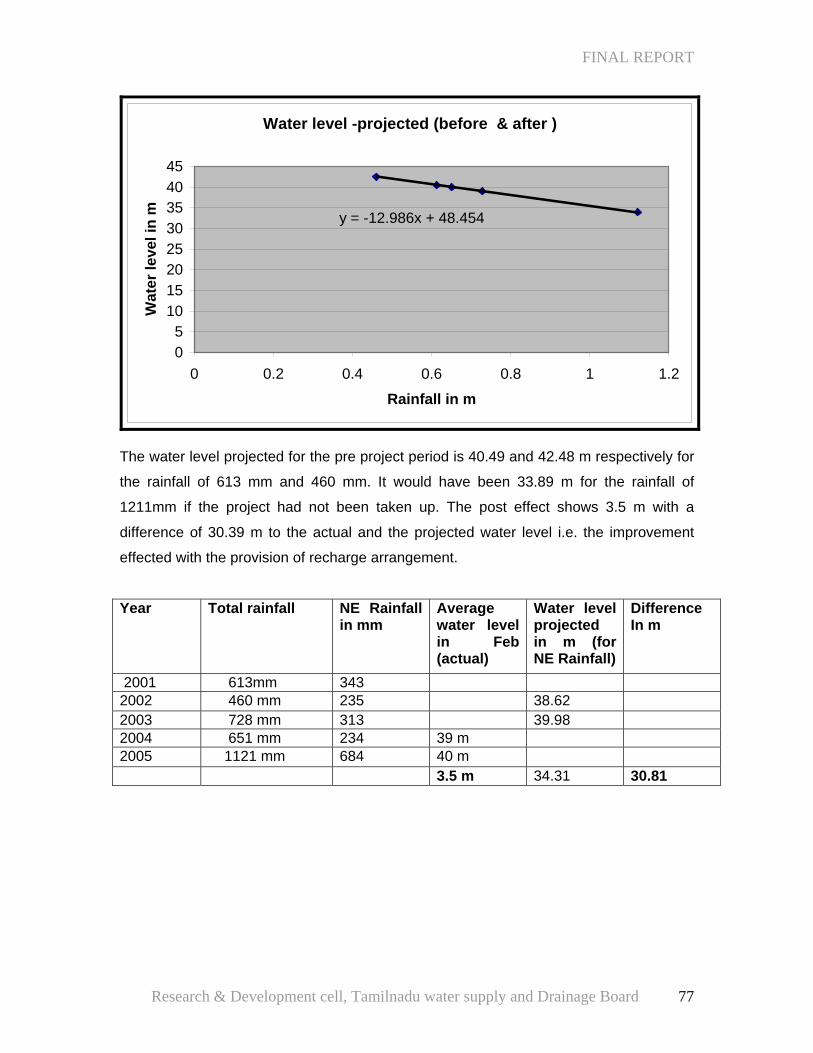
FINAL REPORT
Water level -projected (before & after )
y = -12.986x + 48.454
05
1015202530354045
0 0.2 0.4 0.6 0.8 1 1.2
Rainfall in m
Wat
er le
vel i
n m
The water level projected for the pre project period is 40.49 and 42.48 m respectively for
the rainfall of 613 mm and 460 mm. It would have been 33.89 m for the rainfall of
1211mm if the project had not been taken up. The post effect shows 3.5 m with a
difference of 30.39 m to the actual and the projected water level i.e. the improvement
effected with the provision of recharge arrangement.
Year Total rainfall NE Rainfall
in mm Average water level in Feb (actual)
Water level projected in m (for NE Rainfall)
Difference In m
2001 613mm 343 2002 460 mm 235 38.62 2003 728 mm 313 39.98 2004 651 mm 234 39 m 2005 1121 mm 684 40 m 3.5 m 34.31 30.81
Research & Development cell, Tamilnadu water supply and Drainage Board 77
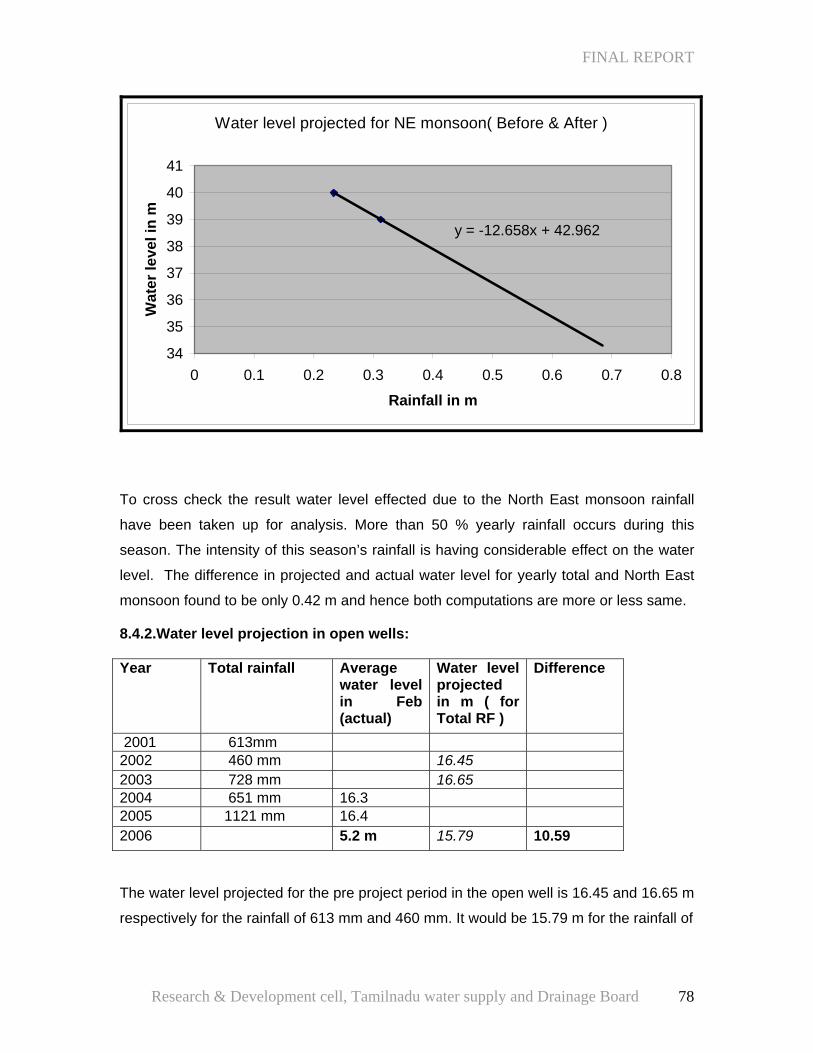
FINAL REPORT
Water level projected for NE monsoon( Before & After )
y = -12.658x + 42.962
34
35
36
37
38
39
40
41
0 0.1 0.2 0.3 0.4 0.5 0.6 0.7 0.8
Rainfall in m
Wat
er le
vel i
n m
To cross check the result water level effected due to the North East monsoon rainfall
have been taken up for analysis. More than 50 % yearly rainfall occurs during this
season. The intensity of this season’s rainfall is having considerable effect on the water
level. The difference in projected and actual water level for yearly total and North East
monsoon found to be only 0.42 m and hence both computations are more or less same.
8.4.2.Water level projection in open wells: Year Total rainfall Average
water level in Feb (actual)
Water level projected in m ( for Total RF )
Difference
2001 613mm 2002 460 mm 16.45 2003 728 mm 16.65 2004 651 mm 16.3 2005 1121 mm 16.4 2006 5.2 m 15.79 10.59
The water level projected for the pre project period in the open well is 16.45 and 16.65 m
respectively for the rainfall of 613 mm and 460 mm. It would be 15.79 m for the rainfall of
Research & Development cell, Tamilnadu water supply and Drainage Board 78
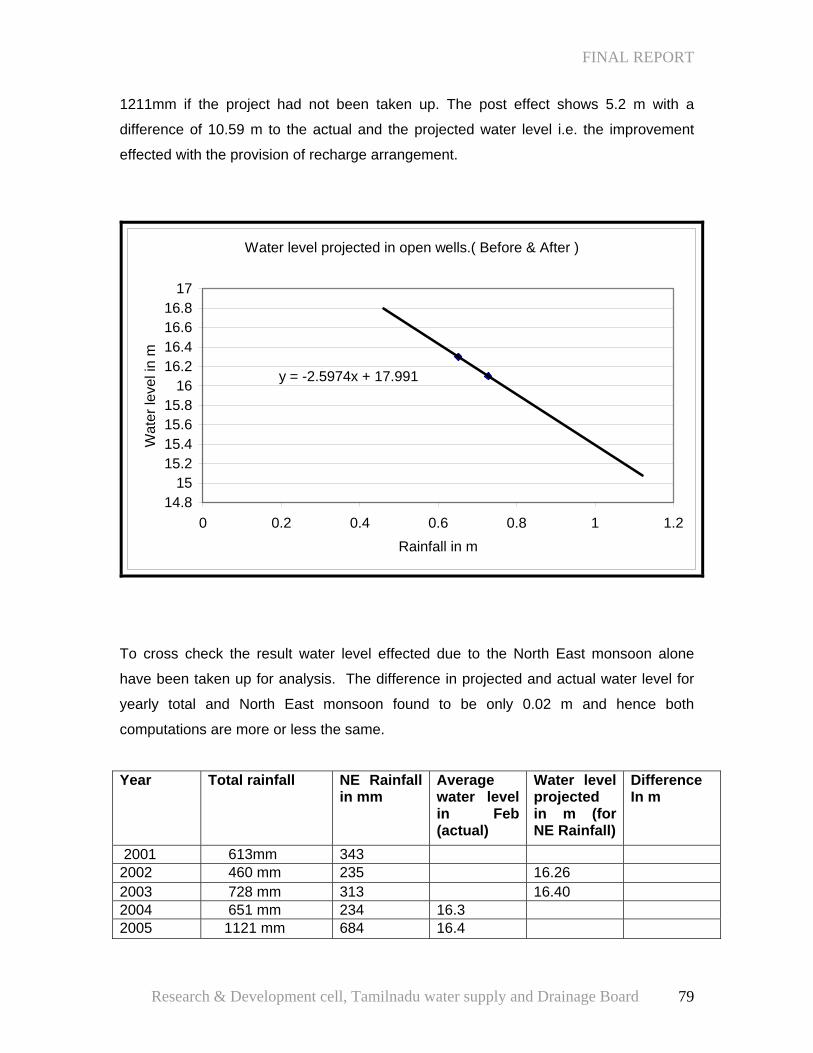
FINAL REPORT
1211mm if the project had not been taken up. The post effect shows 5.2 m with a
difference of 10.59 m to the actual and the projected water level i.e. the improvement
effected with the provision of recharge arrangement.
Water level projected in open wells.( Before & After )
y = -2.5974x + 17.991
14.815
15.215.415.615.8
1616.216.416.616.8
17
0 0.2 0.4 0.6 0.8 1 1.2Rainfall in m
Wat
er le
vel i
n m
To cross check the result water level effected due to the North East monsoon alone
have been taken up for analysis. The difference in projected and actual water level for
yearly total and North East monsoon found to be only 0.02 m and hence both
computations are more or less the same.
Year Total rainfall NE Rainfall
in mm Average water level in Feb (actual)
Water level projected in m (for NE Rainfall)
Difference In m
2001 613mm 343 2002 460 mm 235 16.26 2003 728 mm 313 16.40 2004 651 mm 234 16.3 2005 1121 mm 684 16.4
Research & Development cell, Tamilnadu water supply and Drainage Board 79
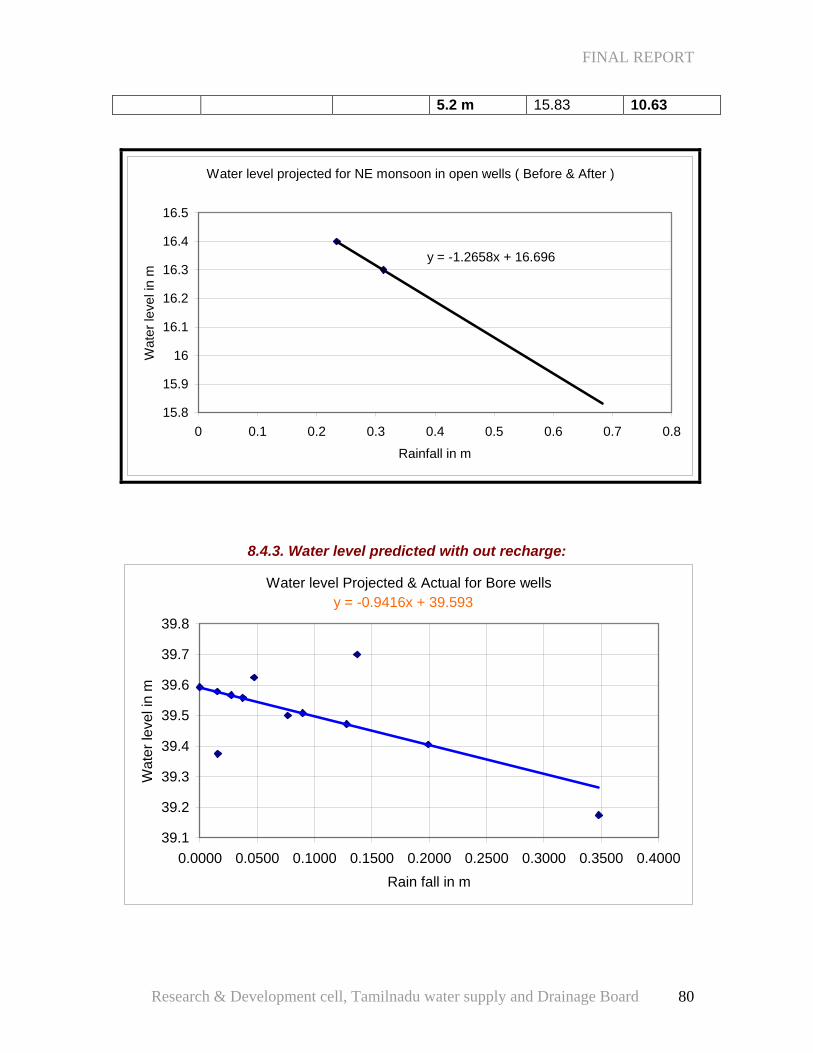
FINAL REPORT
5.2 m 15.83 10.63
Water level projected for NE monsoon in open wells ( Before & After )
y = -1.2658x + 16.696
15.8
15.9
16
16.1
16.2
16.3
16.4
16.5
0 0.1 0.2 0.3 0.4 0.5 0.6 0.7 0.8
Rainfall in m
Wat
er le
vel i
n m
8.4.3. Water level predicted with out recharge:
Water level Projected & Actual for Bore wellsy = -0.9416x + 39.593
39.1
39.2
39.3
39.4
39.5
39.6
39.7
39.8
0.0000 0.0500 0.1000 0.1500 0.2000 0.2500 0.3000 0.3500 0.4000Rain fall in m
Wat
er le
vel i
n m
Research & Development cell, Tamilnadu water supply and Drainage Board 80
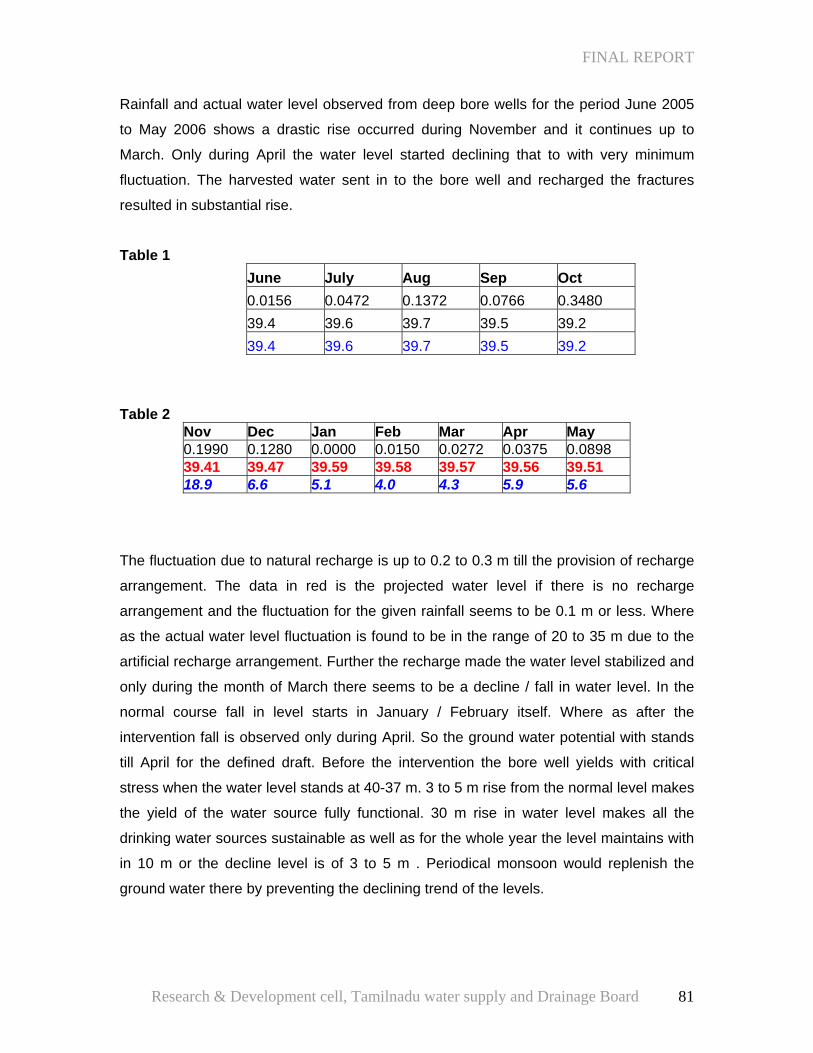
FINAL REPORT
Rainfall and actual water level observed from deep bore wells for the period June 2005
to May 2006 shows a drastic rise occurred during November and it continues up to
March. Only during April the water level started declining that to with very minimum
fluctuation. The harvested water sent in to the bore well and recharged the fractures
resulted in substantial rise.
Table 1
June July Aug Sep Oct 0.0156 0.0472 0.1372 0.0766 0.3480 39.4 39.6 39.7 39.5 39.2 39.4 39.6 39.7 39.5 39.2
Table 2
Nov Dec Jan Feb Mar Apr May 0.1990 0.1280 0.0000 0.0150 0.0272 0.0375 0.0898 39.41 39.47 39.59 39.58 39.57 39.56 39.51 18.9 6.6 5.1 4.0 4.3 5.9 5.6
The fluctuation due to natural recharge is up to 0.2 to 0.3 m till the provision of recharge
arrangement. The data in red is the projected water level if there is no recharge
arrangement and the fluctuation for the given rainfall seems to be 0.1 m or less. Where
as the actual water level fluctuation is found to be in the range of 20 to 35 m due to the
artificial recharge arrangement. Further the recharge made the water level stabilized and
only during the month of March there seems to be a decline / fall in water level. In the
normal course fall in level starts in January / February itself. Where as after the
intervention fall is observed only during April. So the ground water potential with stands
till April for the defined draft. Before the intervention the bore well yields with critical
stress when the water level stands at 40-37 m. 3 to 5 m rise from the normal level makes
the yield of the water source fully functional. 30 m rise in water level makes all the
drinking water sources sustainable as well as for the whole year the level maintains with
in 10 m or the decline level is of 3 to 5 m . Periodical monsoon would replenish the
ground water there by preventing the declining trend of the levels.
Research & Development cell, Tamilnadu water supply and Drainage Board 81
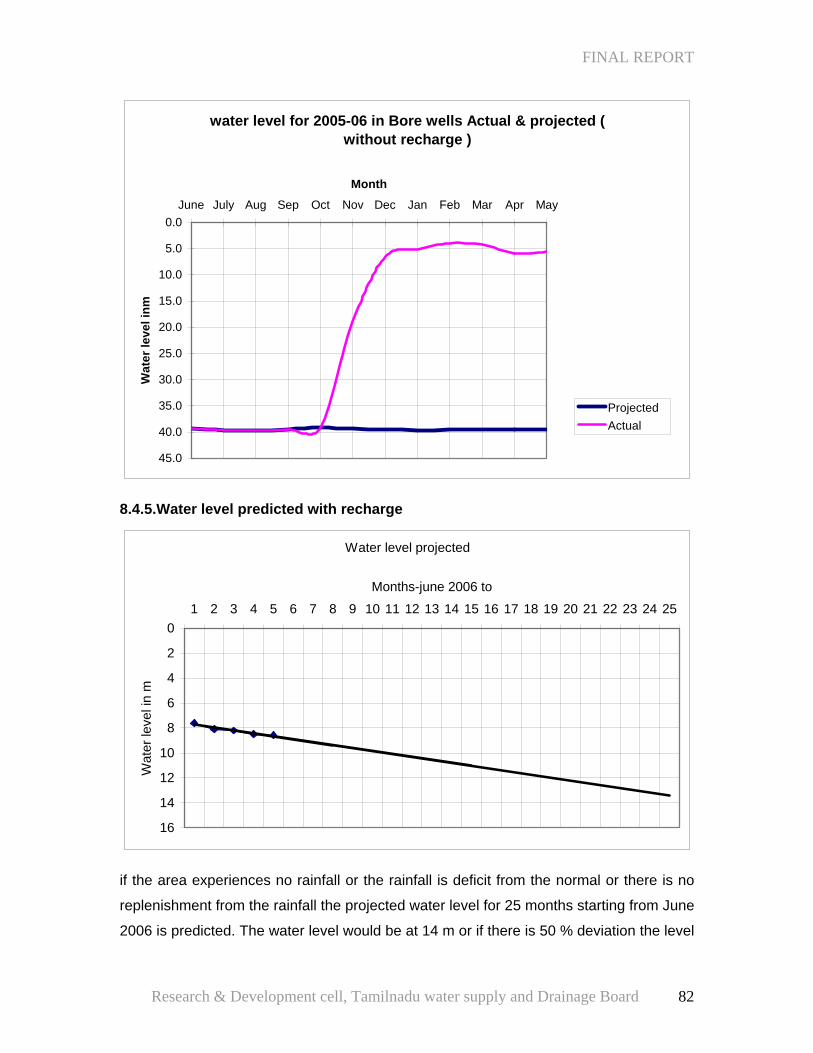
FINAL REPORT
water level for 2005-06 in Bore wells Actual & projected ( without recharge )
0.0
5.0
10.0
15.0
20.0
25.0
30.0
35.0
40.0
45.0
June July Aug Sep Oct Nov Dec Jan Feb Mar Apr May
Month
Wat
er le
vel i
nm
Projected Actual
8.4.5.Water level predicted with recharge
Water level projected
0
2
4
6
8
10
12
14
16
1 2 3 4 5 6 7 8 9 10 11 12 13 14 15 16 17 18 19 20 21 22 23 24 25
Months-june 2006 to
Wat
er le
vel i
n m
if the area experiences no rainfall or the rainfall is deficit from the normal or there is no
replenishment from the rainfall the projected water level for 25 months starting from June
2006 is predicted. The water level would be at 14 m or if there is 50 % deviation the level
Research & Development cell, Tamilnadu water supply and Drainage Board 82
FINAL REPORT
would be at 14+7=21 m. The predicted level is more than 40 % of the pre project level
of 40 m.( June 2003) With the given condition the drinking water sources provided in the
deeper fracture system would be sustainable even if the monsoon deviate 50 % from
its normal.
8.5.0.Rainfall vs. water level: (Distance source) TWAD board is monitoring Pre and post monsoon water level from the observation well
monitoring network, which contains 1286 observation wells through out the state in a
grid pattern. The grid interval is 10 km by 10 km the data is being collected every year in
0.00
5.00
10.00
15.00
20.00
25.00
30.00
35.00
40.00
2000 2001 2002 2003 2004 2005 2006
Wat
erle
vel i
n m
Rainfall Vs Waterlevel
0.00
200.00
400.00
600.00
800.00
1000.00
1200.00
1 2 3 4 5 6 7
Rai
nfal
l in
mm
the month of January and May from 1991 onwards.
An observation well under the network situated in Puduchatram village, which is very
nearer to Karukurichi village where the project work is under taken. Cumulative rainfall
Research & Development cell, Tamilnadu water supply and Drainage Board 83
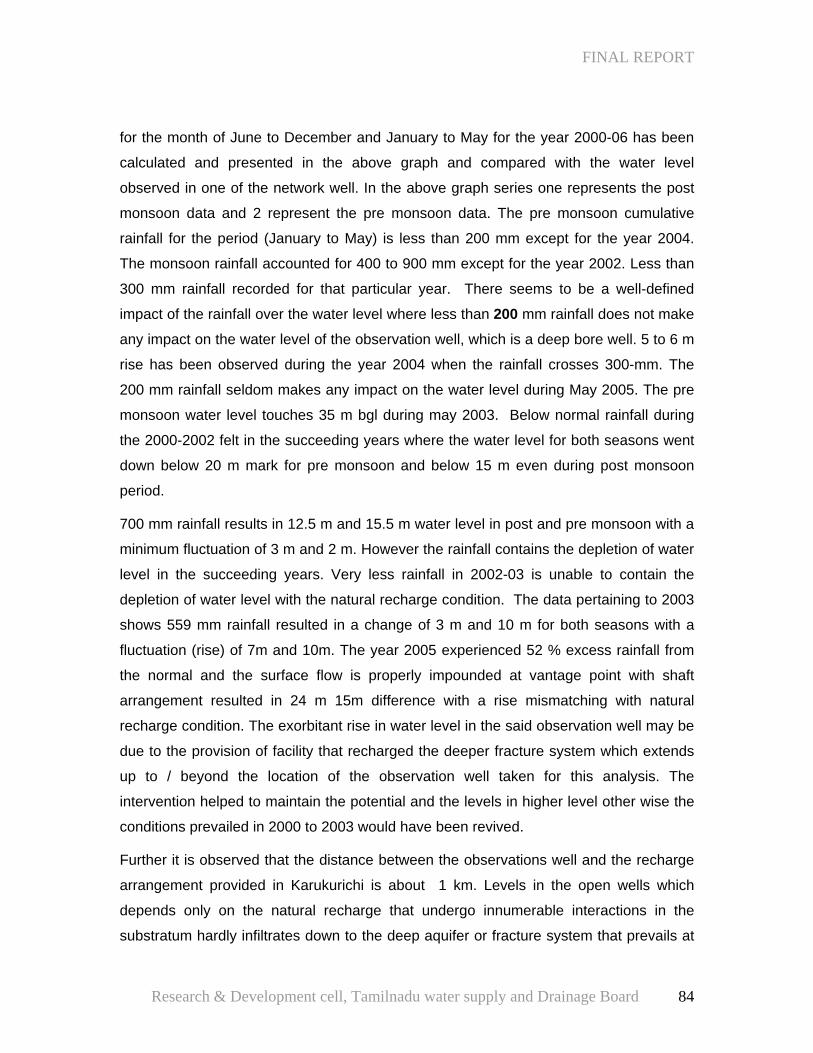
FINAL REPORT
for the month of June to December and January to May for the year 2000-06 has been
calculated and presented in the above graph and compared with the water level
observed in one of the network well. In the above graph series one represents the post
monsoon data and 2 represent the pre monsoon data. The pre monsoon cumulative
rainfall for the period (January to May) is less than 200 mm except for the year 2004.
The monsoon rainfall accounted for 400 to 900 mm except for the year 2002. Less than
300 mm rainfall recorded for that particular year. There seems to be a well-defined
impact of the rainfall over the water level where less than 200 mm rainfall does not make
any impact on the water level of the observation well, which is a deep bore well. 5 to 6 m
rise has been observed during the year 2004 when the rainfall crosses 300-mm. The
200 mm rainfall seldom makes any impact on the water level during May 2005. The pre
monsoon water level touches 35 m bgl during may 2003. Below normal rainfall during
the 2000-2002 felt in the succeeding years where the water level for both seasons went
down below 20 m mark for pre monsoon and below 15 m even during post monsoon
period.
700 mm rainfall results in 12.5 m and 15.5 m water level in post and pre monsoon with a
minimum fluctuation of 3 m and 2 m. However the rainfall contains the depletion of water
level in the succeeding years. Very less rainfall in 2002-03 is unable to contain the
depletion of water level with the natural recharge condition. The data pertaining to 2003
shows 559 mm rainfall resulted in a change of 3 m and 10 m for both seasons with a
fluctuation (rise) of 7m and 10m. The year 2005 experienced 52 % excess rainfall from
the normal and the surface flow is properly impounded at vantage point with shaft
arrangement resulted in 24 m 15m difference with a rise mismatching with natural
recharge condition. The exorbitant rise in water level in the said observation well may be
due to the provision of facility that recharged the deeper fracture system which extends
up to / beyond the location of the observation well taken for this analysis. The
intervention helped to maintain the potential and the levels in higher level other wise the
conditions prevailed in 2000 to 2003 would have been revived.
Further it is observed that the distance between the observations well and the recharge
arrangement provided in Karukurichi is about 1 km. Levels in the open wells which
depends only on the natural recharge that undergo innumerable interactions in the
substratum hardly infiltrates down to the deep aquifer or fracture system that prevails at
Research & Development cell, Tamilnadu water supply and Drainage Board 84
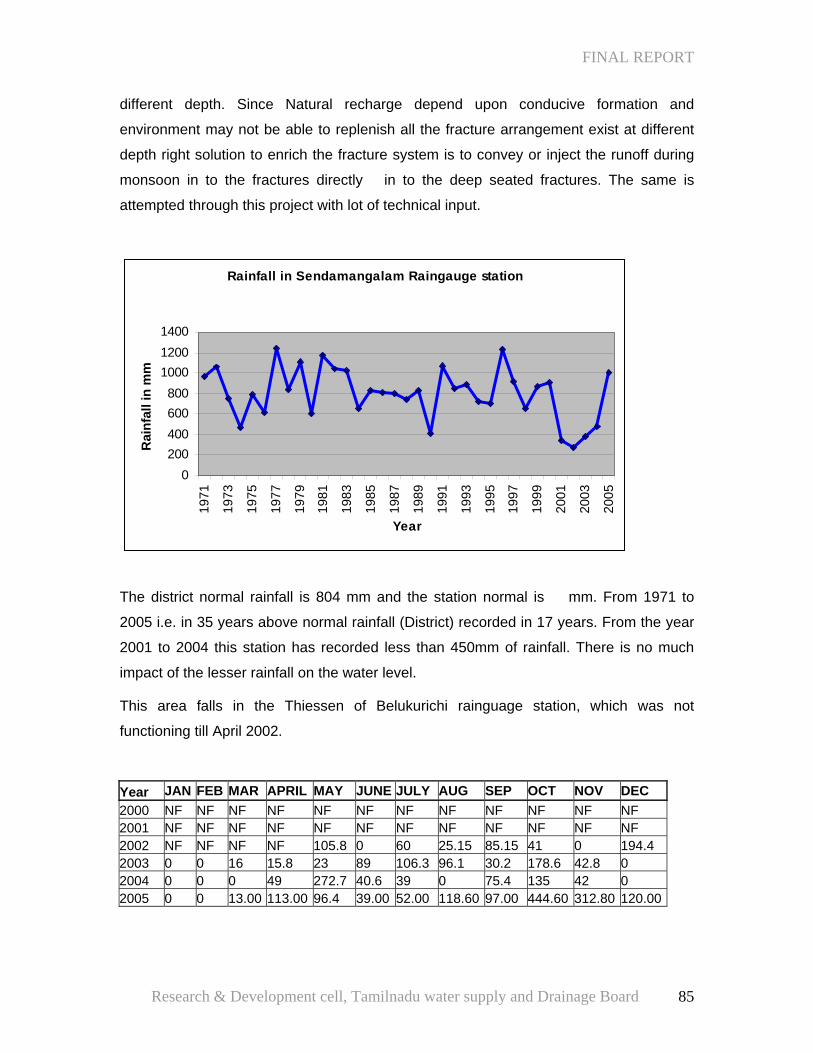
FINAL REPORT
different depth. Since Natural recharge depend upon conducive formation and
environment may not be able to replenish all the fracture arrangement exist at different
depth right solution to enrich the fracture system is to convey or inject the runoff during
monsoon in to the fractures directly in to the deep seated fractures. The same is
attempted through this project with lot of technical input.
Rainfall in Sendamangalam Raingauge station
0200400600800
100012001400
1971
1973
1975
1977
1979
1981
1983
1985
1987
1989
1991
1993
1995
1997
1999
2001
2003
2005
Year
Rai
nfal
l in
mm
The district normal rainfall is 804 mm and the station normal is mm. From 1971 to
2005 i.e. in 35 years above normal rainfall (District) recorded in 17 years. From the year
2001 to 2004 this station has recorded less than 450mm of rainfall. There is no much
impact of the lesser rainfall on the water level.
This area falls in the Thiessen of Belukurichi rainguage station, which was not
functioning till April 2002.
Year JAN FEB MAR APRIL MAY JUNE JULY AUG SEP OCT NOV DEC 2000 NF NF NF NF NF NF NF NF NF NF NF NF 2001 NF NF NF NF NF NF NF NF NF NF NF NF 2002 NF NF NF NF 105.8 0 60 25.15 85.15 41 0 194.4 2003 0 0 16 15.8 23 89 106.3 96.1 30.2 178.6 42.8 0 2004 0 0 0 49 272.7 40.6 39 0 75.4 135 42 0 2005 0 0 13.00 113.00 96.4 39.00 52.00 118.60 97.00 444.60 312.80 120.00
Research & Development cell, Tamilnadu water supply and Drainage Board 85
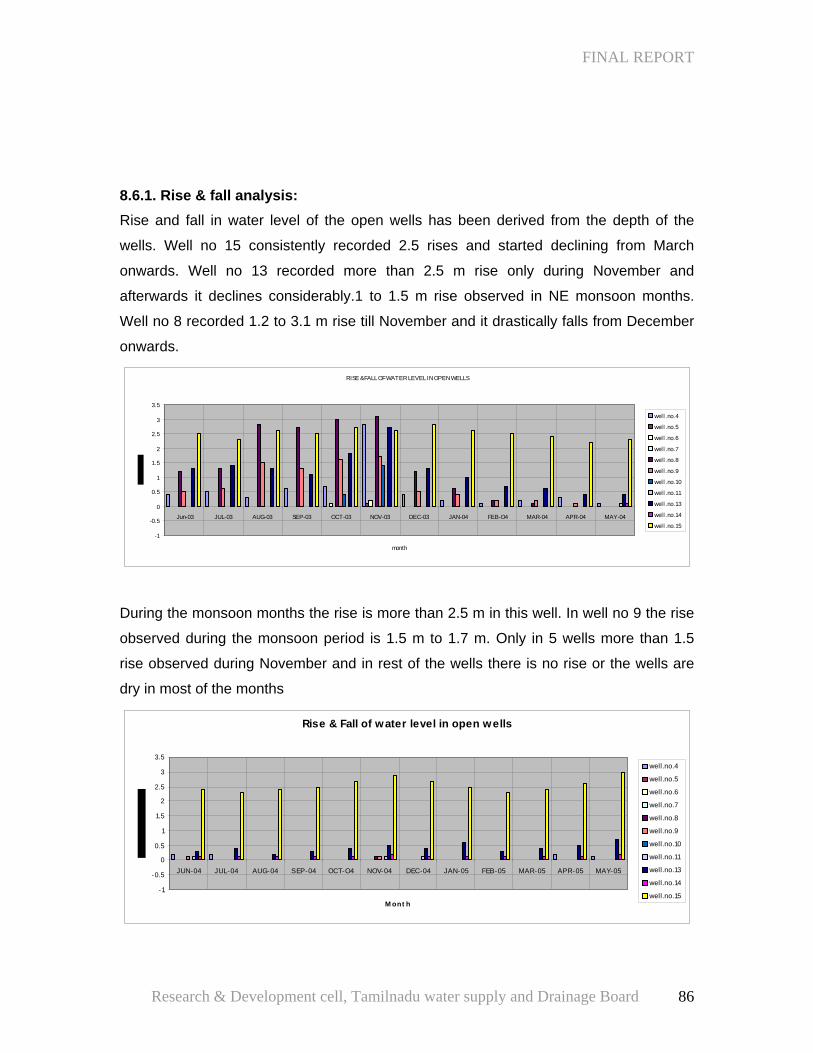
FINAL REPORT
8.6.1. Rise & fall analysis: Rise and fall in water level of the open wells has been derived from the depth of the
wells. Well no 15 consistently recorded 2.5 rises and started declining from March
onwards. Well no 13 recorded more than 2.5 m rise only during November and
afterwards it declines considerably.1 to 1.5 m rise observed in NE monsoon months.
Well no 8 recorded 1.2 to 3.1 m rise till November and it drastically falls from December
onwards.
RISE & FALL OF WATER LEVEL IN OPEN WELLS
-1
-0.5
0
0.5
1
1.5
2
2.5
3
3.5
Jun-03 JUL-03 AUG-03 SEP-03 OCT-03 NOV-03 DEC-03 JAN-04 FEB-O4 MAR-04 APR-04 MAY-04
month
wel l .no.4
wel l .no.5
wel l .no.6
wel l .no.7
wel l .no.8
wel l .no.9
wel l .no.10
wel l .no.11
wel l .no.13
wel l .no.14
wel l .no.15
During the monsoon months the rise is more than 2.5 m in this well. In well no 9 the rise
observed during the monsoon period is 1.5 m to 1.7 m. Only in 5 wells more than 1.5
rise observed during November and in rest of the wells there is no rise or the wells are
dry in most of the months
Rise & Fall of water level in open wells
-1
-0.5
0
0.5
1
1.5
2
2.5
3
3.5
JUN-04 JUL-04 AUG-04 SEP-04 OCT-O4 NOV-04 DEC-04 JAN-05 FEB-05 MAR-05 APR-05 MAY-05
M ont h
well.no.4
well.no.5
well.no.6
well.no.7
well.no.8
well.no.9
well.no.10
well.no.11
well.no.13
well.no.14
well.no.15
Research & Development cell, Tamilnadu water supply and Drainage Board 86
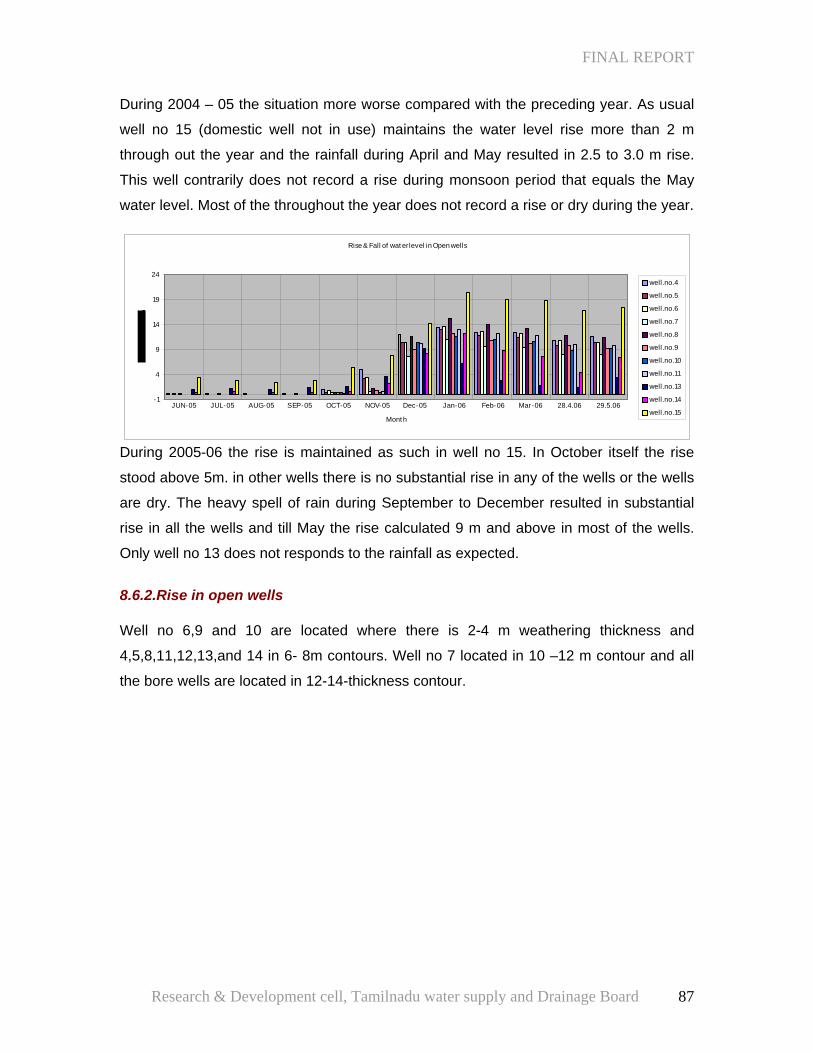
FINAL REPORT
During 2004 – 05 the situation more worse compared with the preceding year. As usual
well no 15 (domestic well not in use) maintains the water level rise more than 2 m
through out the year and the rainfall during April and May resulted in 2.5 to 3.0 m rise.
This well contrarily does not record a rise during monsoon period that equals the May
water level. Most of the throughout the year does not record a rise or dry during the year.
Rise & Fall of wat erlevel in Open wells
-1
4
9
14
19
24
JUN-05 JUL-05 AUG-05 SEP-05 OCT-05 NOV-05 Dec-05 Jan-06 Feb-06 Mar-06 28.4.06 29.5.06
Mont h
well.no.4
well.no.5
well.no.6
well.no.7
well.no.8
well.no.9
well.no.10
well.no.11
well.no.13
well.no.14
well.no.15
During 2005-06 the rise is maintained as such in well no 15. In October itself the rise
stood above 5m. in other wells there is no substantial rise in any of the wells or the wells
are dry. The heavy spell of rain during September to December resulted in substantial
rise in all the wells and till May the rise calculated 9 m and above in most of the wells.
Only well no 13 does not responds to the rainfall as expected.
8.6.2.Rise in open wells Well no 6,9 and 10 are located where there is 2-4 m weathering thickness and
4,5,8,11,12,13,and 14 in 6- 8m contours. Well no 7 located in 10 –12 m contour and all
the bore wells are located in 12-14-thickness contour.
Research & Development cell, Tamilnadu water supply and Drainage Board 87
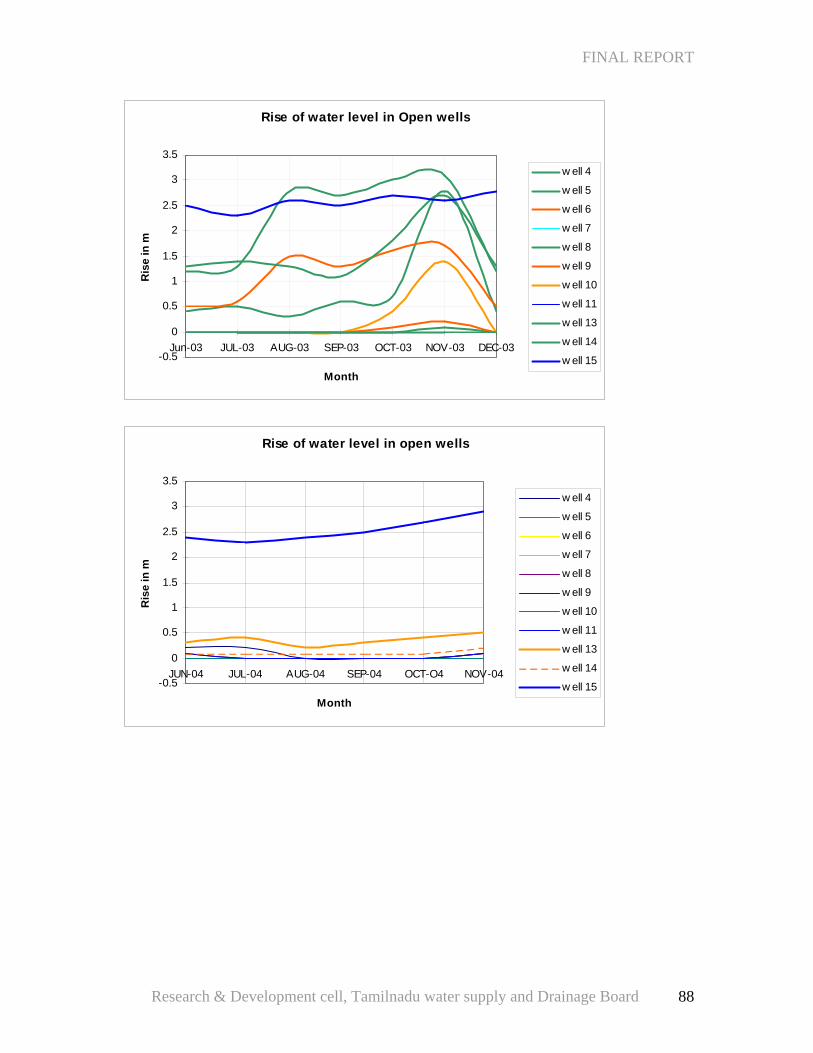
FINAL REPORT
Rise of water level in Open wells
-0.5
0
0.5
1
1.5
2
2.5
3
3.5
Jun-03 JUL-03 AUG-03 SEP-03 OCT-03 NOV-03 DEC-03
Month
Ris
e in
m
w ell 4
w ell 5
w ell 6
w ell 7
w ell 8
w ell 9
w ell 10
w ell 11
w ell 13
w ell 14
w ell 15
Rise of water level in open wells
-0.5
0
0.5
1
1.5
2
2.5
3
3.5
JUN-04 JUL-04 AUG-04 SEP-04 OCT-O4 NOV-04
Month
Ris
e in
m
w ell 4
w ell 5
w ell 6
w ell 7
w ell 8
w ell 9
w ell 10
w ell 11
w ell 13
w ell 14
w ell 15
Research & Development cell, Tamilnadu water supply and Drainage Board 88
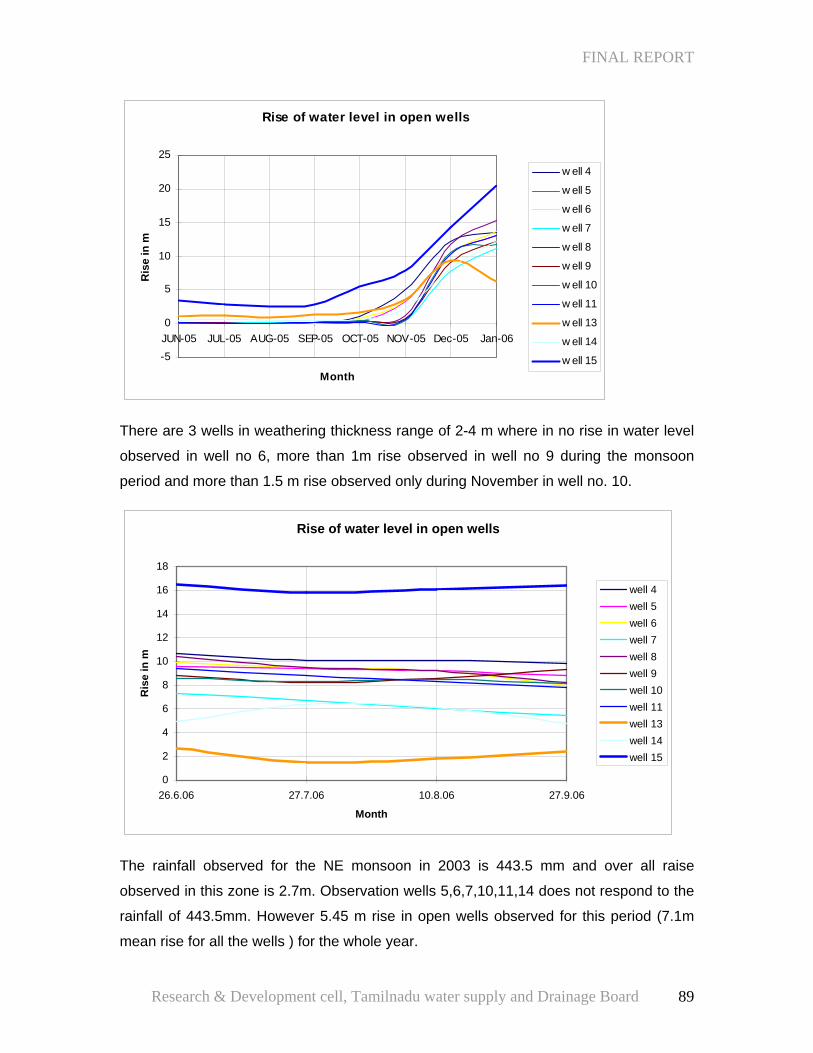
FINAL REPORT
Rise of water level in open wells
-5
0
5
10
15
20
25
JUN-05 JUL-05 AUG-05 SEP-05 OCT-05 NOV-05 Dec-05 Jan-06
Month
Ris
e in
m
w ell 4
w ell 5
w ell 6
w ell 7
w ell 8
w ell 9
w ell 10
w ell 11
w ell 13
w ell 14
w ell 15
There are 3 wells in weathering thickness range of 2-4 m where in no rise in water level
observed in well no 6, more than 1m rise observed in well no 9 during the monsoon
period and more than 1.5 m rise observed only during November in well no. 10.
Rise of water level in open wells
0
2
4
6
8
10
12
14
16
18
26.6.06 27.7.06 10.8.06 27.9.06
Month
Ris
e in
m
well 4well 5well 6well 7well 8well 9well 10well 11well 13well 14well 15
The rainfall observed for the NE monsoon in 2003 is 443.5 mm and over all raise
observed in this zone is 2.7m. Observation wells 5,6,7,10,11,14 does not respond to the
rainfall of 443.5mm. However 5.45 m rise in open wells observed for this period (7.1m
mean rise for all the wells ) for the whole year.
Research & Development cell, Tamilnadu water supply and Drainage Board 89
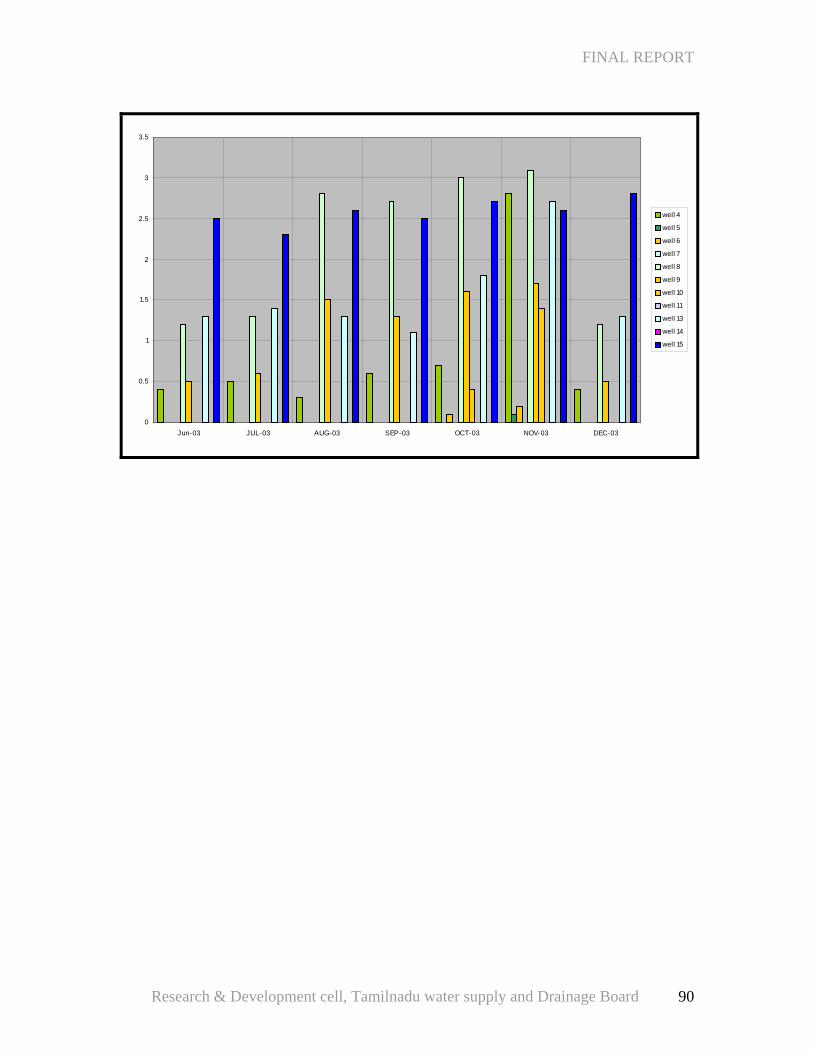
FINAL REPORT
0
0.5
1
1.5
2
2.5
3
3.5
Jun-03 JUL-03 AUG-03 SEP-03 OCT-03 NOV-03 DEC-03
well 4
well 5
well 6
well 7
well 8
well 9
well 10
well 11
well 13
well 14
well 15
Research & Development cell, Tamilnadu water supply and Drainage Board 90
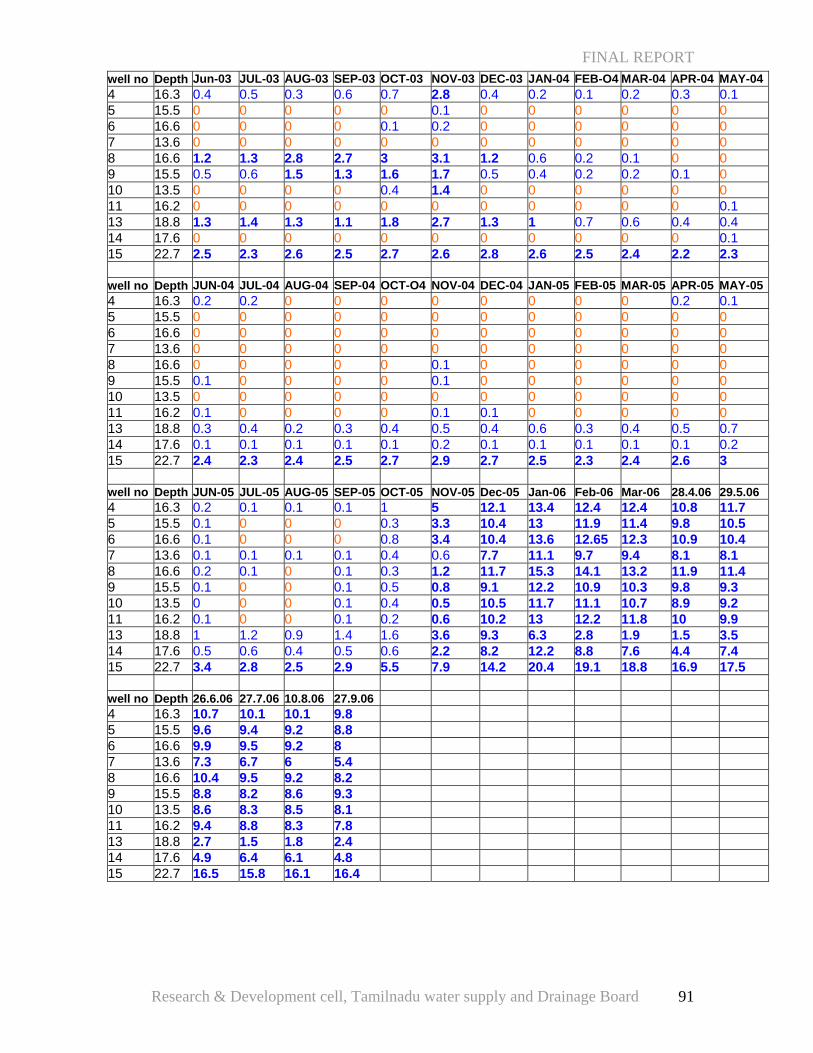
FINAL REPORT
well no Depth Jun-03 JUL-03 AUG-03 SEP-03 OCT-03 NOV-03 DEC-03 JAN-04 FEB-O4 MAR-04 APR-04 MAY-044 16.3 0.4 0.5 0.3 0.6 0.7 2.8 0.4 0.2 0.1 0.2 0.3 0.1 5 15.5 0 0 0 0 0 0.1 0 0 0 0 0 0 6 16.6 0 0 0 0 0.1 0.2 0 0 0 0 0 0 7 13.6 0 0 0 0 0 0 0 0 0 0 0 0 8 16.6 1.2 1.3 2.8 2.7 3 3.1 1.2 0.6 0.2 0.1 0 0 9 15.5 0.5 0.6 1.5 1.3 1.6 1.7 0.5 0.4 0.2 0.2 0.1 0 10 13.5 0 0 0 0 0.4 1.4 0 0 0 0 0 0 11 16.2 0 0 0 0 0 0 0 0 0 0 0 0.1 13 18.8 1.3 1.4 1.3 1.1 1.8 2.7 1.3 1 0.7 0.6 0.4 0.4 14 17.6 0 0 0 0 0 0 0 0 0 0 0 0.1 15 22.7 2.5 2.3 2.6 2.5 2.7 2.6 2.8 2.6 2.5 2.4 2.2 2.3 well no Depth JUN-04 JUL-04 AUG-04 SEP-04 OCT-O4 NOV-04 DEC-04 JAN-05 FEB-05 MAR-05 APR-05 MAY-054 16.3 0.2 0.2 0 0 0 0 0 0 0 0 0.2 0.1 5 15.5 0 0 0 0 0 0 0 0 0 0 0 0 6 16.6 0 0 0 0 0 0 0 0 0 0 0 0 7 13.6 0 0 0 0 0 0 0 0 0 0 0 0 8 16.6 0 0 0 0 0 0.1 0 0 0 0 0 0 9 15.5 0.1 0 0 0 0 0.1 0 0 0 0 0 0 10 13.5 0 0 0 0 0 0 0 0 0 0 0 0 11 16.2 0.1 0 0 0 0 0.1 0.1 0 0 0 0 0 13 18.8 0.3 0.4 0.2 0.3 0.4 0.5 0.4 0.6 0.3 0.4 0.5 0.7 14 17.6 0.1 0.1 0.1 0.1 0.1 0.2 0.1 0.1 0.1 0.1 0.1 0.2 15 22.7 2.4 2.3 2.4 2.5 2.7 2.9 2.7 2.5 2.3 2.4 2.6 3 well no Depth JUN-05 JUL-05 AUG-05 SEP-05 OCT-05 NOV-05 Dec-05 Jan-06 Feb-06 Mar-06 28.4.06 29.5.06 4 16.3 0.2 0.1 0.1 0.1 1 5 12.1 13.4 12.4 12.4 10.8 11.7 5 15.5 0.1 0 0 0 0.3 3.3 10.4 13 11.9 11.4 9.8 10.5 6 16.6 0.1 0 0 0 0.8 3.4 10.4 13.6 12.65 12.3 10.9 10.4 7 13.6 0.1 0.1 0.1 0.1 0.4 0.6 7.7 11.1 9.7 9.4 8.1 8.1 8 16.6 0.2 0.1 0 0.1 0.3 1.2 11.7 15.3 14.1 13.2 11.9 11.4 9 15.5 0.1 0 0 0.1 0.5 0.8 9.1 12.2 10.9 10.3 9.8 9.3 10 13.5 0 0 0 0.1 0.4 0.5 10.5 11.7 11.1 10.7 8.9 9.2 11 16.2 0.1 0 0 0.1 0.2 0.6 10.2 13 12.2 11.8 10 9.9 13 18.8 1 1.2 0.9 1.4 1.6 3.6 9.3 6.3 2.8 1.9 1.5 3.5 14 17.6 0.5 0.6 0.4 0.5 0.6 2.2 8.2 12.2 8.8 7.6 4.4 7.4 15 22.7 3.4 2.8 2.5 2.9 5.5 7.9 14.2 20.4 19.1 18.8 16.9 17.5 well no Depth 26.6.06 27.7.06 10.8.06 27.9.06 4 16.3 10.7 10.1 10.1 9.8 5 15.5 9.6 9.4 9.2 8.8 6 16.6 9.9 9.5 9.2 8 7 13.6 7.3 6.7 6 5.4 8 16.6 10.4 9.5 9.2 8.2 9 15.5 8.8 8.2 8.6 9.3 10 13.5 8.6 8.3 8.5 8.1 11 16.2 9.4 8.8 8.3 7.8 13 18.8 2.7 1.5 1.8 2.4 14 17.6 4.9 6.4 6.1 4.8 15 22.7 16.5 15.8 16.1 16.4
Research & Development cell, Tamilnadu water supply and Drainage Board 91
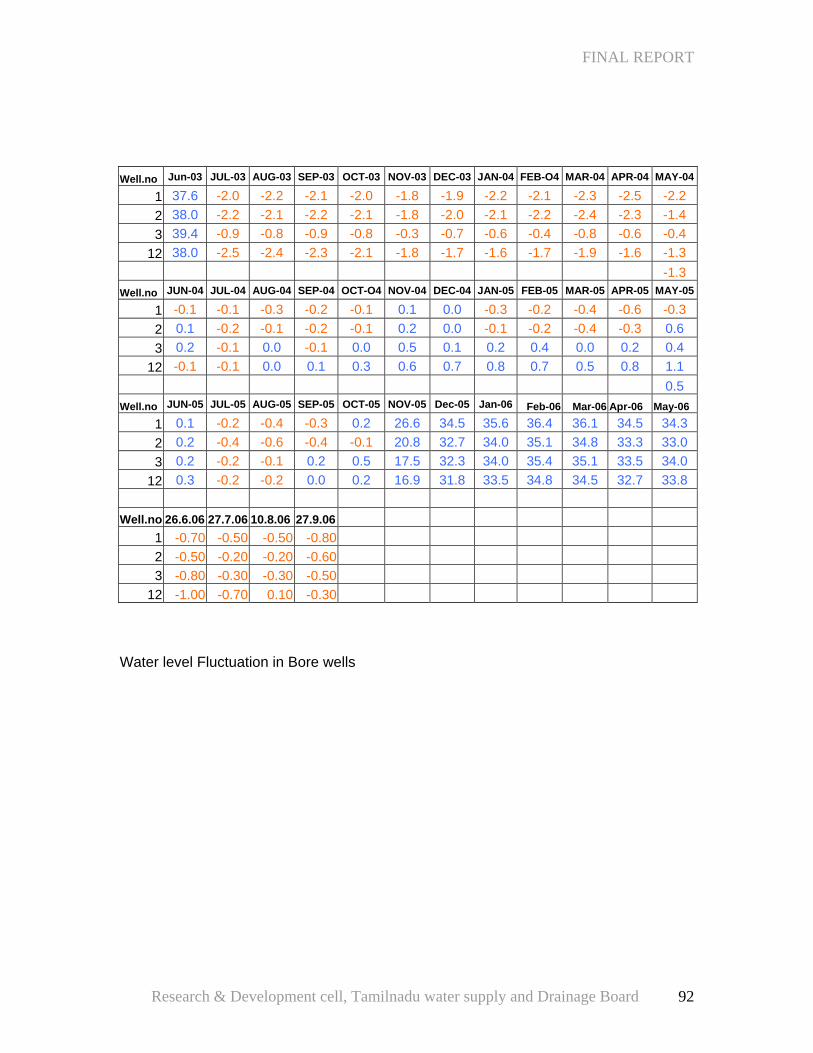
FINAL REPORT
Well.no Jun-03 JUL-03 AUG-03 SEP-03 OCT-03 NOV-03 DEC-03 JAN-04 FEB-O4 MAR-04 APR-04 MAY-04
1 37.6 -2.0 -2.2 -2.1 -2.0 -1.8 -1.9 -2.2 -2.1 -2.3 -2.5 -2.2 2 38.0 -2.2 -2.1 -2.2 -2.1 -1.8 -2.0 -2.1 -2.2 -2.4 -2.3 -1.4 3 39.4 -0.9 -0.8 -0.9 -0.8 -0.3 -0.7 -0.6 -0.4 -0.8 -0.6 -0.4
12 38.0 -2.5 -2.4 -2.3 -2.1 -1.8 -1.7 -1.6 -1.7 -1.9 -1.6 -1.3 -1.3 Well.no JUN-04 JUL-04 AUG-04 SEP-04 OCT-O4 NOV-04 DEC-04 JAN-05 FEB-05 MAR-05 APR-05 MAY-05
1 -0.1 -0.1 -0.3 -0.2 -0.1 0.1 0.0 -0.3 -0.2 -0.4 -0.6 -0.3 2 0.1 -0.2 -0.1 -0.2 -0.1 0.2 0.0 -0.1 -0.2 -0.4 -0.3 0.6 3 0.2 -0.1 0.0 -0.1 0.0 0.5 0.1 0.2 0.4 0.0 0.2 0.4
12 -0.1 -0.1 0.0 0.1 0.3 0.6 0.7 0.8 0.7 0.5 0.8 1.1 0.5 Well.no JUN-05 JUL-05 AUG-05 SEP-05 OCT-05 NOV-05 Dec-05 Jan-06 Feb-06 Mar-06 Apr-06 May-06
1 0.1 -0.2 -0.4 -0.3 0.2 26.6 34.5 35.6 36.4 36.1 34.5 34.3 2 0.2 -0.4 -0.6 -0.4 -0.1 20.8 32.7 34.0 35.1 34.8 33.3 33.0 3 0.2 -0.2 -0.1 0.2 0.5 17.5 32.3 34.0 35.4 35.1 33.5 34.0
12 0.3 -0.2 -0.2 0.0 0.2 16.9 31.8 33.5 34.8 34.5 32.7 33.8 Well.no 26.6.06 27.7.06 10.8.06 27.9.06
1 -0.70 -0.50 -0.50 -0.80 2 -0.50 -0.20 -0.20 -0.60 3 -0.80 -0.30 -0.30 -0.50
12 -1.00 -0.70 0.10 -0.30
Water level Fluctuation in Bore wells
Research & Development cell, Tamilnadu water supply and Drainage Board 92

Chapter IX FINDINGS &
RECOMMENDATIONS
FINAL REPORT
9.0.0.Findings: The systematic study aimed to improve the ground water potential in general and the
deep-seated fracture systems in particular to make the dependent drinking water
sources sustainable. Following are some of the findings of the research project that
envisages the replicable component which could be used at ease to make this kind of
projects successful with the primary indicator like round the clock drinking water supply
in the villages. The findings could be very much helpful in implementing recharge
projects in hard rock area where the subsurface is heterogeneous, devoid of potential
fractures in shallow and medium depth and surface recharge system techniques is not
suitable.
In depth knowledge of the details of the geological structures and the hydrogeological
conditions of the area is necessary for the success of the method, whose planning has
to be made based on the principles of environmental protection and sustainable
development. Characterization of the geology is important in determining the viability of
any type of recharge project, particularly where significant lateral and (or) vertical
ground-water flow is required between recharge and discharge locations.
Key features such as faults with significant offset, folds, and aerially extensive coarse-
or fine-grained units can exert dominant controls on a flow system and on the fate of
water from artificial recharge projects.
The weathered thickness contour depicts that maximum weathering (10 – 12 m) is
noticed with in the habitation and around the proposed recharge bore well site.
The water level data of the observation well from this block indicates that there is a
declining trend during summer and there is no remarkable increasing trend during winter
i.e. during the rainy season. Owing to poor recharge conditions the bore wells located in
the lineaments are not supplying sufficiently during summer months.
A large area of the settlement lies in the contour of 217 to 215 m above MSL having a
converging slope towards the project site.
The site chosen for constructing the storage pond lies almost in the lower elevation
compared with the adjoining area of the village. GPS has helped exactly to pin point the
lowest point as well as the running slope, which facilitated in harvesting the rainwater so
Research & Development cell, Tamilnadu water supply and Drainage Board 93

FINAL REPORT
as to recharge the fractures for making the ground water potential and the drinking water
sustainable.
The fracture system exhibits different apparent resistivity with respect to its saturation
and potential. The value of 90, 60 and 150 ohm/m found to be barren or over exploited
and the one with 260 and 245 ohm /m found to be moderately yielding fracture system.
Though this area consists of multi fracture system the potential one is only at deeper
depth.
There are number of small and medium thickness fracture systems and most of the top
fractures found to be barren since exploited and the natural recharge in the form of
rainfall infiltration are not sufficient to cope up with the drawl. The fracture depth is
established at 56m, 98m, 154m, 230m and at 276m and however the fractures met with
up to 154 m do not found to be potential and the one met at 230 m was not sustainable
before the intervention of this project.
The fractures below 270 m found to be potential but not sustainable since bore wells
drilled beyond this depth and in proximity to the water sources makes it erratic in supply.
Some of the open wells found to be dry almost all the months before construction of the
recharge shaft around the defunct bore wells.
Mostly the catchment for the deeper fractures is at far off places and the ground water
moves down when there is recharge. The effective recharge again depends mostly on
the duration and intensity of rainfall in the catchments.
There seems to be limited scope for recharge to the deeper fractures where normally the
drawl is more. Indiscriminate drilling further deteriorates the functioning of the bore wells
and makes them defunct.
The cumulative rainfall for the period indicates January and February are the lean
months in which less than 20 mm rainfall occurred for all six years. August, October
November and May are the months where more than 400 mm (cumulative) rainfall
occurred in these years.
Altogether 26 % of the total rainfall occurred in the month of October, which follows 17%
in May and 15 % in November. August and September experienced 11 & 10 %
respectively and all other months contribute very less %. Highest contribution is derived
in the month of October, which amounts to 32%.
The analysis of the water level data reveals that much rise has not been observed in
most of the open wells since the replenishment and draft is almost equal
Research & Development cell, Tamilnadu water supply and Drainage Board 94
FINAL REPORT
However around 100 mm rainfall occurred during August makes an impact over the
water level only during October with a lag time of 50 to sixty days. After November the
level found to be declining to 40.5 m below. The periodical water level indicates 2.0 m
fluctuation in the deep bore well irrespective of 150 –200 mm rainfall.
Water level zones are observed in and around the habitation and also around the
proposed recharge site. This clearly indicates that the water level is sufficiently deep to
get replenished by recharge structures. Surface recharging may not enrich the deep-
seated fractures.
In the post project period the water level in the wells are of minimum fluctuation. There
is no drastic rise or fall in any of the wells. This clearly indicates that the deep fractures
get replenished by distance catchment and maintains the water level as such with out
reacting to the natural recharge around the place.
There seems to be a well-defined impact of the rainfall over the water level where less
than 200 mm rainfall does not make any impact on the water level of the observation
well. 5 to 6 m rise has been observed during the year 2004 when the rainfall crosses
300-mm. The 200 mm rainfall seldom makes any impact on the water level during May
2005. The pre monsoon water level touches 35 m bgl during may 2003.
Below normal rainfall during the year 2000-2002 felt in the succeeding years where the
water level for both seasons went down below 20 m mark for pre monsoon and below 15
m even during post monsoon period.
The year 2005 experienced 52 % excess rainfall from the normal and the surface flow is
properly impounded at vantage point with shaft arrangement resulted in 24 m and 15m
difference with a rise mismatching with natural recharge condition. The exorbitant rise in
water level in the said observation well may be due to the provision of facility that
recharged the deeper fracture system which extends up to / beyond the location of the
observation well taken for this analysis.
The intervention helped to maintain the potential and the levels in higher level other wise
the conditions prevailed in 2000 to 2003 would have been revived.
Since Natural recharges depend upon conducive formation and environment, it may not
be able to replenish all the fracture arrangement exists at different depth. The right
solution to enrich the fracture system is to divert or inject the runoff during monsoon in
to the deep seated fractures directly through bore wells.
Research & Development cell, Tamilnadu water supply and Drainage Board 95
FINAL REPORT
Further it has been explained that the major benefits derived out of the project would be
for the farmers who depends on the deep bore wells for their livelihood. The public
themselves interchanged their views on the enrichment of the aquifer system, water
level rise, duration and quantity of pumping and extension of cultivation and cultivable
lands. In the initial stage itself the whole public is united for a common cause.
Instead of creating new infra structure to this kind of practices the defunct bore wells
may be used because of its depth and the periodical precipitation that is congenial to
rejuvenate the sources around the places.
The water level contours for open wells indicate that there is no drastic rise during the
pre project period. The contour remains almost same all over the months except
November 2003. 15-16m (June – October) and 14-16 m (November) water level zones
are observed in and around the habitation and also around the proposed recharge site.
This clearly indicates that the water level is sufficiently deep to get replenished only
through sub-surface recharge structures. Surface recharging may not enrich the deep-
seated fractures.
The rainfall occurred less than the average made no impact on the deep-seated fracture
system. Only the vadose zone saturation was the result of the natural recharge. This has
been clearly indicated in the shallow bore wells hydrograph. A decline in the water table
represents ground water abstraction is in excess of replenishment while rise represent
ground water replenishment in excess of abstraction.
The quality of the observation wells is potable and free from the parameters that were in
excess during the pre construction period. TDS, Total hardness, calcium Sulphate and
Nitrate found to be excessive and makes the quality of the water not potable.
Nitrate is found to be excessive in the defunct bore wells and in the public open well.
The water quality data after the construction of the recharge shaft shows that a
considerable improvement in the TDS, Hardness and calcium in all the observation
wells.
The water level projected for the pre project period in the open well is 16.45 and 16.65 m
respectively for the rainfall of 613 mm and 460 mm. It would be 15.79 m for the rainfall of
1211mm if the project had not been taken up. The post effect shows 5.2 m with a
difference of 10.59 m to the actual and the projected water level i.e. the improvement
effected with the provision of recharge arrangement.
Research & Development cell, Tamilnadu water supply and Drainage Board 96
FINAL REPORT
The difference in projected and actual water level for yearly total and North East
monsoon in open wells found to be only 0.42 m and hence both computations are more
or less same.
Rainfall and actual water level observed from deep bore wells for the period June 2005
to May 2006 shows a drastic rise occurred during November and it continues up to
March. Only during April the water level started declining that to with very minimum
fluctuation. The harvested water sent in to the bore well and recharged the fractures
resulted in substantial rise.
So the ground water potential with stands till April for the defined draft without inflicting a
fall. Before the intervention the bore well yields with critical stress when the water level
stands at 40-37 m. 3 to 5 m rise from the normal level makes the yield of the water
source fully functional. 30 m rise in water level makes all the drinking water sources
sustainable as well as for the whole year the level maintains with in 10 m or the decline
in water level is of 3 to 5 m only. Periodical monsoon would replenish the ground water
there by preventing the declining trend of the levels.
The rainfall for summer months is quite contrary to the monsoon months where in most
of the years it is above normal. This help to saturate the vadose zone partially and the
monsoon rain that occur immediately tend to influence the recharge to ground water.
More than 500 m3 is stabilized almost all the months during the monsoon period in 2001
and 2005. Rest of the years this quantity stabilized in one or two months only.
September and October are the months that contributed more than 500 m3 almost all
the years.
August and November contributes that quantity but not during all the years. More than
1000 m3 stabilized during the month of October except the year 2001. This quantity
would be very much useful to replenish the ground water if properly harvested.
The rainfall runoff data during the year 2003 have been analyzed and it is found that at
least 410 m3 runoff is required to effect a rise in water level.( 0.1 m ) and 3927 m3 for
1m rise. The thresh hold rainfall worked out to stabilize the quantity of 410 m3 is 27 mm.
If there is 3927m3 runoff 1 m rise in water level will be effected and the rainfall needed
for this effect is 83 mm.
This has been correlated with the run off and the water level rise observed for the year
2005 where the thresh hold run off required to effect rise is 940 m3 since there is no rise
Research & Development cell, Tamilnadu water supply and Drainage Board 97
FINAL REPORT
in water level observed in any of the month during the year 2004-05. It is as double as
the quantity that stabilized during the year 2003.
The same type of analysis was made for the data available for the bore wells in the
project area for the year 2003. The quantity of run off required to effect rise in water level
in the bore wells is 1958 m3 and 2518 m3 for 1m rise for which the actual rainfall
required is 64.8 mm For the data pertaining to the year 2005 the threshold quantity required is 5002 m3 for
effecting rise (0.1m) and 5039 m3 for 1m rise in water level for which the rainfall
required to stabilize the run off is 128 mm. The reason for the higher quantity is
because, there was no rise affected in the preceding year because of poor rainfall and
recharge.
The analysis of water level observed in deep bore wells from June 2003 –May 2006
indicates that the rise and fall is in between 2.4 m to –1.3 i.e. the fluctuation of water
levels is with in 3.7 m for the year 2003-04. It is 1.3 m (0.9 to –0.4) for 2004-05 and 28.2
m (26.4 to –1.8) for 2005-06.
From the above rainfall recharge to the ground water aquifer has been worked out for
the project area where the specific yield is taken as 0.012 .For the non project period the
natural recharge ranges from 5 to 15 % and for the year 2005-06 it is 43.89 %
Natural recharge for 2005-06 worked out to 16280 m3.Had there been no intervention in
the village with the assistance of RGNDWM project for the given amount of run off (
37137 m3 ) only 5570 m3 (15% ) would have been added to the deeper aquifer as
natural recharge. Where as the influence of the project resulted in 16280 m3 of rainwater
added to the natural recharge thereby raises the water level to an extent of 28-30 m in
the source well. This has been crosschecked with specific yield and the area taken in to
consideration. The improvement in recharge % is due to the provision of artificial
recharge arrangement with the help of defunct bore well.
Water level in the wells maintained with in 10-12 m bgl unlike 38 – 42 m in the earlier
years. Pumping hours have been considerably reduced since the aquifer parameters
have been improved. Round the clock water supply in the village is ensured Agricultural
wells are active since water level in the open wells stood around 12 m for a longer time
facilitates agricultural activities. Electricity charges have been considerably reduced
there by making a savings to the panchayat. Quality of the source water has been
considerably improved in respect of TDS and other parameters. It has been reduced 15
% compared with the TDS of earlier years.
Research & Development cell, Tamilnadu water supply and Drainage Board 98
FINAL REPORT
The water level fluctuation after the project found to be 28.2 m against 3.7 m during the
non project period. The rainfall harvested reached the deep seated aquifer with out
much interception or loss and effected considerable improvement in the potential as well
as rise in water levels.
The data of the Observation wells maintained by the project is analyzed to find out the
fluctuation in water level, which is 0.4 to –1.8 m till the completion of the shaft works.
After construction the scenario in water level fluctuation is totally changed. It was
observed that 35.4 m rise was observed during February 2006. The level during the
same period in earlier years it was greater than 39 m and during 2006 it was only 4.0m
from ground level.
The rise in water level and the seasonal rainfall is analyzed for the project and non-
project period. In the pre project period minimum rainfall required to effect rise in water
level in the deep bore wells is around 413 mm where as it is only 297 mm after the
construction of shaft in the project area.
The pre project water level variation is only due to natural recharge and the variation in
water level after the project is cumulative of natural recharge in the free catchment and
the water added to the deep fractures through the facility provided for artificial recharge.
In the pre project period rainfall required to effect water level in open wells and bore
wells is around 271 and 405 mm and its only 221 mm after the project. 70 % of normal
rainfall is enough to effect raise in water level in the catchment (project area)
For effecting 1000 m3 runoff the rainfall required is 40.6 mm, 32.8mm, 42.5mm
respectively during 2003,2004 and 2005. Though the rainfall is low during 2004
compared with the preceding year, which has been contributed for holding the soil
moisture. However the effect of low rainfall felt during the year 2005 since for the same
amount of runoff at least 42.5 mm rainfall is needed which is comparatively more than
the year 2003 and 2004.
The rise observed in bore wells has been analyzed with ref to the runoff stabilized during
the year 2003 to 2005 .For effecting 0.1 m rise in water level in the bore well the
requirement is 1952 m3 runoff for the year 2003 and its 3032 m3 and 5002 m3 during
2004 and 2005 respectively
As the rise in water level is the result of saturated soil moisture, evaporation and other
losses the earlier years rainfall contributed for succeeding years. The meager rainfall
Research & Development cell, Tamilnadu water supply and Drainage Board 99
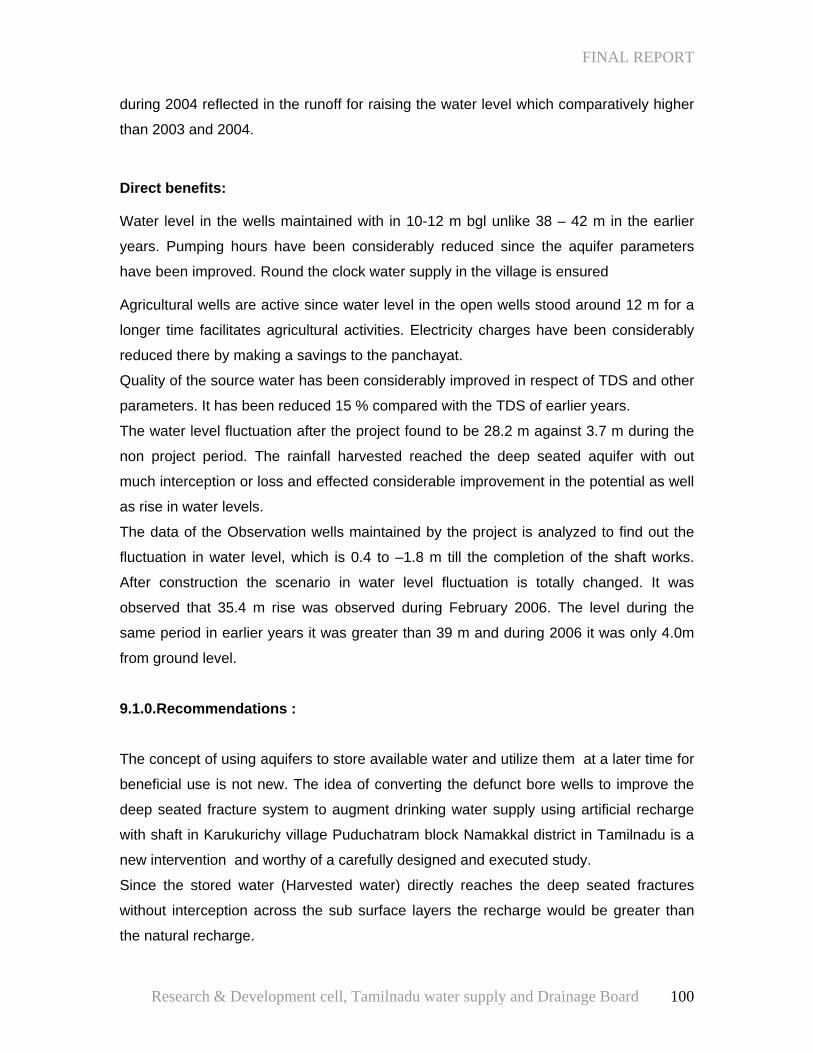
FINAL REPORT
during 2004 reflected in the runoff for raising the water level which comparatively higher
than 2003 and 2004.
Direct benefits:
Water level in the wells maintained with in 10-12 m bgl unlike 38 – 42 m in the earlier
years. Pumping hours have been considerably reduced since the aquifer parameters
have been improved. Round the clock water supply in the village is ensured
Agricultural wells are active since water level in the open wells stood around 12 m for a
longer time facilitates agricultural activities. Electricity charges have been considerably
reduced there by making a savings to the panchayat.
Quality of the source water has been considerably improved in respect of TDS and other
parameters. It has been reduced 15 % compared with the TDS of earlier years.
The water level fluctuation after the project found to be 28.2 m against 3.7 m during the
non project period. The rainfall harvested reached the deep seated aquifer with out
much interception or loss and effected considerable improvement in the potential as well
as rise in water levels.
The data of the Observation wells maintained by the project is analyzed to find out the
fluctuation in water level, which is 0.4 to –1.8 m till the completion of the shaft works.
After construction the scenario in water level fluctuation is totally changed. It was
observed that 35.4 m rise was observed during February 2006. The level during the
same period in earlier years it was greater than 39 m and during 2006 it was only 4.0m
from ground level.
9.1.0.Recommendations : The concept of using aquifers to store available water and utilize them at a later time for
beneficial use is not new. The idea of converting the defunct bore wells to improve the
deep seated fracture system to augment drinking water supply using artificial recharge
with shaft in Karukurichy village Puduchatram block Namakkal district in Tamilnadu is a
new intervention and worthy of a carefully designed and executed study.
Since the stored water (Harvested water) directly reaches the deep seated fractures
without interception across the sub surface layers the recharge would be greater than
the natural recharge.
Research & Development cell, Tamilnadu water supply and Drainage Board 100

FINAL REPORT
Deep seated fracture systems are sub surface anomalies that can be utilized as good
ground water reservoirs if properly replenished by impounding the surface runoff during
monsoon season since the magnitude of the fractures are voluminous that could store
enormous quantity of water through recharge by artificial means.
.
Detailed study has to be under taken to ascertain the extent, depth and thickness of the
fracture system, recharge arrangements facilities such as storage pond and the shafts
could be provided so as to optimally divert the harvested rain water.
Deep bore wells found to be dry or with insufficient yield need not be abandoned and
protective measures have to be taken up from the initial stage itself by necessary official
instructions.
Priority may be given to convert the defunct bore wells in to recharge bore wells when
ever recharge programs are implemented for groundwater development especially for
the sustainability of drinking water sources.
The location and the volume of the storage pond need to be designed in such a way that
even if there is minimum runoff that should find its way in to the storage pond and in to
the recharge bore well.
Necessary brake in gradient has to be provided so as to allow the shedding of mud load
in the source water.
The filter arrangement should invariably be separated by polythene nets and with
minimum effort the clogging with fine sediments could be removed before monsoon.
Design, Development and management of this kind of recharge program must involve
Public participation or the total involvement of the Panchayat since post operative
maintenance is very much important to keep the infra structure operational for a longer
period.
Research & Development cell, Tamilnadu water supply and Drainage Board 101

Chapter X Album
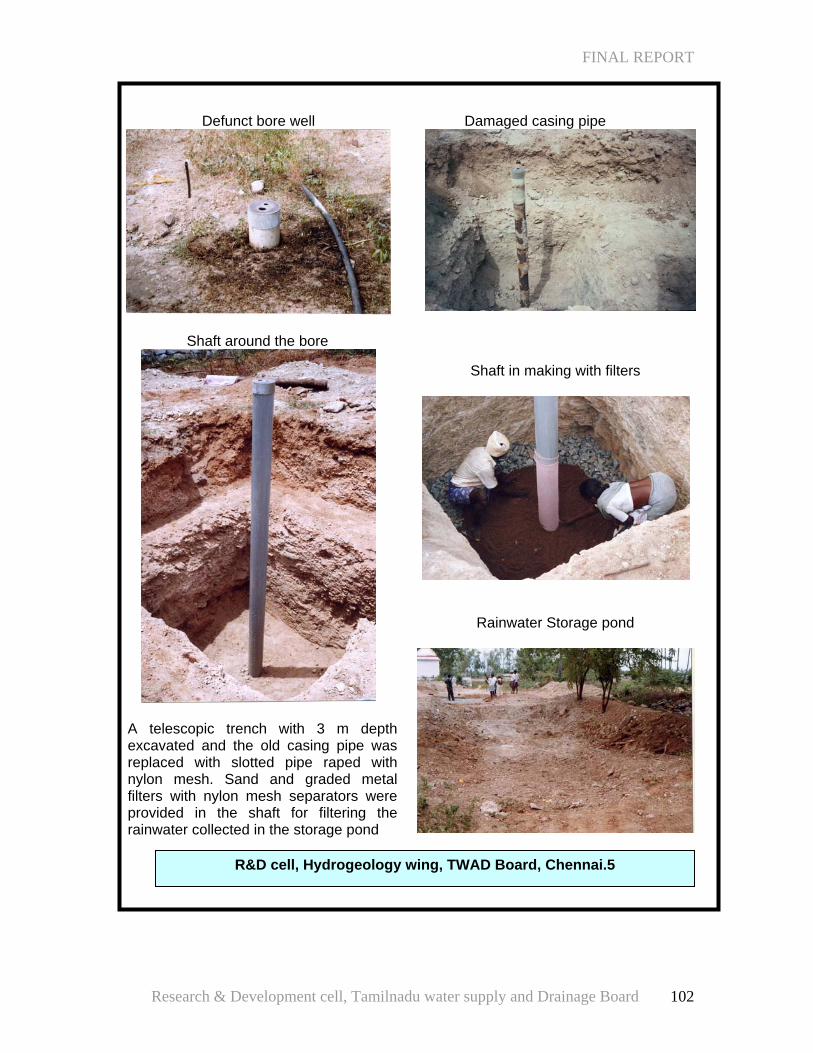
FINAL REPORT
Defunct bore well
Shaft around the bore
A telescopic trench with 3 m depth excavated and the old casing pipe was replaced with slotted pipe raped with nylon mesh. Sand and graded metal filters with nylon mesh separators were provided in the shaft for filtering the rainwater collected in the storage pond
Damaged casing pipe
Shaft in making with filters
Rainwater Storage pond
R&D cell, Hydrogeology wing, TWAD Board, Chennai.5
Research & Development cell, Tamilnadu water supply and Drainage Board 102
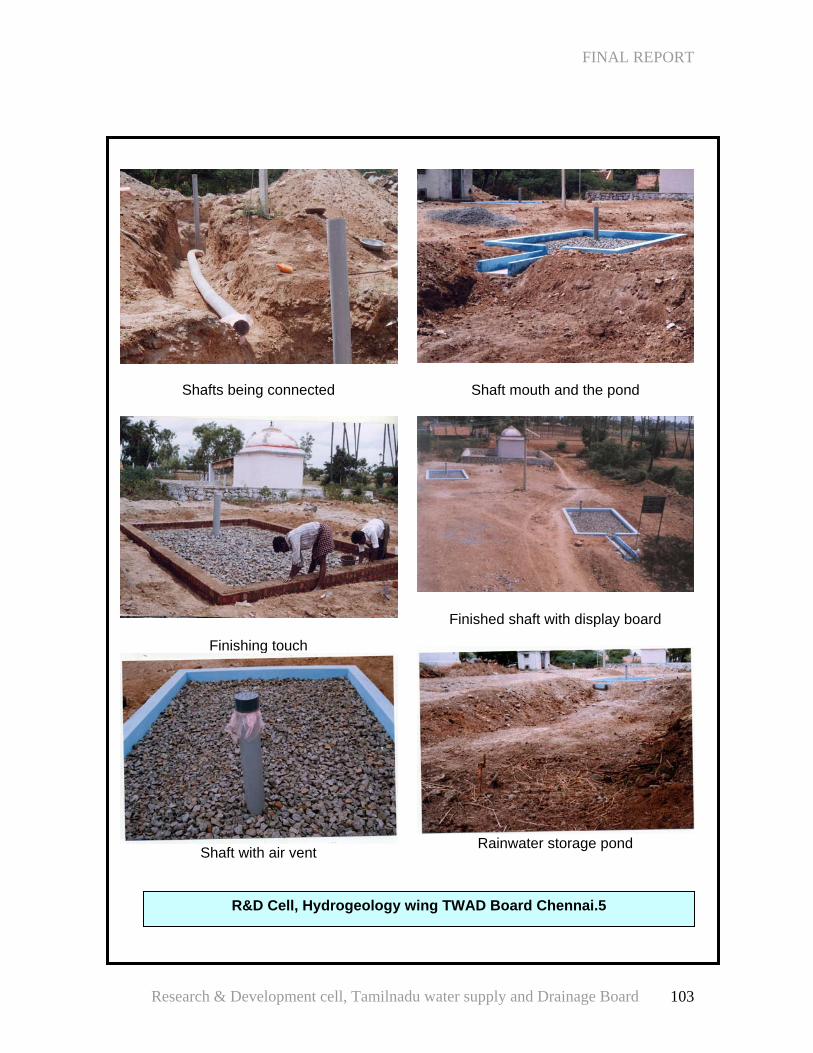
FINAL REPORT
Shafts being connected
Finishing touch
Shaft with air vent
Shaft mouth and the pond
Finished shaft with display board
Rainwater storage pond
R&D Cell, Hydrogeology wing TWAD Board Chennai.5
Research & Development cell, Tamilnadu water supply and Drainage Board 103
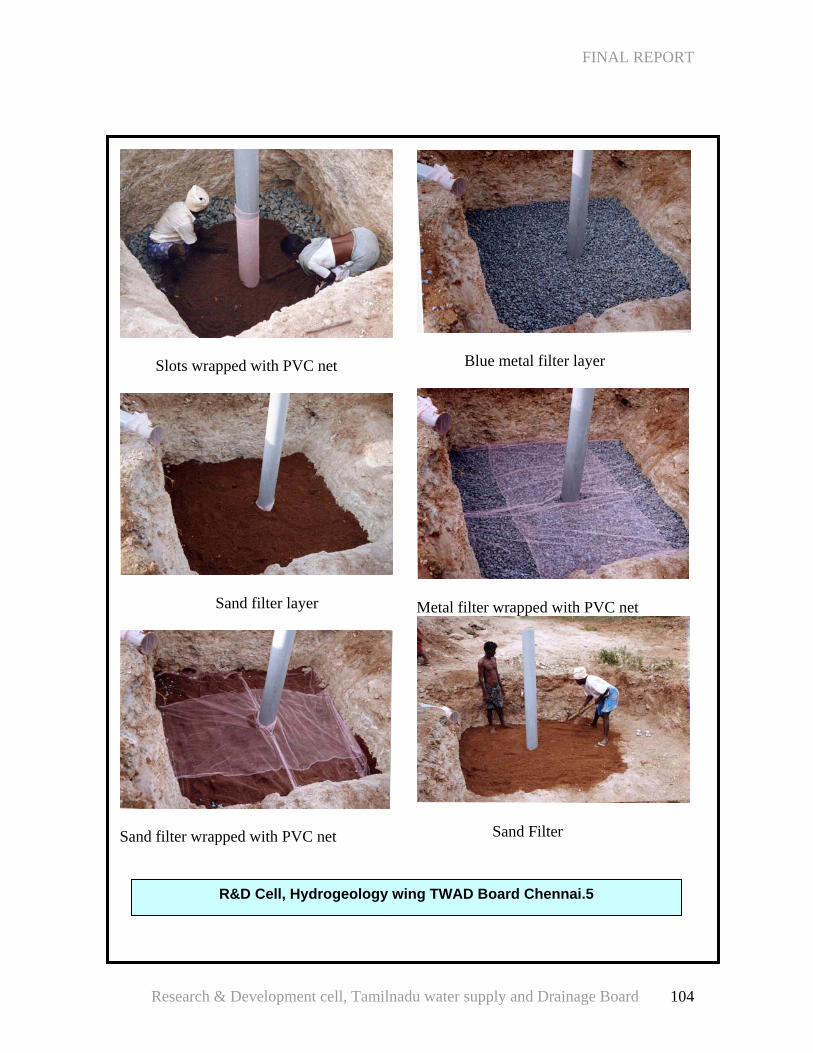
FINAL REPORT
Blue metal filter layer Slots wrapped with PVC net
Sand filter layer Metal filter wrapped with PVC net
Sand Filter Sand filter wrapped with PVC net
R&D Cell, Hydrogeology wing TWAD Board Chennai.5
Research & Development cell, Tamilnadu water supply and Drainage Board 104
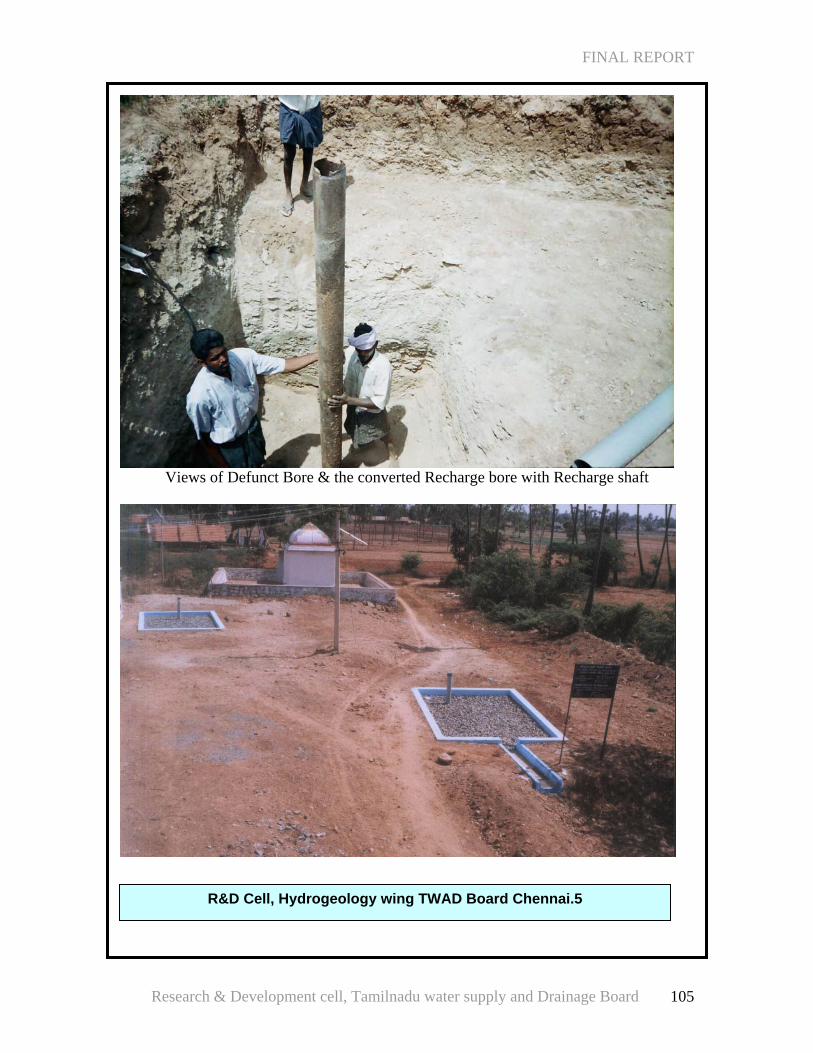
FINAL REPORT
Research & Development cell, Tamilnadu water supply and Drainage Board 105
Views of Defunct Bore & the converted Recharge bore with Recharge shaft
R&D Cell, Hydrogeology wing TWAD Board Chennai.5

Chapter X a Maps, Tables and Graphs
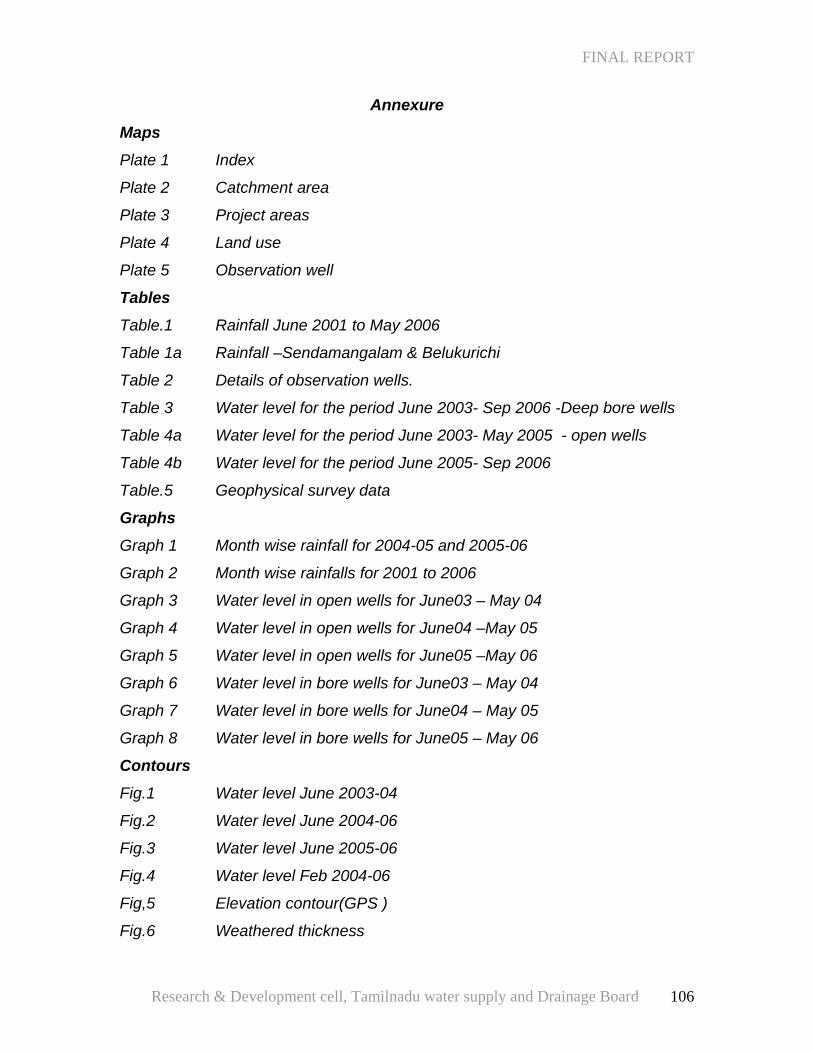
FINAL REPORT
Annexure
Maps
Plate 1 Index
Plate 2 Catchment area
Plate 3 Project areas
Plate 4 Land use
Plate 5 Observation well
Tables
Table.1 Rainfall June 2001 to May 2006
Table 1a Rainfall –Sendamangalam & Belukurichi
Table 2 Details of observation wells.
Table 3 Water level for the period June 2003- Sep 2006 -Deep bore wells
Table 4a Water level for the period June 2003- May 2005 - open wells
Table 4b Water level for the period June 2005- Sep 2006
Table.5 Geophysical survey data
Graphs
Graph 1 Month wise rainfall for 2004-05 and 2005-06
Graph 2 Month wise rainfalls for 2001 to 2006
Graph 3 Water level in open wells for June03 – May 04
Graph 4 Water level in open wells for June04 –May 05
Graph 5 Water level in open wells for June05 –May 06
Graph 6 Water level in bore wells for June03 – May 04
Graph 7 Water level in bore wells for June04 – May 05
Graph 8 Water level in bore wells for June05 – May 06
Contours
Fig.1 Water level June 2003-04
Fig.2 Water level June 2004-06
Fig.3 Water level June 2005-06
Fig.4 Water level Feb 2004-06
Fig,5 Elevation contour(GPS )
Fig.6 Weathered thickness
Research & Development cell, Tamilnadu water supply and Drainage Board 106
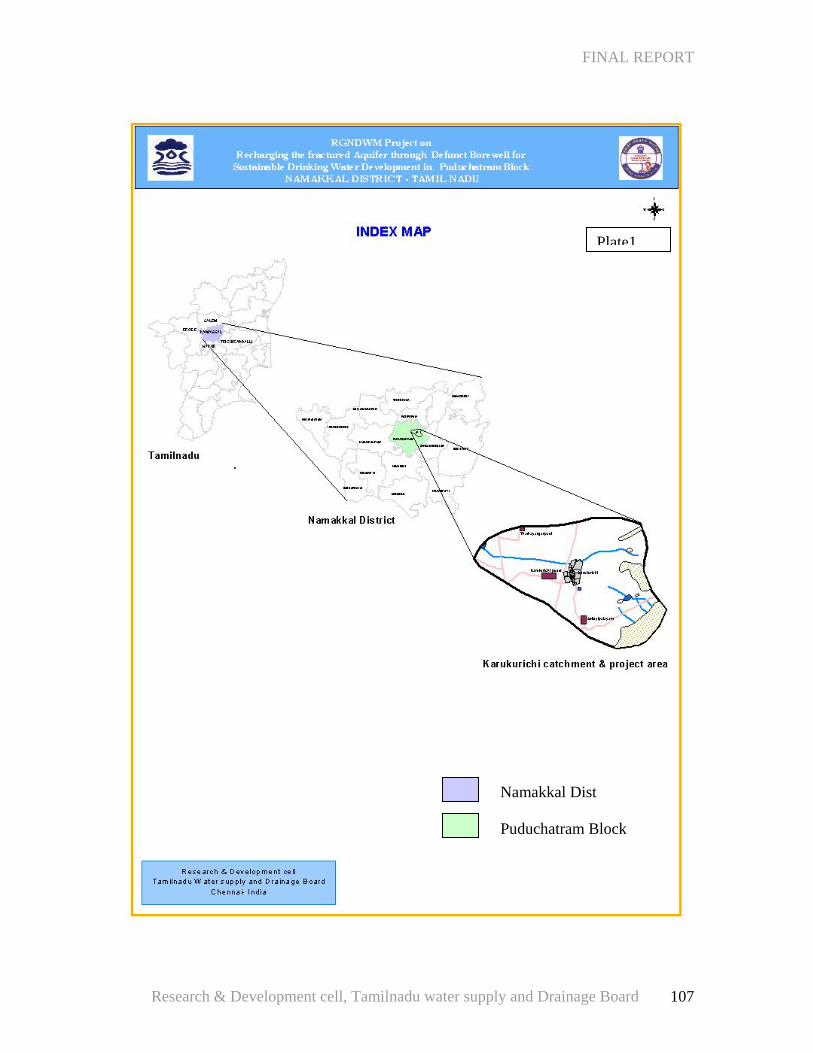
FINAL REPORT
Research & Development cell, Tamilnadu water supp
Namakkal Dist Puduchatram Block
ly and Drainag
Plate1
e Board 107
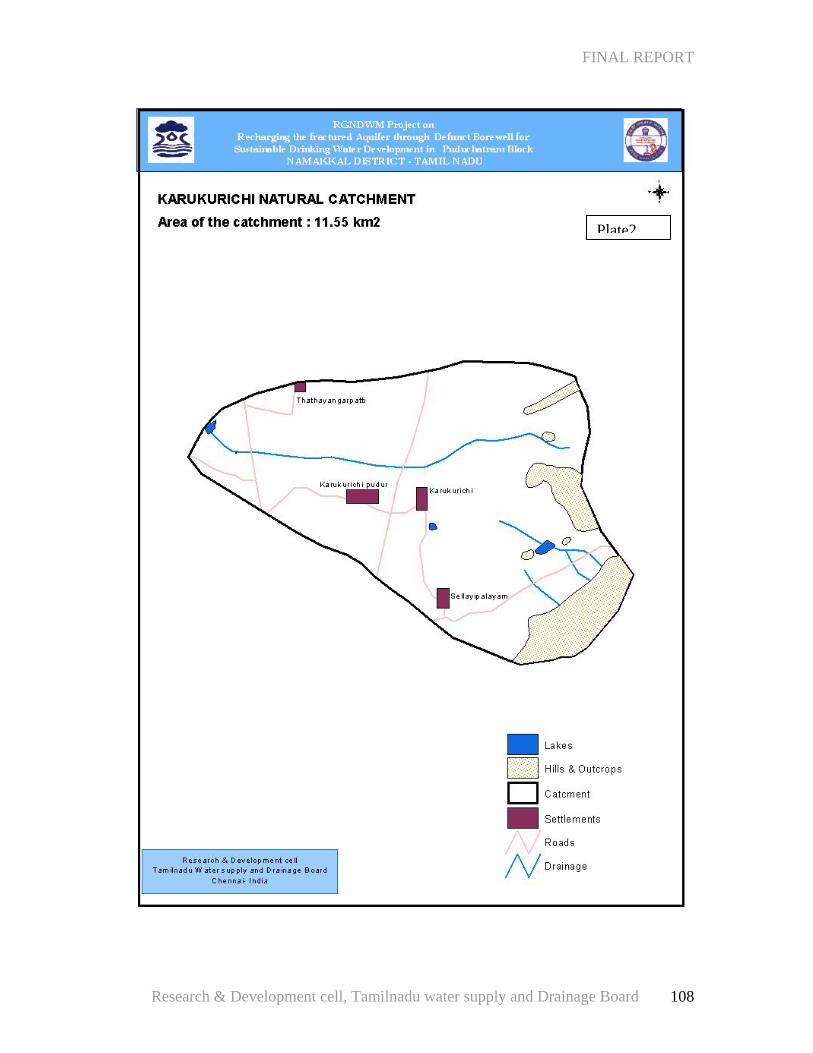
FINAL REPORT
Plate2
Research & Development cell, Tamilnadu water supply and Drainage Board 108
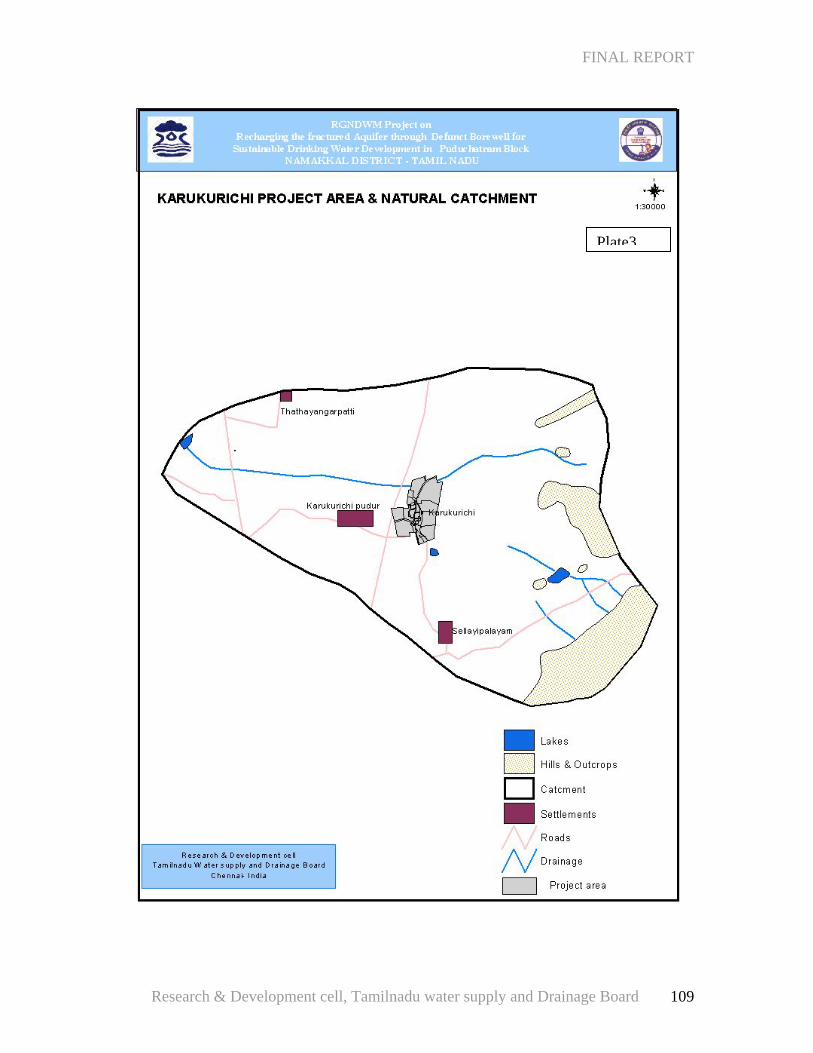
FINAL REPORT
Plate3
Research & Development cell, Tamilnadu water supply and Drainage Board 109
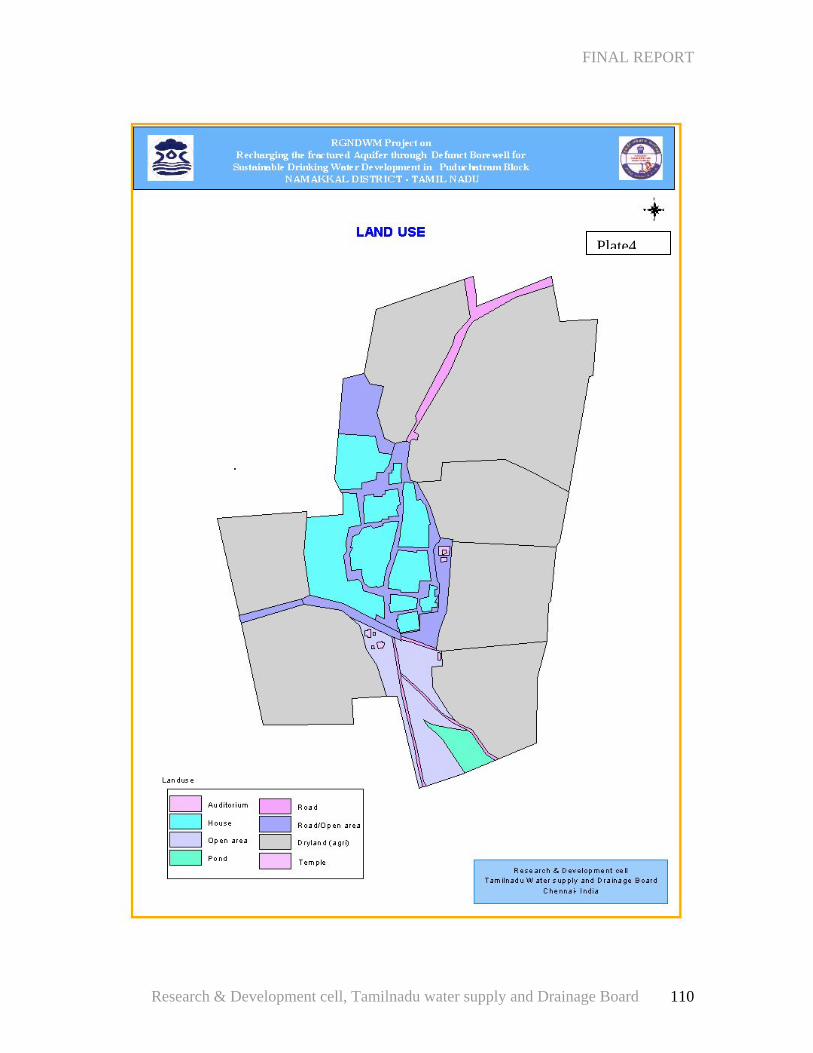
FINAL REPORT
Plate4
Research & Development cell, Tamilnadu water supply and Drainage Board 110
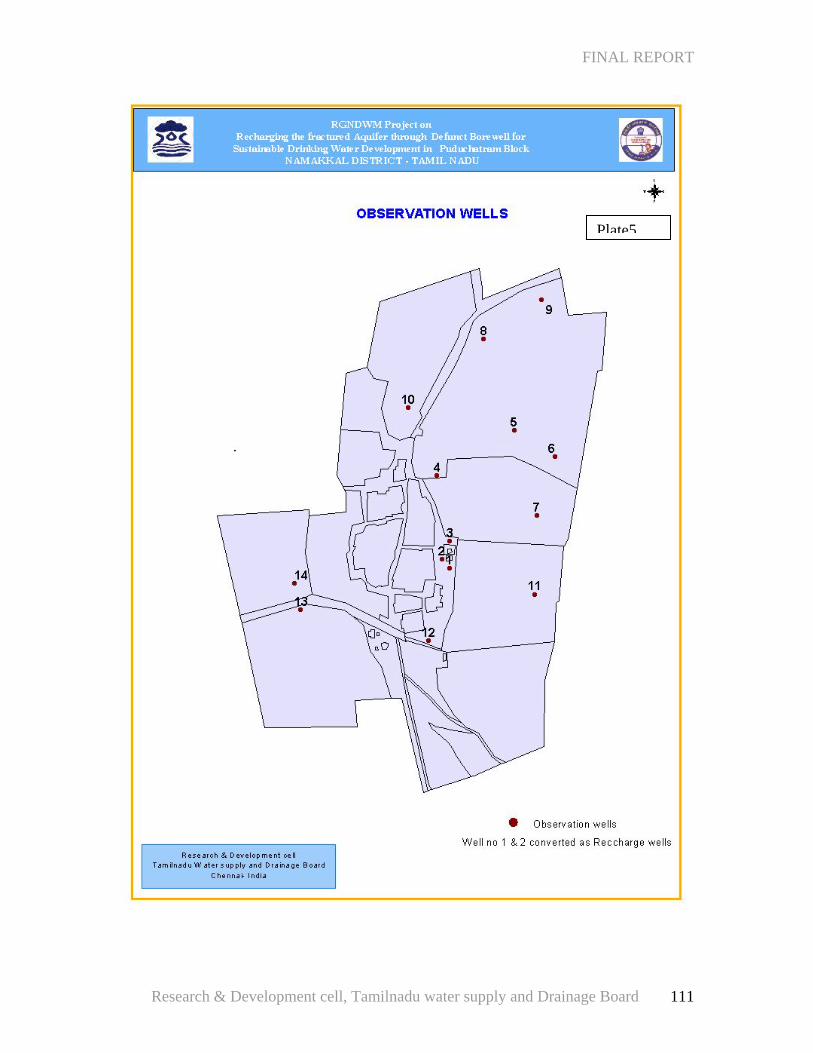
FINAL REPORT
Plate5
Research & Development cell, Tamilnadu water supply and Drainage Board 111
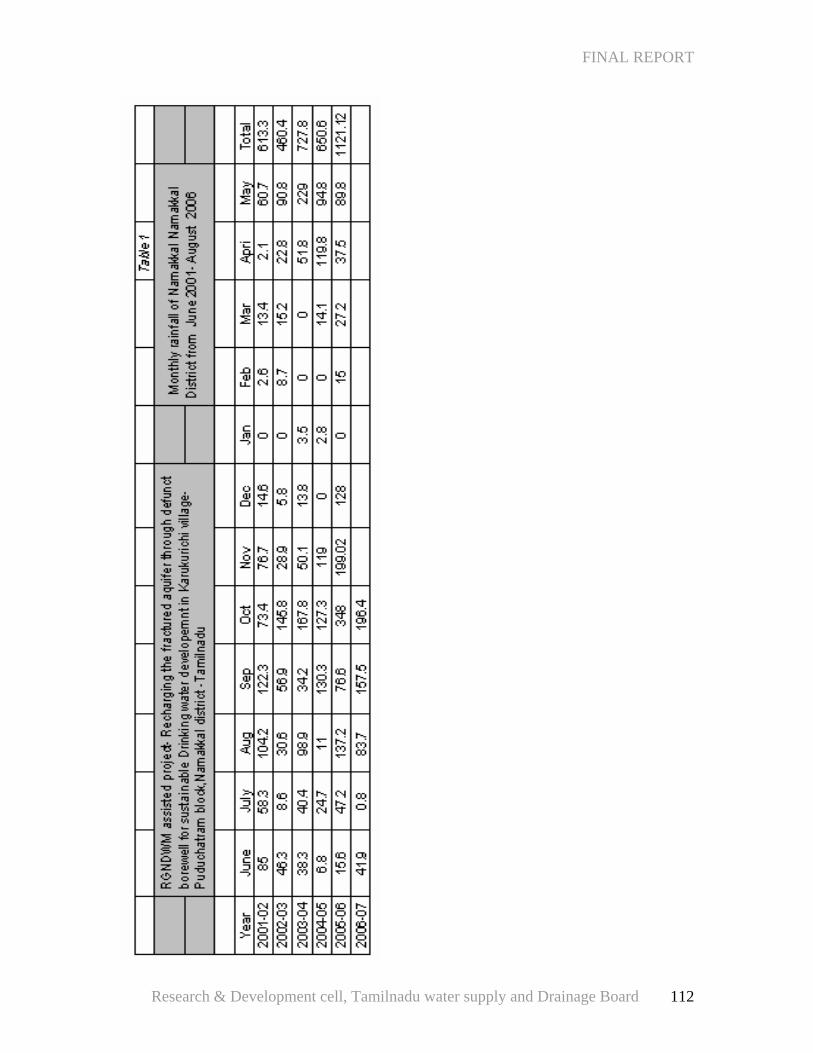
FINAL REPORT
Research & Development cell, Tamilnadu water supply and Drainage Board 112
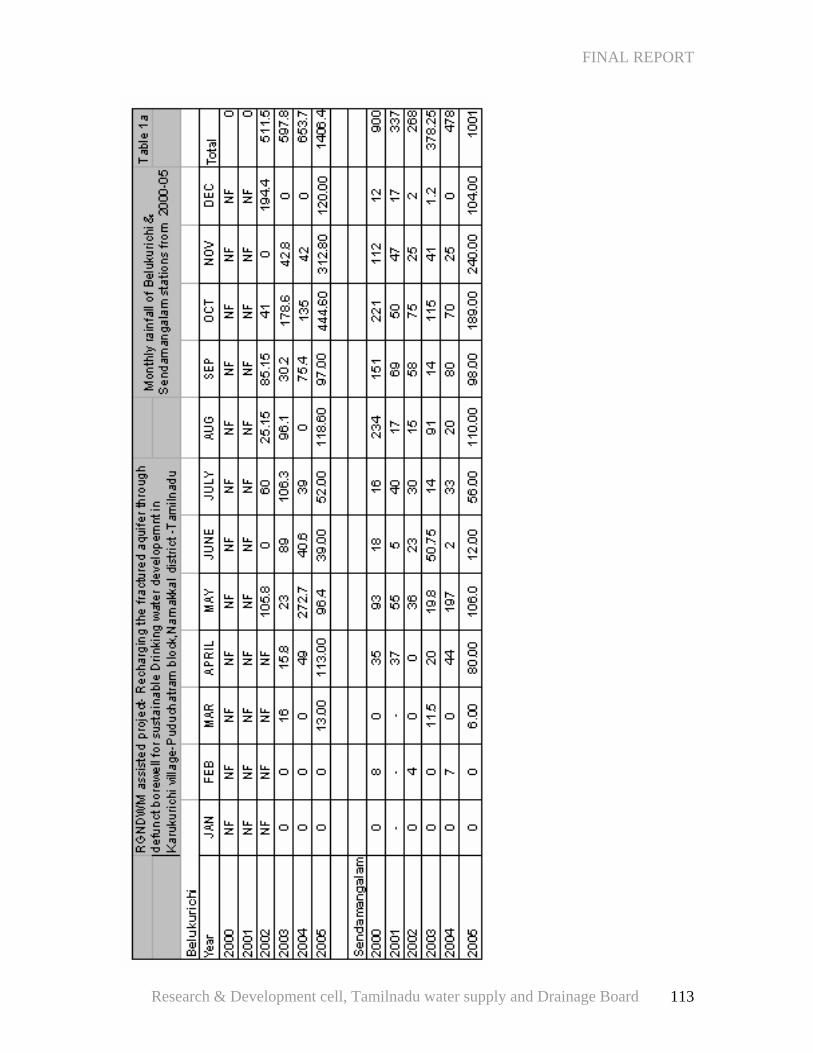
FINAL REPORT
Research & Development cell, Tamilnadu water supply and Drainage Board 113
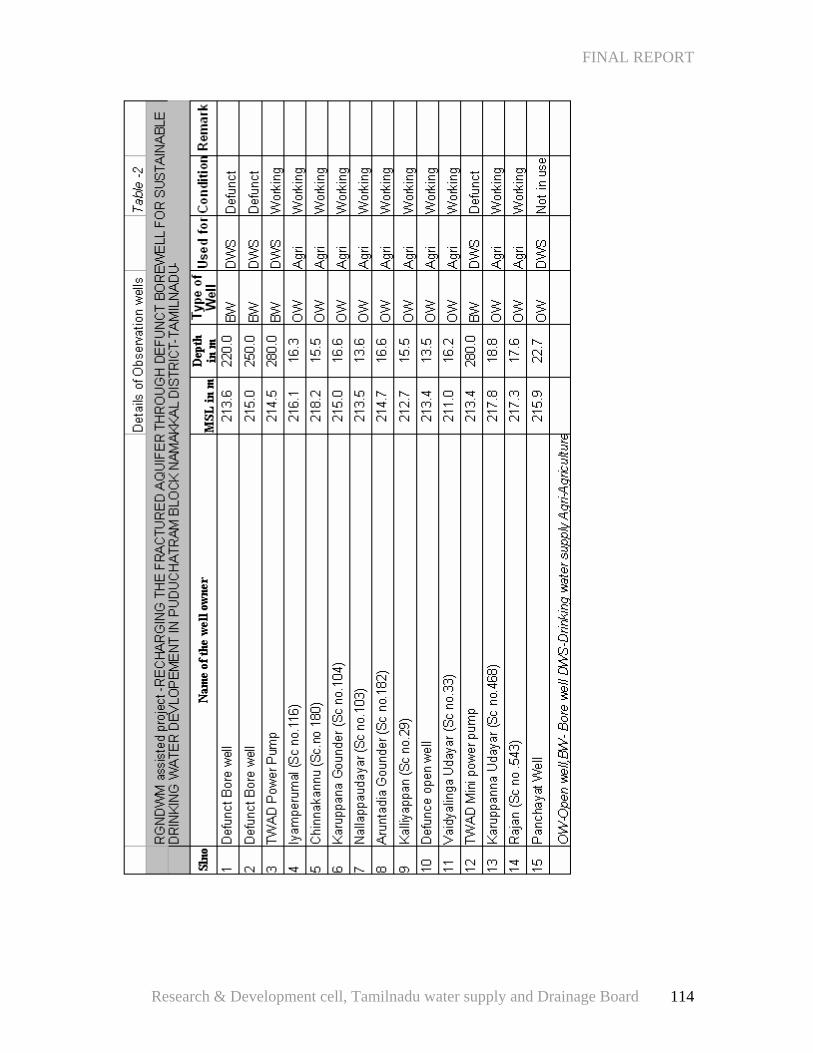
FINAL REPORT
Research & Development cell, Tamilnadu water supply and Drainage Board 114
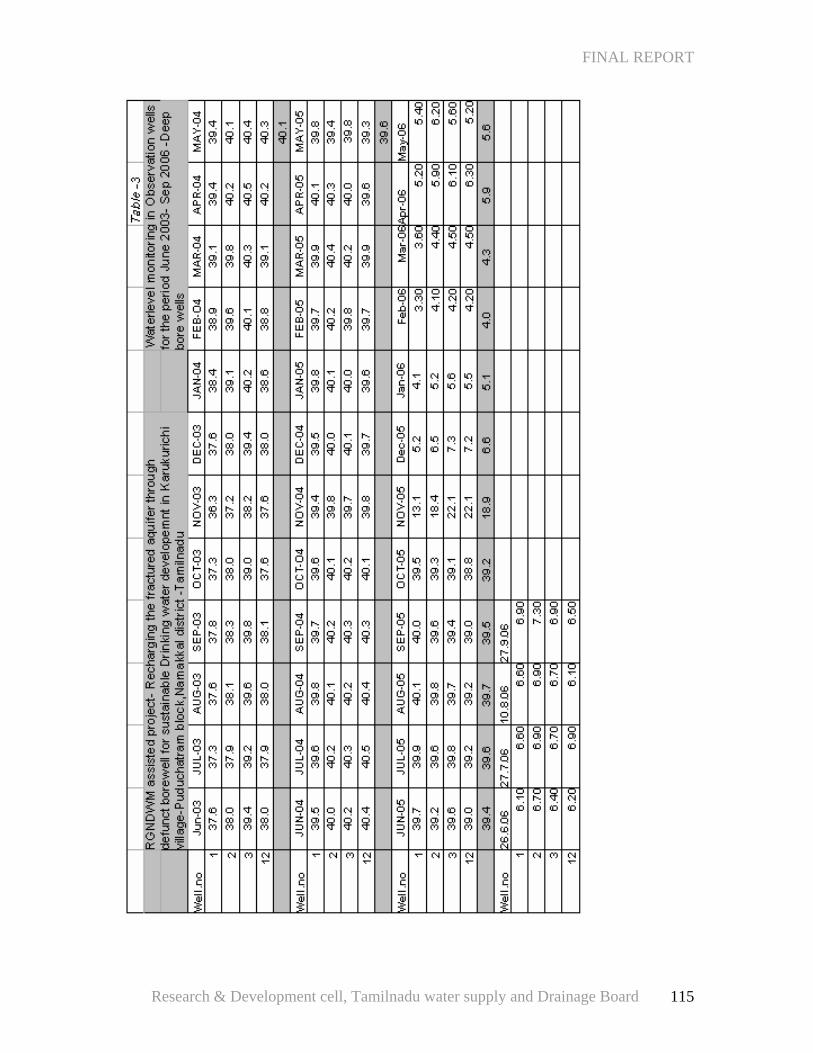
FINAL REPORT
Research & Development cell, Tamilnadu water supply and Drainage Board 115
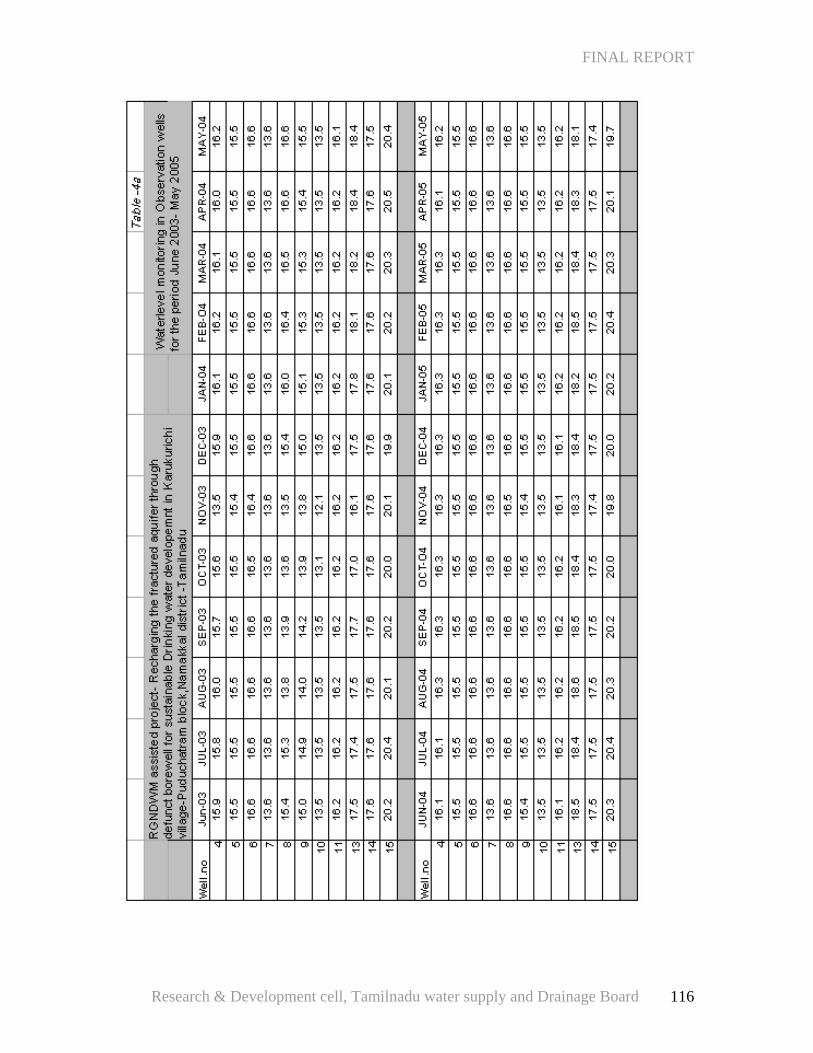
FINAL REPORT
Research & Development cell, Tamilnadu water supply and Drainage Board 116
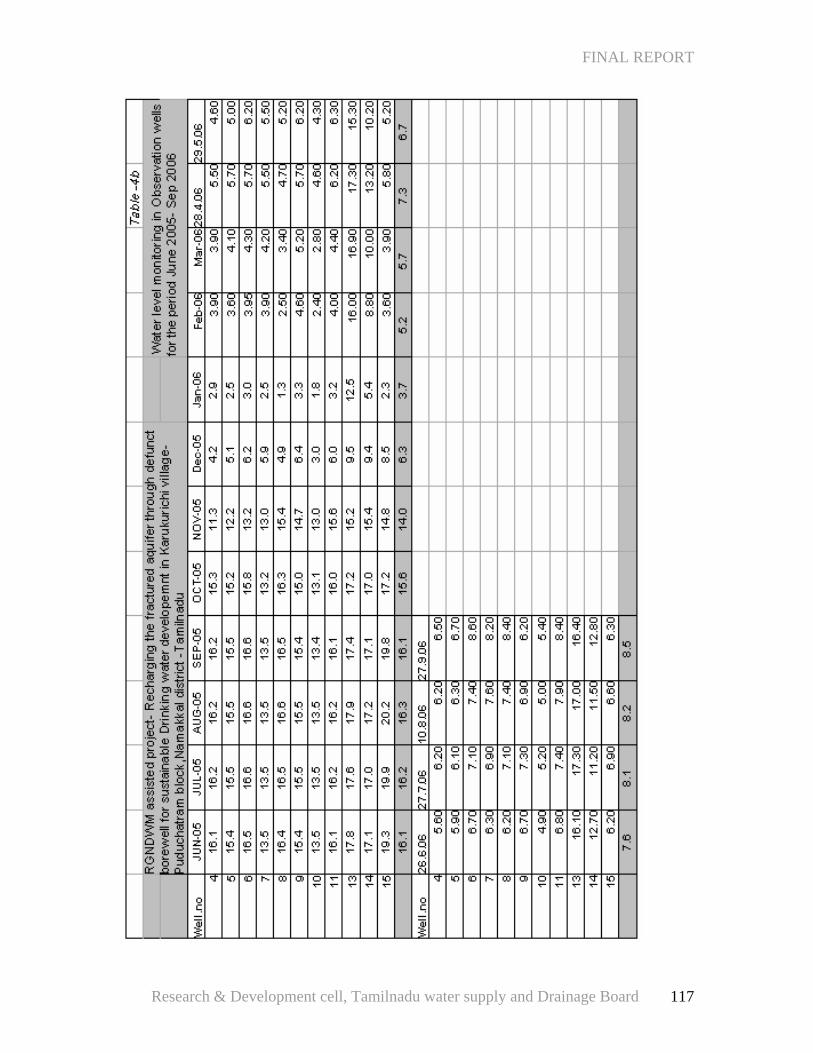
FINAL REPORT
Research & Development cell, Tamilnadu water supply and Drainage Board 117
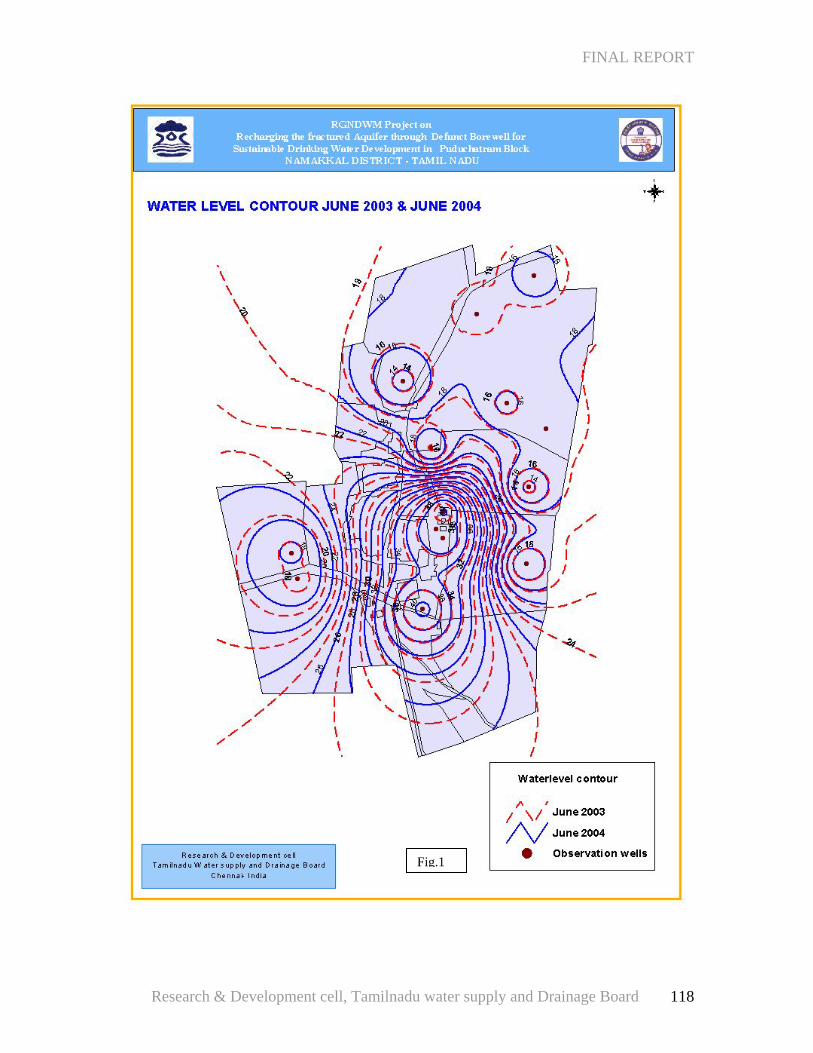
FINAL REPORT
Fig.1
Research & Development cell, Tamilnadu water supply and Drainage Board 118
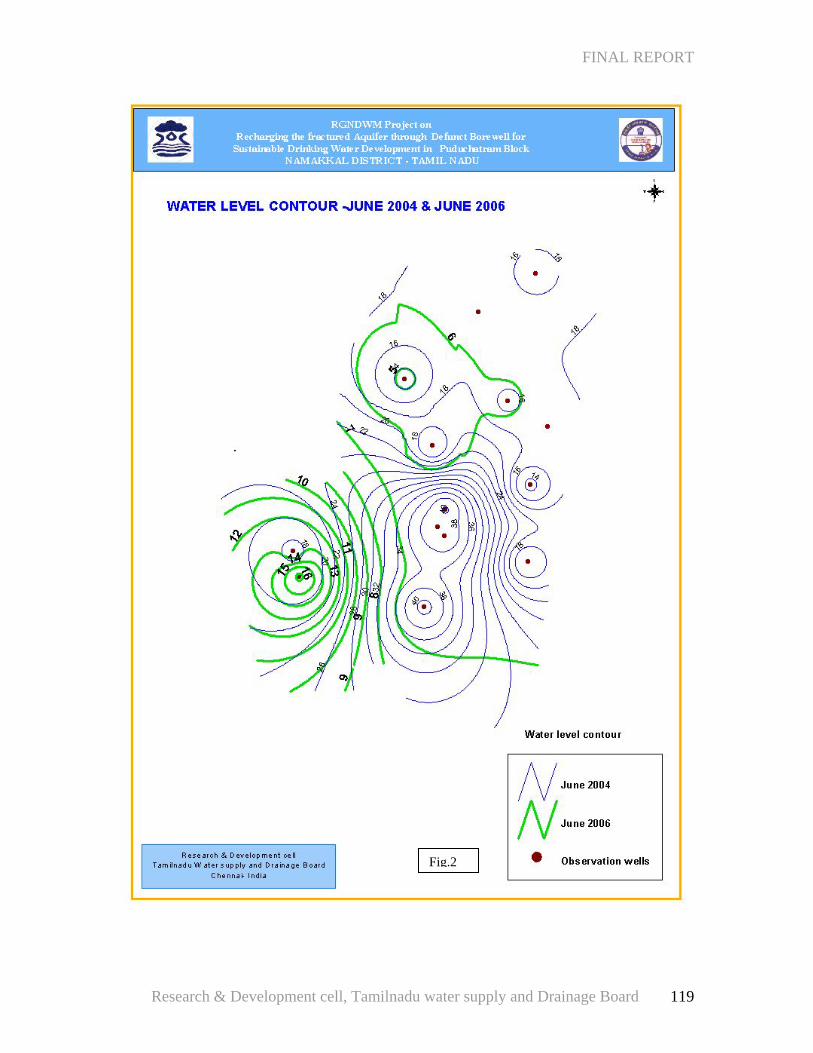
FINAL REPORT
Fig.2
Research & Development cell, Tamilnadu water supply and Drainage Board 119
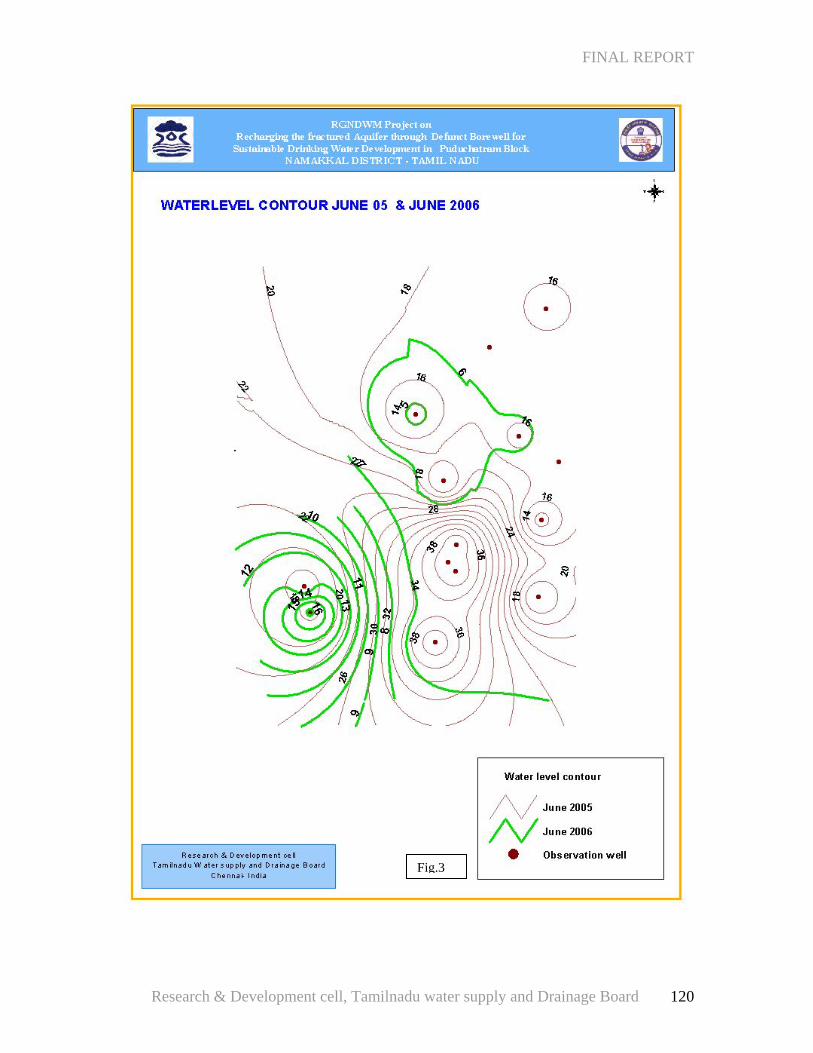
FINAL REPORT
Fig.3
Research & Development cell, Tamilnadu water supply and Drainage Board 120
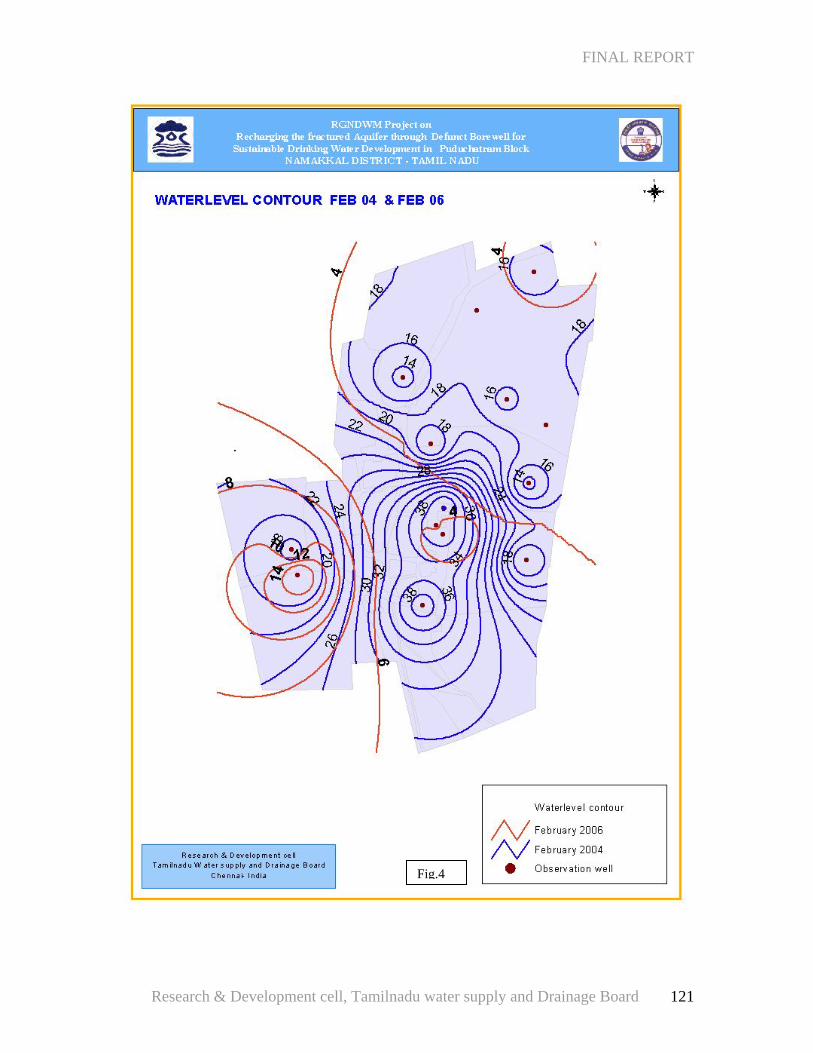
FINAL REPORT
Fig.4
Research & Development cell, Tamilnadu water supply and Drainage Board 121
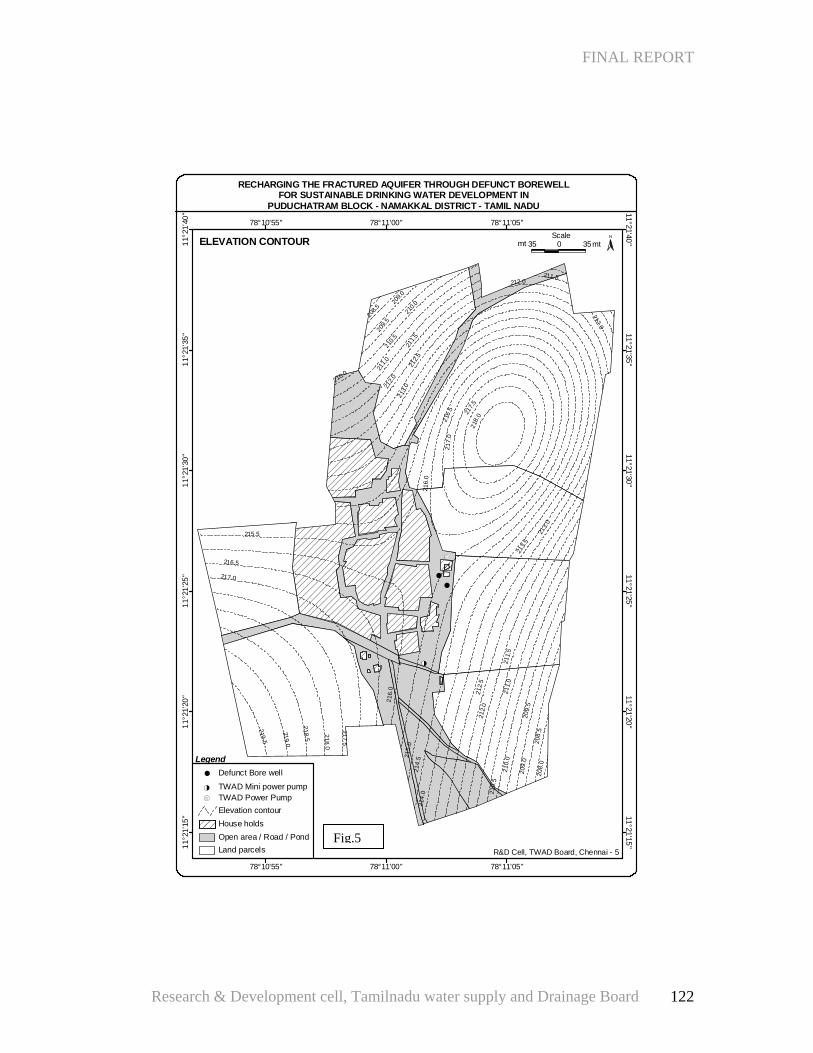
FINAL REPORT
#
#
#·
#³
215.5
213.5
214.
021
4.5
2 13.
021
2.52 1
6.0
210.5
210.0
218. 5
216.
521
7.0
219. 0
209.5
217.5
219.5
209.0
218.
0
212.0
208.5
211.5
208.
0
211.0
215.
0 208.
5
210.0
213.
0
211.
0
209.
0
212.0
218. 0
217.0
216.
0
210.
0
211.5
216.5
212.
5
212.0
209.
5
217.5
210.
5
212.
0
211.
5
11°2
1'15
" 11°21'15"11
°21'
20" 11°21'20"
11°2
1'25
" 11°21'25"11
°21'
30" 11°21'30"
11°2
1'35
" 11°21'35"11
°21'
40" 11°21'40"
78°10'55"
78°10'55"
78°11'00"
78°11'00"
78°11'05"
78°11'05"N
35 0 35mtmtScale
RECHARGING THE FRACTURED AQUIFER THROUGH DEFUNCT BOREWELLFOR SUSTAINABLE DRINKING WATER DEVELOPMENT IN
PUDUCHATRAM BLOCK - NAMAKKAL DISTRICT - TAMIL NADU
ELEVATION CONTOUR
House holdsOpen area / Road / PondLand parcels
Elevation contour
# Defunct Bore well
#³ TWAD Mini power pump#· TWAD Power Pump
Legend
R&D Cell, TWAD Board, Chennai - 5
Fig.5
Research & Development cell, Tamilnadu water supply and Drainage Board 122
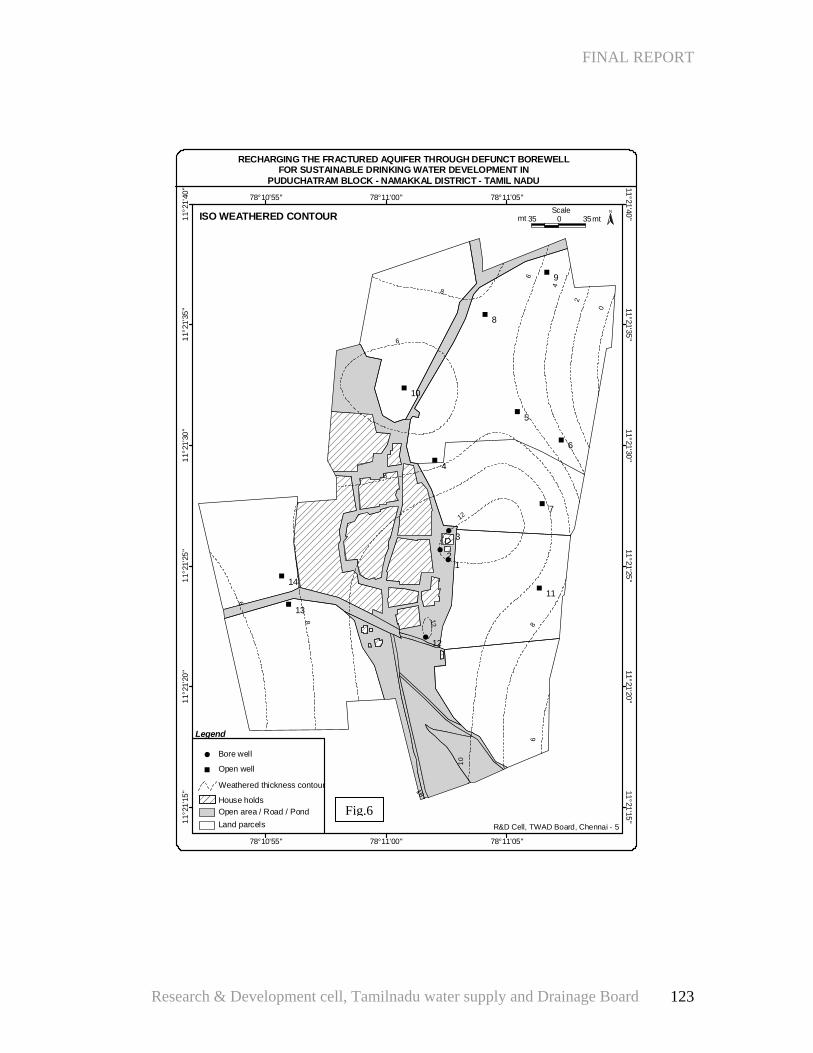
FINAL REPORT
#
#
#
%
%
%
%
%
%
%
%
#
%
%
12
3
4
5
6
8
9
10
7
11
12
13
14
4
2
8
0
6
12
10
6
8
66
8
8
12
10
11°2
1'15
" 11°21'15"11
°21'
20" 11°21'20"
11°2
1'25
" 11°21'25"11
°21'
30" 11°21'30"
11°2
1'35
" 11°21'35"11
°21'
40" 11°21'40"
78°10'55"
78°10'55"
78°11'00"
78°11'00"
78°11'05"
78°11'05"N
35 0 35mtmtScale
RECHARGING THE FRACTURED AQUIFER THROUGH DEFUNCT BOREWELLFOR SUSTAINABLE DRINKING WATER DEVELOPMENT IN
PUDUCHATRAM BLOCK - NAMAKKAL DISTRICT - TAMIL NADU
ISO WEATHERED CONTOUR
Open well%
Bore well#
Weathered thickness contour
Land parcelsOpen area / Road / Pond
Legend
R&D Cell, TWAD Board, Chennai - 5
House holds
Fig.6
Research & Development cell, Tamilnadu water supply and Drainage Board 123
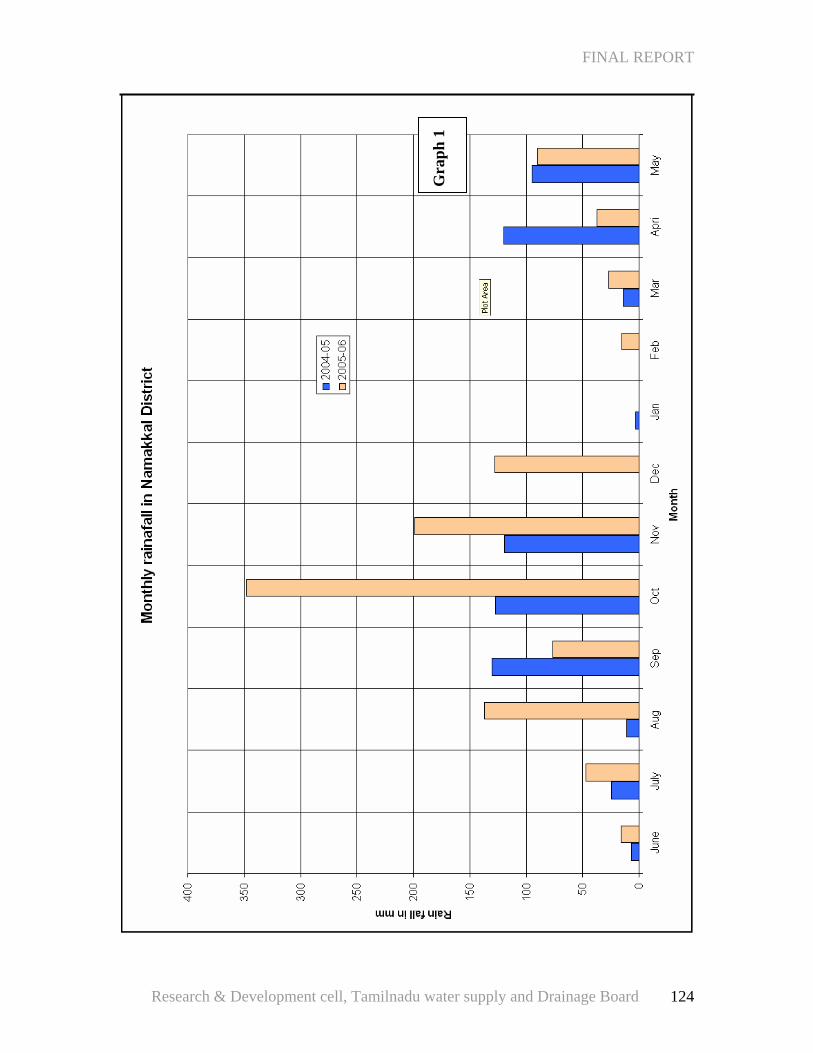
FINAL REPORT
Gra
ph 1
Research & Development cell, Tamilnadu water supply and Drainage Board 124
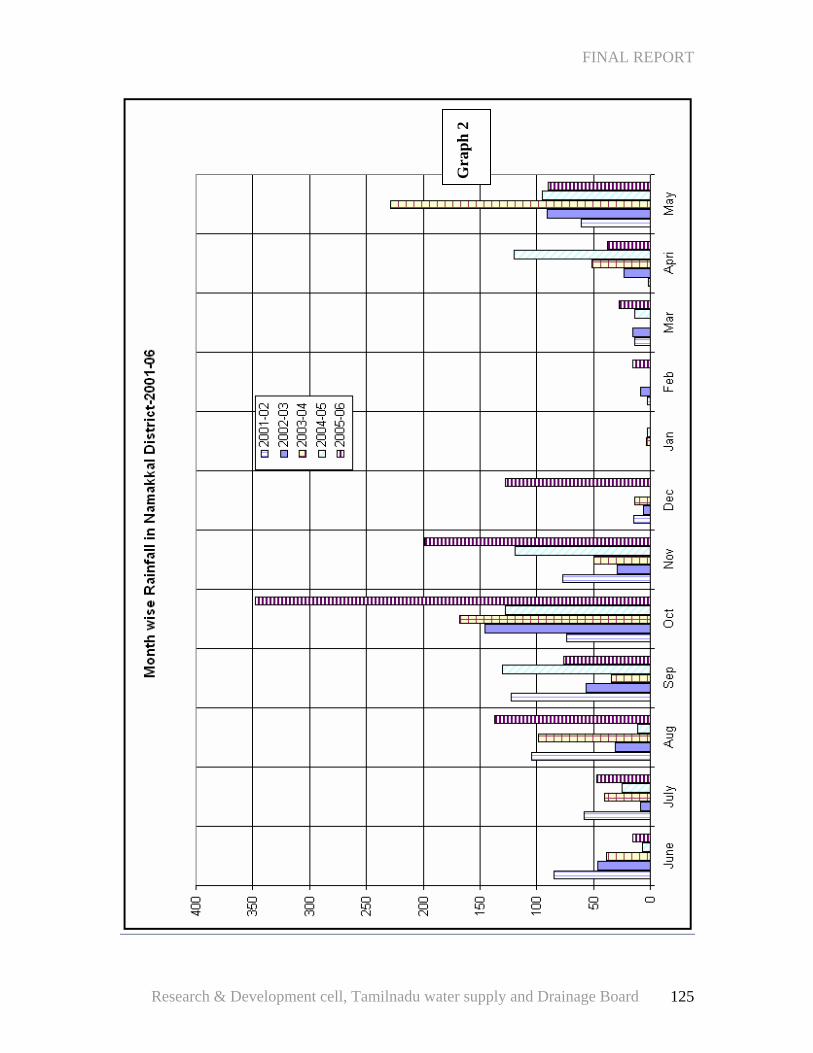
FINAL REPORT
Gra
ph 2
Research & Development cell, Tamilnadu water supply and Drainage Board 125
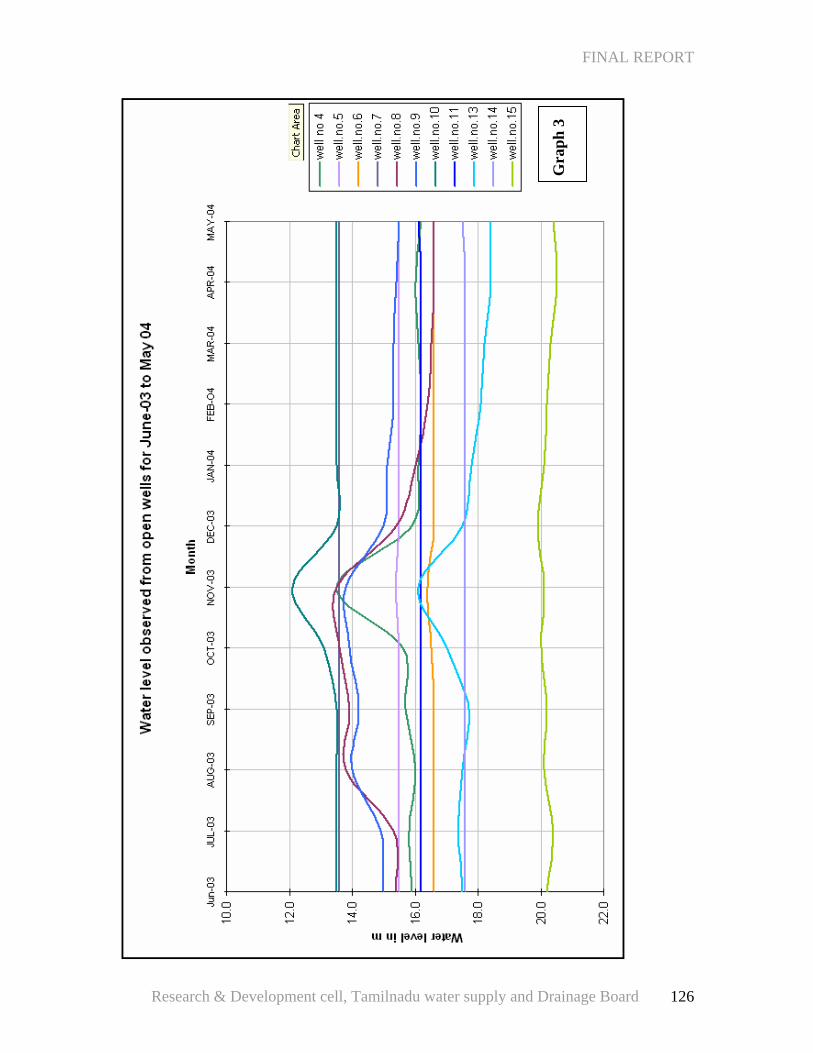
FINAL REPORT
Gra
ph 3
Research & Development cell, Tamilnadu water supply and Drainage Board 126
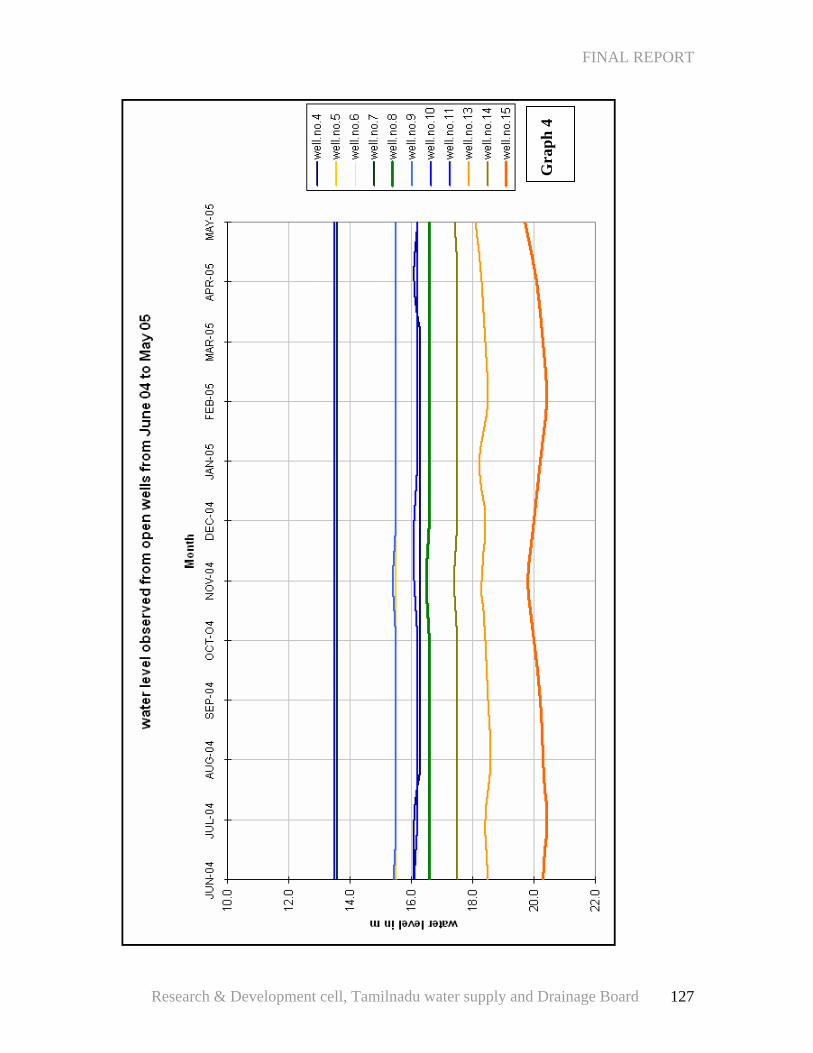
FINAL REPORT
Gra
ph 4
Research & Development cell, Tamilnadu water supply and Drainage Board 127
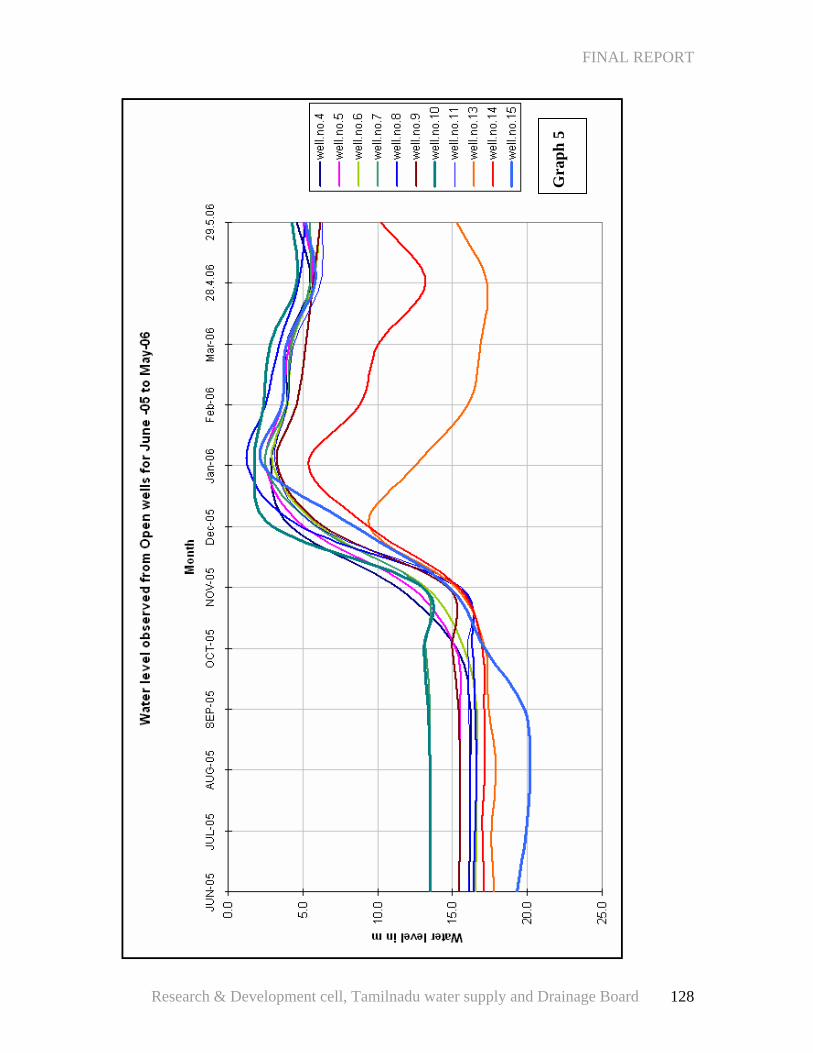
FINAL REPORT
Gra
ph 5
Research & Development cell, Tamilnadu water supply and Drainage Board 128
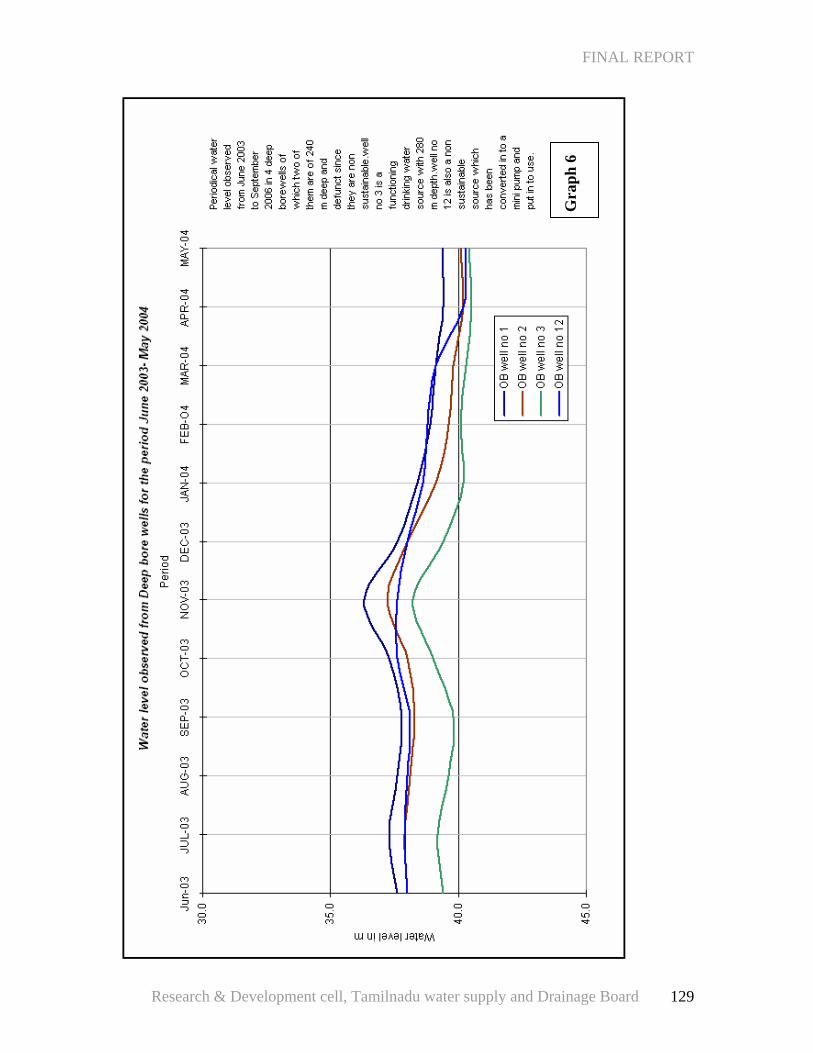
FINAL REPORT
Gra
ph 6
Research & Development cell, Tamilnadu water supply and Drainage Board 129
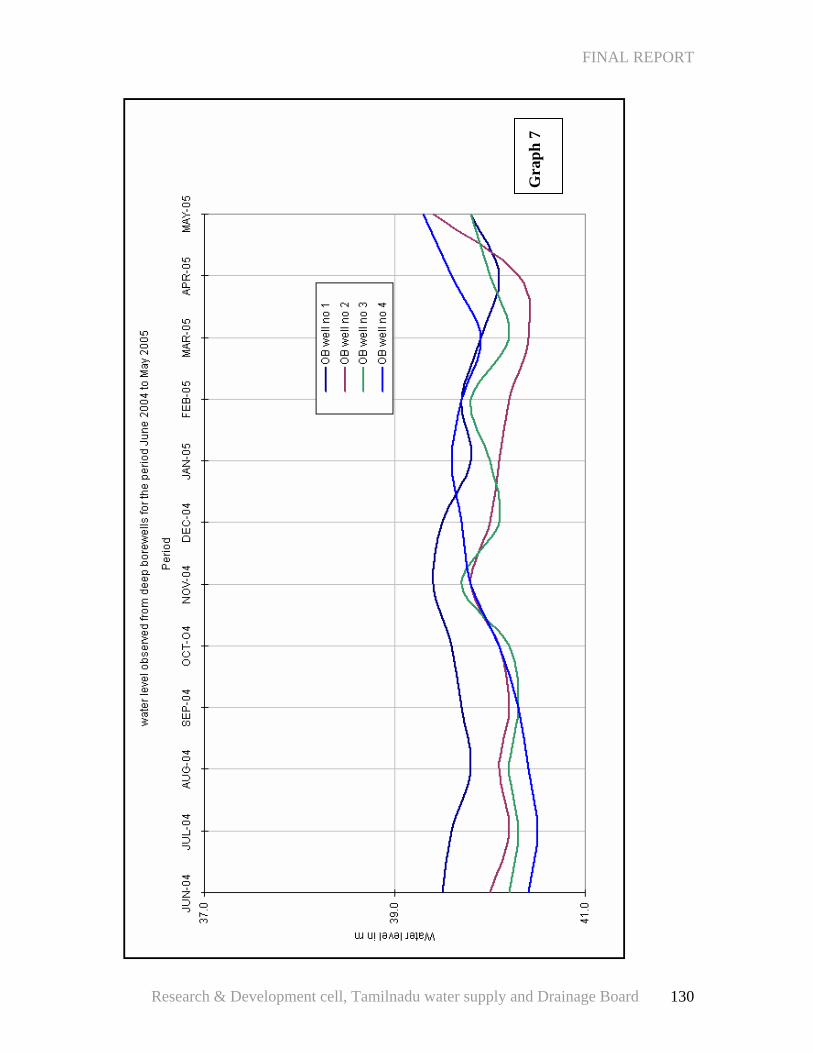
FINAL REPORT
Gra
ph 7
Research & Development cell, Tamilnadu water supply and Drainage Board 130
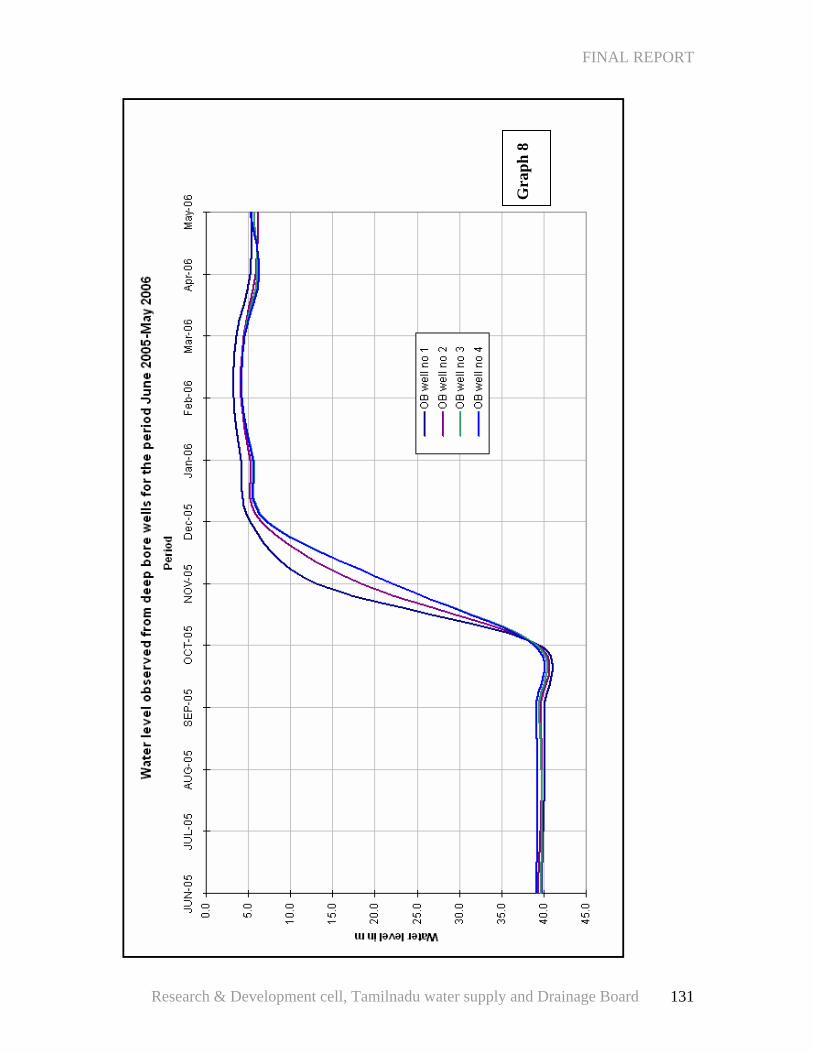
FINAL REPORT
Gra
ph 8
Research & Development cell, Tamilnadu water supply and Drainage Board 131
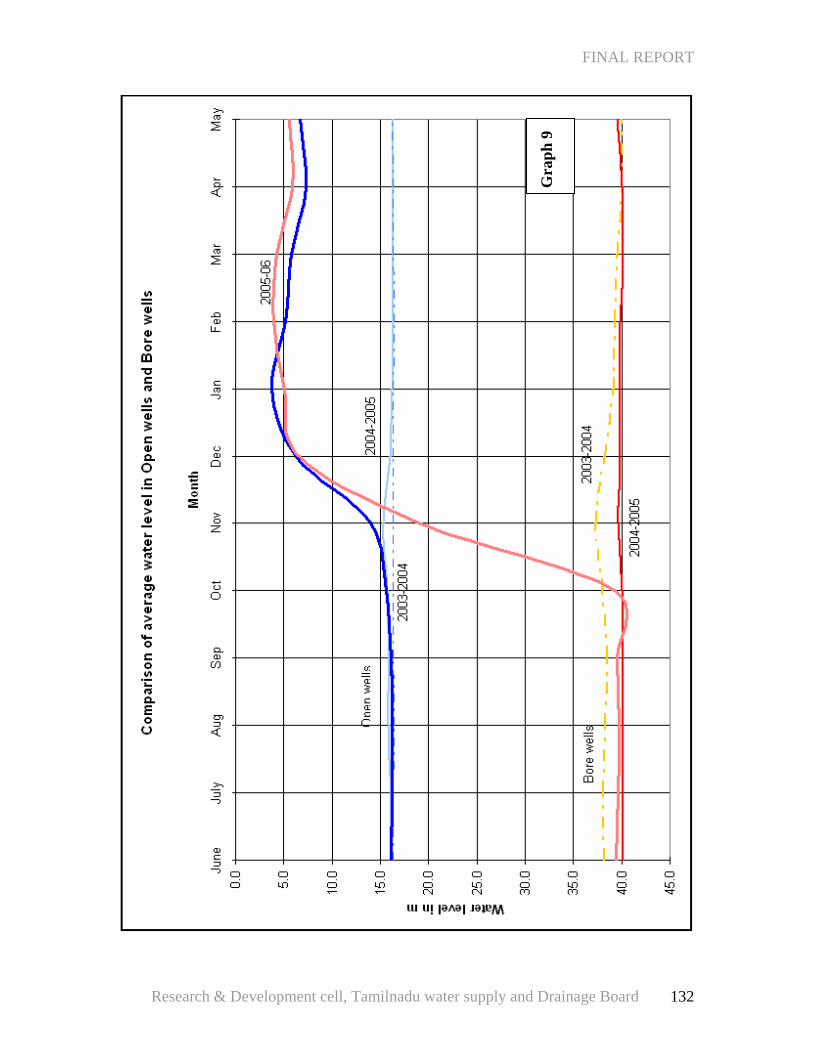
FINAL REPORT
Gra
ph 9
Research & Development cell, Tamilnadu water supply and Drainage Board 132
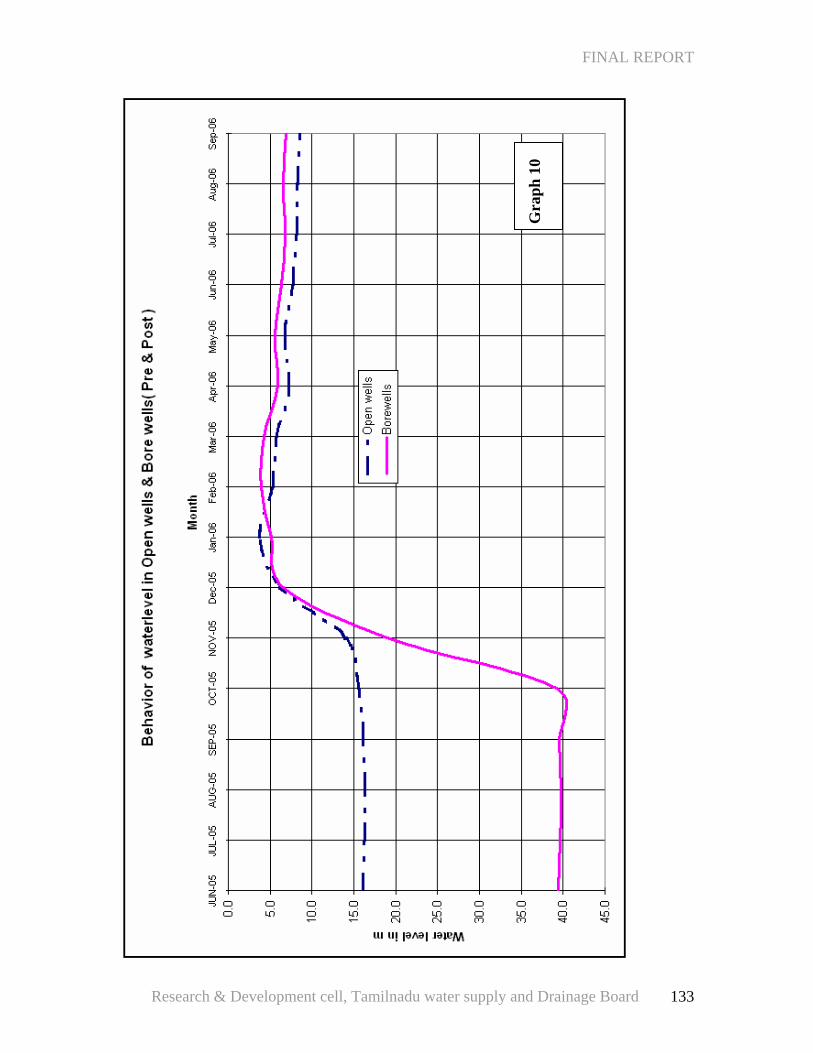
FINAL REPORT
Gra
ph 1
0
Research & Development cell, Tamilnadu water supply and Drainage Board 133
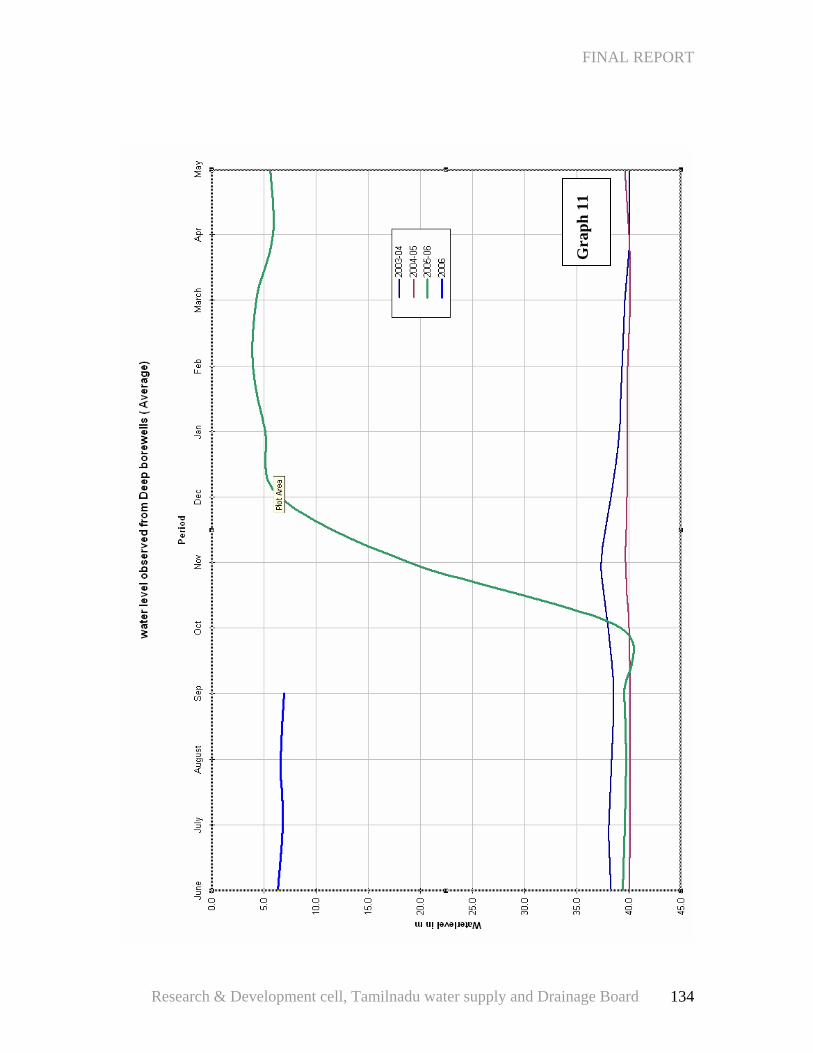
FINAL REPORT
Gra
ph 1
1
Research & Development cell, Tamilnadu water supply and Drainage Board 134

Chapter X b References
FINAL REPORT
References: Karaipottanar watershed study-A macro analysis –Report of the Unicef assisted watershed management study-November 1996 -R&D cell Hydrogeology wing TWAD board Chennai.5 Feasibility study for locating artificial recharge structures in Agrahara valavanthi micro watershed of Karaipottanar watershed February 1997 - R&D cell Hydrogeology wing TWAD board Chennai.5 Influence of percolation pond in Agrahara valavanthi micro watershed. September 1998- R&D cell Hydrogeology wing TWAD board Chennai.5 Deep fracture system study in Valayappatti area –December 1999- R&D cell Hydrogeology wing TWAD board Chennai.5 Groundwater assessment development and management-K.R.Karanth, Director CGWB Bangalore –Tata McGraw-Hill publishing company limited New Delhi 1987 Hydrology and water resources engineering –K.C.Patra College of Engineering and Technology-Bhuvaneswar-Narosa publishing House New Delhi
Groundwater and wells –fletcher.G.Driscoll-1989-Jhonson Filtration systems inc St.paul,Minnesota.
Groundwater –S.Ramakrishnan-CMSSWB-Chennai-1998 Artificial recharge of the underground karstic aquifer Of farsala area (thessaly, central greece)1 Mariolakos, i.2, fountoulis, i., spyridonos, e., mariolakos, d., andreadakis, em. Proceedings of the 10th biennial symposium on the artificial recharge of groundwater, tucson, az, June 7-9, 2001 Geometry of groundwater table in Narthakion Mt (Thessaly) as a result of neotectonic deformation- Mariolakos I., Fountoulis I., Spyridonos E., Badekas, I., Andreadakis Emm., 20001st Panhell. Congr. Ass. Hellen. Hydrotech. Union, Athens:343-350. . Study for the development of groundwater in the Thessaly plain, sogreah grenoble, Final report. R 11971. Hellenic Ministry of Agriculture, 1974 "BPA-Solicited Technical Review of "Echo Meadows Project Winter Artificial Recharge: Final Report for 2001 Baseline"", 2004 Technical Report, Morgan, David, -Project No. 200101500, 26 Bonneville Power Administration P.O. Box 3621 Portland, OR 97208 A Historical Overview of Hydrologic Studies of Artificial Recharge in the U. S. Geological Survey E. P. Weeks ([email protected]) U.S. Geological Survey, P.O. Box 25046, MS 413, Denver Federal Center, Lakewood, Colorado 80225
Research & Development cell, Tamilnadu water supply and Drainage Board 138

FINAL REPORT
The Role of Unsaturated Flow in Artificial Recharge Projects -Alan L. Flint ([email protected]) U.S. Geological Survey, Placer Hall, 6000 J Street, Sacramento, California 95819-6129 Organic Matter in Ground Water -George Aiken ([email protected])- U.S. Geological Survey, 3215 Marine Street, Boulder, Colorado 80303 Using chemical and isotopic tracers to assess hydrogeological processes and properties in aquifers intended for injection and recovery of imported water-John Izbicki ([email protected]) U.S. Geological Survey, 5735 Kearny Villa Road, Suite O, San Diego, California 92123 Feasibility of Regional-Scale Aquifer Storage and Recovery (ASR): Scientific Uncertainties -Carl R. Goodwin ([email protected]) U.S. Geological Survey, 227 N. Bronough St., Suite 3015, Tallahassee, Florida 32301 Artificial Recharge through a Thick, Heterogeneous Unsaturated Zone near an Intermittent Stream in the Western Part of the Mojave Desert, California By: John A. Izbicki ([email protected]) and Christina L. Stamos ([email protected]) U.S. Geological Survey, 5735 Kearny Villa Road, Suite O, San Diego, California 92123 Aquifer storage and recovery issues and concepts- R.david G.Pyne ASR system LLC- St John river water management system. Water Services-1997–2001Evaluation Report Hallvard Ødegaard Nicholas Booker Final Report Reetta Kuronen (ed.) National Technology Agency Technology Programme Report 6/2002 Helsinki 2002 Freshwater- A challenge for research and innovation, a concerted European response July 1998 Impact assessment of aquifer recharge -Luciana Sinisi National Environmental Protection Agency, Via Vitaliano Brancati 48, 00144 Roma, Italia Ensuring sustainable drinking water sources in rural area- Application of integrated technology alternatives-M.Devarajan Manager GIS & Deputy Hydro geologist R&D Tamilnadu water supply and Drainage Board, Chennai 5 – Proceedings of the National seminar on Hydrocare 2007-Annamalai University Tamilnadu.
Research & Development cell, Tamilnadu water supply and Drainage Board 139
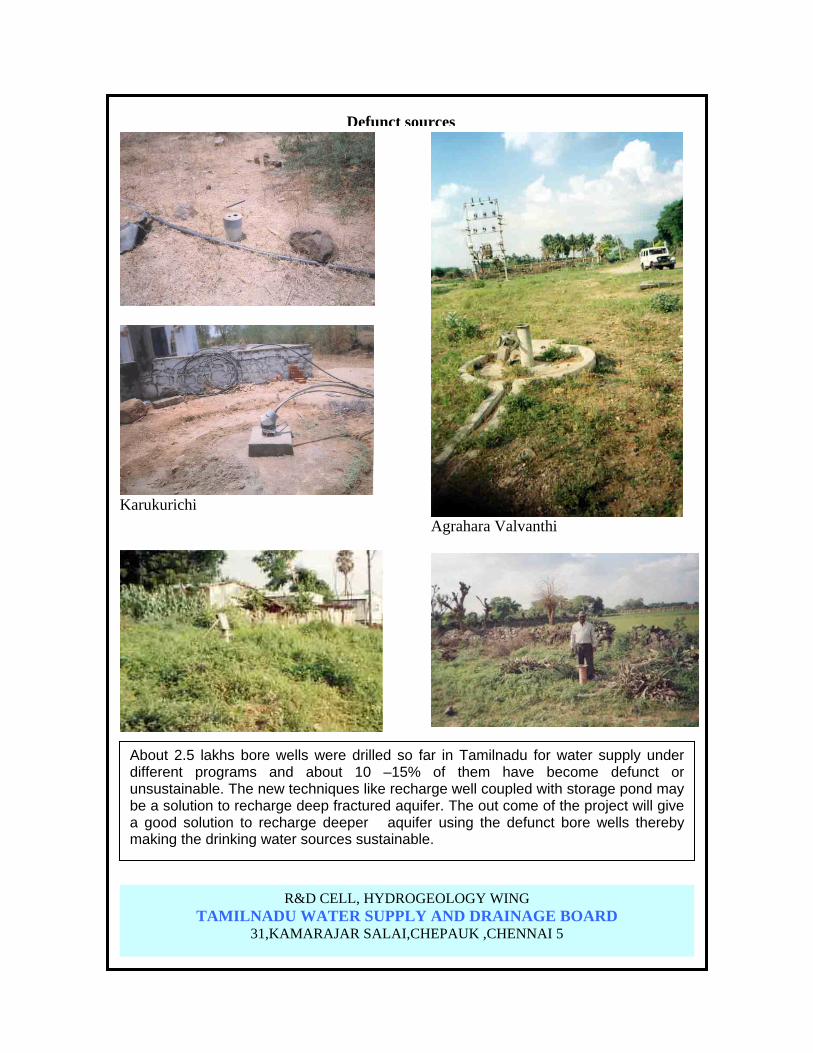
Karukurichi
Defunct sources
Agrahara Valvanthi
About 2.5 lakhs bore wells were drilled so far in Tamilnadu for water supply under
different programs and about 10 –15% of them have become defunct or unsustainable. The new techniques like recharge well coupled with storage pond may be a solution to recharge deep fractured aquifer. The out come of the project will give a good solution to recharge deeper aquifer using the defunct bore wells thereby making the drinking water sources sustainable.
R&D CELL, HYDROGEOLOGY WING TAMILNADU WATER SUPPLY AND DRAINAGE BOARD
31,KAMARAJAR SALAI,CHEPAUK ,CHENNAI 5