Embed Size (px)
Citation preview

Reciprocating Compressor Rod PackingLessons Learned from the
Natural Gas STAR Program
Chevron Corporation,New Mexico Oil and Gas Association,
Texas Oil and Gas Association
Technology Transfer Workshop Midland, Texas
July 23, 2008
epa.gov/gasstar

Industry Emissions: Production, Gathering, and Boosting
Source: EPA. Inventory of U.S. Greenhouse Gas Emissions and Sinks 1990 – 2006. April, 2008. Available on the web at: epa.gov/climatechange/emissions/usinventoryreport.htmlNote: Natural Gas STAR reductions from gathering and boosting operations are reflected in the production sector.
Pneumatic Devices48 Bcf
Dehydrators and Pumps
13 Bcf
Meters andPipeline Leaks
8 Bcf
Compressor Fugitives, Venting, and Engine
Exhaust13 Bcf
Offshore Operations
29 Bcf
Storage Tank Venting6 Bcf
Other Sources
8 Bcf
Well Venting and Flaring
8 Bcf
1
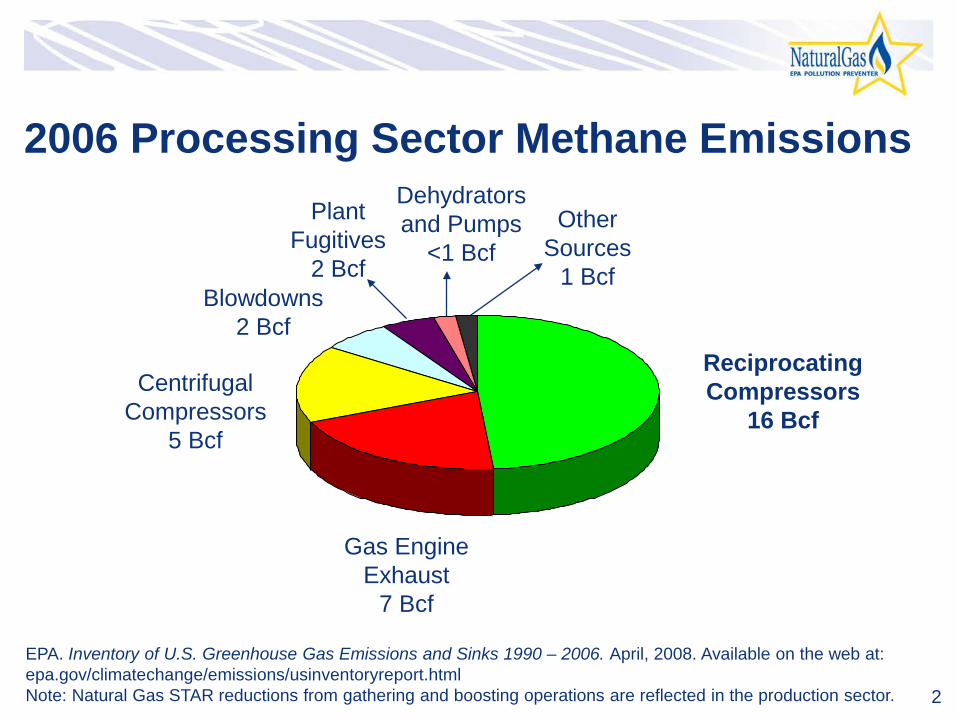
2006 Processing Sector Methane Emissions
CentrifugalCompressors
5 Bcf
Blowdowns2 Bcf
Gas Engine Exhaust
7 Bcf
ReciprocatingCompressors
16 Bcf
Plant Fugitives
2 Bcf
Other Sources
1 Bcf
Dehydrators and Pumps
<1 Bcf
EPA. Inventory of U.S. Greenhouse Gas Emissions and Sinks 1990 – 2006. April, 2008. Available on the web at: epa.gov/climatechange/emissions/usinventoryreport.htmlNote: Natural Gas STAR reductions from gathering and boosting operations are reflected in the production sector. 2

Compressor Methane Emissions What is the problem?
Methane emissions from the ~51,500 compressors in the natural gas industry account for 89 Bcf/year or about 24% of all methane emissions from the natural gas industry
CompressorStation
CompressorStation
Production
38,500 CompressorsProcessing
5,000 CompressorsTransmission & Storage
8,000 CompressorsDistribution
0 Compressors
CompressorStation
3
Methane Savings from Compressors: Agenda
Reciprocating CompressorsMethane LossesMethane SavingsIndustry Experience
Discussion
4
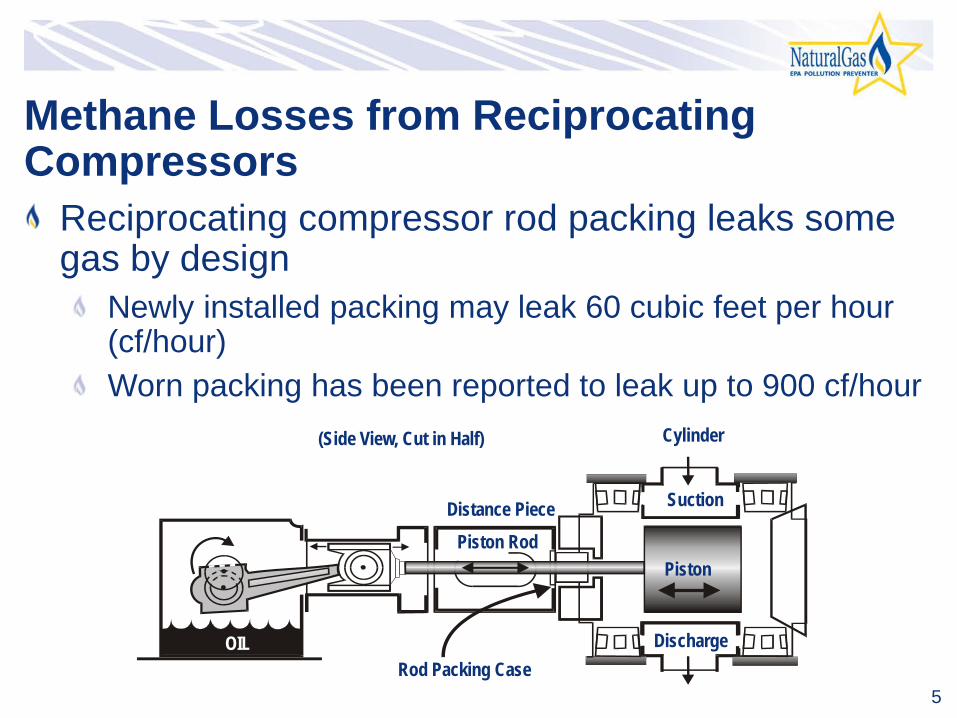
Methane Losses from Reciprocating Compressors
Reciprocating compressor rod packing leaks some gas by design
Newly installed packing may leak 60 cubic feet per hour (cf/hour)Worn packing has been reported to leak up to 900 cf/hour
Distance PiecePiston Rod
(Side View, Cut in Half)
OIL
Cylinder
Suction
Discharge
Piston
Rod Packing Case5
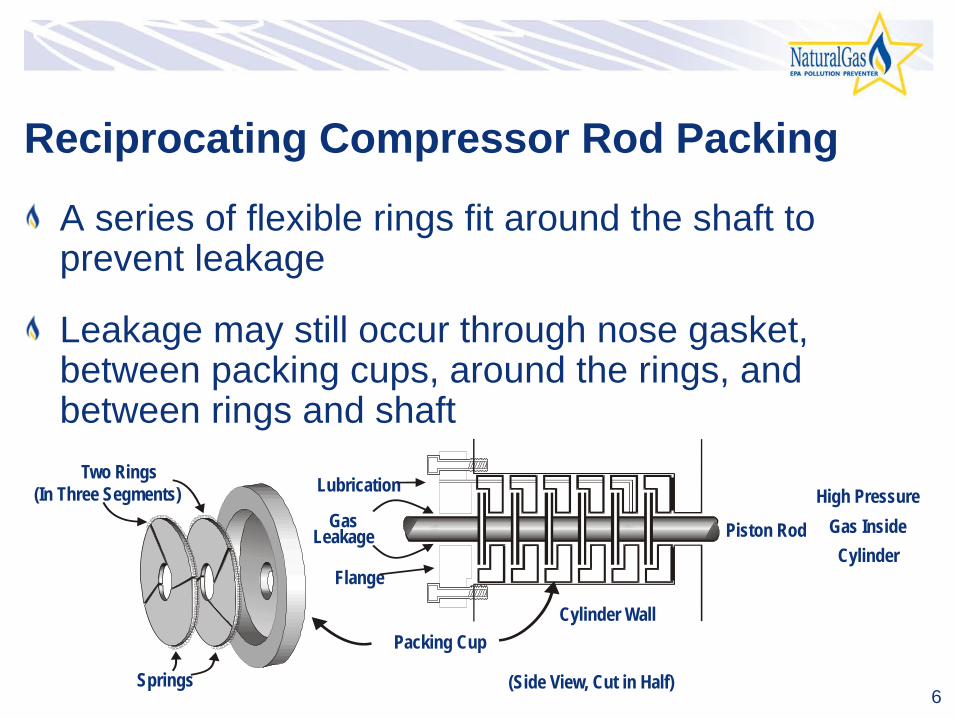
Reciprocating Compressor Rod Packing
A series of flexible rings fit around the shaft to prevent leakage
Leakage may still occur through nose gasket, between packing cups, around the rings, and between rings and shaft
Lubrication
Flange
GasLeakage
(Side View, Cut in Half)
Cylinder Wall
High Pressure Gas Inside
Cylinder
Two Rings(In Three Segments)
Springs
Packing Cup
Piston Rod
6

Impediments to Proper SealingWays packing case can leak
Nose gasket (no crush)Packing to rod (surface finish)Packing to cup (lapped surface)Packing to packing (dirt/lube)Cup to cup (out of tolerance)
What makes packing leak?
Dirt or foreign matter (trash)Worn rod (.0015”/per inch dia.)Insufficient/too much lubricationPacking cup out of tolerance (≤ 0.002”)Improper break-in on startupLiquids (dilutes oil)Incorrect packing installed (backward or wrong type/style)
7

Methane Losses from Rod Packing
PRCI/ GRI/ EPA. Cost Effective Leak Mitigation at Natural Gas Transmission Compressor Stations
Emission from Running Compressor 99 cf/hour-packingEmission from Idle/Pressurized Compressor 145 cf/hour-packing
Leakage from Idle Compressor Packing Cup 79 cf/hour-packingLeakage from Idle Compressor Distance Piece 34 cf/hour-packing
Packing Type Bronze Bronze/Steel Bronze/Teflon Teflon
Leak Rate (cf/hour) 70 63 150 24
Packing Type Bronze Bronze/Steel Bronze/Teflon Teflon
Leak Rate (cf/hour) 70 N/A 147 22
Leakage from Rod Packing on Running Compressors
Leakage from Rod Packing on Idle/Pressurized Compressors
8

Steps to Determine Economic Replacement
Measure rod packing leakageWhen new packing installed – after worn-inPeriodically afterwards
Determine cost of packing replacementCalculate economic leak reductionReplace packing when leak reduction expected will pay back cost
9

Cost of Rod Packing Replacement
Assess costs of replacementsA set of rings: $ 135 to $ 1,080(with cups and case) $ 1,350 to $ 2,500Rods: $ 2,430 to $13,500
Special coatings such as ceramic, tungsten carbide, or chromium can increase rod costs
Source: CECO
10

Calculate Economic Leak Reduction
Determine economic replacement thresholdPartners can determine economic threshold for all replacementsThis is a capital recovery economic calculation
( )GPHDFCR∗∗∗ 000,1Economic Replacement Threshold (cf/hour) =
Where:CR = Cost of replacement ($)
DF = Discount factor at interest i =
H = Hours of compressor operation per yearGP = Gas price ($/thousand cubic feet)
1)1()1(−+
+= n
n
iiiDF
11

Economic Replacement Threshold
Example: Payback calculations for new rings and rod replacement
CR = $1,620 for rings + $9,450 for rodCR = $11,070HR = 8,000 hours per yearGP = $7/Mcf
DF @ i = 10% and n = 1 year
DF @ i = 10% and n = 2 years
( )( )
( ) 1.10.1
0.1111.1
1.10.110.11
0.110.1DF 1
1==
−=
−+
+=
hour per scf 217 7$000,8
000,11.1070,11$
=
×××=
ER
( )( )
( ) 576.00.21
0.12111.21
1.210.110.11
0.110.1DF 2
2==
−=
−+
+=
One year payback
12

Is Rod Packing Replacement Profitable?Replace packing when leak reduction expected will pay back cost
“leak reduction expected” is the difference between current leak rate and leak rate with new rings
Based on 10% interest rateMcf = thousand cubic feet
Rod and RingsRings: $1,620Rod: $9,450Gas: $7/McfOperating: 8,000 hours/year
Rings OnlyRings: $1,620Rod: $0Gas: $7/McfOperating: 8,000 hours/year
Leak Reduction Expected (cf/hour)
Payback(months)
55 729 1220 1816 22
Leak Reduction Expected (cf/hour)
Payback(months)
376197137108
7131822
13

Industry Experience – Northern Natural Gas
Monitored emission at two locationsUnit A leakage as high as 301 liters/min (640 cf/hour)Unit B leakage as high as 105 liters/min (220 cf/hour)
Installed Low Emission Packing (LEP)Testing is still in progress After 3 months, leak rate shows zero leakage increase
14
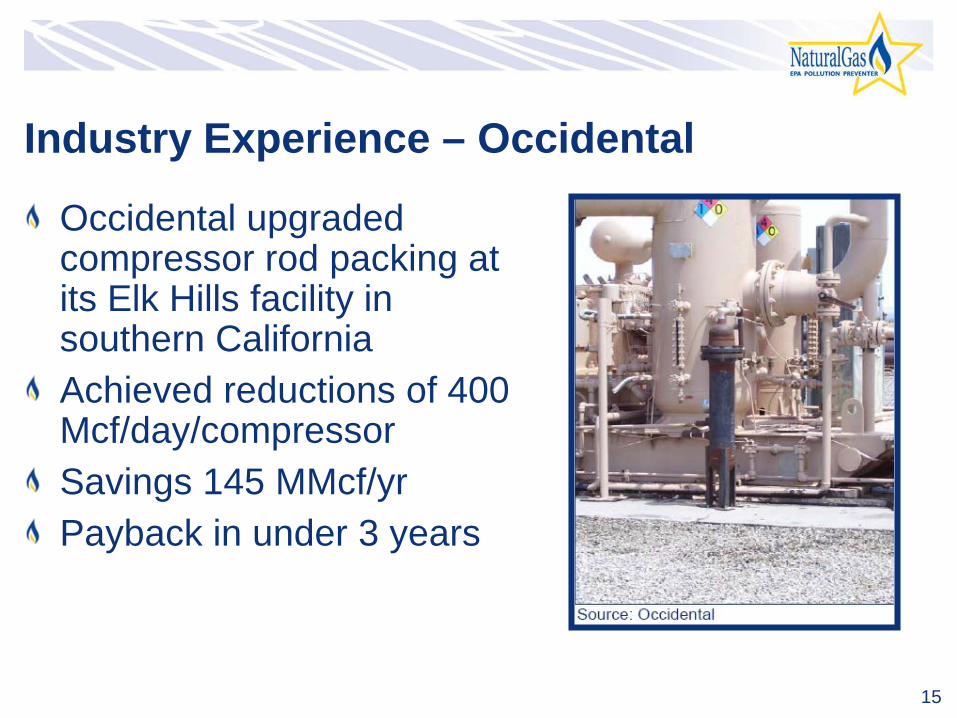
Industry Experience – Occidental
Occidental upgraded compressor rod packing at its Elk Hills facility in southern CaliforniaAchieved reductions of 400 Mcf/day/compressorSavings 145 MMcf/yrPayback in under 3 years
15

Northern Natural Gas - Leakage Rates
0
50
100
150
200
250
300
350
1997 1998 1999 2000 2001 2002 2003 2004 2005 LEP
Unit AUnit B
Leak
Rat
e (li
ters
/min
)
60 cf/hour
640 cf/hour
16

Northern Natural Gas Packing Leakage Economic Replacement Point
Approximate packing replacement cost is $3,000 per compressor rod (parts/labor)Assuming gas at $7/Mcf: 1 cubic foot/minute = 28.3 liters/minute
50 liters/minute/28.316 = 1.8 scf/minute1.8 x 60 minutes/hour= 108 scf/hr108 x 24/1000 = 2.6 Mcf/day2.6 x 365 days= 950 Mcf/year950 x $7/Mcf = $6,650 per year leakageThis replacement pays back in <6 months
17

Low Emission Packing
Low emission packing (LEP) overcomes low pressure to prevent leakageThe side load eliminates clearance and maintains positive seal on cup faceLEP is a static seal, not a dynamic seal. No pressure is required to activate the packingThis design works in existing packing case with limited to no modifications required
18

LEP Packing Configuration
19

Orientation in Cup
20

Reasons to Use LEP
Upgrade is inexpensiveSignificant reduction of greenhouse gas are major benefitRefining, petrochemical and air separation plants have used this design for many years to minimize fugitive emissionsWith gas at $7/Mcf, packing case leakage should be identified and fixed.
21

Discussion
Industry experience applying these technologies and practices
Limitations on application of these technologies and practices
Actual costs and benefits
22