Embed Size (px)
Citation preview

WATER4 RECLAMTION BY REVERSE OSMOSIS
JOHN R. FOSSUM, PhD
Mlelpar, Inc.
MAY 1909
This documecnt has been approved for~ publicreleae and :sale; i-& distribution is unlitmited.
AEROSPACE MEDICAL RESEARCH LBRtRAEROSPACE MEDICAL. D0mIVISION,AIR -FORCE SYSTM& oMMN
-; ~ ~ ~ VRIGITrERSON AtI Fids, A3 OI

AMRL-TR-68-190
WATER RECLAMATION BY REVERSE OSMOSIS
JOHN H. FOSSUM, PhD
This document has been approved for publicrelease and sale; its distribution is unlimited.

FOREWORD
This project was initiated by the Aerospace Medical Research Laboratories,Wright-Patterson Air Force Base, Ohio. This research was carried out by Melpar,Inc. , 7700 Arlington Boulevard, Falls Church, Virginia 22046, under contractnumber F33615-67-C-1534 and in support of Project 6373, "Equipment for LifeSupport, " Task 637304, "Waste Recovery and Utilization, " and Work Unit 003,"Water Reclamation by Reverse Osmovis." Mr. Sol Nclson was principal investi-gator and project manager from the start of the program in April 1967 until June 1967,from which date and for the balance of the program, Dr. John H. Fossum was programmanager and principal investigator. He was assisted by the following personnel:Mr. John Lazar, mechanical engineer, Mr. Albert Hadermann, senior chemist,Dr. Eli Schatz, senior scientist, Mr. Edward W. Duniklin, senior chemist, Mr. JamesBrotherton, junior engineer, and Mrs. Evelyn Muth, senior technician. Dr. S.Sourirajan was retained as consultant by Melpar during the course of the project,Mr. Albert B. Hearld, Biotechnology Branch, Life Support Division, AerospaceMedical Research Laboratories, * was the contract monitor. This report coverswork conducted from April 1967 to August 1968.
This technical report has been reviewed and is approved.
C. H. KRATOCHVIL, Colonel, USAF, MCCommanderAerospace Medical Research Laboratory
*In December 1968 the Biotechnology Branch and the Life Support Division were
abolished and the Laboratories were redesignated Aerospace Medical ResearchLaboratory.
ii

ABSTRACT
A laboratory reverse osmosis system capable of purifying 4 liters of a
mixture of 2.4 liters of urine and 1. 6 liters of either wash or dehumidification
water in a 24-hour period was fabricated by Melpar, Inc. The quantitative
rejection of urea by the membranes was found to be the major problem. Urea
rejection by complexing urea with various chemicals was investigated but no
significant increase was realized. The effect of storage conditions on mem-
brane performance was Invcstigated. A study was made of the annealing of
cellulose acetate membranes and attempts were made to develop satisfactory
benzyl derivatives of cellulose acetate. A method was developed which per-
mitted a rapid evaluation of membrane performance. A satisfactory membrane
was found to result from the precise control of the annealing process.
iii

TABLE OF CONTENTS
Section Page
I INTRODUCTION 1
II EXPERIMENTAL PROCEDURES 3
Reverse Osmosis Apparatus 3General Procedure for Casting Membranes 3Perchlorate Method 3Formamide Method 6General Procedure for Annealing Membranes 7Storage of Membranes 7Analysis of Product Water 7
III RESULTS AND DISCUSSION 10
Comparison of Melpar and Commercial Membranes 10Effects of Annealing Temperature and pH of Storage
Buffer Solution 13Urea Removal by Complex Formation 15Chemical Modification of Cellulose Acetate Membranes 17
IV CONCLUSIONS 23
Appendix I. Preparation of Benzyl Cellulose-Cellulose
Acetate Derivatives 25
Appendix II. Solvent Systems Tried with Benzyl Cellulose Derivatives 31
Appendix III. Analysis of Urine for Salt and Urea by Conductanceand Refractive Index Measurements 35
REFERENCES 47
iv

LIST OF TABLES
Table Page
I Comparison of Analysis for Urea by Diacetylmonoximeand Conductivity Refractometer Methods 9
II Original Screaning of Membranes 11
III Rejection Rates of Formamide Membranes 12
IV Effect of Annealing Temperature and pH 13
V Effect of Storage of Membranes at pH 5 on TheirRejection of NaCI and Urea 14
VI Effect of Annealing Conditions on Rejection Rate 14
VII Rejection Rates for Urea after Being Complexed 16
VIII Effect of Oxalic Acid for Urea Removal 18
LIST OF ILLUSTRATIONS
Figure Page
1 Schematic Diagram, Reverse Osmosis 4
2 Reverse Osmosis Cells 5
.4

SECTION I
INTRODUCTION
The primary objective of the research program conducted by Melpar, Inc. , wasto develop a suitable membrane for recovering potable water from human urine, washwater, and dehumidification water, by the reverse osmosis process. A laboratorymodel of a reverse osmosis system capable of producing potable water from a mixtureof the aforementioned waters and suitable for testing the membranes developed underthe program was designed and fabricated. This report describes the methodologyemployed toward the successful development of a membrane, which produced potablewater meeting the specifications set by the Aerospace Medical Research Laboratories.
As is evident from lowering the vapor pressure, lowering the freezing point,
and elevating the boiling point of a solvent, the free energy or chemical potential of asolvent is lowered when a solute is dissolved therein. If a solution is separated fromthe same solvent by a membrane permeable to solvent molecules but not to solutemolecules, there will occur a net flow of solvent molecules from the region of highchemical potential (the solvent) to one of lower chemical potential (the solution). If apressure is applied to the solution side of the membrane, the net flow of solvent
molecules into the solution will be reduced and the pressure required to reduce thisnot flow to zero is, by definition, the osmotic pressure of the solution. If the pressure
on the solution side of the semipermeable membrane exceeds this osmotic pressurethere will be a net flo v of solvent molecules from the solution and we will have thec'rctunstance of "reverse" osmosis.
Van't Hoff was the first to observe the similarities between the properties ofgases and the osmotic properties of solutions. ie drew a parallel between the tem-perature, pressure, and volume of an ideal gas and the temperature, osmoticpressure, and volume of a solution:
n2RT cRTV - M
where
[1 = osmotic pressure
n 2 = moles of solute
V = volume of solution
R = universal gas constant
T = absolute temperature
M = solute molecular weight
c = solute concentration
i1

As a first approximation, the water flux (J) will be proportional to the pres-
sure (P) in excess of the osmotic pressure (ri) or
J P - 11 (2)
The normality is 0. 435 for a mixture of urine and dehumidification water in
the ratio 6:4. From equation 1 the osmotic pressure, 1, of such a mixture will be
11 = cRT = 0. 435 x 0. 082 x 298 = 10.6 atmospheres
In equation 2 the water flux (mass per unit area per unit time) is a function ofthe excess of the applied pressure over the osmotic pressure. A pressure in excess
of 1500 psia will be required to yield a 90% recovery of fresh water from such amixture,
A useful application of the phenomenon of osmosis has been the determination
of the molecular weight of polymeric molecules by measuring the osmotic pressure ofa solution of the polymer arl then calculating the molecular weight from equation 1above. When the reverse osmosis principle has been applied to non-ionic species, the
rejection of the species has been found (refs 1, 2, 3) to be much less than would havebeen anticipated if one assumed uniform pore diameters in the membrane and thereforeconcluded that membrane rejection should incrLase with increasing molecular size.
This assumes that rejection is dependent solely upon the ease with which a moleculeor ion can penetrate holes or pores in a membrane. That the real mechanism is more
complex Is indicated by Loeb's ability to achieve rejections of 99%, with ionic species(ref 4) whereas Ambard and Trautman (ref 1), in studying the rejection of urea,
glucose, and sucrose, found rejections of only 0. 5, 5. 0, and 9.0%, respectively.There are two possible mechanisms by which the rejection rate of urea might be
increased: (1) form a double salt, thereby converting the urea into an ionic speciesor (2) form an inclusion compound by the addition of a straight chain compound to asolution of urea. When, for example, n-decane is added to a solution of urea in
methyl alcohol, a crystalline addition compound is immediately precipitated. Notonly are the normal paraffins capable of giving such addition compounds but so are
some alcohols, aldehydes, ethers, and other straight chain molecules. Such moleculesare capable of complexing several molecules of urea and the complex may be of such
size that it cannot pass through the pores of the membrane.
Still another method for Increasing the rejection of urea is by modification of
the cellulose acetate by the addition of substituent groups to the cellulose acetate
polymer, and it is this possibility which absorbed the major effort of this study.
2

Section 11
EXPERLMENTAL PROCEDURES
REVERSE OSMOSIS APPARATUS
Figure 1 shows schematically the system used in these studies to evaluatethe performance of membranes, Figure 2 shows a detailed assembly of one of thecells. The entire system was fabricated from Type 316 stainless steel. All fittingswere stainless steel SwageLok compression fittings, and the system was designedto withstand a pressure of 2500 psia. By reference to Agure 1, it can be seen thatthe test fluid is pumped from the reservoir through a filter and Into the reverseosmosis cells which are arranged in parallel. The pump selected for this systemwas a Milton Roy piston-operated metering pump with its own flow control. Pressurewas controlled by the needle valve preceding the flowmeter. As the urine becomesmore concentrated on passing through the reverse osmosis cells, the solubility ofsome of its dissolved solids will be exceeded and crystals will become suspended Inthe feed. In order to minimize the deposition of these solids on the membrane sur-faces, a prefilter was incorporated in the system before the reservoir. During itspassage through the system it was found that the feed was heated somewhat. Awater-cooled bath was inserted after the last cell to avcid excessive heating.
The system used contained four cells. The system was first fabricated withonly one cell and the results indicated that approximately 0. 1 ft2 of membrane area(the filtering area available in one cell) was required for each liter of feed solutionprocessed per day. Thus, to fulfill the original requirement of processing 10 litersper day, 10 cells would have been required. For reasons of economy of motion, thisrequirement was reduced to four liters per day and, therefore, only four cells wererequired.
GENERAL PROCEDURE FOR CASTING MEMBRANES
Perchlorate Method
Composition of Casting Solutions
(1) Cellulose Ester: 17.0 grams
(2) Acetone: 68.0 grams
(3) Magnesium Perchlorate: 1. 5 grams
(4) Water: 13. 5 grams
3

FLOW METER
N IEDLE VALVE
PREFILTER
LY RESERVOIR
RE
COCLiNG TRAP
$NUBBER
YALVE $IS OSMOSI$ OWSISELL CELL CELL
VALVE
1616
PIw ' IFILTER VALVE
PLOW REGULATOR VALVE
Figure 1. Schematic Diagram, Reverse Osmosis
4

B1340 4I
A
a) FILTER CELL R45360-2
0. RING
+ 4-
K~ ~ ~ ~~~~~~~b ___RAN CELL_____________ R436-1 -__________
Preparation of Casting Solution
Dissolve the magnesium perchlorate in the water. Pour this aqueous solutioninto the acetone contained in a 200-ml, screw-cap bottle. Add a magnetic stirringbar to this solution and, while stirring, slowly add the cellulose ester. Continuestirring, until solution is complete. With the bottle sealed, rotate on a roll millfor 12 to 14 hours. If at the end of this time there are air bubbles in the solution,place the capped bottle in a Aater bath for a few minutes at a temperature of 40 C.This casting solution is to be stored at a temperature of -10 to -15 C until needed forcasting.
Casting of Membranes
Place two layers of electrical tape along each side of an acetone-cleaned glassplate which is approximately 8 x 8 inches. (The tape used was 3M Scotch Vinyl Plastic
Electrical Tape No. 33.) The tape, approximately 0. 007 inch thick, forms a castingbarrier approximately 0.014 inch thick. Place the plate in the freezer and allow it tocool to -10 to -12 C. Pour a slight excess of the casting solution onto the plate sothat it fills the depression made by the tape barrier. Draw a clean glass rod acrossthe surface of the casting solution to form a layer of uniform thickness and then allowthe casting solution to set for 4 minutes. After this period the plate is to be immersedin a quench bath (water at 0 C) for 45 minutes. During this immersion in the quenchbath, the magnesium perchlorate is dissolved out of the film. It can be observed thata dense skin will form on the water-exposed side of the membrane. It was found thatthe best results were obtained when this skin was on the pressure side when the mem-
brane was mounted in the reverse osmosis cell.
Formamide Method
Composition of Casting Solutions
(1) Cellulose Ester: 25 grams
(2) Acetone; 45 grams
(3) Formamide: 30 grams
Preparation of Casting Solutions
Place the solvent mixture in a clean 200-ml, screw-cap bottle containing a
magnetic stirring bar. Slowly add the cellulose ester while stirring. After solutionis complete, place the capped bottle on a roll mill and rotate for 12 to 14 hours.
6

Casting of Membranes
The glass plate is prepared and the casting solution is poured exactly as wasdone in the perchlorate procedure described above. After the film has been formed,allow it to set for 20 seconds at room temperature and then quench for 45 minutes inwater at room temperature. As with membranes produced by the perchlorate methodi,the water side of the membrane is also the pressure side when the membrane ismounted in the reverse osmosis cell.
GENERAL PROCEDURE FOR ANNEALING MEMBRANES
Place several coins In the bottom of a petri dish to prevent the membranefrom lying on the bottom. Similarly, coins are placed on the top of the membraneto prevent it from floating in the distilled water which is then poured into the dishuntil the water covers the membrane. Place the petri dish in a hot water bath andbring the temperature up to the annealing temperature (93 C) within 20 to 30 minutesand hold at this temperature for 10 minutes. Remove the dish from the water bathand allow its contents to cool to room temperature. The membranes should not becut to the size for use in the cell until after they have been annealed because thisprocess results in a shrinkage of about tO percent.
STORAGE OF MEMBRANES
The membranes are to be stored in a 0. 005 to 0.050 molar potassium acid
phthalate buffer solution (pH = 5.000 * 0.02 at 25 C).
ANALYSIS OF PRODUCT WATER
In the initial evaluations of membranes, the problem was simplified by theemployment of an aqueous solution of sodium chloride and urea as a substitute forurine. To approximate the concentrations of these substances in urine, the sim-plified test solution had a urea concentration of 0.43 M and that of the sodium chloridewas 0. 38 M. To simplify the screening of membranes an analytical procedure wasdeveloped that determined the sodium chloride and urea concentrations by measuringthe conductance and the refractive index of the solution. A detailed description of thismethod is given in appendix III. Excellent precision and accuracy were obtained whensynthetic urine was examined but, when the method was used in analyzing for the saltand urea concentrations in urine or the product water from tht processing of urine,the values obtained were 20 to 30 percent higher than those determined by the con-ventional quantitative wet chemistry methods for sodium chloride and urea.
7
EZt

Adequate precautions must be taken to prevent the product water from beingcontaminated by carbon dioxide in the air. Water absorbs carbon dioxide and thisincreases conductivity. For this reason, when using a conductometric method, thewater must be saturated with carbon dioxide at a given temperature and the propercorrection applied, or it must be protected from absorbing c rbon dioxide. In thereverse osmosis system, the product was protected from carbon dioxide by sealingthe receiver and admitting air only through a drying tube filled with Ascarite. How-ever, in the case of urine, although the chief constituents were sodium chloride and
urea, the many other contaminants present will lead to some error by this method.To determine the size of this error and to determine whether the r.ethod could beused as an empirical method to obtain a rough estimate of the purity of the product,the urea contents of several different urine solutions were analyzed by the diacetyl-monoxime method and the results obtained were compared with those obtained by theconductivity-refractive index method. The results are summarized in table I.
In general, the diacetylmonoxime method gave urea concentrations approxi-mately 0. 7 (70 percent) times the values obtained by the conductivity-refractive indexmethod. The higher values are caused by the presence of impurities in the urineother than urea. Passing the product water through a 0. 45 4 Millipore filter ordecolorizing it with activated charcoal did not cause significant differences in therefractive index. For synthetic solutions of known concentrations, the resultsobtained by the diacetylmonoxime method were about 10 percent low in urea cc i-ten~t. Thus, some of the difference between the two methods is probably due to atendency for the diacetylmonoxime method to give low results. Furthermore, theratio of approximately 0. 7 between the two methods tended to be maintained by asolution after it had been passed through the osmosis membrane. Since it wouldbe expected that other impurities would be removed to a greater extent than urea,one might expect the ratio to change after purification by reverse osmosis. How-ever, since the ratio is maintained, the percent rejection of urea determined byboth methods was approximately the same and the conductivity-refractive indexmethod is therefore a valid method for determining the percent rejection of ureaeven in urine solutions.
The results also show that the conductivity-refractive index method is accuratefor synthetic urea-salt mixtures even though the results may be slightly high whereadditional impurities are present, such as in urine. Thus, in using this method forthe analysis of purified urine solutions, the product water is purer than indicatedby the analysis. However, the method is rapid and easy and therefore was used forinitial evaluations. For definitive determinations of contaminants, conventionalmethods of water analysis were used.
8

|P
TABLE I
COMPARISON OF ANALYSIS FOR UREA BY DIACETYLMONOXIME ANDCONDUCTIVITY REFRACTOMETER METHODS
Urea Concby Cond-Refr Method Ratio of Urea
Solution Monoxime Urea Conc Salt Conc ConcentrationsMethod
Known 0.20 M NaCI + 0.275 M 0.301 M 0.205 M0. 30 M Urea
Urine L 0.34 M 0.47t M 0.227 M 0.72
Urine M 0.29 M 0.366 M 0. 223 M 0.79
Urine N, Raw 0.275 M 0.498 M 0. 261 M 0.55
Urine N, Filtered 0.31 M 0.514 M 0. 261 M 0.60through 0. 2 4Millipore
Urine N, Filtered 0.32 M 0.5u4 M 0.261 M 0.635through WhatmanFilter Paper
Urine N, Decolorized 0. 244 M 0. 374 M 0. 264 M 0.65with Charcoal
Urine Pass ,d throughReverse OsmosisMembrane
Solution I 0. 094 M 0. 134 M 0. 019 M 0.70
Solution 2 0. 110 M 0. 140 M 0. 0039 M 0.786
9

Section III
RESULTS AND DISCUSSION
COMPARISON OF MELPAR AND COMMERCIAL MEMBRANES
To assess Melpar's procedures for casting cellulose membranes, Reveralmembranes were compared with commercially available reverse osmosis membranes.For the first approximation evaluation, synthetic urine, described on page 7, wasused with a single reverse osmosis cell at a pressure of 1000 psi with the feed flowrate maintained at 200 ml per minute. The results are given in table 1 where it canbe seen that, whereas there was no significant difference in the sodium chloriderejection, the Melpar membranes did result in an overall higher rejection of urea,particularly by the formamide membrane F-6 which was annealed at 85 C. Additionalcellulose acetate membranes were cast by the formamide method, annealed at 85 Cand tested under various conditions. In table III are summarized the results. It isto be noted that when urine was used, an adequate urea rejection was obtained onlywhen urease was employed. When the synthetic urine was used, with the exception oione case, the urea rejection was of the same order of magnitude as that realized forsodium chloride. It very well may be that the low values obtained with urine areanomalous since the refractive index procedure was used in the urea determinationsand the reading may have been significantly affected by other non-ionic urine con-stituents penetrating the membrane.
The one exception noted above (urea rejection 16%) was obtained with a mem-brane that had been stored in distilled water for several weeks. A second heattreatment failed to restore the original properties. For this reason, a study wasmade of membranes stored in various salt and buffer solutions to determine theirstability. Membranes stored in a potassium acid phthalate-sodium hydroxide bufferat a pH of 5.00 would keep for more than a month.
The findings indicate that the cellulose acetate was probably degraded bybacteria or by an adverse pH. Since the medium was distilled water, the loss ofrejection may have been due to bacteria. Treating the membrane with very dilutesilver nitrate solution may protect it from bacterial action for prolonged periods.However, this approach has not been tested.
Passing urine through a charcoal bed prior to passage through the reverseosmosis system was effective in decolorizing the solution and removing odor; how-ever, with more than one pass through the membrane, it is not reluired.
10

TABLE 11ORIGINAL SCREENING OF MEMBRANES
Annealing PercentMembrane* Temperature Rejection
(C) NaCI Urea
MF-10-1 -8- -
MF-1O-1 84 79 23
U-75 -- 40 8U-8O0- 24 8U-81 -- 90 28U-84 -- 81 27
P 84 86 38
F-1 83.0 88 --
F-2 82.5 76 20F-3 83.5 75 28F-4 83.0 79 24F-5 83.5 49 19F-6 85.0 94 45
*MF Membranes obtained from Desalination, Inc.U Membranes obtained from Universal Water Co.P Membranes cast at Melpar by the perchiorate methodF Membranes cast at Melpar by the forrnamide method

TABLE III
REJECTION RATES OF FORMAMIDE MEMBRANES
Starting Special Percent
Solution Treatment RejectionNaCI Urea
Urine Urease - charcoal 90 89Urine None 89 36Urine None 90 35
0.43 N urea + 0.38 N NaCl 98 940.43 N urea 4 0.38 N NaCI 97 940.43Nurea + 0.38 N NaC 96 920.43 N urea + 0.38 N NaCI 99 940.43 N urea + 0.38 N NaCI 84 160.43N urea + 0.38 N NaCI 90 930.43 Nurea + 0.38 N NaCI 90 82
0.38 M NaCI 88--
0.43 M Urea 41
-- Data iot available
12
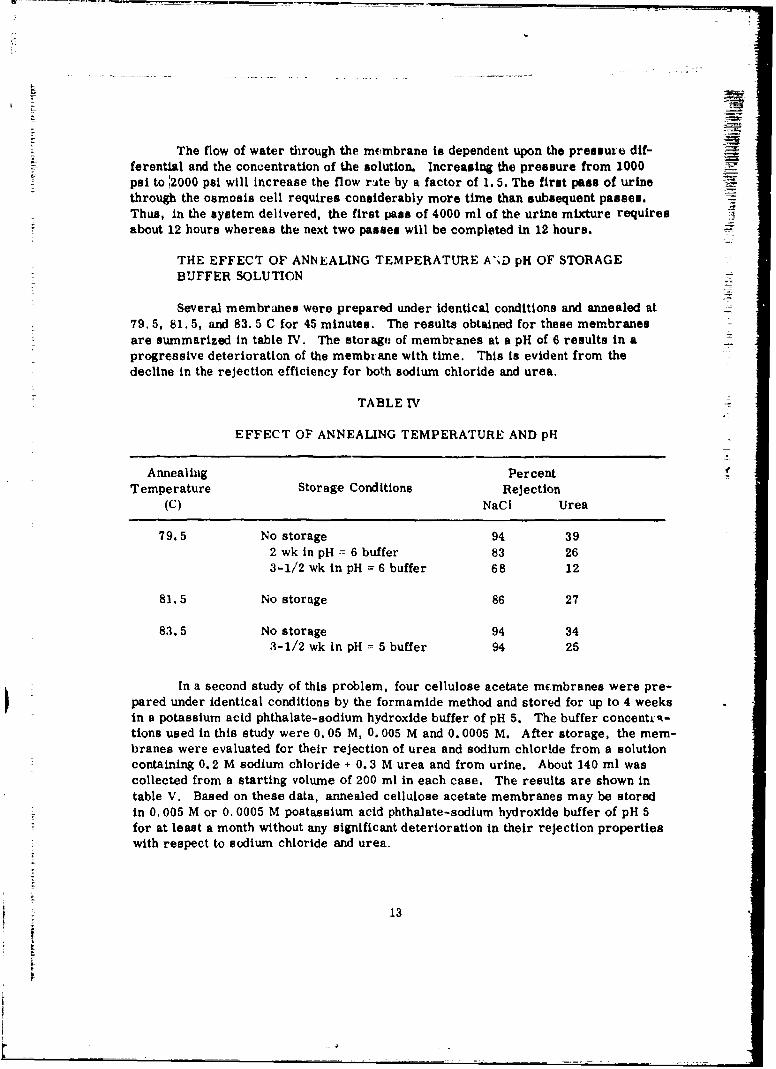
The flow of water through the membrane is dependent upon the pressure dif-ferential and the concentration of the solution. Increasing the pressure from 1000psi to .2000 psi will increase the flow rate by a factor of 1. 5. The first pass of urinethrough the osmosis cell requires considerably more time than subsequent passes.Thus, in the system delivered, the first pass of 4000 ml of the urine mixture requiresabout 12 hours whereas the next two passes will be completed in 12 hours.
THE EFFECT OF ANNEALING TEMPERATURE A'D pH OF STORAGEBUFFER SOLUTION
Several membranes were prepared under identical conditions and annealed at79. 5, 81.5, and 83. 5 C for 45 minutes. The results obtained for these membranesare summarized in table IV. The storage of membranes at a pH of 6 results in aprogressive deterioration of the membrane with time. This is evident from thedecline in the rejection efficiency for both sodium chloride and urea.
TABLE IV
EFFECT OF ANNEALING TEMPERATURE AND pH
Annealing PercentTemperature Storage Conditions Rejection
(C) NaCI Urea
79.5 No storage 94 392 wk in pH = 6 buffer 83 263-1/2 wk in pH = 6 buffer 68 12
81.5 No storage 86 27
83.5 No storage 94 343-1/2 wk in pH = 5 buffer 94 25
In a second study of this problem, four cellulose acetate membranes were pre-pared under identical conditions by the formamide method and stored for up to 4 weeksin a potassium acid phthalate-sodium hydroxide buffer of pH 5. The buffer concentcsk-tions used in this study were 0.05 M, 0. 005 M and 0. 0005 M. After storage, the mem-branes were evaluated for their rejection of urea and sodium chlortde from a solutioncontaining 0.2 M sodium chloride + 0. 3 M urea and from urine. About 140 ml wascollected from a starting volume of 200 ml in each case. The results are shown intable V. Based on these data, annealed cellulose acetate membranes may be storedin 0. 005 M or 0. 0005 M postassium acid phthalate-sodium hydroxide buffer of pH 5for at least a month without any significant deterioration in their rejection propertieswith respect to sodium chloride and urea.
13

TABLE V
EFFECT OF STO1(AGE OF MEMBRANES AT pH 5 ON THEIR REJECTION OF NaCI AND UREA
Feed Solution Feed Solution0,2 M NaCI +0.3 M Urea Urine
Membrane Treatment Measured % NaCl % Urea % NaCI % UreaD H meoted Relected Relected Rejected
21 days in 0.05 M buffer 5.0 89.4 20.0 91.8 21,6
31 days in 0.005 M buffer 5.2 85.8 31.0 86.1 19, ?
2 1days In 0.0005 M buffer 5.4 92.2 28.0 94.0 30.7
2S days in 0.005 M buffer 5.2 91.2 30.0 -
TABLE VI
EFFECT OF ANNEALING CONDITIONS ON REJECTION RATE
Anneal T p nneal Time Conc Before PasIng Membrane After Pasain Membrane Percent RelectionNaCl Urea NaCI Urea
(C) rin) N N N N NaCI Urea
93 10 0.200 0.300 0.0212 0.220 89.4 26.7
gadpass 0.0212 0.220 0.0024 0.125 57.1 22.6
94 10 0.200 0.300 0.122 0.233 39.1 22.7
95 20 0.200 0.300 0.0056 0.161 97.5 46.2
97 10 0.200 0.300 0.0062 0 111 96.9 62.9
14

A further study of the effect of the annealing temperature on membrane per-formance was carried out using membranes prepared by the perchlorate method. Themembranes were annealed at 93, 94, and 97 C for 10 minutes and at 95 C for 20minutes. The ,'esults obtained from the evaluation of these membianes are shown intable VI.
These results Indicate that the annealing time and temperature is very impor-tant in determining thr rejection rate and the product flow rate of the membranes. Theresults obtained from the membrane annealed for 10 minutes at 94 C are unexpectedlylow, probably due to an imperfection in the membrane. Although good rejection wasobtained with the membrane annealed at 97 C for 10 minutes, the rate of flow ofproduct water through the membrane was significantly decreased. Therefore, inselecting annealing conditions, a tradeoff must be made between flow rate and rejec-tion rate,
During his final consulting session in the program, Dr. Sourirajan said he haddeveloped a membrane with greatly improved flow properties but with very smallpores so that high rejection rates could be obtained. He antic-pates publishing hisfindings at an early date.
UREA REMOVAL BY COMPLEX FORMATION
Since urea removal was the most difficult problem an inveitigation was madeto determine whether the urea would complex to form larger mole'ules which wouldbe easier to remove. A search of the literature indicated that a number of complexesis indeed formed with urea, and so a number of these complexing agents was investi-gated. Because the amount of additive was limited by the terms of the program to4 g/l, we decided that the complexing agent should be addcd after the first pass so thepurification processes could be limited to two passep.
In the initial study, five compounds were addem to the urine at a concentrationof 4 g/l to try to complex the urea and thereby increase the membrane rejection ratesfor urea. The complexing agents used werc silver nitrate, chromous chloride, ferricchloride, magnesium chloride, and ferrous sulfate. After treatment, the solutionsware filtered through a WhatmanNo. 1 filter paper and the filtrate was passed throughthe reverse osmosis system. The data is summarized in table VII. An examinationof this data will show that no drastic reduction in urea concentration occurred. Theaverage rejection rate obtained for all of the additivez, was 35 percent, roughly com-parable to the 30 percent rejection of urea obtained with this type of membrane with-out additives.
15
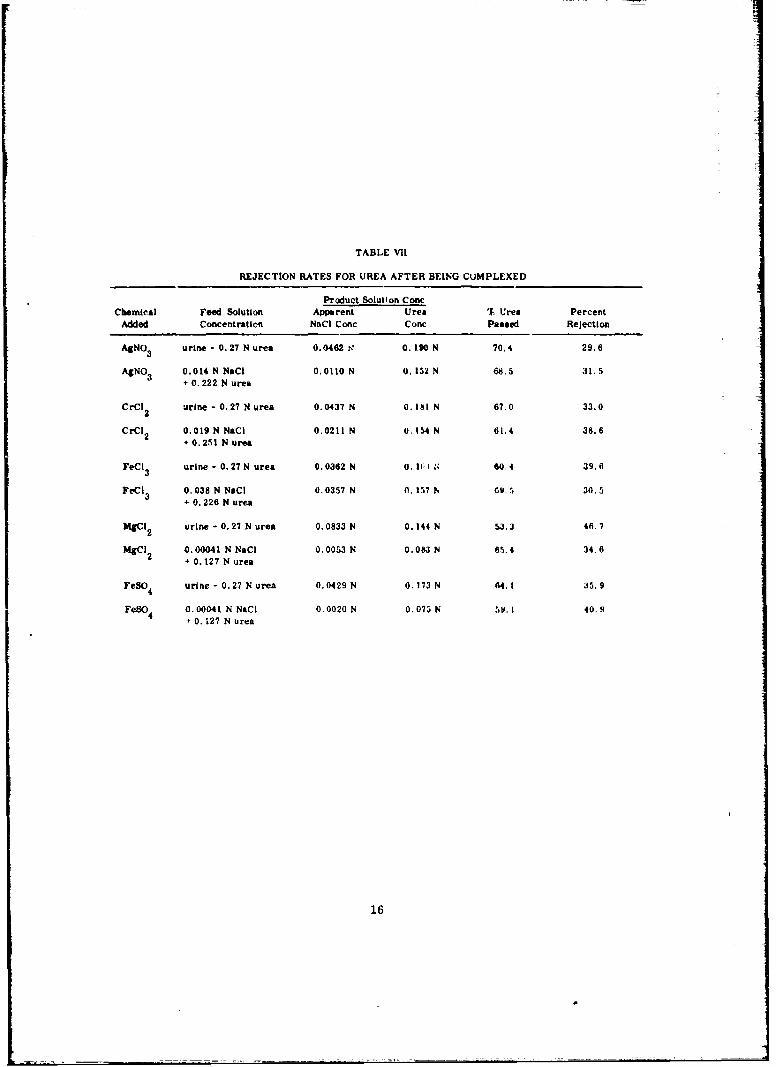
TABLE Vii
REJECTION RATES FOR UREA AFTER BEING CUMPLEXED
Product Solution ConcChemical Feed Solution Apparent Urea % Urea Percent
Added Concentration NeC Conc Conc Passed Rejection
AgNO 3 urine - 0. 27 N urea 0.0462 0' 0. 90 N 70.4 29.6
AgNO 3 0.014 N NaCI 0.0110 N 0.152 N 68.5 31.5+ 0.222 N urea
CrCl 2 urine - 0.27 N urea 0.0437 N 0, Itt N 67.0 33.0
CrCI 2 0.019 N NaCi 0.0211 N 0, 154 N 61.4 38.6+ 0.251 N urea
FeCI 3 urine - 0.27 N urea 0.0362 N 0, I I 60.4 39.6
FeCi 3 0.038 N NeC 0.0357 N 0. 57 N 69.5 30.5+ 0.226 N urea
AgCI 2 urine - 0.27 N urea 0.0833 N 0.144 N 53.3 46.7
MgCI 0.00041 N NaCi 0.0053 N 0.083 N 65.4 34.62 0.127 N urea
FeSO4 urine - 0.27 N urea 0.0429 N 0.173 N 64. I 35.9
FeSO4 0.00041 N NaCI 0.0020 N 0.073 N 5W.i 40.9
+ 0.127 N urea
16

These results can probably be explained by the high dissociation constants forthe urea complexes. For example, the complexing reaction with ferric chloride canbe shown as
FeCl 3 + 6 CO(NH 2 )2 m FeC13 . 6 CO(NH2 )2
Upon removal of urea by the membrane, additional free urea is formed by dissociation,i. e., shifting of the above reaction to the left.
In an extension of the effect of the addition of complexing agents, the followingcompounds were evaluated: tetrahydronaphthalene, tartaric acid, p-dimethlamino-benzaldehyde, oxalic acid, formaldehyde, p-benzoquinone, 1,2-napthoquinone, acetic -
acid, and calcium chloride. Each oi these chemicals was added at a concentration of4 g/l except for oxalic acid which was added at a concentration of 2. 5 g/l. The corn-plexing agent was added to the raw urine after which the urine was filtered firstthrough a Whatman filter No. 1 and then through a Millipore filter with a porosity of0.45 L. The filtrates were then passed through the reverse osmosis system. Con-centrations were determined by both the conductivity-refractive index method and bythe monoxime method.
None of the additives showed promise except oxalic acid. The results obtainedusing solutions containing sodium chloride and urea are shown in table VIII. Theseshow that although a slight improvement was obtained in the rejection of urea, theadditive had a very adverse effect on the rejection of sodium chloride. In addition,the low j1 1 (pH 5. 0 is neutral environment for membranes) of the resulting solutionsmay accelerate the deterioration of the membrane. Thus, although the additivecould be added after the first pass and after the bulk of the sodium chloride has beenremoved, the approach did not appear sufficiently promising to warrant furthereffort.
CHEMICAL MODIFICATION OF CELLULOSE ACETATE MEMBRANES
In view of the failure of complex formation to significantly increase the rejectionof urea, attention was turned toward the modificationof the membranes as a means ofincreasing the rejection.
According to the theory of Sourirajan, a thin layer of pure water, which is dueto preferential adsorption, forms at the surface of the membrane. This layer has athickness designated by "t" and is only a few molecules thick. The amount of salt orother solutes passing through the membranes is dependent upon this thickness (whichin turn is dependent on the relative adsorption potential of pure water and solutefor a p.Lrticular membrane) and on the diameter of the pores "d" in the mem-brane. Then by increasing "t" or decreasing "d," the re;ection rate of the
17

TABLE VIII
EFFECT OF OXALIC ACID FOR UREA REMOVAL
Amt of Oxalic Conc Before Passing PercentAcid Added Through Membrane Rejection
g/l NaCi Urea NaCI . eN N
None (control) 7,4 0.200 (1.300 97.5 46.2
2.0 2.0 0.200 0.300 84.o 45.9
4.0 1.8 0.200 0.300 72. 7 44.2
6.0 1.5 0.200 0.300 46.7 51.7
8.0 1.4 0.200 0.300 31.0 56.7
Amt of Oxalic Conc After Passing PercentAcid Added Through Membranie Rejection
g/l PH NaCI Urea NaCI UreaN N
None (control) 5. 8 0. 0056 0. 161 97. 5 46. 2
2.0 2.2 0.034 0.162 84.0 45.9
4.0 2.1 0.055 0.167 72.7 44.2
6.0 1.8 0.107 0.145 46.7 51.7
8.0 1.6 0.138 0.130 31.0 56.7
18

membrane will be improved. However, by decreasing "d," the flow rate through the---- membrane will be decreased. As stated above, Sourirajan is now working on amethod to increase the number of pores in a given membrane so that "d" can be 1decreased to obtain high rejection rates, and reasonable flow rates will still bemaintained. These conclusions have been borne out by the studies conducted duringthis program on annealing temperatures and times. On the other hand, the sameobjective might be attained by Increasing the thickness "t" of the pure water layer.This might be accomplished by making the membrane less adsorptive toward thesolutes in the urine. This is the approach that was pursued for the balance of thisprogram.
An attempt was made to form a film of an ether/ester of cellulose. Celluloseacetate has been the most attractive of the current state-of-the-art membranes witha degree of substitution of approximately 2. 5. Theoretically it is possible to obtaina derivative which has up to 3.0 groups of an ether linkage per anhydroglucose unit.It was felt that this substitute should be as nonpolar as possible and thus the benzylgroup was the first to be investigated. It was intended to later investigate the ethyland methyl ethers, but time did not permit attaining this goal.
The first approach was to start with a cellulose acetate membrane and tocarry out the substitution during the annealing operation. The details of thesesyntheses are given in appendix I, section A. No suitable membranes were obtained.
The next approach was to benzylate cellulose acetate and then formmembranes from the product. Several reactions were tried, as described inappendix I, section B, but all of the products obtained were so insoluble that nomembranes could be cast. A total of 94 solvent systems was investigated (seeappendix II), but none of these were adequate to obtain solutions sufficiently concen-trated for the production of membranes. At this point during the reaction, the esterlinkage was broken and the products were essentially cellulose with a small degreeof substitution of benzyl cellulose.
The final approach was to form the benzyl ether first and then acetylate theresulting product. Alkali cellulose was prepared from alpha cellulose and, afterdrying, was reacted with benzyl cellulose (for representative procedures, seeappendix I, section C). The product was separated and dried and acetylated with amixture of acetic anhydride and glacial acetic acid, using sulfuric acid as thecatalyst. The desired product was obtained.
19

Casting a satisfactory film presented a major problem since most filmsformed were too brittle or too weak. Perhaps a lower degree of benzylation wouldhave produced a satisfactory film. A film was finally cast by mixing a solution of2. 0 grams of benzyl cellulose acetate (Product 1397-39-1) dissolved in 5. 0 gramsof dioxane with 15. OL grams of cellulose acetate dissolved in 63. 0 grams of acetoneannealed at 84 C for 10 minutes. It gave a rejection rate of 59 percent for sodiumchloride and 8 percent for urea. Although this membrane was decidedly inferior tothose previously prepared, the low rejection rate may have been due to Imperfectionsin the film.
Although no strong positive results have been obtained with these derivatives,it is felt that further work should be done in this direction and that at least the ethyl Jcellulose acetate should be prepared and tested. Experience with the benzyl deri-vative indicates that the easiest mode of synthesis would be to form the ethyl celluloseether to a degree of substitution of 0.2 to 0. 5 group per anhydroglucose unit and thenacetylate the product to the highest possible extent with glacial acetic acid-aceticanhydride reagent using sulfuric acid as the catalyst. This derivative should formbetter films than the benzyl ceilulose acetate.
At the end of the program, regular cellulose acetate membranes were cast by jthe perchlorate method, and the system, figure 1, was run for five days purifying amixture of 2400 ml of urine and 1600 ml of dehumidification or wash water each day.Three passes through the system were required to obtain a satisfactory product. Thefinal product was filtered through a sterilized Millipore filter with a pore diameterof 0. 45 L to remove all bacteria, and the product was collected in a sterile container.A 90% yield was obtained. Thus, three passes would be required to obtain more than90% urea rejection.
The results obtained in the initial attempts to obtain membranes by the per-chlorate method were disappointing. However, by adding more heaters to the anneal-lng bath so that the annealing temperature could be attained in 20 to 30 minutes and inannealing at 95 C for 10 minutes, membranes were obtained which had a salt rejectionof about 90 percent and a urea rejection of about 60 percent, with a flow rate throughthe membrane of approximately 25 I/ft2 /day. Thus, three passes would be required.The three passes can be carried out in 24 hours. About 12 hours are required for thefirst pass, but the other two passes can be carried out in a total of 12 hours. A pre-filter is placed in the return line during the first pass to remove solids which precipi-tate out during the pass. One attempt to use a 0. 4 5-1. Millipore filter in the return linecaused a pressure buildup which broke Lhe flowmeter, so, if further attempts are madeto put a Millipore filter in the return line, it is recommended that the flowmeter befirst removed from thte system or modify the present system with the filter installed onthe inlet side of the flowmeter. Since the flowmeter, as shown in the present system,would be subjected to the pump pressure, caution should be exercised to preventclogging of the prefilter.
20

Analysis of the product obtained gave the following results:
Conductivity 61 micromhos
pH 7.1
Color Less than 15 chloroplatinate units
Turbidity Less than 25 Jackson units
Odor Acceptable
Taste Acceptable
Bacteria count 4/ml
COD 235
Urea 92. 2-percent rejection
Although the COD was high, it can be reduced to the acctptable level, 100 mg/liter max., by reclaimrnin only 90% of the input on each pass. To obtain the required90% overall yield, the residue (10%) from the first pass should be discarded and theresidue (10%) from each bu'sequent pass added to the next input.
21
L

SECTION IV
CONCLUSIONS
* Potable water can be obtained from a mixture of urine and wash waterusing three passes through the cellulose acetate membrane described herein.
* In the preparation of cellulose acetate membranes the annealing timeand temperature are extremely important in determining rejection properties andflow rates.
* The additives tested were not effective in removing urea frnm urinesolutions.
* A major problem in building a flight-qualified prototype is to obtain alightweight pump capable of about 2000 psi with relatively low flow rates. Suchpumps have been developed for aircraft, but they are not directly suitable forreverse osmosis systems because they utilize hydraulic fluid for lubrication.
* For prolonged life, the membranes developed in this program must be
stored in buffer solutions of pH 5. 00.
* Activated charcoal will aid in urine purification.
0 A rapid method for analyzing reclaimed water by conductance andrefractive index measurements has been developed.
* An ethyl cellulose acetate membrane should be prepi red and evaluatedtc determine if an improved urea rejection can be obtained.
* For a flight-qualified unit, tubular membranes will be required to givesatisfactory area-volume-weight ratios.
23

APPENDIX I
A. PREPARATION OF BENZYL CELLULOSE-CELLULOSE ACETATE DERIVATIVES
Preparation 1397-20
The membrane was cast by the perchlorate method and soaked in 2. 0 N sodiumhydroxide in a petri dish for 5 minutes. The membrane was removed and washed withxylene. It was then transferred to a clean petri dish, covered with xylene, and 5 mlof benzyl chloride was added. The film was annealed in this mixture by heating to90 C and holding at this temperature for 10 minutes.
Preparation 1397-21
A cellulose acetate membrane wad soaked for 5 minutes in 0. 1 N sodium hy-droxide. The membrane was removed from the solution and rinsed with xylene toremove the excess water and then was placed in a petri dish and covered with xylene.The petri dish was placed in a larger dish containing approximately 1 liter of xyleneand treated with 5 ml of benzyl chloride. The large dish was placed in the waterbath, heated to 95 C, and held at this temperature for 10 minutes.
Preparation 1397-22
A 25. 0-gram portion of cellulose acetate was treated with 75 ml of 2 N sodiumhydroxide. The mixture was filtered through a Buchner funnel using a Whatman No. 41filter paper. The solid was transferred to a 1000-ml, round-bottomed flask equippedwith a water trap and reflux condenser. After refluxing for 6 hours, a total of 34. 8m! of water was collected in the water trap. The water trap was removed, the mix-ture was treated with 10 ml of benzyl chloride and again refluxed for 2 hours. Theresulting mixture was cooled to room temperature and then filtered through a Buchnerfunnel using a Whatman No. 41 filter paper. The product was washed on the funnelwith distilled water until the filtrate was neutral to remove the excess sodium hydroxide.The product was air dried overnight.
A 25. 0-gram portion of cellulose acetate was moistened with 2 N sodium hy-droxide and the resulting mixture was filtered through a sintered glass filter funnelof medium porosity. The solid was washed on the filter, first with about 200 ml ofmethanol and then with about 200 ml of benzene. The solid was transferred to a1000-ml, three-necked, round-bottomed flask equipped with a reflux condenser,stirrer, and glass stopper. A 500-ml portion of benzene was added and the :esultingslurry was treated with 10 ml of benzyl chloride. The mixture was heated to boilingwith constant stirring for 30 minutes. The reaction mixture was filtered through aBuchner funnel using Whatn'an No. 54 filter paper. The solid was washed with about2 liters of distilled water. The product was air dried.
25

r
Product 1397-29
A 25.0-gram portion of cellulose acetate was slurried with a 1 N solution ofsodium hydroxide. The mixture was filtered through a sintered glass filter funnel ofmedium porosity and washed on the funnel with about 200 ml of methanol. The solidwas transferred to a 1000-mi, three-necked, round-bottomed flask equipped withreflux condenser and stirrer and slurried in 300 ml of benzene. The slurry wastreated with 2 ml of beryl chloride and heated to boiling and refluxed for 30 minutes.The product was isolated by fltering through a Buchner funnel using a WhatmanNo. 54 filter paper. The product was washed on the funnel with distilled water andair dried overnight.
B. PREPARATION OF BENZYL DERIVATIVE OF ALKALI CELLULOSE
Preparation of Alkali Cellulose
A 200-gram portion of alpha cellulose was slurried with distilled water inthe Waring Blender. The slurry was filtered through a Buchner funnel. The re-sulting solid was transferred to a beaker and allowed to stand in a 21-percent solutionof sodium hydroxide for 17 hours at room temperature. The mixture was filteredand the solid was allowed to dry for two days at room temperature. The productwas transferred to a screw-cap, wide-mouth jar and stored in the freezer untilready to use.
Product 1397-35-1
A 50.0-gram portion of alkali cellulose was transferred to a 1000-mI, single-necked, round-bottomed flask equipped with a trap and reflux condenser. 500 ml oftoluene was added and the mixture was heated under reflux until the bulk of the waterhad been removed. The resulting slurry was treated with 100. 0 grams of benzylchloride and heated under reflux for 4 hours.
The product was separated by filtration through a sintered glass filter funnelof coarse porosity and washed on the funnel with distilled water until the filtrate wasneutral. 400 ml of distilled water was acidified with 5 drops of 1:1 sulfuric acid.Suction was removed from the funnel, the solid on the funnel was slurried with 500 mlof distilled water, and 200 ml of the acidified water was added. Suction was appliedto remove all of the wash from the funnel. This washing operation was repeatt .%ithanother 500 ml of distilled water and the remaining 200 ml of acidified water. Againsuction was applied to remove excess water.
The product was transferred to a petri dish and allowed to dry in air.
26

Product 1397-35-2
A mixture of 100.0 grams alkali cellulose, 50. 0 grams benzyl chloride and600 ml benzene was placed in a 2000-ml, round-bottomed, three-necked flask equippedwith stirrer, water trap, and reflux condenser and heated with a mantle. The mixturewas heated under reflux for 6 hours during which time 48. 0 ml of water was collectedin the trap. The product was collected on a sintered glass filter funnel of coarseporosity .nd washed on the funnel with distilled water. The product was air driedovernight at room temperature and then dried in an oven for 4-1/2 hours at 55-60 C.Analysis showed the product to contain 41.3 percent carbon and 6.69 percent hydrogen.
C. PREPARATION OF ACETATE DERIVATIVE OF BENZYL CELLULOSE
Product 1397-36
A mixture of 10 grams of benzyl cellulose (Product 1397-35-1), 74. 0 grams ofacetic anhydride, 154. 9 grams of glacial acetic acid and 0.2 gram (12 drops) of con-centrated sulfuric acid were slurried in a 500-ml, three-necked, round-bottomed flaskequipped with stirrer, thermometer, and reflux condenser. The flask was immersedin an ice bath and the temperature was maintained at 10 C. The mixture was stirredfor 19 hours and kept below 20 C by moving the apparatus to the cold room at 5 C. Atthe end of this length of time all solids in the flask had dissolved. The reaction mix-ture was poured slowly into 1200 ml of distilled water with constant stirring. Thesolid white product which formed was separated by filtration through a Buchner fun-nel using a Whatman No. 41 filter paper. In this preparation the product had beenpoured into the water too rapidly and the precipitate which formed was very fine anddifficult to filter. Thus, the solids were removed by using the centrifuge and theproduct was washed in the centrifuge tubes. At the end of the washing cycle, the pHof the filtrate was 5.6. The product was heated for 6 hours under vacuum at 60 C.Since it was not dry at the end of this time, it was heated overnight in the circulatingoven to 80 C.
Product 1397-37-1
A mixture of 10.0 grams of benzyl cellulose (Product 1397-35-2), 70.0 mlof acetic anhydride, 150. 0 ml of glacial acetic acid, and 0.4 ml of concentratedsulfuric acid was placed in a 500-ml, three-necked, round-bottomed flask equippedwith thermometer, stirrer, and reflux condenser. The flask was placed in an icebath and the benzyl cellulose was added slowly with stirring maintaining the temper-ature between 5 and 15 C. The reaction mixture was stirred at this temperature for70 hours in the cold room. The reaction mixture was allowed to warm to roomtemperature. The reaction was poured into 4000 ml of distilled water with constantstirring. Separation was attempted by filtration through Whatman No. I filter paper
27
L _

on a Buchner funnel, but the precipitate was too fine to filter. The product wasseparated in the centrifuge and washed until the supernatant liquid in the centrifugetube had a pH of 5.6. The product was air dried at room temperature for 3 days andplaced overnight in the oven -tt 80 C.
Product 1397-37-2
A mixture of 50. 0 grams of alkali cellulose (1397-35-1) and 500 ml of benzenewas refluxed in a 1000-ml, round-bottomel flask equipped with a water trap and re-flux condenser to remove the water from the mixture. The mixture was treated with50.0 grams of benzyl chloride and heated under reflux for 4 hours. The reactionmixture was transferred to a beaker, the solvent decanted off and then 500 ml ofdistilled water was added. This mixture was allowed to stand at room temperaturefor 36 hours. The product was isolated by filtration through a Buchner funnel usinga Whatman No. 1 filter paper and washed on the funnel until the filtrate was neutral.The product was dried by heating at 45 C for 2 hours.
Product 1397-38-1
A mixture of 10.0 grams of benzyl cellulose (Product 1397-37-2), 150 ml ofglacial acetic acid, and 24 drops of concentrated sulfuric acid was placed in a 500-ml,three-necked, round-bottomed flask equipped with thermometer, dropping funnel,
and stirrer. Acetic anhydride (70. 0 ml) was added dropwise to the reaction mixturefrom the funnel with constant stirring at such a rate that the temperature of the re-action mixture did not exceed 30 C. After the addition was complete, the reactionmixture was stirred at room temperature for an additional 2 hours and allowed tostand over the week-end at room temperature. The reaction mixture was slowlyheated to 55 C with constant stirring and, after cooling, was slowly poured into 3500ml of distilled water at 50 C with constant stirring. Stirring was continued for anadditional 30 minutes. The product was separated by filtration through a WhatmanNo. I filter paper in a Buchner funnel. The filter cake was washed on the funnelwith distilled water until the filtrate was neutral. It was then transferred to a pyrexdish and dried overnight at 45 C. The resulting product contained 48. 5 percent car-bon and 5. 81 percent hydrogen.
Product 1397-39-1
A 200. 0-gram portion of alkali cellulose (Product 1397-35-1) was placed ina 4000-ml, single-necked, round-bottomed flask equipped with reflux condenser andwater trap. A 2500-ml portion of benzene was added and the mixture was heatedunder reflux for 2 hours to remove the water. The mixture was then treated with200 ml of benzyl chloride and heated under reflux for 5 additional hours. The re-action mixture was allowed to cool, 1500 ml of distilled water was added with con-stant stirring, and the mixture was allowed to stand at room temperature overnight.
28

The supernatant liquid was poured off and 3000 ml of distilled water was added withstirring. The mixture was allowed to settle and again the supernatant liquid was dis-carded. This washing procedure was repeated twice more. The product was collectedon a iBuchner funnel using a Whatman No. I filter paper and washed on the funnel withwatt(i at about 50 C until the filtrate was neutral. The product was transferred toa dish and dried overnight in a forced air oven at 45 C.
The product was then transferred to a 4000-ml, three-necked, round-bottomedflask equipped with a thermometer, electric stirrer, and dropping funnel. Glacialacetic acid (1000 ml) and 4 ml of sulfuric acid were added to the flask with constantstirring. A 280-mi portion of acetic anhydride was added slowly to the slurry bymeans of the dropping funnel with constant stirring. After the addition was complete,the reaction mixture was heated to 70 C, allowed to cool to 50 C, and poured into7000 ml of warm (50 C) distilled water. The mixture was thoroughly stirred andallowed to settle overnight. The supernatant liquid was decanted off and the remainingslurry was filtered through a Whatman No. 1 filter in a Buchner funnel. The productwas washed on the funnel until all trace of acid had been removed and dried overnightin a forced air oven at 45 C.
29

APPENDIX 11
SOLVENT SYSTEMS TRIED WITH BENZYL CELLULOSE DERIVATIVES
1. 25% Ethanol - 75% Acetone
2. 25% Ethyl Acetate - 75% Acetone
3. 25% Dichloroethylene - 75% Acetc ie
4. 25% Butyl Acetate - 75% Acetone
5. 25% MEK - 75% Acetone
6. 25% 1, 2-Dichloroethane - 75% Acetone
7. 25% Formamide - 75% Acetone
8. 25% Tetzahydrofuran - 75% Acetone
9. Dimethylformamide - Heat - Acetone
10. Dimethylsulfoxide - Heat - Acetone
11. Dioxane - Heat - Acetone
12. Chloroform
13. Ethyl Ether
14. Acetone
15. Formarnide and Acetone
16. Ethyl Acetate
17. Ethanol and Acetone
18. Isopropyl Alcohol
19. Butyl Acetate, Acetone, Methylene Chloride
20. Acetonitrile and Acetone
21. Toluene and Acetone)+ Ethanol
L2. Toluene and Acetonel
23. Ethylenediamine plus Ethanol
24. Isopropyl - Acetate plus Acetone
25. 2-Methoxy Ethyl Acetate plus Butyl Acetate plus Acetone plusMethylene Chloride
26. Acetic Acid plus Acetone
27. a To'uenethiol plus Acetone
31

28. Toluene, Acetone, Alcohol, Monochlorobenzene plus Heat
29. Butyl Acetate, Toluene, Methylene Chloride, Acetone plus Heat
30. Butyl Acetate, Toluene, 2-Methoxy Ethyl Acetate, Acetone, Alcohol plus Heat
31. Butyl Acetate, Toluene Acetone, Alcohol plus Heat
32. Butyl Acetate, Acetone, Methylene Chloride plus Heat
33. (25% Butyl Acetate, 75% Acetone) (Tetr rofuran, 25%, and 75% Acetone)
plus MEK plus Ethyl Acetate plus Heat
34. N-Hexane, Acetone, Toluene plus Heat
35. Toluene, Dichlorethane, Acetone
36. Alcohol, Toluene
37. Ethyl Acetate 25%, 75% Acetone, Toluene, 1, 4-Dioxane
38. Trichloroacetic Acid, Acetone plus (Toluene)
39. Alcohol, Ph3nol, Acetone plus Heat
40. Aniline, 25% Ethanol, 75% Acetone plus Heat
41. Furfural, Toluene, Acetone plus Heat
42. Carbon Tetrachloride, Toluene, Acetone
43. Kerosene, Toluene, Butyl Acetate
44. Turpentine, Acetone, Tetrahydrofuran, 25% Ethyl Acetate, 75%/ Acetone
45. Paint Thinner, Alcohol, Toluene
46. Blending Thinner (Dupont), 25% Formamide, 75% Acetone
47. Carbon Disulfide, Toluenie
48. 2-Methoxy Ethyl Acetate, Dupont Thinner
49. Acetic Acid, Acetone, Toluene, Alcohol
50. Hot Methanol
51. Hot Acetic Acid, Hot Methanol
52. Ethyl Ether, H2 0
53. Benzyl Chloride, Alcohol
54. Benzyl Chloride, Chloroform
55. Benzyl Chloride 3 ml, Ethanol 2 ml plus Heat
32

56. Dilute H 2 SO4 , Acetic Acid - Dissolved
57. Dilute H2SO4, Acetic Acid plus Acetone
58. Dilute H2 SO 4 , Acetic Acid Anhydride, Ethanol
59. HCI, Acetone
60. H 2 S0 4 , Acetic Acid, Acetic Anhydride - Dissolved plus H2 0
61. Ethylene Glycol Monomethyl Ether, Heat - Toluene
62. N-Amyl Alcohol - Toluene - Acetic Acid - Diluted H2 S0 4
63. Mixture in Bottle - Acetic Anhydride plus Heat
64. Ethyl Oxalate - Heat - Toluene - Heat - Acetic Acid - Heat
65. Benzyl Alcohol - Diluted H2 SO 4
66. TrietRhl Phosphate - Heat, Alcohol, Acetic Acid - Heat
67. Nitrobenzene, Benzyl Chloride, Heat, Toluene, Heat
68. Nitrobenzene, Heat, Ethanol, Heat
69. Nitrobenzene, Heat, Acetone, Heat -
70. Tetraethylammonium Hydroxide (10% in H2 0), Acetone, Acetic Acid,Benzyl Chloride, Heat
71. Diethylene Glycol, Heat, Ethyl Ether
72. Nitrobenzene, Ethanol, Toluene, Acetic Acid, Acetone
73. Benzyl Chloride, Ethanol, Butyl Acetate, Acetone, Toluene, Ethyl Acetbe
74. Toluene, Ethyl Acetate, Tetrahydrofran, Acetone, Methylene Chloride
75. Dimethyl Sulfoxide, Ethanol, Methylene Chloride, Acetone
76. Dimethylformamide, Acetone, Ethanol, Isopropyl Acetate, Isopropyl Alcohol
77. Hot Acetic Acid, Ethylene Glycol Monomethyl Ether, Ethanol, Benzyl Chloride
78. Benzyl Chloride, Toluene, Benzene, Methanol
79. Acetone, Benzyl Chloride, Benzene1
80. Mg (CLO4 )2 , Acetone, Dimethyl Sulfoxide
81. Acetone, Benzyl Chloride, Ethanol, Ethylene Glycol Monomethyl Ether,Dimethyl Sulfoxide
82. Toluene, Butyl Acetate, Acetone, Acetic Acid
33

r!
83. Dimethyl Sulfoxide, Acetone
84. Dime hylformamide, Dimethyl Sulfoxide, Acetone
85. Formamide, Acetone, Dimethyl Sulfoxide
86. Ethanol, Benzyl Chloride, Acetone, Dimethyl Sulfoxide
87. Tetrahydrofuran, Methylene Chloride, Acetone, Benzyl Chloride
88. Ethanol, Dimethyl Sulfoxide, Isopropyl Alcohol
89. Acetone, Nitrobenzene, Toluene, Dimethyl Sulfoxide
90. Dimethyl Sulfoxide, Benzyl Chloride
91. Diethylene Glycol Monobutyl Ether, Dmethyl Sulfoxide, Acetone, Heat,Benzyl Chloride
92. 2-(Benzyloxy) Ethanol, Heat, Diethylene Glycol Monobutyl Ether, Benzyl
Chloride, Heat
93. Mixed, Acetone, Dimethyl Sulfoxide, Benzyl Acetate
94. 2-(Benzyloxy) Ethanol, Dimethyl Sulfoxide
34

_vi
A PPENDIX III
ANALYSIS OF URINE FOR SALT AND UREA BY CONDUCTANCEAND REFRACTIVE INDEX MEASUREMENTS
This method was originally devised for the analysis of mixtures of Podiumchloride and urea which were used in the evaluation of reverse osmosis membranes.Upon further consideration of the method, it was also found adequate for determiningthe salt and urea concentrations in urine. The analytical method has been ucess-fully used for determining the percent rejection of salt and urea upon passing urine Jthrough reverse osmosis membranes.
Composition of Urine
Although the composition of urine varies from person to person and from dayto day, it is possible to give in approximate composition for a typical urine specimen.Based on analytical data (refs 5, 6), the molarities of the main organic constituentsare approximately 0. 35 M urea, with the next most important component being0.01 M creatinine. Within an accuracy of about five percent, urea may thereforebe considered on a molarity basis as the only organic constituent of urine.
The situation is slightly more complex for the electrolyte components ofurine. Typical normalities for these components are: sodium 0. 13 N, potassium0. 043 N, ammonium 0.03 N, calcium 0. 007 N, magnesium 0.006 N, chloride 0. 14 N,sulfate 0. 036 N, phosphate 0.019 N, and bicarbonate 0. 016 N. The normality of thetotal salt concentration, obtained by adding the normalities of the positive or negativeions, is approximately 0. 21 N.
Conductance Measurements
It has been possible to analyze urine solutions, before and after pagnligthrough a reverse-osmosis membrane, by measuring the conductance and refractiveindex. First, letus consider the factors which affect the conductance. It car. beshown (ref 7) that the normality, N, of a single component salt solution Is given bythe relationship
1000 KL (1)
A
in which
K = cell constant of the conductivity cell
L = measured conductance of the solution in mhos
A= equivalent conductance of the salt.
35

For strong electrolytes, such as sodium chloride and potassium sulfate, the equi-valent conductance approaches a limiting value, As. Therefore, the normality of adilute solution of a strong electrolyte is essentially directly proportional to the con-ductance of the solution. For example, the equivalent conductance of a 0. 001 Nsolution of sodium chloride at 25 C is 123. 7, whereas A = 126 5 (sodium chlorideat 25 C). Therefore, for concentrations lower than 10-3N, the error introduced bythe nonlinearity of the conductance is small. In the event that more accurate resultsare desired, the equivalent conductance can be plotted against concentration and theresults read directly from the graph.
In dilute solutions, the equivalent conductance is the sum of the ionic con-ductances of the individual ions present in the solution. Let us consider the mainions present in urine. At 25 C the ionic conductances at infinite dilution are asfollows: Na + = 50.11, K+ = 73.52, CI- = 76.34, and 1/2 SO4 = 79.8. Upon takinginto consideration the relative concentrations of these ions in urine, the averageequivalent conductance at infinite dilution for the composite solution = 132. 8. Thecorresponding value for sodium chloride is 126. 5. Thus, only a 5-percent errorwill be introduced by considering all the electrolytes in urine as sodium chloride.If greater accuracy is desired, suitable corrections can be made.
The contribution to the conductance from urea is negligible, since the equiva-lent conductance of a 0.03 N solution of urea is only 0. 07 (ref 8), which is only 0.05percent of the value for sodium chloride. Since other organic components of urineare present in extremely small amounts, their contribution to the conductance ofthe solution is also negligible.
Based on the above discussion the conductivity -of a dilute urine solution dependsmainly on the total salt concentration, which may be determined within an accuracyof 5 percent by considering the salt content as NaCl.
In our experimental setup, conductivity measurements were performed at35 C because of the greater ease for maintaining constant temperature. The cellconstant was determined to be 0.3806, and the equivalent conductance for NaCl,ANaCI, equal to 145.6. Then from equation (1)
1000 x 0.3806
NNaCI 145.6 L 2.6L (2)
where L, the measured conductance, is expressed in mhos.
In practice, urine solutions need to be diluted by a factor of about 100 toreduce the total salt concentration to below 1 x 10- N. After passing the urinethrough the membrane, assuming a salt rejection of about 90 percent, the solution
36

IIneeds to be diluted by a factor of about ten to reduce the normality to approximatelythe same level. Introducing the dilution factor, f, into equation (2) we obtain
N =2.6 fL (3)NaCI
In addition, a correction of about 3 $jmhos needs to be subtracted from thevalue of L to correct for conductivity of water. It should be borne in mind that solu-tions for conductivity measurements should not be stored in soft-glass bottles sincesignificant amounts of salt may be absorbed from the glass. Thus, all conductivitytype water and solutions for conductivity measurement must be kept in pyrex con-tainers.
Refractive Index Measurements
Refractive index determinations were performed using a Brice-PhoenixDifferential Refractometer. Measurements versus water at 436 mk were made onvarious concentrations of aqueous solutions of sodium chloride and urea, verifyingthe proportionality between the refractive index difference and the concentration.The following relationships were established for the refractometer.
N 0. 0977 (M - M )(4)NaCI w s
N 0.1129 (Mw-M s ) (5)
where Mw = instrument reading for water, and Ms = instrument reading for solution. *The refractive index difference n can be calculated according to the equation-
n = k(M W-M) (6)
where k is the calibration constant for the selected wavelength which equals 1. 03 x10- 3 in our case. Since we are interested only in the normalities of NaCi or urea,the absolute value n of the refractive index difference nsed not be evaluated.
The assumption was made that the refractive-index difference relative towater for a solution containing both NaCI and urea was the sum of the refractive-index differences for solutions containing only NaCl or urea. Thus
n(NaCl + urea) nNaCl n urea (7)
*In our case we were making measurements only with the water in the side of the celltowards the lamp housing.
37
_iT

Combining equations (6) and (7) we obtain
4M - M) (NaCI + urea)=(M - M) + (Mw -M)urea (8)ww a w NaCI a
Upon substituting equations (4) and (6) into equation (8) and solving for N weobtain urea
N 0. 113 (M - M )(NaCI + urea) - 1. 16 NNcI (9)urea w s a~
For urine, it is necessary to dilute the solution by a factor of 5 so that accuratemeasurements of (Mw - Ms ) can be made. In other cases, such as for measurementsof even more concentrated solutions, dilutions by other factors are necessary. LetR be the dilution factor. Then equation (9) becomes
N =O.1ll3p(M w (M10)11Nurea w M2)(NaCI + urea) . 16NNaCI (10)
where N and N refer to the undiluted solution, and (M - Murea, NsCl w a (NaCI + urea)
to the diluted solution.
Alternatively the normality of the urea in a solution of NaCI and urea can bespecified in terms of the measured conductance, L, and the refractive index instru-ment reading M.w - Mg by combining equations (10) and (3). Then
Nurea = 0.113p(Mw - M )- 3.00 fL (11)
where p. and f are the dilution factors for the (Mw - M.) and L measurements,respectively. The extents of dilution, p, and f, should preferably be selected sothat the readings are in the range of maximum accuracy. For the instruments usedIn the study it in desirable that conductivity readings be between 100 and 4000 1Lmhos,and refractometer instrument readings be between 1.00 and 4.00.
The validity of equations (3) and (11) was tested by making measurements onknown solutions. The agreement between the analytical results and the normalitiesof the solutions verified that these equations gave results accurate to within about5 percent. For example, determination of a known solution of 0. 273 Nurea and0. 138 NNaC! gave values of 0.281 Nurea and 0. 134 N NaC. Even better agreement
was obtained for a known mixture of 0.20 N NaC and 0. 30 N urea. Calculations based
on conductivity and (Mw - M ) measurements gave values of 0.205 N NaC and
0.300 Nurea
38

The measurements made with the differential refractometer are also appli-cable to urine. As stated previously the main salt ions present in urine, other thanNa + and C1- are K+ and S04-. According to the literature (ref 9), the refractiveindices at 20 C and 589 mp for 0. 1 N solutions of NaC1, K2 SO4 , and KC1 are all1.3341. Thus, the refractive index measurements will, just as with the conductivitymeasurements, respond in approximately the s&me way to all the main salt ionspresent in solution. Therefore, the analytical method described is applicable alsoto urine, where the normality of the total salt content is reported in terms of thenormality of NaC1. Furthermore, measurements of urine solutions by these analy-tical techniques have given results in agreement with the urea and salt concentrationsreported in the literature. For example, one urine sampling resulted in a calculatedurea content of 0.31 N and a salt content of 0.23, N, in approximate agreement with0.35 N urea and 0.21 N salt content found in typical urine (refs 5 and 6).
A further check to determine the validity of applying this method to urine andpurified urine solutions was made by comparing the results obtained with the totalsolids content. For this comparison, the total solids was determined by evaporatinga measured volume 3f urine to dryness by heating at 50 C. On a representativesample, the total solids of the sample was found to be 36.74 g/l. Using the c.)nduc-tivity and refractive index methods described herein, the sample was found to be0.243 N with respect to NaCi and 0.370 N with respect to urea. By converting theseconcentrations to total solids content (using the molecular weights of 58.45 for NaCIand 60.06 for urea) a calculated total solids content of 36.43 g/l. was obtained.Thus, in this case, the results from the two methods agree to within 1 percent.
ANALYTICAL PROCEDURE:
Apparatus:
Conductivity Bridge, Industrial Instruments, Inc., Model RC-18, or equivalent
Conductivity cell, Platinized Electrodes, Cell Constant%-- I/cm
Constant temhperature bath
Differential Refractometer: Brice-Phoenix Model BP 2000 V, or equivalent
Split cell, for refractive index measurements
Volumetric flasks, 10 ml, 50 ml, 100 ml, 500 ml
Pipettes, 1 ml, 5 ml, 10 ml, 20 ml
39

Determination of Cell Constant:
1. Dissolve 0. 3728 g of reagent grade potassium chloride in conductivity-type water and dilute to 500 ml in a volumetric flask. (This will yield a 0. 01000 Nsolution of potassium chloride.)
2. linse the conductivity cell at least three times with conductivity-typewater.
3. Fill the conductivity cell with conductivity-type water and place in the
constant temperature bath at 25.0 ± 0. 1 C for 10-15 min.
4. Measure the conductivity of the water using the conductivity bridge.
5. Empty the cell, refill with conductivity-type water, bring to equilibriumin the constant temperature bath, and measure the conductivity.
6. If the conductivity of the water as measured in step 5 is not the same asthat in step 4, repeat step 5 until two consecutive measurements are the same. (Thiswater should be from the same source as that used in making the standard solutionof potassium chloride.) This value is the measured conductivity of the water, L .
w
7. Rinse the conductivity cell three times with the standard solution of po-tassium chloride prepared in step 1.
8. Fill the conductivity cell - h the standard solution of potassium chlorideprepared in step 1 and place in the c 6ant temperature bath at 25. 0±0. 1 C far10-15 min.
9. Measure the conductivity of the standard solution of potassium chlorideusing the conductivity bridge.
10. Empty the conductivity cell, refill with the standard potassium chloridesolution, bring to equilibrium in the constant temperature bath, and measure theconductivity.
11. If the conductivity determined in step 10 is not the same as that obtainedIn step 9, repeat step 10 until two consecutive measurements are the same. This isthe measured conductivity of the solution Ln .
40

ri
Calculation:
K K 0.001411 Cell Constant
L -L (L L)n w n w
Notes:
1. In all conductivity measurements, the solution being measured must beprotected from the atmosphere because the solutions will pick up carbon dioxide fromthe air which will increase the conductivity of the solution. Thus the container shouldbe stoppered at all times or, if a siphon is in use, it shovd be protected from the airby a drying tube containing Ascarite.
2. Conductivity-type water should have a specific conductance no greaterthan 1 micromho. (A specific resistance of 1, 000,000 ohms or greater.) Waterof this quality can be obtained by several consecutive distillations through quartzapparatus, or by deionizing the water by passing it through a strong acid, strongbase mixed resin ion exchanger.
3. The conductivity cell should be well filled with solution because, if theamount of liquid is Just sufficient to cover the electrodes, the cell constant will bedependent upon the volume of liquid present in the cell. Some celle are designed toovercome this difficulty by having a glass envelope around the electrodes, whereasother cells must be filled well above the electrode area. It is for this reason thatthe cell constant is measured using known solutions rather than by calculation fromthe geometry of the cell.
Determination of Salt Concentration by Conductivity Measurement:
1. Dilute the unknown solution so that the measured conductivity will fallwithin the limits of about 100 micromhos to 4000 micromhos, by quantitatively trans-ferring a known volume, using a pipette, to a volumetric flask, and diluting to volumewith conductivity-type water. (For raw urine, pipette 1.0 ml of the sample into a100-ml volumetric flask and dilute to volume with conductivity-type water. For thesolution obtained after passage through the reverse osmosis cell, dilute 1 ml ofsolution to 10 ml or 10 ml of solution to 100 ml.)
2. Rinse the conductivity cell with the unknown solution, fill the cell withthis solution and place in the constant temperature bath at 25. 0 + 0. 1 C for 10-15min.
3. Measure the conductivity of the solution with the conductivity bridge.
4. Empty the cell, iefill with the unknown solution, bring to equilibrium inthe constant temperature bath and measure the conductivity.
41

5. If the measured conductivity is not the same as that obtained in step 3,repeat step 4 until two consecutive measurements are the same.
Calculation:
-6 -61000 K Vf (L - L) 10 8.081 K Vf (L - L) 10NNaCI A
V5 5l
in which N NaC - normality of sodium chloride in the solution, K = cell conF' 'nL,L M conductivity of unknown solution in micromhos, L = conductivity in micromhosof water used for dilution, Vf = volume in ml of diluted solution, V = volume in mlof unknown solution, and A = equivalent conductance of sodium chloride (123. 74 at25 C for a 0.001 N solution).
Notes:
1. If a temperature other than 25 C is selected, the equivalent conductance ofthe sodium chloride will change. Thus, in our case, 35 C was used at which temper-ature the equivalent conductance of sodium chloride is 145.6.
2. If desired, a graphical method can be used to determine the concentration.In the graphical method, a series of standard solutions of sodium chloride are madeup in the concentration range of the unknown solutions to be measured. The conductivityLm of each of these standard solutions is measured at constant temperature. Theconductivity L w of the water usud to prepare the in1, , ir.. :s is determined. A graph isprepared in which (L. - Lw) is plotted against tb-? novinalitv of sodium chloride. inusing this method measurements are made of the cohiuctivity L_ of the unknown solu-tion and the conductivity Lw of the water used in the dilutions. TFe concentrationof sodium chloride is than read off the graph. The result fs multiplied by the dilutionratio Vf V.
3. 'rbe conductivity of the water, Lw, is measured as described in steps2-6 under d d6,-rmination of cell constant.
Determination of Urea Concentration:
Determination of standard curve of sodium chloride vs. refractive indexchanke.
1. Dissolve 14.6100 g of reagent grade sodium chloride in distilled waterand dilute the resulting solution to 500 ml in a volumetric flask. (This yields a0.5000 N solution of sodium chloride.)
42

2. Pipette the aliquots shown in the following table into the indicated volu-metric flask, and dilute to volume with distilled water.
Vol Std Soln Vol Diluent Normality(mlI )ml) of soln
undiluted -- - 0.500
5.00 5.00 0.250
20.00 30.00 0. 200
10.00 40.00 0.100
10. 00 90. 00 0. 050
3. Fill both halves of the split cell with distilled water. Use the mercurylight source of the differential refractometer with the filter to yield the 436 ni% line.
4. Read the differential refractometer. This gives the solvent zero reading,Mw.
5. Empty the refractometer cell, fill one-half with distilled water and theother half with the 0.050 N sodium chloride solution.
kI
6. Read the differential refractometer. This is the solution reading, Ms.s
7. The difference in the readings is Mw - MS.
8. Plot M - M vs. the normality of the solution.w S
9. Repeat steps 5-8 for each of the other four solutions, goL'ng from the mostdilute to the most concentrated.
10. Determine the average sl, 1v of the resulting curve, kI (for our instru-ment kI = 0.0977); The normality of we sodium chloride can now be calculated fromthe equation:
NaC = k(M w -M s)NNaCl k1 (M W s
43
1-.

Determination of Standard Curve of Urea vs. Refractive Index Change:
1. Dissolve 15. 0150 g of reagent grade urea in distilled water and dilutethe resulting solution to 500 ml in a volumetric flask. (This yieids a 0.5000 Nsolution of urea.)
2. Pipette the aliquots shown in the following table into volumetric flasks,using distilled water as diluent,
Vol Std Soln Vol Diluent Normality(ml (ml) of soln
5.00 5.00 0.250
20.00 30.00 0.200
10.00 40.00 0.100
10.00 90.00 0.050
3. Fill both halves of the split cell with distilled water. Use the mercurylight source and the filter to yield the 436 m line.
4. Read the differential refractometer. This gives the solvent zero reading,Mw .
5. Empty the refractometer cell, fill one-half with distilled water and theother half with the 0. 050 N solution of urea.
6. Read the differential refractometer. This is the solution reading Ms .
7. The difference in readings is Mw - M s .S'
8. Plot M - M5 vs. the normality of the solution.w
9. Repeat steps 5 - 8 for each of the other four urea solutions, goingfrom the most dilute to the most concentrated.
10. Determine the average slope of the resulting curve, k2 (for our instru-ment k2 = 0. 1129). The ncrmality of the urea can now be calculated from theequation:
Nurea k 2 (m - M)
44

ANALYSIS OF UNKNOWN MIXTURES FOR UREA AND SODIUM CHLORIDE
1. Determine the normality of the sodium chloride by the conductometricmethod as previously described.
2. Dilute the solution, so that the reading of the differential refractometeris on scale. For raw urine, pipette 10. 00 ml of the urine into a 50 ml volumetricflask and dilute to volume with ditilled water. * For solutions which have been
passed through a reverse osmosis cell, the solution can usually be read undiluted.
3. Fill both halves of the split cell with distilled water and read on the dif-ferential refractometer using the mercury source and the filter to give the line at436 m4.. This gives the solvent zero reading, Mw .
4. Fill half of the cell with the diluted unknown mixture and the other halfof the cell with distilled water.
5. Read the differential refractometer to determine M s .
6. Calculate the difference in readings, M w - Ms .
Calculation:
NNaCI = normality of the undiluted solution with respect to sodium chloride
as determined from conductivity measurements and
NN Vkurea 2 1 V (Mw- s]
in which N - normality of urea in the i.. 'xture, k calibration constant for ureaurea 2
as determined from standard solutions, N normality of the sodium chloride inNaCl
the undiluted mixture, k I = calibration constant for sodium chloride as determinedfrom standard solutions, Mw reading on the differential refractometer with wateron both sides of the split cell, M. = reading on the differential refractometer with
the diluted solution of the mixture on one side of the cell (toward the microscope)
*Jf the same solutions are to be used for conductivity and refractive index measure-
ments, use conductivity-type water rather than distilled water. In our laboratorieswe use conductivity-type water for all dilutions and solutions, even though it is not
required for the refractive index measurements.
45
171 _ __ _-- --- ~ - __ __

and water on the other side of the split cell (toward the light source), Vs volume inml of the solution after dilution, and Vm = volume of ml of the unknown solution used
Vin the dilution. -= dilution factor.
V
Notes:
1. In the normal use of the differential refractometer, readings are madewith the cell in two positions, 180 degrees out of phase. This is done to correct forthe inaccuracies in cell construction. However, with our instrument, a slightlygreater range was realized by making all measurements in the same cell position,i. e., with the solvent and solution in the same position relative to the light sourceand eyepiece. Therefore, in our laboratories, all measurements were made withthe water toward the light source and the unknown solution toward the eyepiece. Asa result, the constants obtained will hold only for our particular instrument in theconfiguration in which it was calibrated.
46

I. ____________-_
REFERENCES
1. Ambard, L., Trautman, S., Ultrafiltration, C.C. Thomas PublishingCo., Springfield, Illinois, 1960.
2. McBain, J.W., Kistler, S.S., "The Hydration of Sucrose in AqueousSolution," J. Physical Chem., 33:1806-12, 1929.
3. Ferry, J. D., "Ultrafiltration Membranes and Ultrafiltration," Chem.Revs., 18:373-456, 1935.
4. Loeb, S., Sourirajan, S., Sea Water Demineralization by Means of aSemipermeable Membrane, Univ. Calif., Dept. of Eng. Reports, No. 60-60, 1960.
5. Altman, P.L., Dittmer, Dorothy S. (Ed.), Biology Data Book, AMRL-TR-64-100, Aerospace Medical Research Laboratories, Wright-Patterson Air ForceBase, Chio, p 186, October 1964, AD 454 590.
6. Meier, E.A., Everett, Jr. , R., Feasibility of Using Membranes forUrine Purification, AMRL-TDR-63-113, Aerospace Medical Research Laboratories,Wright-Patterson Air Force Base, Ohio, November 1963, AD 427 413.
7. Prutton, C. F., Maron, S. H. , Fundamental Principles of PhysicalChemistry, Revised Edition, MacMillan Co., New York, p 449, 1951.
8. International Critical Tables, Vol VI, McGraw-Hill Book Co., NewYork, p 261, 1929.
9. International Critical Tables, Vol. VII, McGraw Hill Book Co., NewYork, p 65, 1930.
47

S.urity Cla sificatlon
DOCUMENT CONTROL DATA. R & D(SOO-It- . ,a040rftI' ot i111, body vf ebarrect and Idex In# annotelo miuAf be on tared when the o "tali repotl Ia c l&a*Iffed,
I1ant0!;4A T'NI A C TIVIlT Y
(C.PS"INWoM OuItotJ . REPO? SECURITY CLASSIFICATION
Melpar, Inc., an American-Standard Company UNCLASSIFIED7700 Arlington Boulevard1 a-ouP
Falls Church, Virginia 22046 N/A3 pOR T 9Lg
WATER RECLAMATION BY REVERSE OSMOSIS
4 OCICImUPTIV9 NOI~k f 'TPpv otrreport and Inclusiv. dates)
Final Report, April 1967-August 1968S. AITj ?14ON11 (9." 'a. middle I . a., loe b o.eJ
John i-±. Fossum, PhD
S. REPOnT OAT9 7.. TOTAL NO. PAGE 14b. NO OF" itE S
May 1969 47 9SCONTRACTR 0 GRANT NO F33615-67-C-1534 I. ORIGINATOR'S REPORT NUMBER $)
Po, ac NO. 6373 7256
Task No. 637304 2b. OTN C REPORT NOISI (An od,.,n.=.b,,. dua mp be des*edthis report)
d. Work Unit No. 637304003 AMRL-TR-68-190IC 0IITRIPUTION STATEM4ENT
This document has been approved for publicrelease and sale; its distribution is unlimited.
it. IUPPLEMENTAR"Y'NOTES la 11PONIORING MILITARY ACTIV'ITY
Aerospace Medical Research Laboratory,Aerospace Medical Div., Air Force SystemsCommand, Wright-Patterson AFB, OH 45433
- A laboratory reverse osmosis system capable of purifying 4 liters of a mixture of2. 4 liters of urine and 1. 6 liters of either wash or dehumidification water in a 24-hourperiod was fabricated, by Melpar, Inc. The quantitative rejection of urea by the mem-branes was found to be the major problem. Urea rejection by complexing urea withvarious chemicals was investigated but no significant increase was realized. Theeffect of storage conditions on membrane performance was investigated. A study wasmade of 'the annealing of cellulose acetate membranes and attempts were made todevelop satisfactory benzyl derivatives of cellulose acetate. A method was developedwhich permitted a rapid evaluation of membrane performance. A satisfactory membranewas found to result from the precise control of the annealing process.
17'3'.,14 7_3Security Classification

security Classificatlon
14 LINK A LINK U LINK CKeY WOROS - - -
ROLE WT ROLE WT ROLK WT
Reverse osmosisCellulose acetate membranesPotable water from urinePerchlorate methodFormamide method
SeCU ,Ity Clai&SWIcution