Embed Size (px)
DESCRIPTION
Recognition of Vitrinite With Non-uniaxial Negative Reflectance Characteristics
Citation preview
International Journal of Coal Geology, 9 (1988) 267-285 267 Elsevier Science Publishers B.V., Amsterdam - Printed in The Netherlands
Recognition of vitrinite with non-uniaxial negative reflectance characteristics
W.E. KILBY
Geological Survey Branch, B.C. Ministry o[ Energy, Mines and Petroleum Resources, Parliament Buildings, Victoria, B.C. V8 V 1X4, Canada
(Received July 15, 1986; revised and accepted May 7, 1987)
ABSTRACT
Kilby, W.E., 1988. Recognition of vitrinite with non-uniaxial negative reflectance characteristics. Int. J. Coal Geol., 9: 267-285.
Non-uniaxial negative reflectance characteristics are being reported for coals from around the world with increasing frequency. These data have traditionally been collected from oriented sec- tions cut from a block of coal to determine the magnitudes of the principal reflectance axes. To make data collection less time-consuming, a method of determining the principal reflectance axes from a standard, crushed coal sample has been developed. The method requires measurement of the maximum and minimum apparent reflectances from a series of randomly oriented vitrinite particles. The reflectance crossplot displays these two reflectance values against their difference or bireflectance. The paper describes the method of interpreting the resultant pattern to determine the values of the three principal reflectance axes.
Analysis of coals from the British Columbia Rocky Mountains and Foothills revealed biaxial and uniaxial positive as well as uniaxial negative reflectance characteristics.
A new measure of maturation, Rev, is proposed which is based purely on the lengths of the three principal reflectance axes./~m approximates this value but is influenced by any eccentricity of the reflectance indicating surface (RIS). Vitrinite with a non-uniaxial reflectance characteristic can- not be adequately described by a single measure such as Rmax or/~m but requires reference to both the size and shape of the RIS. A reflectance determination such as Rev or/~m provides rank (ASTM) information whereas the new measures Rst and R ~ describe a reflectance indicating surface shape which is the result of maturation and tectonic histories.
Vitrinites with non-uniaxial negative reflectance characteristics are abundant in the coalfields of the Rocky Mountains and Foothills of British Columbia./~max does not fully describe the re- flectance character of these coals and does not describe the potentially useful RIS shape.
INTRODUCTION
Vitrinite in bituminous coal is considered to behave as an uniaxia] negative absorptive material. The use of the common reflectance measurement Rmax (mean maximum vitrinite reflectance in oil) is based on this assumption.
0166-5162/88/$03.50 © 1988 Elsevier Science Publishers B.V.
However, all increasing number of' coals of various ranks from around the world are being reported to have biaxial reflectance indicating surfaces ( RIS ) ~ Cook el al.. 1972; Stone and Cook, t979; Hower and Davis, 1981; Levine and Davis, 1984: Kilby, 1986).
Investigation of the RIS ior vitrinite in coals has generally been performed by means of sections cut from oriented block coal samples. This technique is difficult and time-consuming, although some spectacular successes have been reported ( Levine and Davis, 1984 ). The reflectance crossplot technique (Kilby, 1986) provides a means of determining the three principal axes of a vitrinite RIS from a standard particulate sample. Kilby (1986) compared RIS deter- mined using oriented sample techniques with the RIS determined from the crossplot method. Due to problems with varying RIS orientations within vi- trinite bands and between vitrinite bands on an oriented polished section the oriented section technique proved unsatisfactory. In the case of the few ori- ented block samples which provided consistent RIS characteristics from all oriented faces the RIS calculated by the crossplot method was in close agree- ment, R,'l,~x and R~l~n, the apparent maximum and minimum reflectance values from a single vitrinite particle, are plotted against the corresponding bireflect- ance to construct the reflectance crossplot. Interpretation of this plot yields the magnitudes of the three principal axes of the ellipsoidal RIS. This tech- nique is now in standard use by the Coal Subsection of the Geological Survey Branch of the British Columbia Ministry of Energy, Mines and Petroleum Resources. The technique was developed by evaluating a variety of statistical and graphical procedures with theoretical reflectance data generated from el- lipsoids of' various shapes, reflectance indicating surfaces. Subsequent reflec- tance results obtained from coal samples formed reflectance crossplot patterns very similar to those predicted by the generated data but including scatter due to natural and measurement variance. Analysis of natural samples in this study shows that vitrinites with uniaxial negative through biaxial to uniaxial positive characteristics are common in the Peace River and Elk Valley Coalfields of the Western Canadian Cordillera.
The wide variety of RIS shapes found in real samples prompted a theoretical study of RIS shapes as they relate to standard reflectance measurement and recording techniques. The study revealed that /~m,x and/~,~ are not directly related and their values are related to the eccentricity of the reflectance indi- cating surface as well as the magnitudes of the three principal reflectance axes.
REFLECTANCE INDICATING SURFACE
Generally, vitrinite is considered to behave as uniaxial negative absorptive material ( Goodarzi, 1975; Davis, 1978 ). In such a material three mutually per- pendicular axes describe an oblate spheroid with a short c axis oriented normal to bedding; the two remaining axes are equal in length and lie within the bed-
269
A B C D
SPHERE OBLATE SPHEROID c
b b
I I l I t
i a=b:c I J a=b>c I I I
, I i I
a a
ISOTROPIC UNIAXlAL NEGATIVE
OBLATE ELLIPSOID
c
I ] J I b > a > c I I I
a
PROLATE ELLIPSOID
c
I i I I i l b > a : c I i I I I I i
a
BIAXIAL UNIAXlAL POSITIVE
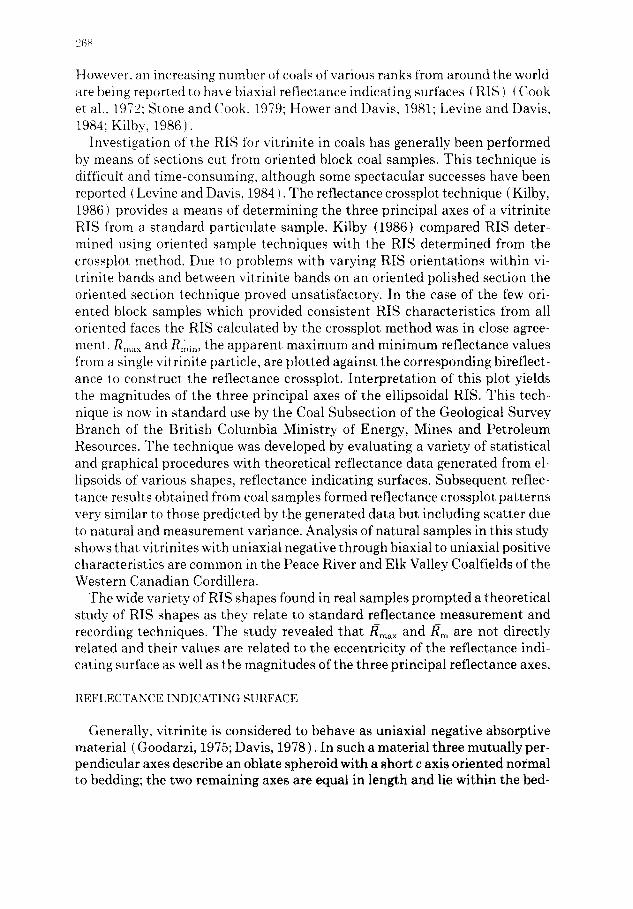
Fig. 1. Reflectance indicating surface shapes and corresponding reflectance readings expected from sections of various orientations through (A) isotropic, (B) uniaxial negative, (C) biaxial, and (D) uniaxial positive vitrinites. Modified after Davis (1978) and Stone and Cook (1979).
ding plane (Fig. 1B). These three axes are referred to as the maximum, inter- mediate and minimum reflectance axes (R . . . . Rin t and Rmin). The aromaticity of vitrinite in coal increases with increasing rank. The aromatic lamellae of vitrinite become organized parallel to bedding, perpendicular to the maximum stress direction but with no preferred orientation within the bedding plane. The maximum stress is generally attributed to overburden loading and bedding is assumed to be horizontal, therefore the aromatic lamellae grow or are ar- ranged in a horizontal direction (Stach et al., 1975). This process is not com- pletely understood but studies such as those by Goodarzi and Murchison (1972) and Oberlin et al. (1975) have documented some of the molecular scale reac- tions occurring during maturation.
Figure 1 illustrates possible RIS shapes and the expected reflectance pat- terns that would be obtained from oriented surfaces cut through them using polarized light and rotating the microscope stage. In an isotropic substance, represented by a spherical RIS (Fig. 1A), the three principal reflectance axes are equal. Any section cut through this RIS would give the same reflectance pattern. Figure 1B represents a uniaxial negative RIS, where a = b > c. Exam- ination of any section through this RIS would yield an elliptical reflectance pattern, with the exception of a section perpendicular to the c axis, which would give a circular pattern. The axes of the reflectance ellipse provide a unique true maximum reflectance value, Rmax, and an apparent minimum reflectance value, Rmin. Rmi, values range from the true minimum, which can be obtained only in
27o
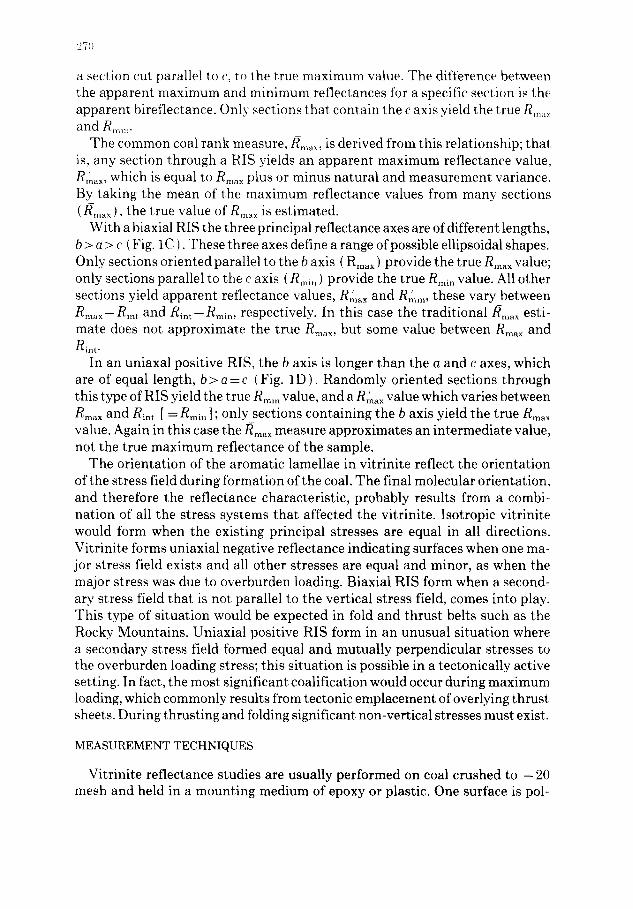
a section cut parallel to c, to the true maximum value. The difference between the apparent maximum and minimum reflectances for a specific section is the apparent bireflectance. Only sections that contain the c axis yield the true R ....... and Rmi~,
The common coal rank measure,/~ ...... is derived from this relationship; that is, any section through a RIS yields an apparent maximum reflectance value, R~ax, which is equal to R .... plus or minus natural and measurement variance. By taking the mean of the maximum reflectance values from many sections (/~ma×), the true value of R .... is estimated.
With a biaxial RIS the three principal reflectance axes are of different lengths, b > a > c ( Fig. 1C ). These three axes define a range of possible ellipsoidal shapes. Only sections oriented parallel to the b axis ( R ..... ) provide the true R,,ax value; only sections parallel to the c axis (Rmm) provide the true Rm~, value. All other sections yield apparent reflectance values, R,;ax and Rmin, these vary between R . . . . --Rin t and R i n t - Rmin, respectively. In this case the traditional /~m,x esti- mate does not approximate the true R . . . . but some value between Rmax and R i n t ,
In an uniaxal positive RIS, the b axis is longer than the a and c axes, which are of equal length, b> a = c (Fig. 1D). Randomly oriented sections through this type orRIS yield the true Rm~n value, and a Rmax value which varies between R . . . . and Rint, [ = Rmi n ] ; only sections containing the b axis yield the true R . . . .
value. Again in this case the/~m~ measure approximates an intermediate value, not the true maximum reflectance of the sample.
The orientation of the aromatic lamellae in vitrinite reflect the orientation of the stress field during tbrmation of the coal. The final molecular orientation, and therefore the reflectance characteristic, probably results from a combi- nation of all the stress systems that affected the vitrinite. Isotropic vitrinite would form when the existing principal stresses are equal in all directions. Vitrinite forms uniaxial negative reflectance indicating surfaces when one ma- jor stress field exists and all other stresses are equal and minor, as when the major stress was due to overburden loading. Biaxial RIS form when a second- ary stress field that is not parallel to the vertical stress field, comes into play. This type of situation would be expected in fold and thrust belts such as the Rocky Mountains. Uniaxial positive RIS form in an unusual situation where a secondary stress field formed equal and mutually perpendicular stresses to the overburden loading stress; this situation is possible in a tectonically active setting. In fact, the most significant coalification would occur during maximum loading, which commonly results from tectonic emplacement of overlying thrust sheets. During thrusting and folding significant non-vertical stresses must exist.
MEASUREMENT TECHNIQUES
Vitrinite reflectance studies are usually performed on coal crushed to - 20 mesh and held in a mounting medium of epoxy or plastic. One surface is pod
271
ished and examined. The polished surface intersects many, theoretically ran- domly oriented, coal particles. In reality there may be some preferred orientation due to preferred breakage patterns of macerals. Standard measurement tech- niques are widely used to obtain a value for the amount of incident light re- flected from the polished surface of the coal particles; the light source has a standard wavelength of 546 nm and the immersion oil a standard refractive index of 1.518 at 546 nm and 23°C. The percentage of light reflected is deter- mined with apparatus calibrated against standards of known reflectance. De- pending upon the technique, either polarized or non-polarized incident light is employed. Traverses are made across the polished surface and when a particle of the correct maceral type, commonly vitrinite A, is encountered its reflec- tance is measured. One of the three following measurement procedures are in general use:
(1) measurement is made using polarized light while rotating the micro- scope stage;
( 2 ) measurement is made with polarized light but the stage is fixed; and ( 3 ) measurement is made under non-polarized light and the stage is fixed.
Measurement methods 2 and 3 yield one value, often referred to as Rrandom or Rm, per particle examined; these apparent random reflectances are referred to here as, Rmp and Rmn, for polarized and non-polarized random reflectance. Davis (1978) has shown that mean values from these two measurement methods are equal. Mean random reflectance is hereafter referred to as Rr, when the mea- surement method is unimportant . The first measurement method, stage rota- tion under polarized light, theoretically yields two values, Rma x and Rmin which are encountered twice each during one stage rotation. In natural samples the two apparent maximum and two apparent minimum values may vary slightly due to natural and measurement causes. These two values have various rela- tionships to Rmax, Rint and Rmin depending upon the RIS shape, and the ori- entation of the section being examined.
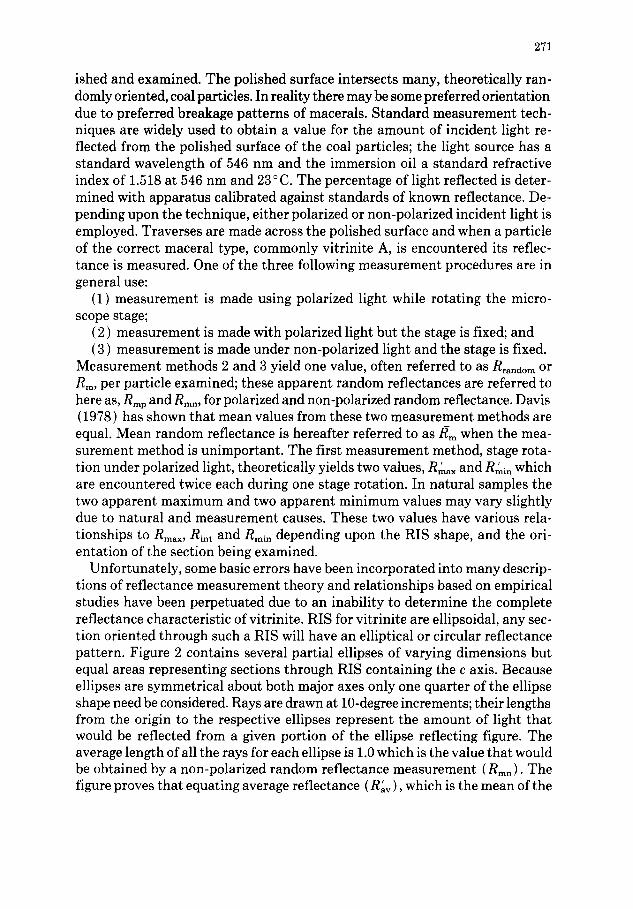
Unfortunately, some basic errors have been incorporated into many descrip- tions of reflectance measurement theory and relationships based on empirical studies have been perpetuated due to an inability to determine the complete reflectance characteristic of vitrinite. RIS for vitrinite are ellipsoidal, any sec- tion oriented through such a RIS will have an elliptical or circular reflectance pattern. Figure 2 contains several partial ellipses of varying dimensions but equal areas representing sections through RIS containing the c axis. Because ellipses are symmetrical about both major axes only one quarter of the ellipse shape need be considered. Rays are drawn at 10-degree increments; their lengths from the origin to the respective ellipses represent the amount of light that would be reflected from a given portion of the ellipse reflecting figure. The average length of all the rays for each ellipse is 1.0 which is the value that would be obtained by a non-polarized random reflectance measurement (Rmn). The figure proves that equating average reflectance (R'av), which is the mean of the
27~
l . E[~L I PBE ]l Rmmx ' ! Rm I n' P R ~
1 ~- 1 . 8 1 . 8
i i \
0 1 Rmax' 2 3
Fig. 2. Partial ellipses with varying axis lengths but equal areas. The rays represent the vibration directions of polarized light and the relative amounts that would be reflected from each direction on each ellipse. The table illustrates the relationship between R/.~,, Rm~,x and R,/.
apparent maximum and minimum reflectances, with the random reflectance obtained with non-polarized light ( Hevia and Virgos, 1977 ) may not be useful. The random reflectance obtained with non-polarized light, Rmn, is propor- tional to the area of the reflectance ellipse presented by each vitrinite particle. The R'av relationship between random reflectance and the apparent maximum and minimum reflectance values is true only when the measured section through the RIS has a circular pattern. Ting (1978) observed that the sum of two read- ings taken under polarized light at 90 degrees to each other on the same coal particle (reflectance ellipse) yields a unique value. This generalization is a good approximation for isotropic to slightly anisotropic vitrinites with low bi- reflectance, however examination of data in Fig. 2 show that the relationship could be more complex. Therefore, the following relationship between Rm and R,~.x and R ' i n is suggested:
Figure 2 and eqn. (1) show that, given Rmax and Rmin, Rm c a n be determined but the reverse is not true. A given Rm value can be obtained from a variety of combinations of R~ax and Rmin values.
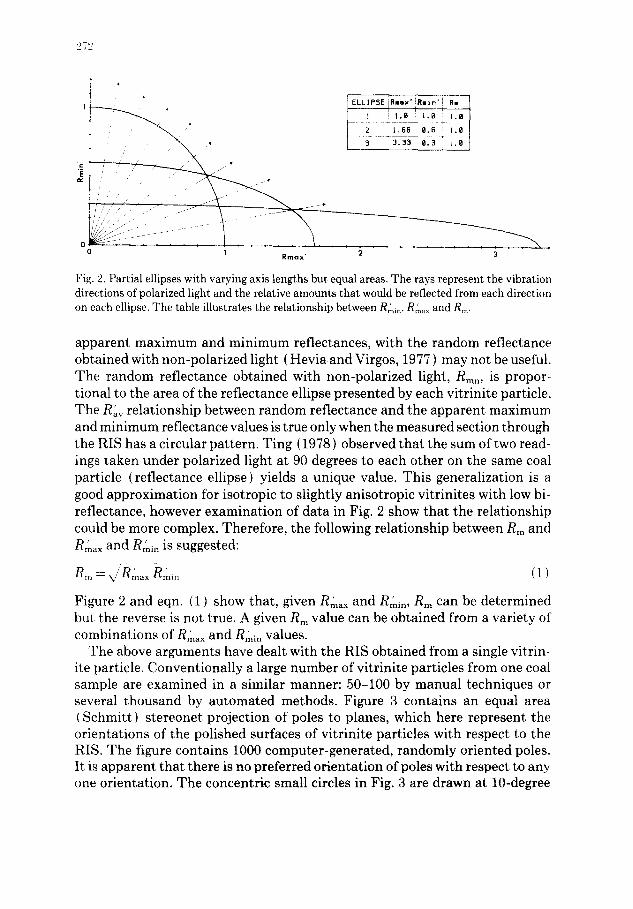
The above arguments have dealt with the RIS obtained from a single vitrin- ite particle. Conventionally a large number of vitrinite particles from one coal sample are examined in a similar manner: 50-100 by manual techniques or several thousand by automated methods. Figure 3 contains an equal area (Schmitt) stereonet projection of poles to planes, which here represent the orientations of the polished surfaces of vitrinite particles with respect to the RIS. The figure contains 1000 computer-generated, randomly oriented poles. It is apparent that there is no preferred orientation of poles with respect to any one orientation. The concentric small circles in Fig. 3 are drawn at 10-degree
273
N
W E
$
Fig. 3. Equal area (Schmitt) projection of 1000 randomly oriented poles to hypothetical sections cut through a RIS. The concentric rings are at 10-degree increments.
increments about a pole oriented vertically. By counting the poles in each zone, or more exactly comparing the areas of the zones, one can determine the prob- ability of a random pole being within a given angular distance of the vertical pole (Fig. 4A). As the poles represent planes perpendicular to the poles, the inverse probability distribution describes the probability of a section plane being within a specific angular increment of a pole or axis. Therefore, for any given population of randomly oriented sections there is a much greater number of section planes within 10 degrees of any linear orientation than between 80-90 degrees from that linear orientation.
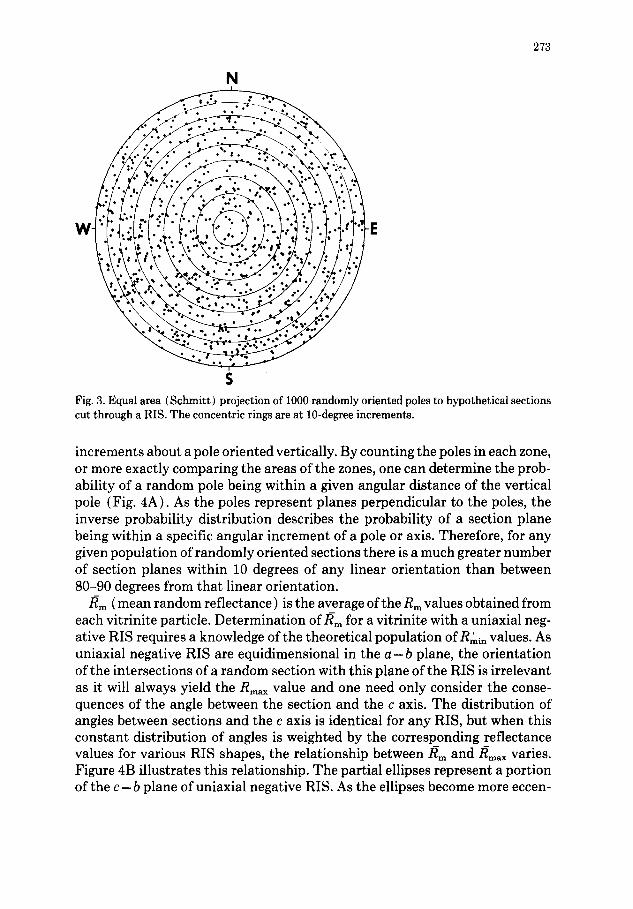
/~m ( mean random reflectance) is the average of the Rm values obtained from each vitrinite particle. Determination of/~m for a vitrinite with a uniaxial neg- ative RIS requires a knowledge of the theoretical population of Rmin values. As uniaxial negative RIS are equidimensional in the a - b plane, the orientation of the intersections of a random section with this plane of the RIS is irrelevant as it will always yield the Rmax value and one need only consider the conse- quences of the angle between the section and the c axis. The distribution of angles between sections and the c axis is identical for any RIS, but when this constant distribution of angles is weighted by the corresponding reflectance values for various RIS shapes, the relationship b e t w e e n / ~ and/~max varies. Figure 4B illustrates this relationship. The partial ellipses represent a portion of the c - b plane of uniaxial negative RIS. As the ellipses become more eccen-
:~,4
T
1 , o [B}
0 1.0 Rmax
2 1
% I |
(R)
DEGREES 911
[C)
ELLIPSE Rm=x Rmtn ~mm !~m=~ 1 1 .B 1.8 1.B 1.8
1.8 8.7 @.882 1.134 1.8 8.4 8.788 1.416
4 1.8 8.1 8. 374 2. 673
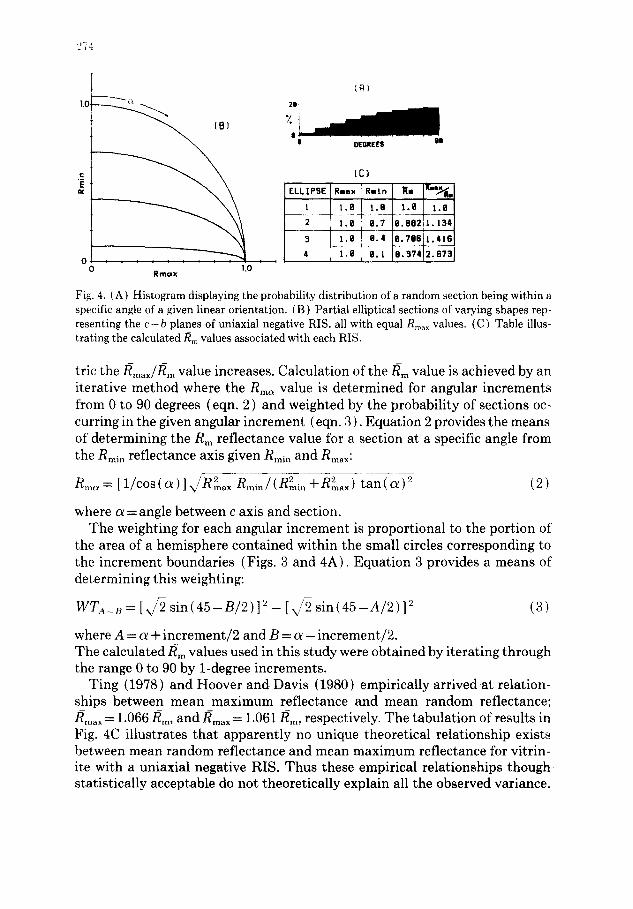
Fig. 4. (A) Histogram displaying the probability distribution of a random section being within a specific angle of a given linear orientation. (B) Partial elliptical sections of varying shapes rep- resenting the c - b planes of uniaxial negative RIS, all with equal R .... values. (C) Table illus- trating the calculated ]~m values associated with each RIS.
tric the t~max//~m value increases. Calculation of the i~m value is achieved by an iterative method where the Rm, value is determined for angular increments from 0 to 90 degrees (eqn. 2 ) and weighted by the probability of sections oc- curring in the given angular increment (eqn. 3). Equation 2 provides the means of determining the Rm reflectance value for a section at a specific angle from the Rmi n reflectance axis given Rmin and Rmax:
Rm~ [1 /cos (a ) ] , 2 2 = (Rm~, (2) ~ R m a x Rmin/ -{-R2max) t a n ( ~ ) e
where c~ = angle between c axis and section. The weighting for each angular increment is proportional to the portion of
the area of a hemisphere contained within the small circles corresponding to the increment boundaries (Figs. 3 and 4A). Equation 3 provides a means of determining this weighting:
WTa_~= [\,/2 s i n ( 4 5 - B / 2 ) ] 2 - [ , / 2 s i n ( 4 5 - d / 2 ) ] 2 (3)
where A = a + increment/2 and B = a - increment/2. The calculated/~m values used in this study were obtained by iterating through the range 0 to 90 by 1-degree increments.
Ting (1978) and Hoover and Davis (1980) empirically arrived at relation- ships between mean maximum reflectance and mean random reflectance; /~ma. ---- 1.066/~m, and i ~ m a x ~ - 1.061 /~m, respectively. The tabulation of results in Fig. 4C illustrates that apparently no unique theoretical relationship exists between mean random reflectance and mean maximum reflectance for vitrin- ite with a uniaxial negative RIS. Thus these empirical relationships though statistically acceptable do not theoretically explain all the observed variance.
275
It is important to note that a single/~m (mean random reflectance) value may describe a range of RIS shapes with differing Rmax (mean maximum reflec- tance) values and vice versa. A significant implication of the random orien- tation data distribution and ellipsoidal RIS is that the population of Rm values is not usually a normal distribution but is skewed away from the value of the most eccentric reflectance axis. With a uniaxial negative RIS, Rm values will be positively skewed; with a uniaxial positive RIS they will be negatively skewed.
Non-uniaxial negative RIS are slightly more complicated; their relationship to/~m requires an additional calculation step because Rint is not equal to Rmax. The intersection of a non-uniaxial negative RIS with the a - b plane forms an ellipse. There will be an even distribution of random section intersections with the a - b plane of the RIS in a population of perfectly randomly oriented sec- tions, therefore the square root of the product of Rmax and Rin t will provide the weighted mean value expected from the a - b plane (eqn. 1 ). Substituting this value for Rma~ in eqn. (2) enables one to determine/~m for any possible RIS shape.
Methods which directly determine Rmn and Rmp are commonly used in highly automated systems and in the production of reflectograms. A great deal of research has been directed towards comparing mean random reflectance with the chemical and rheological properties of coal (Stach et al., 1975). The ease of determination and acceptance of these random reflectance methods justify their utilization, but no theoretical relationship exists between Rm and Rmax without reference to the values of Rin t and Rmin. The determination of the ac- tual magnitudes of the three principal reflectance axes by the reflectance cros- splot technique provide the following values;/~max, Rint, Rmin, Rmax and/~m"
Measures of coal maturation are based on increasing aromaticity of vitrinite and on the molecular structure. This maturity and determination of ordering of molecular structure is measured by reflectance and bireflectance. These measurements must take into account the whole RIS not just one of the prin- cipal axes as in/~m~x./~m measures all three axes but is affected by the shape of the RIS and the random sampling technique. The cubed root of the product of the three principal axes, is a pure measure of the size of the RIS. The Rev value is the radius of a sphere of equal volume to the RIS defined by Rm~x, Rint and Rr,~n./~m is a good approximation of Rev but worsens as the eccentricity of the RIS increases. However, the I~m/Re, ratios encountered in this study ranged from 1.0 to 1.007 which are within the precision of the measuring technique for ranks below semianthracite.
A wide variety of RIS shapes and sizes are found in nature. The size of these ellipsoidal surfaces is well defined by measures such as Rmax, Rint, Rmin and/~m. The lengths of the three principal reflectance axes define the shape of the RIS. Plotting the relative axes values on a triangle diagram with the three principal axes as apices provides a RIS classification scheme. Figure 5 illustrates the positions of the various RIS shapes using this classification. An isotropic RIS
276
AoMAX I IAXIRL(+}
LBIAX (+)
' / L
ISQTRQPIC
.2
BIAXIAL(EVEN)
UNIAXIAL ! - )
RoMIN RoINT
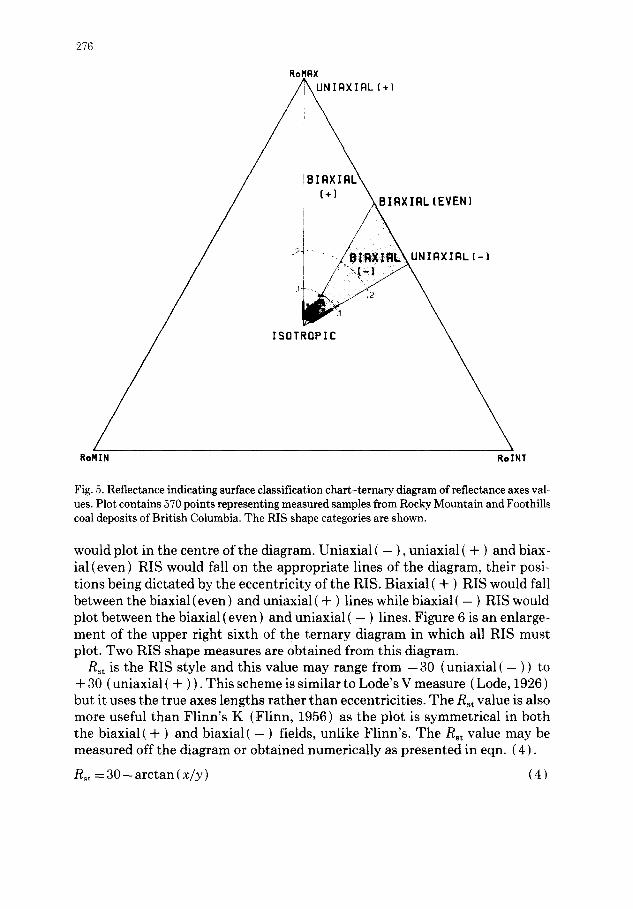
Fig. 5. Reflectance indicating surface classification chart-ternary diagram of reflectance axes val- ues. Plot contains 570 points representing measured samples from Rocky Mountain and Foothills coal deposits of British Columbia. The RIS shape categories are shown.
would plot in the centre of the diagram. Uniaxial ( - ), uniaxial ( + ) and biax- ial (even) RIS would fall on the appropriate lines of the diagram, their posi- tions being dictated by the eccentricity of the RIS. Biaxial ( + ) RIS would fall between the biaxial (even) and uniaxial ( + ) lines while biaxial ( - ) RIS would plot between the biaxial (even) and uniaxial ( - ) lines. Figure 6 is an enlarge- ment of the upper right sixth of the ternary diagram in which all RIS must plot. Two RIS shape measures are obtained from this diagram.
R~ t is the RIS style and this value may range from - 30 (uniaxial ( - ) ) to ÷ 30 ( uniaxial ( ÷ ) ). This scheme is similar to Lode's V measure ( Lode, 1926 ) but it uses the true axes lengths rather than eccentricities. The Rst value is also more useful than Flinn's K (Flinn, 1956) as the plot is symmetrical in both the biaxial( + ) and biaxial( - ) fields, unlike Flinn's. The Rst value may be measured off the diagram or obtained numerically as presented in eqn. (4).
Rst = 30 -- arctan (x/y) ( 4 )
. i
R~m
.@S
3@ 15
"7" • • m ~ •
m m
I m
~ ' " ; ' ; i •
Rst
15
.1
3 9
277
0
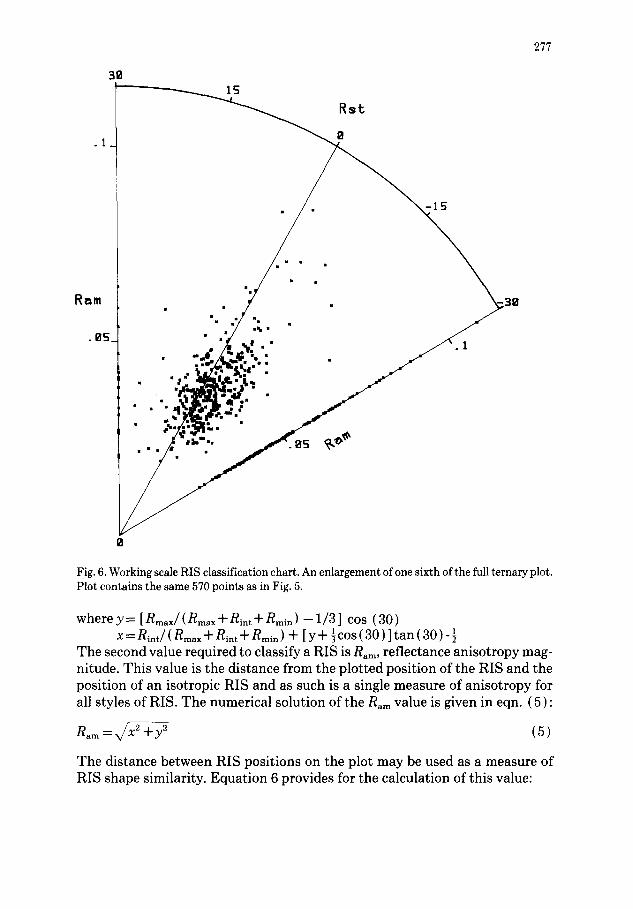
Fig. 6. Working scale RIS classification chart. An enlargement of one sixth of the full ternary plot. Plot contains the same 570 points as in Fig. 5.
where y = [ R m a x / ( R m ~ x + R i n t + R m i n ) - 1/3] cos (30) x = Rint/ ( Rmax q- Rint -~ Rmin ) + [yq - ~cos(30)]tan(30)-½
The second value required to classify a RIS is Ram, reflectance anisotropy mag- nitude. This value is the distance from the plotted position of the RIS and the position of an isotropic RIS and as such is a single measure of anisotropy for all styles of RIS. The numerical solution of the R~m value is given in eqn. ( 5 ) :
Ram =x~x2 + 9 ( 5 )
The distance between RIS positions on the plot may be used as a measure of RIS shape similarity. Equation 6 provides for the calculation of this value:
278
Dis tance= \ (.v - .v , i ~ + q~ ~ -y:,~:: I~,
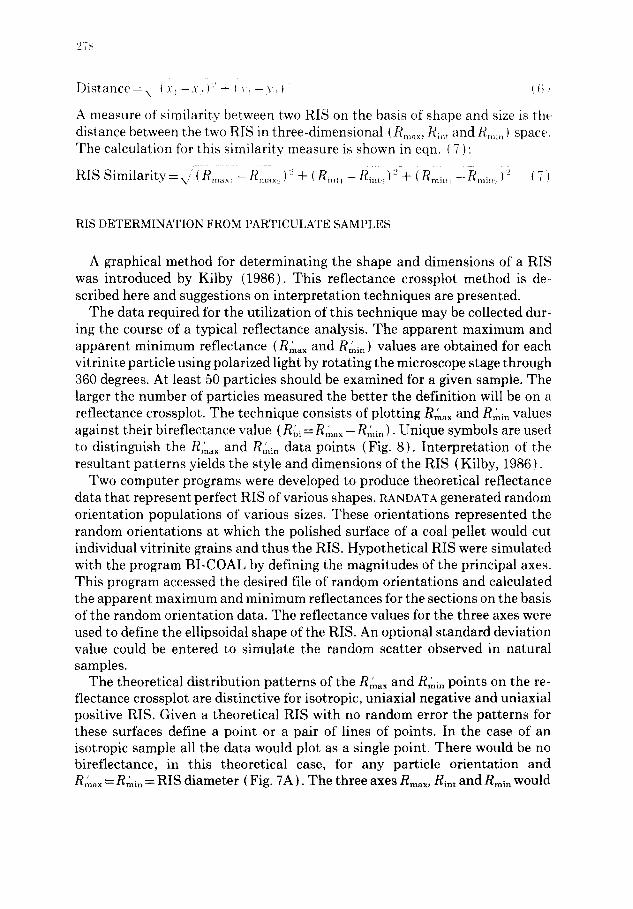
A measure of similarity between two RIS on the basis of shape and size is the distance between the two RIS in three-dimensional (R ...... Rim and R.~m ) space. The calculation tbr this similarity measure is shown in eqn. ( 7 ):
RIS Similarity --- \,, i Rmilxi ' R,I~II:7 i :} q- ( Rim, ~ Rim,) {-, + ( Rmi,,,~ ' R'm,,: ):! ( 71
RIS DETERMINATION FROM PARTICULATE SAMPLES
A graphical method for determinating the shape and dimensions of a RIS was introduced by Kilby (1986). This reflectance crossplot method is de- scribed here and suggestions on interpretation techniques are presented.
The data required for the utilization of this technique may be collected dur- ing the course of a typical reflectance analysis. The apparent maximum and apparent minimum reflectance (Rmax and R~in ) values are obtained for each vitrinite particle using polarized light by rotating the microscope stage through 360 degrees. At least 50 particles should be examined for a given sample. The larger the number of particles measured the better the definition will be on a reflectance crossplot. The technique consists of plotting Rmax and Rmin values against their bireflectance value (R~i = Rmax - R,~in ) . Unique symbols are used to distinguish the R,~ax and Rmin data points (Fig. 8). Interpretation of the resultant patterns yields the style and dimensions of the RIS ( Kilby, 1986).
Two computer programs were developed to produce theoretical reflectance data that represent perfect RIS of various shapes. RANDATA generated random orientation populations of various sizes. These orientations represented the random orientations at which the polished surface of a coal pellet would cut individual vitrinite grains and thus the RIS. Hypothetical RIS were simulated with the program BI-COAL by defining the magnitudes of the principal axes. This program accessed the desired file of random orientations and calculated the apparent maximum and minimum reflectances for the sections on the basis of the random orientation data. The reflectance values for the three axes were used to define the ellipsoidal shape of the RIS. An optional standard deviation value could be entered to simulate the random scatter observed in natural samples.
The theoretical distribution patterns of the Rmax and Rmin points on the re- flectance crossplot are distinctive for isotropic, uniaxial negative and uniaxial positive RIS. Given a theoretical RIS with no random error the patterns for these surfaces define a point or a pair of lines of points. In the case of an isotropic sample all the data would plot as a single point. There would be no bireflectance, in this theoretical case, for any particle orientation and R,~ax = R~.in = RIS diameter ( Fig. 7A ). The three axes R . . . . Rint and Rmin would
279
REFLECTRNCE CROSSPLOT
ISOTROPIC
REFLECTRNCE
A
UNIRXIRL (-)
REFLECTRNCE
B
UNIBXIBL (+)
!1/ REFLECTRNCE
c
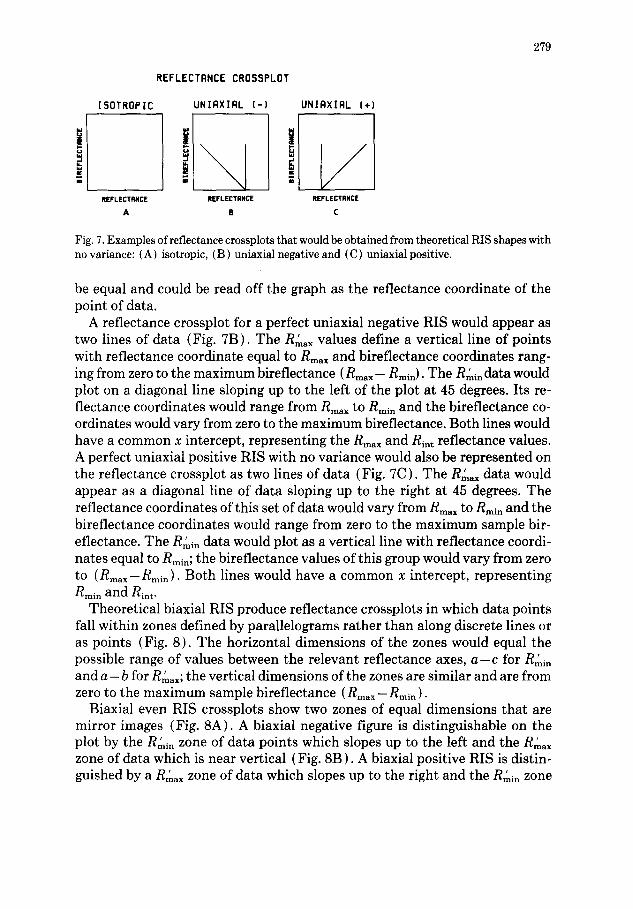
Fig. 7. Examples of reflectance crossplots that would be obtained from theoretical RIS shapes with no variance: (A) isotropic, (B) uniaxial negative and (C) uniaxial positive.
be equal and could be read off the graph as the reflectance coordinate of the point of data.
A reflectance crossplot for a perfect uniaxial negative RIS would appear as two lines of data (Fig. 7B). The R~ax values define a vertical line of points with reflectance coordinate equal to Rmax and bireflectance coordinates rang- ing from zero to the maximum bireflectance (Rm~ - R~in) • The Rmi n data would plot on a diagonal line sloping up to the left of the plot at 45 degrees. Its re- flectance coordinates would range from R~ax to R~i, and the bireflectance co- ordinates would vary from zero to the maximum bireflectance. Both lines would have a common x intercept, representing the Rm~x and Rint reflectance values. A perfect uniaxial positive RIS with no variance would also be represented on the reflectance crossplot as two lines of data (Fig. 7C ). The R ~ data would appear as a diagonal line of data sloping up to the right at 45 degrees. The reflectance coordinates of this set of data would vary from Rma~ to R~i, and the bireflectance coordinates would range from zero to the maximum sample bir- eflectance. The Rmin data would plot as a vertical line with reflectance coordi- nates equal to R~in; the bireflectance values of this group would vary from zero to (Rmax-Rmin). Both lines would have a common x intercept, representing Rmi n and Rin t.
Theoretical biaxial RIS produce reflectance crossplots in which data points fall within zones defined by parallelograms rather than along discrete lines or as points (Fig. 8). The horizontal dimensions of the zones would equal the possible range of values between the relevant reflectance axes, a - c for Rmin and a - b for Rmax; the vertical dimensions of the zones are similar and are from zero to the maximum sample bireflectance ( R ~ x - Rmin ).
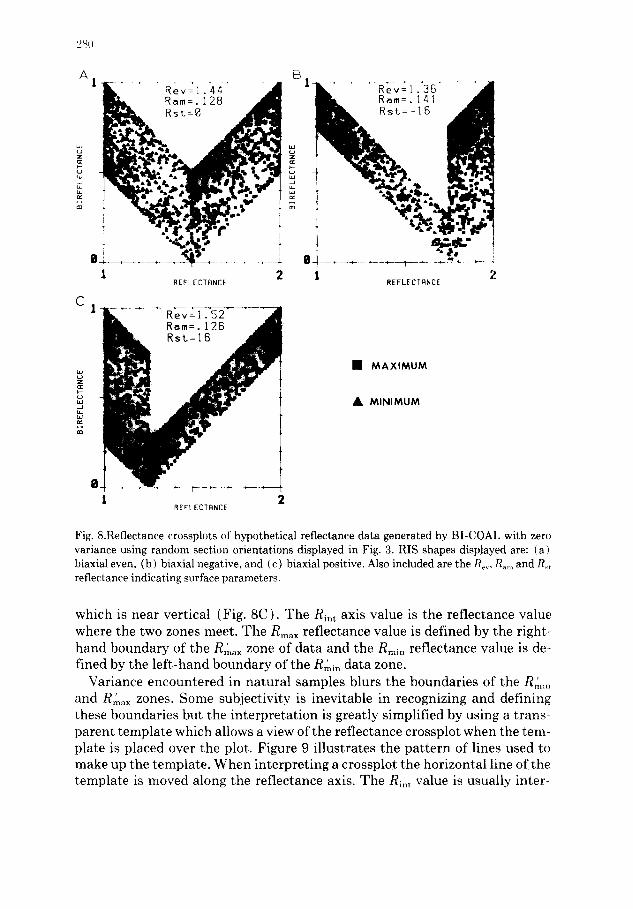
Biaxial even RIS crossplots show two zones of equal dimensions that are mirror images (Fig. 8A). A biaxial negative figure is distinguishable on the plot by the Rmi n z o n e of data points which slopes up to the left and the R~x zone of data which is near vertical (Fig. 8B ). A biaxial positive RIS is distin- guished by a R~x zone of data which slopes up to the right and the Rmi n zone
A ES
s ~
0 1 2 1
C
al
2 REFLECTANCE REFLECTANCE
1 2
[ ] MAXIMUM
AI, MINIMUM
REFLECTRNCE
Fig. 8.Reflectance crossplots of hypothetical reflectance data generated by BLCOAL with zero variance using random section orientations displayed in Fig. 3. RIS shapes displayed are: (a) biaxial even, (b) biaxial negative, and (c) biaxial positive. Also included are the R~,,, R~,, and R~ reflectance indicating surface parameters.
which is near vertical (Fig. 8C). The Rin t axis value is the reflectance value where the two zones meet. The Rmax reflectance value is defined by the right- hand boundary of the R~ax zone of data and the Rm~n reflectance value is de- fined by the left-hand boundary of the R~,in data zone.
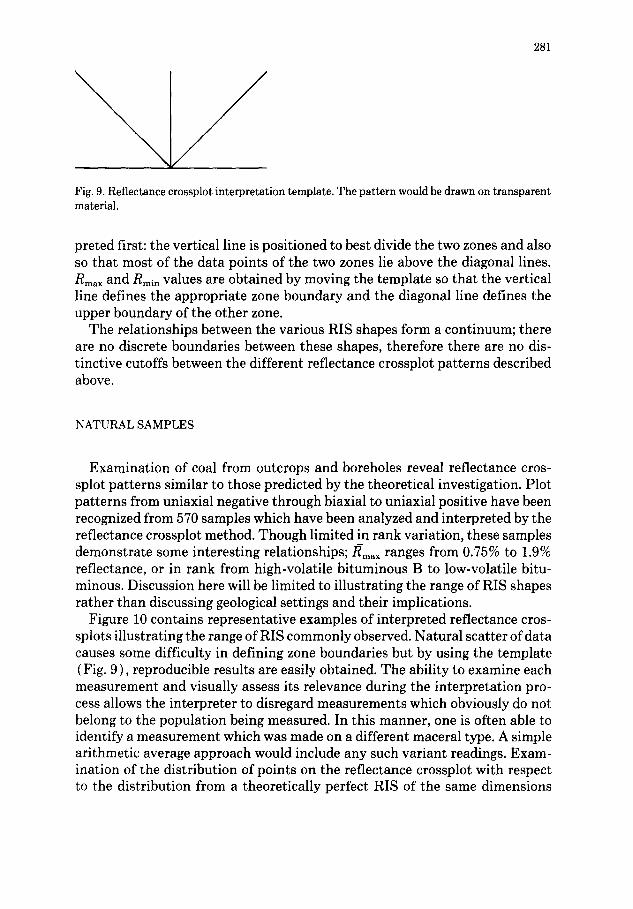
Variance encountered in natural samples blurs the boundaries of" the R~i,, and Rmax zones. Some subjectivity is inevitable in recognizing and defining these boundaries but the interpretation is greatly simplified by using a trans- parent template which allows a view of the reflectance crossplot when the tem- plate is placed over the plot. Figure 9 illustrates the pat tern of lines used to make up the template. When interpreting a crossplot the horizontal line of the template is moved along the reflectance axis. The R~,~ value is usually inter-
281
Fig. 9. Reflectance crossplot interpretation template. The pattern would be drawn on transparent material.
preted first: the vertical line is positioned to best divide the two zones and also so that most of the data points of the two zones lie above the diagonal lines. Rmax and Rmin values are obtained by moving the template so that the vertical line defines the appropriate zone boundary and the diagonal line defines the upper boundary of the other zone.
The relationships between the various RIS shapes form a continuum; there are no discrete boundaries between these shapes, therefore there are no dis- tinctive cutoffs between the different reflectance crossplot patterns described above.
NATURAL SAMPLES
Examination of coal from outcrops and boreholes reveal reflectance cros- splot patterns similar to those predicted by the theoretical investigation. Plot patterns from uniaxial negative through biaxial to uniaxial positive have been recognized from 570 samples which have been analyzed and interpreted by the reflectance crossplot method. Though limited in rank variation, these samples demonstrate some interesting relationships;/~ma~ ranges from 0.75% to 1.9% reflectance, or in rank from high-volatile bituminous B to low-volatile bitu- minous. Discussion here will be limited to illustrating the range of RIS shapes rather than discussing geological settings and their implications.
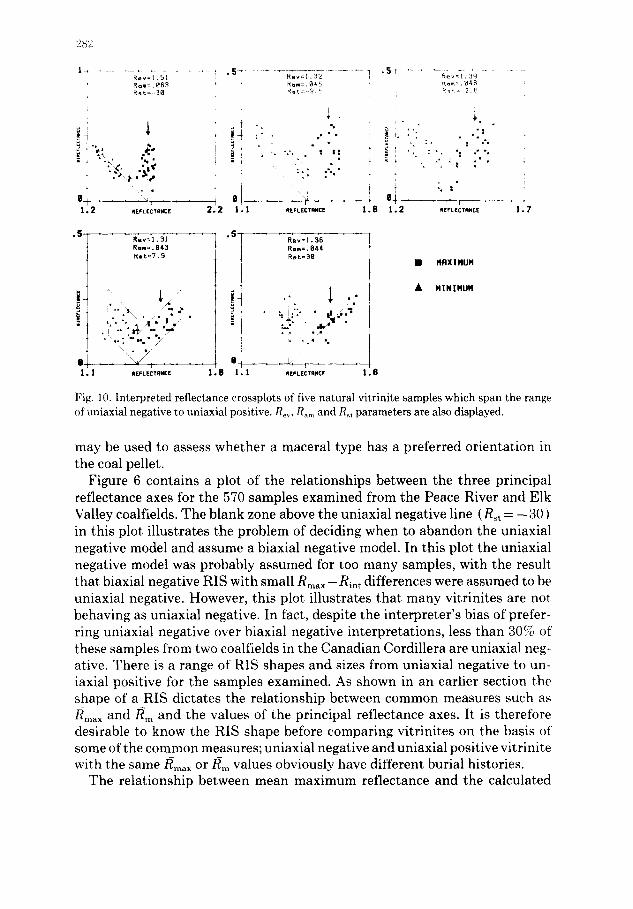
Figure 10 contains representative examples of interpreted reflectance cros- splots illustrating the range of RIS commonly observed. Natural scatter of data causes some difficulty in defining zone boundaries but by using the template (Fig. 9 ), reproducible results are easily obtained. The ability to examine each measurement and visually assess its relevance during the interpretation pro- cess allows the interpreter to disregard measurements which obviously do not belong to the population being measured. In this manner, one is often able to identify a measurement which was made on a different maceral type. A simple arithmetic average approach would include any such variant readings. Exam- ination of the distribution of points on the reflectance crossplot with respect to the distribution from a theoretically perfect RIS of the same dimensions
1 ~ . . . . . . . . . . . . . . . 5 - r . . . . . . . . . . . . . . . . . 1 . S v . . . . . . . . . . . . Rev=l.51 Rev=l.32 , Rev=l.39 Ram=.OB3 R~m=.~(5 ~ R a m = . O ~ 8 Rst=-3@ R~t=-9.5 R~e= 2
! • •
1 . 2 ~EFLECTRNCE
,
i ; i ' " " " ' i
2.2 I. I ~FLECTR.CE 1.6
i - i .
!, . :. • . : : . .
:, .| "
1.2 REFLECTRNCE 1.7
.S Rev~l.31 Ram=.843 Rtt=7.9
e I.I 1.6 R E F L E C T R N C E
• 5 I f J
.I 1 . 1 '
, , , , , , , , ,
R e v = l . 3 G
R a m = . 0 4 4
R ~ t : 3 g
"i.-:, ": • ! .: , " I
' ~" I R E F L E C T A N C E 1 • 6
• HRXINUM
• NININUN
Fig. 10. Interpreted reflectance crossplots of five natural vitrinite samples which span the range of uniaxial negative to uniaxial positive. Re,., R ~ and R~, parameters are also displayed.
may be used to assess whether a maceral type has a preferred orientation in the coal pellet.
Figure 6 contains a plot of the relationships between the three principal reflectance axes for the 570 samples examined from the Peace River and Elk Valley coalfields. The blank zone above the uniaxial negative line (Rst = - 3 0 ) in this plot illustrates the problem of deciding when to abandon the uniaxial negative model and assume a biaxial negative model. In this plot the uniaxial negative model was probably assumed for too many samples, with the result that biaxial negative RIS with small Rmax - R i , t differences were assumed to be uniaxial negative. However, this plot illustrates that many vitrinites are not behaving as uniaxial negative. In fact, despite the interpreter's bias of prefer- ring uniaxial negative over biaxial negative interpretations, less than 30% of these samples from two coalfields in the Canadian Cordillera are uniaxial neg- ative. There is a range of RIS shapes and sizes from uniaxial negative to un- iaxial positive for the samples examined. As shown in an earlier section the shape of a RIS dictates the relationship between common measures such as /~,,,x and/~m and the values of the principal reflectance axes. It is therefore desirable to know the RIS shape before comparing vitrinites on the basis of some of the common measures; uniaxial negative and uniaxial positive vitrinite with the same/~max or/~m values obviously have different burial histories.
The relationship between mean maximum reflectance and the calculated
283
elO
d
( U
Z
0 U )
L bJ
Z
I :
x I z x
Z M. lu ~r
; : : : : : I L ! I I I, I II
?J
| " ' = " ~
I I I I , , , , 1 1 . 5 _, i l . |
MERN RRNOOM R[FLECTRNC F (CRLC)
| I 2 . 8
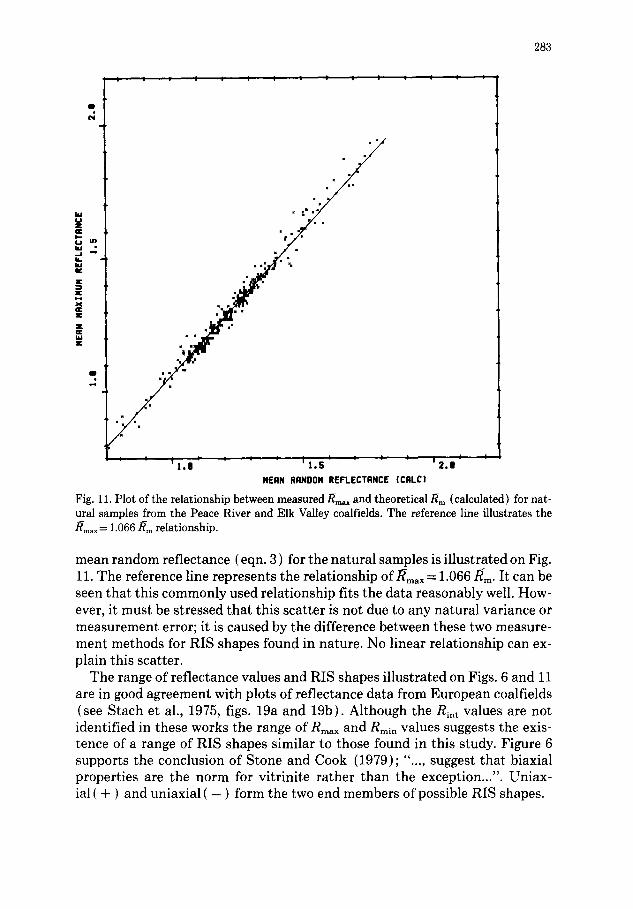
Fig. 11. Plot of the relationship between measured/~max and theoretical/~m (calculated) for nat- ural samples from the Peace River and Elk Valley coalfields. The reference line illustrates the /~r.ax = 1.066/~m relationship.
mean random reflectance (eqn. 3 ) for the natural samples is illustrated on Fig. 11. The reference line represents the relationship of/~max = 1.066/~m" It can be seen that this commonly used relationship fits the data reasonably well. How- ever, it must be stressed that this scatter is not due to any natural variance or measurement error; it is caused by the difference between these two measure- ment methods for RIS shapes found in nature. No linear relationship can ex- plain this scatter.
The range of reflectance values and RIS shapes illustrated on Figs. 6 and 11 are in good agreement with plots of reflectance data from European coalfields (see Stach et al., 1975, figs. 19a and 19b). Although the Rin t values are not identified in these works the range of Rmax and Rmin values suggests the exis- tence of a range of RIS shapes similar to those found in this study. Figure 6 supports the conclusion of Stone and Cook (1979); "..., suggest that biaxial properties are the norm for vitrinite rather than the exception...". Uniax- ial ( + ) and uniaxial ( - ) form the two end members of possible RIS shapes.
28,1
(:ONCLUSION
The common assumption that most vitrinites have a uniaxial negative re- flectance characteristic is invalid in Canadian Cordilleran coalfields examined in this study and possibly in other structurally disturbed settings. A graphical method, the reflectance crossplot, provides a new analysis technique based on easily obtained data, with which the principal axes of a RIS may be determined. During development of this technique, investigation of computer generated theoretical RIS led to the clarification of relationships between the various reflectance measurements . /~ .... cannot be directly related to/~m, but/~m may be determined if Rmax, Rin, and Rmm are known. It can be shown that the prob- ability distribution of random reflectance values, R .... is seldom normal but skewed away from the most eccentric axis; this distribution is useful when interpreting reflectogram data.
The ability to routinely obtain the magnitude of reflectance axes will con- tribute to: increase precision in rank studies; aid tectono-thermal history stud- ies; and may act as indicators of structural complications in mining situations. Although the reflectance crossplot method does not provide the means to de- termine the RIS orientation, it does provide the best determination of RIS size and shape and can be used to isolate areas with non-uniaxial( - ) RIS for detailed study with oriented sample techniques.
/~ ..... is the mean of a population distribution; this population of Rmax values is normal only when the vitrinite has a uniaxial negative RIS; then and only then does /~ax approximate the true maximum reflectance. For all other RIS this measure does not uniquely identify the maximum reflectance of a vitrinite. Mean random reflectance,/~m, can be obtained either by direct measurement or by interpretation of the reflectance crossplot./~m incorporates information about all three principal reflectance axes.
R~,~. is directly related to the volume of the RIS and provides an easily cab culated value based on the magnitudes of the three principal reflectance axes. R~v is the cubed root of the product of the three axes and represents the radius of a sphere with a volume equal to that of the RIS ellipsoid./~m may equal Re~ for certain RIS shapes but like the/~ .... -/~m relationship, this relationship to R~.v is dependent upon RIS shape.
R ..... and R~ describe the RIS shape and provide straighttorward numerical values for these parameters. Use of these values in standard analysis tech- niques such as correlation matrices has shown that there is no significant cor- relation between rank and RIS shape for the samples examined in this study.
ASTM rank values in low-volatile bituminous and higher-rank coals are based on fixed carbon content which is proportional to the aromaticity of the coal. R~, and/~m are the best reflectance measures of the molecular structure in all directions and thus rank. RIS shapes and sizes are affected by time, temperature and tectonic influences. In order to use vitrinite reflectance as an
285
accurate measure of thermal history the affects of the tectonics on the sample must be understood. Knowledge of the RIS size and shape in the form of Rmax, Rin t and Rmin are of most value in this regard. R~ax being the indicator of time- temperature relationships least affected by tectonic forces.
ACKNOWLEDGEMENT
The author would like to thank D.A. Grieve, Drs. A.R. Cameron, F. Goodarzi and W.J. McMillan for their many improvements to this manuscript. D. Player and J. Schwemler provided excellent sample preparation and J. Schwemler performed many of the reflectance determinations for this study.
REFERENCES
Cook, A.C., Murchison, D.G. and Scott, E., 1972. Optically biaxial anthracitic vitrinites. Fuel, 51: 180-184.
Davis, A., 1978. The reflectance of coal. In: C. Karr (Editor), Analytical Methods for Coal and Coal Products, Vol. 1. Academic Press, New York, NY, pp. 27-81.
Flinn, D., 1956. On the deformation of the Funzie conglomerate, Fetlar, Shetland. J. Geol., 64: 480-505.
Goodarzi, F., 1975. Some factors influencing the behaviour of the optical properties of carbonised macerals. Ph.D. thesis, University of Newcastle-Upon-Tyne, Newcastle, U.K., 349 pp. (unpubl.).
Goodarzi, F. and Murchison, D.G., 1972. Optical properties of carbonized vitrinites. Fuel, 51: 322-328.
Hevia, V. and Virgos, J.M., 1977. The rank and anisotropy of anthracites: the indicating surface of reflectivity in uniaxial and biaxial substances. J. Microsc., 109 (1) : 23-28.
Hoover, D.S. and Davis, A., 1980. The development and evaluation of an automated reflectance microscope system for the petrographic characterization of bituminous coals. Tech. Rep. FE- 2030-TR23 from Penn State Univ. to U.S. Dept. Energy, under contract no. EX-76-C-01-2030. In: C.R. Ward (Editor), Coal Geology and Coal Technology. Blackwell Scientific Publications, Melbourne, 345 pp.
Hower, J.C. and Davis, A., 1981. Application of vitrinite reflectance anisotropy in the evaluation of coal metamorphism. Geol. Soc. Am. Bull., 92: 350-366.
Kilby, W.E., 1986. Biaxial reflecting coals in the Peace River Coalfield (93 0, P, I). B.C. Ministry of Energy, Mines and Pet. Res., Geological Fieldwork, 1985, Paper 1986-1 pp. 127-137.
Levine, J.R. and Davis, A., 1984. Optical anisotropy of coals as an indicator of tectonic deforma- tion, Broad Top coal field, Pennsylvania. Geol. Soc. Am. Bull., 95: 100-108.
Lode, W., 1926. Versuche fiber den Einfluss der mittleren Hauptspannung auf das Fliessen der Metalle~ Eisen, Kupfer und Nickel. Z. Physik, 36: 913-939.
Murchison, D.G., 1978. Optical properties of carbonized vitrinites. In: C. Karr (Editor), Analyt- ical Methods for Coal and Coal Products. Academic Press, New York, NY, 2: 415-464.
Oberlin, et al., 1975. Graphitization studies of anthracites by high resolution electron microscopy. Carbon, 13: 367-376.
Stach, E., Mackowsky, M.-Th., Teichmiiller, M., Taylor, G.H., Chandra, P. and Teichmfiller, R., 1975. Coal Petrology, 3rd Edition. Gebruder Borntraeger, Berlin-Stuttgart, 535 pp.
Stone, I.J. and Cook, A.C., 1979. The influence of some tectonic structures upon vitrinite reflec- tance. J. Geol., 87: 497-508.
Ting, F.T.C., 1978. Petrographic techniques in coal analysis. In: C. Karr (Editor), Analytical Methods for Coal and Coal Products. Academic Press, New York, NY, 1: 3-26.