Embed Size (px)
Citation preview
Recognition versus Disclosure: AnInvestigation of the Impact on
Equity Risk Using UK OperatingLease Disclosures
Vivien Beattie, Alan Goodacre and Sarah Thomson*
1. INTRODUCTION
In recent years, the debate surrounding the impact ofrecognition versus disclosure has assumed increasing significancein many countries. This is largely due to the growing importanceof intangible, difficult to measure, assets. `Recognition' is definedas `the process of õÂncorporating an item into the financialstatements', while `disclosure' refers to `information about theitems in financial statements and their measures that may beprovided by notes' (FASB, 1984). In the US and UK, for example,many recent accounting standards include disclosurerequirements and some comprise only disclosure requirements(e.g., financial instruments). The sheer volume of disclosuresfound in modern financial reports has resulted in concern beingexpressed that disclosure overload is occurring, whereby criticaldisclosure information is being obscured (Johnson, 1992). FASB(1984) has stated that generally the most useful informationabout elements and their measurement should be recognisedand that disclosure is not a substitute for recognition.1
Journal of Business Finance & Accounting, 27(9) & (10), Nov./Dec. 2000, 0306-686X
ß Blackwell Publishers Ltd. 2000, 108 Cowley Road, Oxford OX4 1JF, UKand 350 Main Street, Malden, MA 02148, USA. 1185
* The authors are respectively, Professor, Senior Lecturer and PhD research student at theUniversity of Stirling. The financial support of the Carnegie Educational Trust (for SarahThomson) is gratefully acknowledged. The authors also wish to thank the anonymousreferee, Dennis Oswald, the journal editors and participants at the Capital MarketsConference 2000 for their extremely helpful comments on an earlier draft of this paper.
Address for correspondence: Alan Goodacre, Department of Accounting, Finance andLaw, University of Stirling, Stirling FK9 4LA, UK.e-mail: [email protected]
In contrast to this view, market efficiency (the maintainedhypothesis of most academic empirical research in financialreporting) assumes an equivalence between recognition anddisclosure, i.e., the market accurately processes informationirrespective of its location within the financial report. However,empirical studies do not provide strong support for theequivalence argument. These studies are of two principal types.First, there is a series of market-based studies that investigateswhether market equity risk assessments incorporate off-balancesheet disclosures and whether these assessments are differentiallyaffected by disclosure versus recognition (Bowman, 1980a;Dhaliwal, 1986; Imhoff, Lipe and Wright, 1993; Ely, 1995a; andGallery and Imhoff, 1998).2 The main accounting issues that haveprovided the basis for such research are unfunded pensionobligations and leases. In the US setting, studies have found thatlease footnote disclosures are associated with market assessmentsof equity risk (Bowman, 1980a; Imhoff et al., 1993; and Ely,1995a), although there is no clear evidence regarding themethod of evaluation used. However, an Australian study failedto find market corrections for off-balance sheet operating leasedisclosures (Gallery and Imhoff, 1998).
Second, there have also been experimental and survey studiesthat examine the impact of recognition versus disclosure onindividual financial statement users (e.g., Harper, Mister andStrawser, 1987 and 1991; Wilkins and Zimmer, 1983a and 1983b;Wilkins, 1984; Munter and Ratcliffe, 1983; and Gopalakrishnanand Parkash, 1996). These studies, the majority of which havebeen conducted in a US setting, also provide little support for theequivalence of recognition and disclosure.3
A further motivation for this study is that, in 1996, standard-setters in the UK, US, Canada, Australia and New Zealand,together with the IASC, published a discussion paper, Accountingfor Leases: A New Approach, which proposes that all leases becapitalised (McGregor, 1996). The ASB issued a discussionpaper along these lines in late 1999 (ASB, 1999). Thus, byinvestigating whether the UK market incorporates operatinglease obligations in its assessment of equity risk, this studyprovides policy-relevant, ex ante research in support of thestandard-setting process (the paucity of research of this type waslamented by Schipper, 1994). Moreover, it also answers the call
1186 BEATTIE, GOODACRE AND THOMSON
ß Blackwell Publishers Ltd 2000
for research into aspects of the recognition versus disclosuredebate made by Johnson (1992).
The current study contributes to the ongoing recognitionversus disclosure debate by investigating the relationship betweenoperating lease disclosures and equity risk assessments made bythe capital market in the UK. Under SSAP 21 (ASC, 1984), anoperating lease is one which is not classified as a finance lease,the latter being defined as one which transfers substantially allthe risks and rewards of ownership to the lessee.4 Followingprevious market-based studies, the approach adopted is toconduct an indirect test to determine whether there is anassociation between equity risk and an operating leaseadjustment to financial risk.5 This test will provide evidence asto whether investors/analysts view operating leases from aproperty rights perspective or from an ownership perspective.6
Two alternative operating lease evaluation methods areconsidered in order to establish which method, if either, appearsto be employed by UK investors/analysts. The first method is asophisticated present value method based upon a constructivecapitalisation procedure. The second method is a simple factor(multiplier) method.
The UK is particularly valuable as the setting for this study forthree reasons. First, operating leases represent a significant (andgrowing) financial obligation for many companies. By 1994,leasing represented 15.8% of the total investment in equipment(Finance and Leasing Association, 1994); this had risen to 19%by 1997 (Tolley's, 1998). Recent research has shown that, amonglisted companies in 1994, the annual operating lease liability wasapproximately 13 times that of finance leases (Beattie, Goodacreand Thomson, 2000). Moreover, for a sample of 232 suchcompanies in 1994, the unrecorded long-term liability wasestimated to represent 39% of reported long-term debt,recognition of which would increase gearing (defined as netdebt to equity) by 260% (Beattie, Edwards and Goodacre, 1998).7
The magnitude of operating leasing activity in the UK allows apowerful test of the basic relationship between disclosures andequity risk assessment to be conducted.
Second, the precise content of the operating lease disclosuresmade in the UK differ from those in the US. In the US,companies are required to disclose total minimum future
RECOGNITION VS DISCLOSURE 1187
ß Blackwell Publishers Ltd 2000
payments with remaining terms of more than one year (reportedseparately for each of the next five years and combinedthereafter). In the UK, companies are required to disclose nextyear's minimum payments, analysed according to the period inwhich the annual commitment expires (next year; within thesecond to fifth years inclusive; and over five years from thebalance sheet date). This is further analysed between land andbuildings and other asset categories. Thus, the UK disclosuresare, in some respects, more informative than those in the US.This permits the two alternative methods of lease evaluation to bediscriminated more clearly.
Third, we are aware of no evidence in the UK capital marketsliterature regarding the impact of footnote disclosures on companyvaluation (conducted from either a risk or return perspective).Moreover, there is little published evidence on the methods usedby market participants to adjust for off-balance sheet financing.There are tentative suggestions (Day, 1986) that `off-balance sheet'financing is of interest to UK investment analysts, yet companyaccounts are not seen as containing any price sensitive information.There is also evidence to suggest that UK investors/analysts may beless sophisticated than their US counterparts (Arnold, Moizer andNoreen, 1984, p.15; and Anderson and Epstein, 1996, p.165).8,9
More specifically, UK investors/analysts have been found to makeless use of financial ratios, on which operating lease capitalisationcould have a significant impact. Breton and Taffler (1995)conducted a laboratory experiment using investment analysts toinvestigate their response to nine forms of creative accounting, oneof which was non-capitalised leases. They found that, in general,subjects did not make adjustments when calculating familiarfinancial ratios.10
The present study makes the following contributions toknowledge. First, the investigation of the capital market impactof lease accounting disclosures across additional environmentalsettings can be expected to provide further evidence regardingthe nature of this relationship that will contribute to the generalrecognition versus disclosure debate. Second, the settingsupports a more powerful test of the specific association betweenmarket equity risk assessment and operating lease disclosuresthan has previously been conducted, which may assist in resolvingthe conflicting evidence in extant evidence. Third, the present
1188 BEATTIE, GOODACRE AND THOMSON
ß Blackwell Publishers Ltd 2000
study investigates more thoroughly the robustness of the resultsto different proxies for operating/asset risk. Finally, policy-relevant, ex ante research in support of the standard settingprocess is provided.
The remainder of the paper is structured as follows: The nextsection discusses previous related research and Section 3describes the research methods employed in this study. Section4 describes the data used. Results are reported in Section 5, whileSection 6 offers a summary and conclusions.
2. PREVIOUS RESEARCH
In this section, we first discuss briefly the nature of equity risk.Thereafter, previous market-based studies related specifically tomarket equity risk assessments are reviewed.
(i) Equity Risk
The return from an equity investment is sensitive tounanticipated events. The degree of sensitivity, defined as equityrisk, arises from the nature of a firm's assets and operatingactivities (business risk) and its financial policy or capital structure(financial risk). Elements of both business risk and financial riskaffect the majority of equities to some degree. For example, mostreturns are at risk from an increase in inflation. In this situation,business risk and financial risk constitute systematic or market risk.However, some elements of business or financial risk affect only asmall number of equities. For example, industrial action by afirm's workforce would only influence its own returns andpossibly the returns of its primary suppliers/competitors. Whenonly a small number of equities are affected, business andfinancial risk constitute unsystematic or specific risk. Both systematicrisk and unsystematic risk are reflected in variations in companyreturns over time, thus providing a total equity risk measure.
(ii) Market-Based Studies of Equity Risk
Several US empirical studies have modelled equity risk as afunction of business (operating/asset) risk and financial risk
RECOGNITION VS DISCLOSURE 1189
ß Blackwell Publishers Ltd 2000
(e.g., Beaver, Kettler and Scholes, 1970; Hamada, 1972; Bowman,1980a and 1980b; and Dhaliwal, 1986). Business (operating/asset) risk has been proxied by accounting beta, the covariabilityof a firm's earnings with the accounting earnings of the marketportfolio (Bowman, 1980a; and Dhaliwal, 1986). As analternative/extension to this proxy, industry dummy variableshave been introduced (Bowman, 1980a; Imhoff et al., 1993; andNarayanaswamy, 1994)11 to control for operating/asset riskdifferences across firms. Financial risk has been proxied byfinancial leverage, which has been found to have a significantrelationship with equity risk.
Previous studies that model the determinants of equity riskhave focused either on total equity risk (standard deviation ofreturns) or systematic/market risk (beta). Those consideringsystematic risk take the view that investors need face only the riskrelated to market movements, since firm-specific risk can beeliminated through holding a diversified portfolio. However,others suggest that total equity risk is more consistent withaccounting measures of risk, such as financial leverage, becauseaccounting measures of risk reflect both systematic andindividualistic risk components (Beaver et al., 1970).
The majority of previous studies have considered therelationship between equity risk and leverage ratios determinedsimply from reported balance sheet figures (Beaver et al., 1970;and Hamada, 1972). Less evidence exists concerning situationsthat impact upon leverage ratios but where the relevantinformation is disclosed outside the balance sheet. Five studieshave been identified (four conducted in the US market settingand one in Australia) that examine the value-relevance ofdisclosures outside the balance sheet. Table 1 summarises theproxies used to represent equity risk, business (operating/asset)risk and financial risk, to highlight the essential differencesbetween these studies. Bowman (1980a) and Dhaliwal (1986)focus on market/systematic risk, while Imhoff et al. (1993), Ely(1995a) and Gallery and Imhoff (1998) focus on total equity risk.The findings of each study are now considered.
Bowman (1980a) examined the relationship between market(systematic) risk and the present value of finance leases reportedto the SEC under ASR-147 prior to SFAS13 requiring financelease capitalisation. He found finance leases to make a significant
1190 BEATTIE, GOODACRE AND THOMSON
ß Blackwell Publishers Ltd 2000
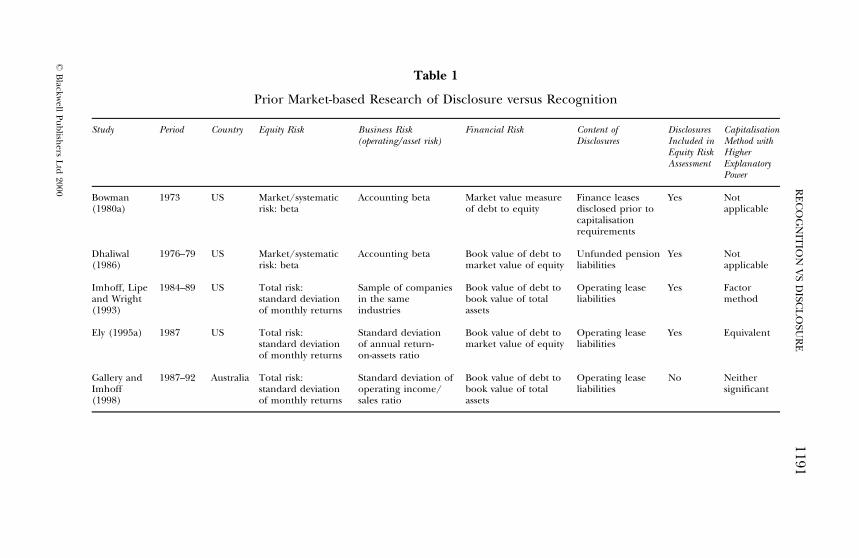
Table 1
Prior Market-based Research of Disclosure versus Recognition
Study Period Country Equity Risk Business Risk Financial Risk Content of Disclosures Capitalisation(operating/asset risk) Disclosures Included in Method with
Equity Risk HigherAssessment Explanatory
Power
Bowman 1973 US Market/systematic Accounting beta Market value measure Finance leases Yes Not(1980a) risk: beta of debt to equity disclosed prior to applicable
capitalisationrequirements
Dhaliwal 1976±79 US Market/systematic Accounting beta Book value of debt to Unfunded pension Yes Not(1986) risk: beta market value of equity liabilities applicable
Imhoff, Lipe 1984±89 US Total risk: Sample of companies Book value of debt to Operating lease Yes Factorand Wright standard deviation in the same book value of total liabilities method(1993) of monthly returns industries assets
Ely (1995a) 1987 US Total risk: Standard deviation Book value of debt to Operating lease Yes Equivalentstandard deviation of annual return- market value of equity liabilitiesof monthly returns on-assets ratio
Gallery and 1987±92 Australia Total risk: Standard deviation of Book value of debt to Operating lease No NeitherImhoff standard deviation operating income/ book value of total liabilities significant(1998) of monthly returns sales ratio assets
RE
CO
GN
ITIO
NV
SD
ISCL
OSU
RE
1191
ßB
lackwell
Pu
blish
ersL
td2000
contribution to the association tests on market risk, concludingthat ASR-147 lease data was reflected in security prices. Dhaliwal(1986) examined the relationship between market risk andanother type of liability (unfunded pension obligations)disclosed but not recorded in company balance sheets. Hefound that the explanatory power of his model relating market(systematic) risk to financial and business risk (represented byaccounting beta) improved when unfunded pension liabilitieswere included in his measure of financial leverage. Also, therewas no significant difference in the relationship between market-perceived risk of the firm and unfunded pension liabilities(disclosed outside the balance sheet), compared to debt andother liabilities (disclosed on the balance sheet). He concludedthat capital market participants appear to view unfunded pensionliabilities in the same light as other debt liabilities when assessingthe market risk of a firm.
The three remaining studies have specifically tested whetheroperating lease obligations are recognised in the market'sassessment of equity risk. First, Imhoff et al. (1993) (hereafterILW) examined the relationship between total risk reflected instock price volatility and the debt-to-asset leverage ratio. Theiranalysis focused separately on two industries that were identifiedas having large amounts of long term operating leases, the airlineand grocery industries. Firms in the same industry were used toprovide a natural control for cross-sectional differences inoperating risk. ILW use footnote disclosures to `constructivelycapitalise' operating leases in line with capitalised finance leases,in order to calculate the appropriate adjustment to leverageratios.
ILW evaluate two alternative methods of operating leaseevaluation. First, their method of operating lease capitalisationinvolved applying estimates of average total life, remaining lifeand interest rate of firm's operating lease agreements todisclosures of minimum future operating lease payments.Second, they use an ad hoc multiplier adjustment for operatingleases, the `factor method'. Houlihan and Sondhi (1984) suggestthat financial analysts may far more commonly employ the factormethod. This method involved multiplying annual operatinglease rentals by a factor of 8 to estimate the total operating leaseliability. In the UK, Dresdner Kleinwort Benson (1998) note that
1192 BEATTIE, GOODACRE AND THOMSON
ß Blackwell Publishers Ltd 2000
the factor method is also one approach used by UK creditanalysts and leasing experts to obtain a rough approximation ofthe total liability to which an annual operating lease rentalobligation would equate. They suggest that multiplying theoperating lease rental by 8 equates, for example, to discounting aconstant rental charge at a rate of 8.5% over a 14 year period.However, previous researchers (Axelson, 1971; Imhoff, Lipe andWright, 1995; and Gallery and Imhoff, 1998) have noted an over-estimation of lease obligations by the factor method. Houlihanand Sondhi (1984) suggested that the problem of over-estimationhas magnified over time, and could be detrimental to lessees bymaking them appear far more leveraged than they actually are.Dresdner Kleinwort Benson also question the accuracy of the`factor 8' approach. They analytically identified a range of factorvalues from 6.9 to 10.2 times for leases maturing between thenext ten to twenty years.
Initially, ILW estimated the correlation between firm risk andunadjusted and adjusted leverage ratios. Subsequentinvestigation used OLS regression analysis to determine whetherthe explanatory power of a model expressing the relationshipbetween firm risk and financial leverage was improved when theoperating lease adjustment to debt to asset ratio was introduced.ILW's data contained several annual observations for each firm.However, they used the mean measure of risk and leverage foreach firm having three or more annual observations. This was,purportedly, to avoid the overstatement of the significance levelsof pooled time-series cross-sectional tests, arising because firm-year observations are not independent. However, the use ofaverages significantly reduces sample size and the variabilitybetween observations. ILW used the natural logarithm of thestandard deviation of returns, as their dependent variable, in anattempt to avoid any misspecification due to non-normality orheteroscedasticity.
The significant incremental explanatory power of ILW'soperating lease adjustment supports the notion that USinvestors/analysts do appear to make use of `off-balance sheet'operating lease disclosures when assessing a firm's risk. However,ILW found constructive capitalisation of operating leases toexplain less of the intra-industry variation in risk than the ad hocfactor method. This implies that the operating lease valuation
RECOGNITION VS DISCLOSURE 1193
ß Blackwell Publishers Ltd 2000
method that appears to be used in practice may not be accurateand is, therefore, a poor substitute for disclosing the true effecton the balance sheet. If these findings were to be repeated in theUK, then the anticipated regulation requiring operating leasecapitalisation might be expected to impact on firm riskassessments and hence lead to share price adjustments.
Second, Ely (1995a) extended the work of ILW by controllingexplicitly for cross-sectional variation in operating/asset risk,which allowed her to undertake an analysis across rather thanwithin industries. The standard deviation of return on assets wasused to represent operating/asset risk, which allowed Ely toexamine whether investors include operating leases in the returnon assets (ROA) ratio, affecting equity risk through operating/asset risk in addition to financial risk. In line with ILW, Ely alsoexplored two alternative methods of evaluating operating leases.The first method, a variant of the constructive capitalisationmethod, involved estimation of the present value of operatinglease obligations. In contrast to ILW, Ely assumed that firms enterinto leases each year, causing the number of years since inceptionto be irrelevant. The validity of this assumption in the UK contextis questionable. The operating lease obligations disclosed infootnotes relating to agreements having less than one year,between one and five years and over five years unexpired varysubstantially (Edwards, 1997). This indicates that UK companiesdon't appear to maintain a constant proportion of operatinglease finance. However, the general assumptions made by Ely inher operating lease capitalisation process were shown to berobust in the US context. (The correlations between heroperating lease measure and alternative measures based onfirm-specific estimates of lease term, interest rate and annualpayments exceeded 0.9). Ely's second method involvedmultiplying the annual rental expense by a constant (both 6and 8 were used).
Ely used OLS regression analysis to estimate her model relatingequity risk to the accounting ratios `return on assets' and `debt toequity'. The debt to equity ratio was split according to debtreported on the balance sheet and operating lease liabilityestimated from footnotes. She found a significant relationshipbetween equity risk and the debt to equity adjustment foroperating leases. Also, the relationship between equity risk and
1194 BEATTIE, GOODACRE AND THOMSON
ß Blackwell Publishers Ltd 2000
operating/asset risk (measured as the standard deviation ofROA) was found to vary significantly when an operating leaseadjustment was made to ROA. Ely's results provide additionalevidence that US investors include operating lease asset andliability values when assessing equity risk. However, in contrast toILW, Ely found the variation in risk explained by constructivecapitalisation to be no different from that explained using therental-based factor method.
Third, Gallery and Imhoff (1998) seek to contribute to therecognition versus disclosure debate by examining a specific setof footnote disclosures in a market setting other than the US.Their analysis is based on data for 89 of the top 100 Australiancompanies. In common with the prior two studies, two operatinglease adjustment methods are investigated, the ILW (1991)constructive capitalisation method and the simple factor method.In contrast to ILW (1993) and Ely (1995a), they do not observean association between operating lease footnote disclosures and ameasure of equity risk (i.e., the operating lease adjustmentvariable is not significant when included in an OLS regression ofequity risk on leverage and operating risk). This insignificanceholds both for the full sample and for a sub-sample of 33 `high'operating lease companies.
Overall, there is convincing evidence that US investors dorecognise operating leased assets and liabilities in theirassessments of equity risk, while the limited evidence availablein another setting (Australia) finds otherwise. The conflictingfindings from these three studies may arise from differences insample sizes (the Australian sample size was much smaller thanEly, 1995a), statistical problems (e.g., measurement error,omitted variables), differential risk premia across leased assettypes, and/or differences in the market settings (e.g., themagnitude of information processing costs, the level of sophisti-cation of analysts). Moreover, there is conflicting evidenceregarding the operating lease evaluation method used by analysts(i.e., constructive capitalisation method or factor method). Thiscould arise from many of the reasons given above. It could alsoarise from alternative controls for operating/asset riskdifferences across firms. Ely employed the standard deviation ofROA to control for differences between firms across industries,while ILW (1993) considered firms in the same industry. A
RECOGNITION VS DISCLOSURE 1195
ß Blackwell Publishers Ltd 2000
combination of both controls might assist in the resolution of USevidence. Also, a process of diagnostic testing to assess therobustness of regression estimates would indicate the reliabilityof the findings of both studies. The present study considers suchissues.
3. RESEARCH METHODS
The model used to investigate whether operating leases arerecognised in the UK market's assessment of equity risk followsEly (1995a), and derives from the financial theories of Modiglianiand Miller (1958, and 1963) as applied by Bowman (1979) toaccounting data.
Equity risk is predicted to have the following relationship withoperating/asset risk and financial risk (assuming riskless debt,constant interest rates, and firm values equal to average expectedearnings divided by some appropriate rate of return):
equity risk � �1� �1ÿ t� financial risk� � asset risk
equity risk � asset risk� �1ÿ t� financial risk � asset risk �1�where t is the marginal rate of tax. Reported financial riskmeasures based on firms' published balance sheets ignoreliability elements, such as operating leases, which are off-balancesheet. If the financial markets consider that such liabilitiescontribute to firms' financial risk, an adjustment to the reportedrisk measure will be necessary:
equity risk � asset risk� �1ÿ t��fin riskrep � fin riskadj��asset risk: �2�
With the further assumption that marginal tax rates are constantacross firms, this can be rearranged into the general cross-sectional regression model:
equity risk � �0 � �1 asset risk� �2 fin riskrep � asset risk
� �3 fin riskadj � asset risk� ": �3�If operating leases are recognised in the market's assessment ofequity risk, then the coefficient �3 is expected to be significantlypositive. Further, if operating leases are considered to be of
1196 BEATTIE, GOODACRE AND THOMSON
ß Blackwell Publishers Ltd 2000
similar risk to debt then �3 should equal �2.12 For empiricaltesting, proxy measures are required for equity risk, operating/asset risk and financial risk in addition to an estimate of theoperating lease liabilities.
(i) Equity Risk Proxies
Total equity risk (�S), rather than systematic/market risk (beta),is adopted as the dependent variable in the current study.13 Thisis appropriate in view of our focus on accounting measures offinancial risk, since these reflect both systematic and firm-specificrisk components. It is also consistent with other recent studies onlease disclosure. While the basic model describes aninstantaneous relationship, reality requires consideration of thetime dimension. One issue concerns the timing of variablemeasurement, in particular whether the dependent variableshould be measured over the same time period as theindependent variable(s), or at the beginning of this period.The market observes a particular level of current, and historical,operating/asset risk and financial risk presumably with the intentto forecast future expected equity risk. This suggests that aforward-looking ex ante measure of equity risk might beappropriate. Implied volatility from option pricing could providesuch a measure, but this will itself have estimates of futuregearing embedded by the market. There is also a major practicallimitation to such an approach since there are relatively fewcompanies with traded options in the UK, so potential samplesize would be greatly reduced. The alternative approach ofmeasurement of the dependent and independent variable(s)over a similar time period assumes that realised equity risk (andfinancial risk) measures are reasonably good proxies for ex anteforecasts.
The present study uses both approaches in measuring equityrisk. In the spirit of ex ante risk measurement, one of the proxies(termed �S;24;91) is calculated as the standard deviation of equityreturns over a 24 month period ending in the month prior to thestart of the firm's accounting period in 1991. The relatedfinancial risk is measured as an average over the subsequentthree-year period to 1994. The other proxy (�S ;60;94) measuresequity risk, contemporaneously with financial risk, as the
RECOGNITION VS DISCLOSURE 1197
ß Blackwell Publishers Ltd 2000
standard deviation of equity returns over 60 months ending in1994. This 60 month measure includes prior and matchingperiods, and also enables comparison with prior research.14 Allmeasures are annualised before inclusion in the regressionprocedures.
(ii) Operating/Asset Risk Proxies
In prior research, operating/asset (business) risk has beenproxied by accounting beta, industry dummies and variabilityin accounting return on assets (ROA); size has also beensuggested as a suitable proxy. The main choice in the presentstudy is variability in accounting return on assets (�ROA),measured as the standard deviation of annual ROA over a 7 yearperiod, with ROA calculated by dividing earnings before interestand taxes by average total assets for a given year.15 The use of�ROA has support from theory (as long as return on assetsreasonably reflects the firm's economic rate of return) and fromempirical studies (Ely, 1995a; and 1995b). However, there is anissue with this measure in the present context. In addition tofinancial risk, accounting ROA may be adjusted by marketparticipants if they treat business assets and liabilities acquiredunder operating lease agreements similarly to those recognisedon the balance sheet. An indirect test of whether this occurs iscarried out later, but prior research suggests that the impact onROA is likely to be small relative to the adjustment in financialrisk measures (Beattie et al., 1998). Nevertheless, this means thatthe test of the impact of operating leases on financial risk is ajoint test of the impact on ROA.
To assess whether the results are sensitive to this issue, firm sizeand industry membership are used as alternative proxies foroperating/asset risk. Generally, large firms are diversified eitherover different lines of business and/or geographically in contrastwith small firms that rely on single product lines and/or singlemarkets. Thus operating/asset risk is expected to be a negative,but not necessarily linear, function of firm size. The specific sizemeasure adopted is the natural log of average total assets�ln�TA�� measured over 1992±4. Different industries exhibitdiffering levels of business risk as a result of the nature of thegoods or services supplied, the maturity of the industry and
1198 BEATTIE, GOODACRE AND THOMSON
ß Blackwell Publishers Ltd 2000
different levels of competition. Industry membership is assessedby incorporating dummy variables associated with inclusion inone of the major (nine) sectors in the sample.
(iii) Financial Risk Proxies
Although theory depicts financial risk as a function of the ratio ofmarket value of debt to the market value of equity, manyempirical studies have used book values for the numerator and/or denominator. For example, Ely and others used the bookvalue of debt because of the difficulty in finding reliable marketvalues for many debt components and the impossibility of findingvalues for some. The use of the market value for equity can leadto increased volatility in the financial risk measure, and hasencouraged some to use the book value of equity. However, ILW(1993) argue that using the book value of equity is not just a dataissue but a statistical one. It creates econometric problemsbecause it can be near zero or negative for a given firm-yearobservation. As a consequence, they prefer the book value ofassets as their leverage ratio denominator. Similarly, the presentstudy uses the book value of total debt to total assets, measured asan average over the three years 1992±4 �Drep=TA� as the mainproxy for financial risk but also considers the (BV total debt)/(MV equity) proxy as a single period measure for 1994 (Drep/E).16
(iv) Estimates of Operating Lease Liabilities
An estimate of the adjustment to financial risk (fin riskadj) foroperating leases is required. Two methods were adopted. In thefirst, the present value of operating lease liabilities (PVOL) foreach sample company was obtained from a constructivecapitalisation procedure, suggested by ILW (1991), as adaptedby Beattie et al. (1998). This requires assumptions to be maderegarding the average remaining lease life and an appropriatediscount rate. Estimation of the value of the unrecorded leaseasset requires further assumptions regarding the average totallease life and the depreciation method. The procedureincorporates company-specific assumptions of average remainingand total lease life, and distinguishes between the two asset
RECOGNITION VS DISCLOSURE 1199
ß Blackwell Publishers Ltd 2000
classes (`land and buildings' and `other') disclosed in the UK.Having investigated short term borrowing rates over the studyperiod, a discount rate of 10% was selected as most appropriate.The operating lease liability is estimated as the present value ofthe expected future minimum lease rental payments discountedat 10%. Further details of the capitalisation procedure can befound in Beattie et al. (1998) and an illustration of its applicationto a particular company is given in the Appendix to this paper.Results from prior research were found to be robust with respectto the assumptions used in the capitalisation procedure, and acheck on the sensitivity of the present results confirmed this.17
An alternative heuristic for the estimation of operating leaseliabilities is sometimes employed by investment analysts. Thisinvolves multiplying the reported operating lease expense by aparticular factor as a simplification of the present valuecalculation. Analysts using this so-called `factor method' typicallyuse a factor of 8 in the UK (Dresdner Kleinwort Benson, 1998, p.4) while both 6 and 8 are common in the US (Ely, 1995a). Thesecond estimate of operating lease liabilities, based on the `factor8' method, was used to assess whether the UK market'sassessment of equity risk is better explained using this estimatethan the more complex constructive capitalisation procedure.The proxy (OLR) was based on the expense actually reported inthe footnote to the profit and loss account. For some companies,this will include some short-term rentals, lease contracts that haveterminated during the year and perhaps contingent leasepayments.18
Incorporating the main proxies into equation (3) gives thefollowing cross-sectional regression model for estimation:
�S ;60;94 � �0 � �1 �ROA � �2 Drep=TA � �ROA
� �3 PVOL=TA � �ROA � ": �4�
(v) Impact on Operating/Asset Risk
Constructive capitalisation of operating leases may also affectROA, the proxy used in this study for operating/asset risk, so theimpact on this was also investigated. Direct assessment of themeasure of operating/asset risk adjusted for operating leases,
1200 BEATTIE, GOODACRE AND THOMSON
ß Blackwell Publishers Ltd 2000
�ROA adj, would require the estimation of PVOL and the profitand loss account impact of capitalisation for at least seven years.In the absence of such information an alternative approach wasadopted. Following Ely (1995a), it is first assumed that therelationship between reported ROA and ROA adjusted for theimpact of operating lease capitalisation is as follows:
ROArep � ROAadj � �; �5�where ROArep = EBIrep/TArep = earnings before interest/total
assets reported;ROAadj = EBIadj/TAadj;EBIadj = EBIrep + operating lease rental ÿ depreciation;TAadj = TArep + operating lease assets; and� = multiplicative relationship between the two.
If the effect of capitalisation is to reduce ROA, then � will begreater than 1 and vice versa. The impact on �ROA will depend onthe time series properties of each firm's �; this will dependmainly on the changes in the firm's lease portfolio over time.
On the assumption that a firm enters into new leases each year,� is constant and �ROA adj will be related to the reportedoperating/asset risk as follows (Ely, 1995a):
�ROAadj � 1=�� �ROArep:
Substituting this expression for �ROA,adj into equation (4) leadsto:
�S ;60;94 � b0 � b1 �ROArep � b2Drep=TA � �ROArep
� b3 PVOL=TA � �ROArep � " �6�where b1, b2 and b3 are each now functions of �.
If investors adjust ROA for operating leases when assessingoperating/asset risk, then variations in � across companies willresult in significant differences in the coefficients b1, b2 and b3. Inthe absence of direct estimates of �ROA adj, an indirect test cantherefore be constructed by grouping companies on the basis of�. The value of � is calculated for each company in the sample for1994. Companies are then classified into one of three groups:companies without operating leases �� � 1�, companies with �values below 1 (denoted L) and companies with � values above 1(denoted H). Interactive dummy variables are introduced for the
RECOGNITION VS DISCLOSURE 1201
ß Blackwell Publishers Ltd 2000
latter two groups to test whether the coefficients vary across � aspredicted in the following model:
�S ;60;94��0��1�ROA � �1L�ROA � L � �1H�ROA �H
��2Drep=TA � �ROA � �2L Drep=TA � �ROA � L
��2H Drep=TA � �ROA �H � �3L PVOL=TA � �ROA�L
��3H PVOL=TA � �ROA �H �7�where L = 1 for � < 1, and = 0 otherwise;
H = 1 for � > 1, and = 0 otherwise.For companies with no operating leases, � � 1, and both L and Hare 0.
If the effect of operating lease capitalisation is to reduce ROA,then � > 1, and the adjusted operating/asset risk measure�ROA adj will be smaller than the reported variability. This reducedvariability should, in turn, be reflected in reduced equity risk �S .Thus, for companies with � > 1, the coefficients �1H and �2H areexpected to be negative and the increased operating/asset riskassociated with companies with � < 1 should lead to positive �1L
and �2L coefficients.In effect, the variable �PVOL=TA� � �ROA is automatically
excluded from the model for companies having no operatingleases since PVOL is zero, so �3 cannot be estimated. This meansthat coefficients �3L and �3H are not incremental adjustments to�3. Instead, they each measure the direct relationship betweenthe operating lease adjustment (PVOL) and equity risk (�S) forthe groups of low (L) and high (H) � companies. Thus, a positiverelationship is expected for both �3L and �3H as a result of thedirect PVOLÿ�S relationship, but the ROA effect is expected toincrease the �3L coefficient but reduce the �3H coefficient.Overall, if the PVOL effect is dominant, as expected, bothcoefficients would be expected to be positive, but �3L should begreater than �3H .
4. DATA
Some of the data employed in this study, originally obtained fromDatastream or manually extracted from microfiche sets ofcompany financial statements supplied by Companies House,
1202 BEATTIE, GOODACRE AND THOMSON
ß Blackwell Publishers Ltd 2000
was available from a database constructed by Edwards (1997) todetermine the impact of constructive operating leasecapitalisation on key accounting ratios. The database containsselected profit and loss and balance sheet items, together withoperating lease obligations extracted from the footnotes to thefinancial statements. It spans the years 1981 to 1994 for arandomly selected sample of 300 UK commercial and industrial(i.e., non-financial) listed companies and covers a wide size rangeand industry distribution.19 Additional variables required for thisstudy, including stock returns, market returns and the marketvalue of equity were collected from Datastream and added to theoriginal database. Of the 232 companies in the database for 1994,161 possessed all the relevant data over the 1987±94 period, thefocus of the present study. The proxy variables used, theirdefinitions and, where appropriate, their Datastream identi-fications, are summarised in Table 2.
5. RESULTS
Summary statistics of the variables for the 156 companies20 in thesample are reported in Table 3. A key feature is that the presentsample is not biased towards large `blue-chip' companies,reflecting the essentially random selection process. This isindicated in the wide size range (£3m through £21,900m, basedon average total assets) and the relatively small average size(mean = £774m, median = £80m). The large difference betweenmean and median is as expected for the significantly skewed sizedistribution in both sample and population. On average, thesample companies had an estimated mean £61m of operatinglease liabilities (PVOL) in 1994, representing 15% of balancesheet assets (PVOL/TA) and 26% of equity market value(PVOL/E). The heuristic `factor 8' method (OLR) yields amuch larger mean estimate of £102m for operating leaseliabilities. The larger estimate based on the factor method hasbeen found in previous studies, and may be overstated, partlybecause of the multiple of 8 used and partly because it gives fullweight to short-term rentals. On the other hand, the estimatebased on PVOL ignores contingent rentals (since these are notpart of the minimum lease payments recorded in the balance
RECOGNITION VS DISCLOSURE 1203
ß Blackwell Publishers Ltd 2000
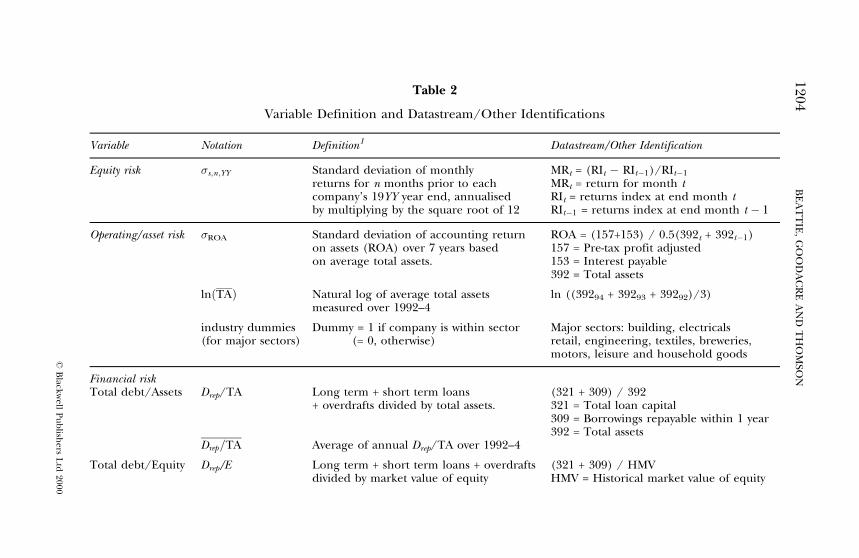
Table 2
Variable Definition and Datastream/Other Identifications
Variable Notation Definition1 Datastream/Other Identification
Equity risk �s;n;YY Standard deviation of monthly MRt = (RIt ÿ RItÿ1)/RItÿ1
returns for n months prior to each MRt = return for month tcompany's 19YY year end, annualised RIt = returns index at end month tby multiplying by the square root of 12 RItÿ1 = returns index at end month t ÿ 1
Operating/asset risk �ROA Standard deviation of accounting return ROA = (157+153) / 0.5(392t + 392tÿ1)on assets (ROA) over 7 years based 157 = Pre-tax profit adjustedon average total assets. 153 = Interest payable
392 = Total assets
ln�TA� Natural log of average total assets ln ((39294 + 39293 + 39292)/3)measured over 1992±4
industry dummies Dummy = 1 if company is within sector Major sectors: building, electricals(for major sectors) (= 0, otherwise) retail, engineering, textiles, breweries,
motors, leisure and household goods
Financial riskTotal debt/Assets Drep/TA Long term + short term loans (321 + 309) / 392
+ overdrafts divided by total assets. 321 = Total loan capital309 = Borrowings repayable within 1 year392 = Total assets
Drep=TA Average of annual Drep/TA over 1992±4
Total debt/Equity Drep/E Long term + short term loans + overdrafts (321 + 309) / HMVdivided by market value of equity HMV = Historical market value of equity
1204B
EA
TT
IE,
GO
OD
AC
RE
AN
DT
HO
MSO
N
ßB
lackwell
Pu
blish
ersL
td2000
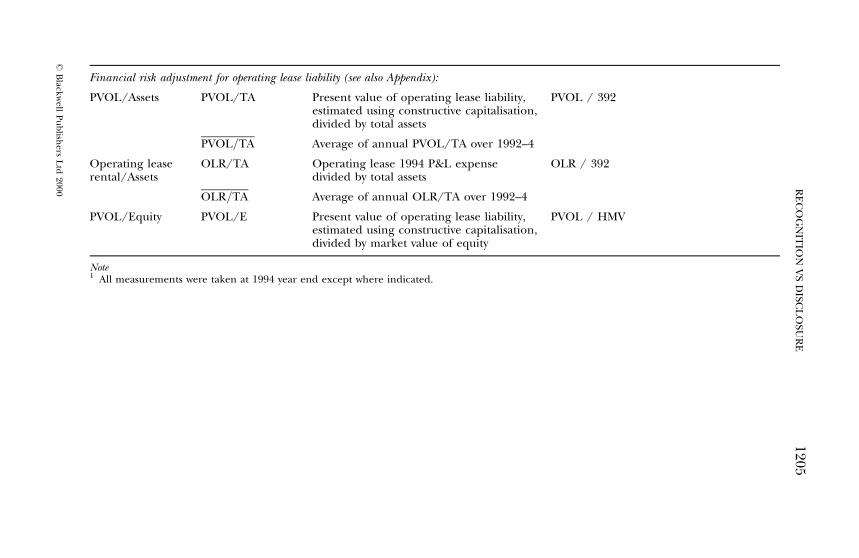
Financial risk adjustment for operating lease liability (see also Appendix):
PVOL/Assets PVOL/TA Present value of operating lease liability, PVOL / 392estimated using constructive capitalisation,divided by total assets
PVOL=TA Average of annual PVOL/TA over 1992±4
Operating lease OLR/TA Operating lease 1994 P&L expense OLR / 392rental/Assets divided by total assets
OLR=TA Average of annual OLR/TA over 1992±4
PVOL/Equity PVOL/E Present value of operating lease liability, PVOL / HMVestimated using constructive capitalisation,divided by market value of equity
Note1 All measurements were taken at 1994 year end except where indicated.
RE
CO
GN
ITIO
NV
SD
ISCL
OSU
RE
1205
ßB
lackwell
Pu
blish
ersL
td2000
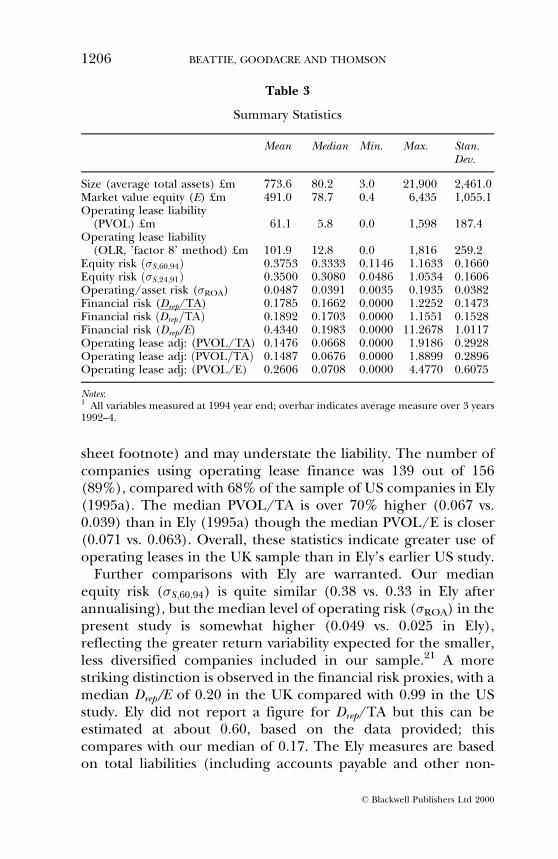
sheet footnote) and may understate the liability. The number ofcompanies using operating lease finance was 139 out of 156(89%), compared with 68% of the sample of US companies in Ely(1995a). The median PVOL/TA is over 70% higher (0.067 vs.0.039) than in Ely (1995a) though the median PVOL/E is closer(0.071 vs. 0.063). Overall, these statistics indicate greater use ofoperating leases in the UK sample than in Ely's earlier US study.
Further comparisons with Ely are warranted. Our medianequity risk (�S ;60;94) is quite similar (0.38 vs. 0.33 in Ely afterannualising), but the median level of operating risk (�ROA) in thepresent study is somewhat higher (0.049 vs. 0.025 in Ely),reflecting the greater return variability expected for the smaller,less diversified companies included in our sample.21 A morestriking distinction is observed in the financial risk proxies, with amedian Drep/E of 0.20 in the UK compared with 0.99 in the USstudy. Ely did not report a figure for Drep/TA but this can beestimated at about 0.60, based on the data provided; thiscompares with our median of 0.17. The Ely measures are basedon total liabilities (including accounts payable and other non-
Table 3
Summary Statistics
Mean Median Min. Max. Stan.Dev.
Size (average total assets) £m 773.6 80.2 3.0 21,900 2,461.0Market value equity (E) £m 491.0 78.7 0.4 6,435 1,055.1Operating lease liability
(PVOL) £m 61.1 5.8 0.0 1,598 187.4Operating lease liability
(OLR, 'factor 8' method) £m 101.9 12.8 0.0 1,816 259.2Equity risk ��S;60;94� 0.3753 0.3333 0.1146 1.1633 0.1660Equity risk ��S;24;91� 0.3500 0.3080 0.0486 1.0534 0.1606Operating/asset risk (�ROA) 0.0487 0.0391 0.0035 0.1935 0.0382Financial risk (Drep/TA) 0.1785 0.1662 0.0000 1.2252 0.1473Financial risk �Drep=TA� 0.1892 0.1703 0.0000 1.1551 0.1528Financial risk (Drep/E) 0.4340 0.1983 0.0000 11.2678 1.0117Operating lease adj: (PVOL/TA) 0.1476 0.0668 0.0000 1.9186 0.2928Operating lease adj: �PVOL=TA� 0.1487 0.0676 0.0000 1.8899 0.2896Operating lease adj: (PVOL/E) 0.2606 0.0708 0.0000 4.4770 0.6075
Notes:1 All variables measured at 1994 year end; overbar indicates average measure over 3 years1992±4.
1206 BEATTIE, GOODACRE AND THOMSON
ß Blackwell Publishers Ltd 2000
debt items) in contrast to our total debt measure. While thisaccounts for some of the difference, the higher debt level in theUS remains. These statistics are consistent with the internationalcapital structure comparison which, based on a consistentmeasure of total debt (rather than total liabilities) for 1991,reported mean D/TA of 0.22 for the UK compared with 0.31 forthe US (Table II, Rajan and Zingales, 1995).
(i) OLS Regression Models
Table 4 reports results from the OLS regressions (using SHAZAMv 8.0) with �ROA as the proxy for operating/asset risk. In models1±3 the financial risk and operating lease variables are averagesover the three years 1992±4. Model 1 shows the relationshipbetween equity risk (�S ;60;94) and operating/asset risk andfinancial risk before any adjustment to financial risk foroperating leases. Both explanatory variables are significant atthe 1% level, and 52.9% of the cross-sectional variation in equityrisk is explained. Models 2 and 3 consider operating leaseadjustments based on constructive capitalisation (PVOL) and the`factor 8' method (OLR), respectively. If the capital marketincorporates the operating lease footnote disclosures in itsassessment of equity risk, then the coefficients on these variablesshould be reliably positive. In model 2, the addition of the PVOLvariable contributes significantly to the explanatory power of themodel as evidenced by the significantly positive coefficient (at the1% level)22 and the increase in adj R2. Similarly, in model 3, thecoefficient on OLR is significantly positive but at the 5% level.These results imply that operating leases are currently recognisedin the UK market's assessment of equity risk. Although thesignificance of the OLR coefficient is slightly lower, there is littleevidence that the market favours one method of estimatingoperating lease liabilities over the other.
If, for lessee companies, the risks associated with operatingleases are equivalent to those associated with debt, then thecoefficients on debt (�2) and operating lease adjustment (�3) areexpected to be equal. Here, �3 estimates for both PVOL (1.139)and OLR (0.951) are significantly smaller, at the 1% level, than�2 (5.358 and 5.341 respectively). Overall, these results indicatethat investors/analysts view operating leases as property rights,
RECOGNITION VS DISCLOSURE 1207
ß Blackwell Publishers Ltd 2000
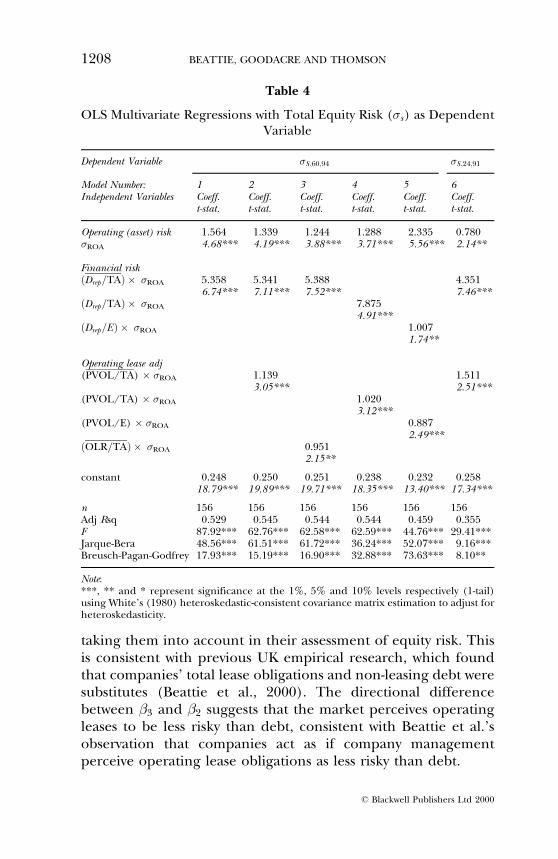
taking them into account in their assessment of equity risk. Thisis consistent with previous UK empirical research, which foundthat companies' total lease obligations and non-leasing debt weresubstitutes (Beattie et al., 2000). The directional differencebetween �3 and �2 suggests that the market perceives operatingleases to be less risky than debt, consistent with Beattie et al.'sobservation that companies act as if company managementperceive operating lease obligations as less risky than debt.
Table 4
OLS Multivariate Regressions with Total Equity Risk (�s) as DependentVariable
Dependent Variable �S;60;94 �S ;24;91
Model Number: 1 2 3 4 5 6Independent Variables Coeff. Coeff. Coeff. Coeff. Coeff. Coeff.
t-stat. t-stat. t-stat. t-stat. t-stat. t-stat.
Operating (asset) risk 1.564 1.339 1.244 1.288 2.335 0.780�ROA 4.68*** 4.19*** 3.88*** 3.71*** 5.56*** 2.14**
Financial risk�Drep=TA� � �ROA 5.358 5.341 5.388 4.351
6.74*** 7.11*** 7.52*** 7.46***�Drep=TA� � �ROA 7.875
4.91***�Drep=E� � �ROA 1.007
1.74**
Operating lease adj(PVOL/TA) � �ROA 1.139 1.511
3.05*** 2.51***(PVOL/TA) � �ROA 1.020
3.12***(PVOL/E) � �ROA 0.887
2.49***�OLR=TA� � �ROA 0.951
2.15**
constant 0.248 0.250 0.251 0.238 0.232 0.25818.79*** 19.89*** 19.71*** 18.35*** 13.40*** 17.34***
n 156 156 156 156 156 156Adj Rsq 0.529 0.545 0.544 0.544 0.459 0.355F 87.92*** 62.76*** 62.58*** 62.59*** 44.76*** 29.41***Jarque-Bera 48.56*** 61.51*** 61.72*** 36.24*** 52.07*** 9.16***Breusch-Pagan-Godfrey 17.93*** 15.19*** 16.90*** 32.88*** 73.63*** 8.10**
Note:***, ** and * represent significance at the 1%, 5% and 10% levels respectively (1-tail)using White's (1980) heteroskedastic-consistent covariance matrix estimation to adjust forheteroskedasticity.
1208 BEATTIE, GOODACRE AND THOMSON
ß Blackwell Publishers Ltd 2000
Models 4 and 5 in Table 4 consider alternative financial riskproxies. In model 4, the financial risk (Drep/TA) and operatinglease variable (PVOL/TA) are single period measures as at eachcompany's 1994 year-end. The results are almost identical tothose based on 3-year averages (model 3). Model 5 also usessingle period measures for financial risk and operating leaseadjustment but adopts total debt/market value of equity (Drep/E)as the proxy for financial risk, similar to Ely (1995a). The adj R2
reduces to 46% and while the operating/asset risk coefficient islarger and has a higher t-statistic, the size and significance of thefinancial risk coefficient are reduced in comparison with the totalassets-based models. The PVOL coefficient is slightly smaller butremains significantly positive at the 1% level.
The results from the US study by Ely (1995a) were broadlysimilar to those presented here. The overall explanatory power ofthe US models was somewhat lower (adj R2 = 39%),notwithstanding the larger sample size (n = 314). Thesignificance of the US financial risk variable was higher (t-stat.= 5.72), probably reflecting the higher levels of leverage in theUS sample. However, the significance of the operating/asset risk(t-stat. = 5.70) and operating lease coefficients (t-stat. = 2.58) werevery similar to our UK results. A further similarity is that Elyfound no difference between the operating lease adjustmentbased on rental expense (i.e., the factor method) and that basedon constructive capitalisation.
Finally in Table 4, model 6 presents the results from using, asthe dependent variable, an ex ante equity risk proxy. For this,equity risk (�S ;24;91) is measured over a period of 24 months priorto the start of the first of the three accounting periods over whichthe average financial risk and operating lease adjustmentvariables are calculated. Compared with the `roughlycontemporaneous' model 2, the results are very similar. Whilethe overall explanatory power (adj R2 = 36%) and the size andsignificance of �ROA are lower, the financial risk and operatinglease adjustments are not greatly affected.
(ii) Alternative Operating/Asset Risk Proxies
Evaluating operating leases as property rights also affects theproxy used thus far for operating/asset risk through ROA. To
RECOGNITION VS DISCLOSURE 1209
ß Blackwell Publishers Ltd 2000
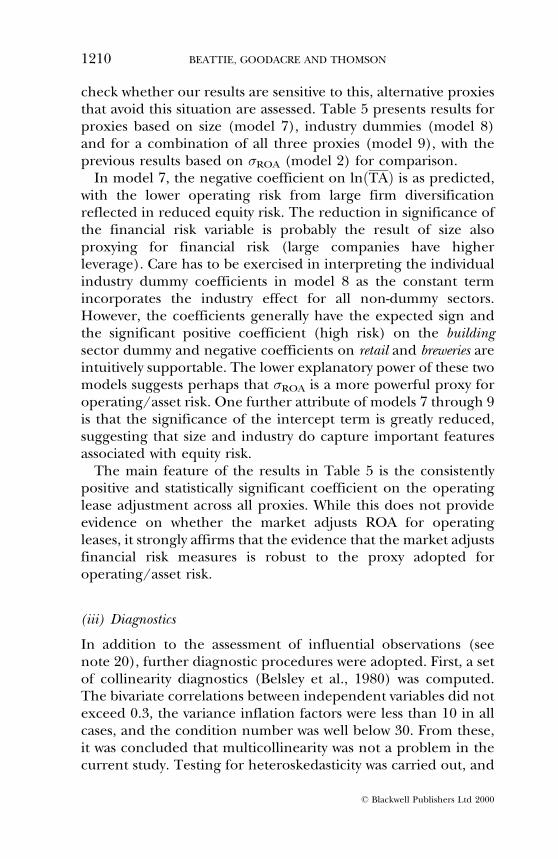
check whether our results are sensitive to this, alternative proxiesthat avoid this situation are assessed. Table 5 presents results forproxies based on size (model 7), industry dummies (model 8)and for a combination of all three proxies (model 9), with theprevious results based on �ROA (model 2) for comparison.
In model 7, the negative coefficient on ln�TA� is as predicted,with the lower operating risk from large firm diversificationreflected in reduced equity risk. The reduction in significance ofthe financial risk variable is probably the result of size alsoproxying for financial risk (large companies have higherleverage). Care has to be exercised in interpreting the individualindustry dummy coefficients in model 8 as the constant termincorporates the industry effect for all non-dummy sectors.However, the coefficients generally have the expected sign andthe significant positive coefficient (high risk) on the buildingsector dummy and negative coefficients on retail and breweries areintuitively supportable. The lower explanatory power of these twomodels suggests perhaps that �ROA is a more powerful proxy foroperating/asset risk. One further attribute of models 7 through 9is that the significance of the intercept term is greatly reduced,suggesting that size and industry do capture important featuresassociated with equity risk.
The main feature of the results in Table 5 is the consistentlypositive and statistically significant coefficient on the operatinglease adjustment across all proxies. While this does not provideevidence on whether the market adjusts ROA for operatingleases, it strongly affirms that the evidence that the market adjustsfinancial risk measures is robust to the proxy adopted foroperating/asset risk.
(iii) Diagnostics
In addition to the assessment of influential observations (seenote 20), further diagnostic procedures were adopted. First, a setof collinearity diagnostics (Belsley et al., 1980) was computed.The bivariate correlations between independent variables did notexceed 0.3, the variance inflation factors were less than 10 in allcases, and the condition number was well below 30. From these,it was concluded that multicollinearity was not a problem in thecurrent study. Testing for heteroskedasticity was carried out, and
1210 BEATTIE, GOODACRE AND THOMSON
ß Blackwell Publishers Ltd 2000
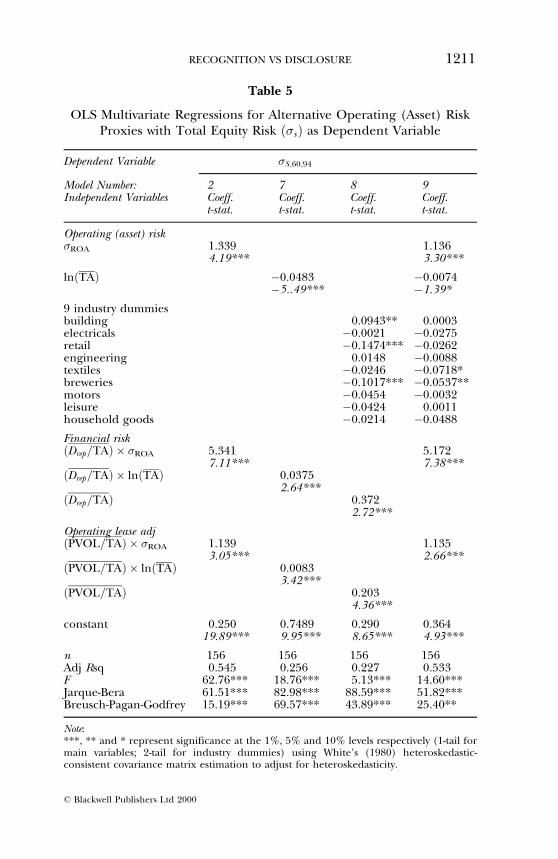
Table 5
OLS Multivariate Regressions for Alternative Operating (Asset) RiskProxies with Total Equity Risk ��s� as Dependent Variable
Dependent Variable �S;60;94
Model Number: 2 7 8 9Independent Variables Coeff. Coeff. Coeff. Coeff.
t-stat. t-stat. t-stat. t-stat.
Operating (asset) risk�ROA 1.339 1.136
4.19*** 3.30***
ln�TA� ÿ0.0483 ÿ0.0074ÿ5..49*** ÿ1.39*
9 industry dummiesbuilding 0.0943** 0.0003electricals ÿ0.0021 ÿ0.0275retail ÿ0.1474*** ÿ0.0262engineering 0.0148 ÿ0.0088textiles ÿ0.0246 ÿ0.0718*breweries ÿ0.1017*** ÿ0.0537**motors ÿ0.0454 ÿ0.0032leisure ÿ0.0424 0.0011household goods ÿ0.0214 ÿ0.0488
Financial risk�Drep=TA� � �ROA 5.341 5.172
7.11*** 7.38***�Drep=TA� � ln�TA� 0.0375
2.64***�Drep=TA� 0.372
2.72***
Operating lease adj�PVOL=TA� � �ROA 1.139 1.135
3.05*** 2.66***�PVOL=TA� � ln�TA� 0.0083
3.42***�PVOL=TA� 0.203
4.36***
constant 0.250 0.7489 0.290 0.36419.89*** 9.95*** 8.65*** 4.93***
n 156 156 156 156Adj Rsq 0.545 0.256 0.227 0.533F 62.76*** 18.76*** 5.13*** 14.60***Jarque-Bera 61.51*** 82.98*** 88.59*** 51.82***Breusch-Pagan-Godfrey 15.19*** 69.57*** 43.89*** 25.40**
Note:***, ** and * represent significance at the 1%, 5% and 10% levels respectively (1-tail formain variables; 2-tail for industry dummies) using White's (1980) heteroskedastic-consistent covariance matrix estimation to adjust for heteroskedasticity.
RECOGNITION VS DISCLOSURE 1211
ß Blackwell Publishers Ltd 2000
the Breusch-Pagan-Godfrey statistics (reported at the foot of thetables) generally indicate significant heteroskedasticity.Consequently, all significance tests are reported using White's(1980) heteroskedastic-consistent covariance matrix estimation.Further, the Jarque-Bera test for normality of residuals (also intables) indicates significant non-normality.23
(iv) Analysis by Company Size
Large companies are well-researched by the investment analystcommunity and there is some evidence that analysts adjustfinancial risk measures for operating leases for this group(Dresdner Kleinwort Benson, 1998). However, both medium-sized and particularly small listed companies receive lessattention from analysts. Consequently, one argument put forwardin the recognition versus disclosure debate is that disclosure isnot an adequate substitute for recognition for smaller andmedium sized companies. In view of this argument, it isimportant to identify whether the market makes a financial riskadjustment for operating leases across all sizes of company orwhether the adjustment is restricted to large, well-researchedcompanies.
Model 2 (Table 4) was re-estimated for three different sizegroupings based on total assets for the 1994 year-end. The cut-offpoints were chosen by reviewing a size-ranked list of companiesand seeking (subjectively) to identify natural break-points.Homogeneity was evident in the groupings adopted when testingfor heteroskedasticity in the regression modelling. The processyielded 24 large companies (assets > £1,000m), 46 medium-sizedcompanies (£100m<assets < £1,000m) and 86 small companies(assets < £100m).
The two regressions for the sub-samples of medium-sized andsmall companies gave similar sizes and signs for coefficientestimates to those obtained for the whole sample and both hadgood explanatory power (adj R2 = 43% and 55% respectively).The significance levels were also similar and were, for mediumand small companies respectively: operating/asset risk (1%, 5%),financial risk (5%, 1%) and most importantly operating leaseadjustment (1%, 5%). Thus, the adjustment to financial risk foroff-balance sheet operating leases does not appear to be confined
1212 BEATTIE, GOODACRE AND THOMSON
ß Blackwell Publishers Ltd 2000
to large, well-researched companies. The results for largecompanies were somewhat sensitive to a few highly influentialdata points within the small sample of 24 companies. The sign onthe operating lease adjustment variable was consistently positive,but its size and significance were dependent on the specificcompanies in the regression data set. This may also partiallyreflect the relatively low use of leasing by large companies, whichseem to prefer debt. For example, PVOL=TA for large (medium-sized) companies was 12.6% (15.0%) compared with Drep=TA of27.6% (18.5%) respectively.
In summary, UK investors/analysts do appear to recogniseoperating lease liabilities in their assessment of equity risk, aresult that is consistent with the US but inconsistent with theAustralian evidence. In the UK, there is little evidence to suggestthat the rental-based factor method of estimating operating leaseliability reflects actual behaviour more accurately than a processof constructive capitalisation. In the US, it is also not clear whichmethod of operating lease assessment is more strongly associatedwith equity risk. Ely (1995a) found no difference whereas ILWfound the factor method to have greater explanatory power.Further, the UK market recognises operating leases for small andmedium-sized companies as well as for the large companies withhigh analyst interest.
(v) ROA Adjustment for Operating Leases
While the impact of the capitalisation of operating leases onequity risk is likely to be mainly through the adjustment to thefinancial risk measure, the main proxy used in this study foroperating/asset risk (�ROA) is also affected as discussed inSections 3(ii) and (v) above. Companies that would experience afall in ROA if operating leased assets were capitalised (� > 1)would also experience a fall in the variability of ROA (�ROA), ifthis directional impact is stable over time. Of the 156 companies,17 have no operating leases so � � 1, 58 have � > 1 (denoted H)and 81 have � < 1 (denoted L). Thus, for 58 companies, theimpact on �ROA is expected to be negative and for 81 companiesit is expected to be positive; lower operating/asset risk should beassociated with lower equity risk and vice versa. The mean(median) values for � for the L and H groups of companies are
RECOGNITION VS DISCLOSURE 1213
ß Blackwell Publishers Ltd 2000
0.930 (0.976) and 1.370 (1.020) respectively, suggesting thattypically ROA (and therefore also �ROA) would decrease(increase) by approximately 2%, based on the median.
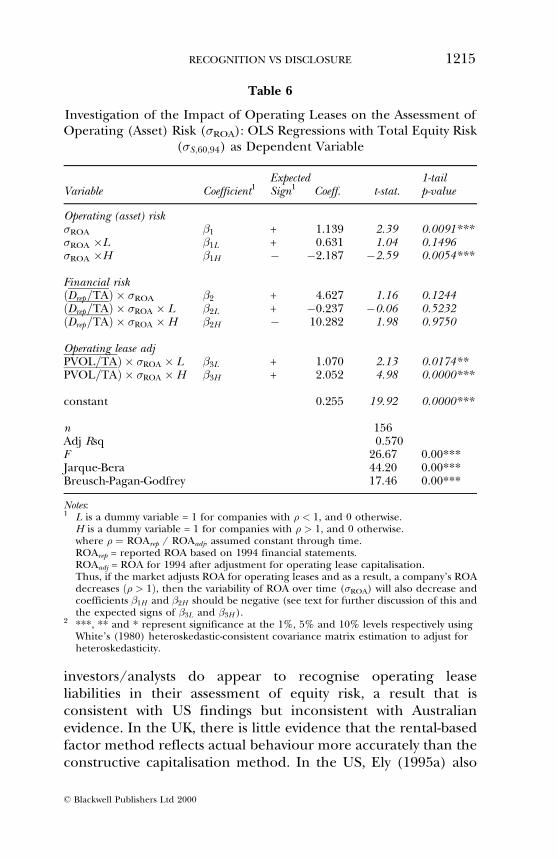
Table 6 reports the regression estimates for equation (7),which is model 2 with additional interactive dummy terms forexpected ROA impacts. The inclusion of the interactive dummyvariables has increased slightly the explanatory power, with adj R2
increasing to 57% from 54% in model 2. The signs of �1L, �1H
(on �ROA itself) and �3L and �3H are as expected, but the signsfor �2L, �2H , and the smaller size for �3L than �3H , are contrary toexpectation on the assumption that UK investors adjust the ROAratio for operating leases in their assessment of equity risk. Theexpected signs of the �ROA interactive terms and the significanceof �1H provide some evidence to support the contention thatinvestors adjust ROA for operating leases when assessing equityrisk. However, overall the results provide only mixed evidence,consistent with the findings of Ely (1995a).
6. SUMMARY AND CONCLUSIONS
The aim of the present study is to contribute to the ongoingrecognition versus disclosure debate by investigating therelationship between operating lease disclosures and equity riskassessments made by the capital market in the UK. The approachadopted is to conduct an indirect test using OLS regressionanalysis to determine whether there is an association betweenequity risk and an operating lease adjustment to financial risk.This test provides evidence as to whether investors/analysts viewoperating leases from a property rights perspective or from anownership perspective. Two alternative operating leaseevaluation methods are considered in order to establish whichmethod, if either, appears to be employed by UK investors/analysts. The first is a sophisticated present value method basedupon a constructive capitalisation procedure; the second methodis a simple factor method.
The empirical results provide evidence of a positiverelationship between equity risk and the adjustment foroperating lease liabilities. This result is robust to alternativeproxies for operating/asset risk and for financial risk. Thus, UK
1214 BEATTIE, GOODACRE AND THOMSON
ß Blackwell Publishers Ltd 2000
investors/analysts do appear to recognise operating leaseliabilities in their assessment of equity risk, a result that isconsistent with US findings but inconsistent with Australianevidence. In the UK, there is little evidence that the rental-basedfactor method reflects actual behaviour more accurately than theconstructive capitalisation method. In the US, Ely (1995a) also
Table 6
Investigation of the Impact of Operating Leases on the Assessment ofOperating (Asset) Risk (�ROA): OLS Regressions with Total Equity Risk
(�S ;60;94) as Dependent Variable
Expected 1-tailVariable Coefficient1 Sign1 Coeff. t-stat. p-value
Operating (asset) risk�ROA �1 + 1.139 2.39 0.0091***�ROA �L �1L + 0.631 1.04 0.1496�ROA �H �1H ÿ ÿ2.187 ÿ2.59 0.0054***
Financial risk�Drep=TA� � �ROA �2 + 4.627 1.16 0.1244�Drep=TA� � �ROA � L �2L + ÿ0.237 ÿ0.06 0.5232�Drep=TA� � �ROA �H �2H ÿ 10.282 1.98 0.9750
Operating lease adjPVOL=TA� � �ROA � L �3L + 1.070 2.13 0.0174**PVOL=TA� � �ROA �H �3H + 2.052 4.98 0.0000***
constant 0.255 19.92 0.0000***
n 156Adj Rsq 0.570F 26.67 0.00***Jarque-Bera 44.20 0.00***Breusch-Pagan-Godfrey 17.46 0.00***
Notes:1 L is a dummy variable = 1 for companies with � < 1, and 0 otherwise.
H is a dummy variable = 1 for companies with � > 1, and 0 otherwise.where � � ROArep / ROAadj, assumed constant through time.ROArep = reported ROA based on 1994 financial statements.ROAadj = ROA for 1994 after adjustment for operating lease capitalisation.Thus, if the market adjusts ROA for operating leases and as a result, a company's ROAdecreases �� > 1�, then the variability of ROA over time (�ROA) will also decrease andcoefficients �1H and �2H should be negative (see text for further discussion of this andthe expected signs of �3L and �3H ).
2 ***, ** and * represent significance at the 1%, 5% and 10% levels respectively usingWhite's (1980) heteroskedastic-consistent covariance matrix estimation to adjust forheteroskedasticity.
RECOGNITION VS DISCLOSURE 1215
ß Blackwell Publishers Ltd 2000
found no difference between the methods of operating leaseadjustment, but ILW (1993) found the factor method to havegreater explanatory power.
If, for lessee companies, the risks associated with operatingleases are equivalent to those associated with debt, then thecoefficients on debt and the operating lease adjustment areexpected to be equal. In fact, the coefficient on debt wasstatistically significantly higher than on the operating leaseadjustment, suggesting that debt contributes more highly to themarket's assessment of equity risk. Overall, these results indicatethat investors/analysts view operating leases as property rights,taking them into account in their assessment of equity risk, andthat the market considers the risks associated with operatingleases to be lower than those associated with debt. This isconsistent with previous UK empirical research, which foundthat companies' total lease obligations and non-leasing debtwere substitutes rather than complements (Beattie et al., 2000).The market's assessment of lower operating lease risk is alsoconsistent with Beattie et al.'s finding that companies act as ifleasing and debt are imperfect substitutes, with the implicationthat company management perceive operating lease obligationsas less risky. Given the usual retention of some residual valuerisk by lessors in operating lease contracts, this is not toosurprising.
While the impact of the capitalisation of operating leases onequity risk is likely to be mainly through an adjustment tofinancial risk measures, a secondary adjustment to operating/asset risk via the ROA ratio is also possible. This was investigatedbut mixed results were obtained.
The observation that the factor method of estimatingoperating lease liabilities is not favoured over constructivecapitalisation may reflect increasing investor/analyst sophisti-cation over time. The dangers of over-estimation of the operatinglease liability using the factor method are perhaps now betterknown (Dresdner Kleinwort Benson, 1998).
The market's recognition of operating lease liabilities acrossdifferent company size groupings is consistent with a measure ofmarket efficiency. It tends to refute the argument thatrecognition of operating leases on companies' balance sheets isnecessary to reduce imperfections in the small (and perhaps
1216 BEATTIE, GOODACRE AND THOMSON
ß Blackwell Publishers Ltd 2000
medium-sized) sectors of the listed company market. Althoughthese sectors have lower levels of analyst interest and research,relevant operating lease information is being impounded in themarket's assessment of equity risk in these sectors.
A major issue, which is outside the scope of the presentresearch, is whether the market adjusts equity risk appropriately forthe additional risk associated with unrecorded operating leaseliabilities. In other words, while the evidence suggests that themarket does incorporate operating leases in its equity riskassessments, is the size of the adjustment correct? This dependson two factors, the adequacy of the detail disclosed by way offootnote detail and the information processing ability of themarket. One option for accounting standard setters would be torequire more detailed footnote disclosure on operating leases.Some would argue that this would worsen the present situation ofperceived `information overload' in financial statements. Thealternative of requiring recognition of operating lease liabilities(and assets) on balance sheet has the advantage of notdepending on the information processing ability of investors.Company management has specific knowledge of the leasecontracts and is best placed to measure related assets andliabilities. However, as the recent discussion paper (ASB, 1999)acknowledges, there are considerable difficulties involved inprescribing measurement rules that will be robust to the manydifferent current (and future) contractual complexities.
The contribution of the present research is that it confirms thatthe UK market views operating leases from a `property rights',rather than ownership, perspective. This seems to support thestandard setters' search for an acceptable measurement basis onwhich these rights and obligations can be recognised `on-balancesheet'.
APPENDIX
Illustrative Calculation of PVOL: Constructive Capitalisation ofOperating Leases for BOC Group Plc
In the footnotes to the financial statements for the 1994 year end,BOC disclosed next year's operating lease commitments of
RECOGNITION VS DISCLOSURE 1217
ß Blackwell Publishers Ltd 2000
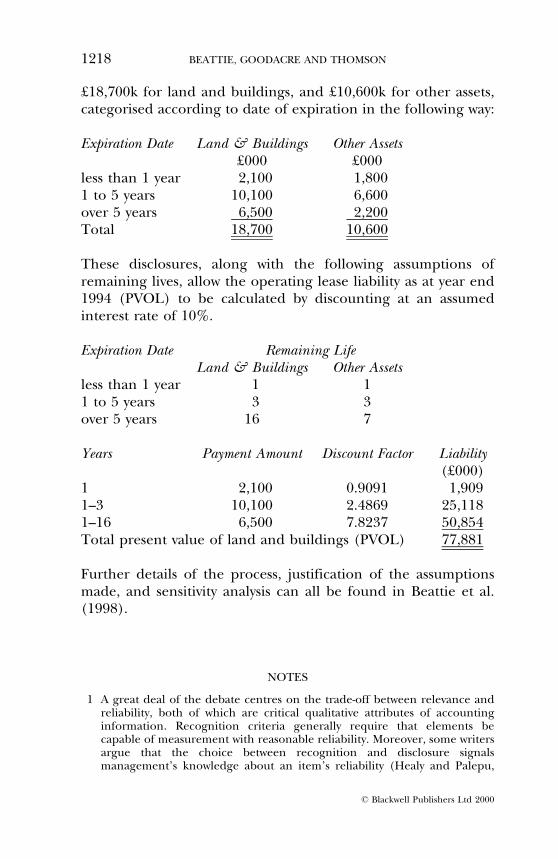
£18,700k for land and buildings, and £10,600k for other assets,categorised according to date of expiration in the following way:
Expiration Date Land & Buildings Other Assets£000 £000
less than 1 year 2,100 1,8001 to 5 years 10,100 6,600over 5 years 6,500 2,200Total 18,700 10,600
These disclosures, along with the following assumptions ofremaining lives, allow the operating lease liability as at year end1994 (PVOL) to be calculated by discounting at an assumedinterest rate of 10%.
Expiration Date Remaining LifeLand & Buildings Other Assets
less than 1 year 1 11 to 5 years 3 3over 5 years 16 7
Years Payment Amount Discount Factor Liability(£000)
1 2,100 0.9091 1,9091±3 10,100 2.4869 25,1181±16 6,500 7.8237 50,854Total present value of land and buildings (PVOL) 77,881
Further details of the process, justification of the assumptionsmade, and sensitivity analysis can all be found in Beattie et al.(1998).
NOTES
1 A great deal of the debate centres on the trade-off between relevance andreliability, both of which are critical qualitative attributes of accountinginformation. Recognition criteria generally require that elements becapable of measurement with reasonable reliability. Moreover, some writersargue that the choice between recognition and disclosure signalsmanagement's knowledge about an item's reliability (Healy and Palepu,
1218 BEATTIE, GOODACRE AND THOMSON
ß Blackwell Publishers Ltd 2000
1993), and that disclosure is interpreted by users as being less reliable thanrecognition (Amir and Ziv, 1997, p. 65).
2 Another set of market-based studies examines the market reaction to amandated change from disclosure to recognition (e.g., Espahbodi, Strockand Tehranian, 1991), the value-relevance of disclosures (e.g., Choi, Collinsand Johnson, 1997), and the differential rate at which the market capitalisesrecognised liabilities compared to disclosed liabilities (Davis-Friday, Folami,Liu and Mittelstaedt, 1999).
3 Harper et al. (1987 and 1991), using US subjects, find that footnotedisclosure of unfunded pension liabilities is not equivalent to balance sheetrecognition. Wilkins and Zimmer (1983a and 1983b) and Wilkins (1984)find, using Singapore-based subjects, that, although share valuations madeby investment analysts were unaffected by alternative reporting methods,this was not the case for predictions of company earnings, which may relymore heavily on accounting information compared to share valuations.Munter and Ratcliffe (1983) considered whether investment managersattach economic significance to alternative treatments of leases. Theyconcluded that investors' decisions did reflect alternative operating leaseaccounting treatments, with capitalisation having an adverse effect. In theirsurvey study of leases, pensions and post-retirement benefits,Gopalakrishnan and Parkash (1996) found that both borrowers and lendersare more likely to consider recognised obligations than disclosedobligations as debt-equivalent. Further, lenders consider disclosedobligations to be more like debt than borrowers do.
4 See Beattie, Edwards and Goodacre (1998, pp. 233±35) for a detaileddescription of the UK (and US) lease accounting regulations.
5 A direct market-based test of the equivalence of recognition versusdisclosure is not possible in an ex ante setting, nor can the accuracy ofoperating lease evaluations and their impounding into share prices beassessed.
6 See Ely (1995a) and references therein for a discussion of the propertyrights/ownership debate.
7 A prior study of market risk assessment of operating lease disclosures in theUS by Ely (1995a) uses a data set that ends in 1987. The magnitude ofleasing has grown significantly since that date.
8 Arnold et al. (1984) found significant differences to exist between thesecurity appraisal procedures performed by UK and US analysts. US analystswere found to consider financial results and make forecasts over a longertime scale. They were also found to undertake more fundamental analysisand to rate the profit and loss and balance sheet as more influential thanUK analysts. More specifically, US analysts place more importance on cashflows and financial ratios, on which operating leases could have majorimpact.
9 A study by Anderson and Epstein (1996, p. 165) found varying degrees ofself reliance by shareholders in different countries, with shareholders in theUS being more self reliant than in Australia and New Zealand.
10 The research design did not permit the adjustments made in response toeach of the nine forms to be assessed individually.
11 Narayanaswamy (1994) investigated the impact on equity risk of disclosedfinance lease liabilities for large UK companies. He found that financeleases were positively associated with equity return volatility but that themarket perceived finance leases to be less risky than debt.
RECOGNITION VS DISCLOSURE 1219
ß Blackwell Publishers Ltd 2000

12 If the theoretical model is sufficiently strong, the coefficients �0 and �1 areexpected to equal 0 and 1 respectively, and �2 should equal �1ÿ t�.However, there are several reasons why this might not occur empirically.First, the model makes the improbable assumption that the marginal taxrate is identical across firms. Second, accounting methods may cause �ROA
to be consistently higher or lower than an appropriate operating/asset riskmeasure. Third, debt comprises various liabilities which may not all have thesame relationship with equity risk (Ely, 1995a). When using similar models,Bowman (1980a), Dhaliwal (1986) and Ely (1995a) all report empiricalcoefficients that do not match theory. Thus, detailed interpretation basedon the size of coefficients is unlikely to be tenable.
13 Regressions were also performed with firm-specific risk as the dependentvariable and almost identical resutls (not reported) were obtained.
14 To check the robustness of the results to the choice of a 60 month measure,two other proxies for equity risk were assessed, measured over 24 monthsand 36 months ending in 1994. The results obtained using these proxieswere essentially similar and, therefore, are not reported.
15 The choice of seven years was a compromise between having sufficient datapoints to estimate the standard deviation and maintaining a reasonableoverall sample size. The model was also derived using ten years to estimate�ROA with a reduced sample size of 125 companies and similar results (notreported here) were obtained. The use of average total assets as thedenominator in ROA is to avoid the distortion that can occur when largeamounts of new capital are raised during the year. Two further modelsbased on opening assets (as Ely, 1995a used) yielded similar results.
16 Two other measures of the book value of debt, long term debt and net debt(i.e. total debt less cash equivalents) were also assessed and yielded similarresults (not reported here).
17 Almost identical regression results were obtained using separate estimatesof operating lease liabilities based on constructive capitalisation withinterest rates of (i) 8% and (ii) 12%, and (iii) shorter and (iv) longer leaselife estimates for leases expiring beyond year 5.
18 An alternative proxy was based on the next year's operating leasecommitment reported in a footnote to the balance sheet. This excludesshort-term rentals, contingent lease payments and lease contracts that haveterminated during the year, but includes a full-year liability for new leasecontracts. As almost identical results were obtained for this proxy, theresults are not reported here.
19 Sample representativeness checks were carried out based on size (totalassets, share capital plus reserves) and industry membership. These showedthat the company size distribution and industry sector distribution of thesample approximated closely to that of the population. Twenty threedifferent industrial sectors are represented in the sample with nine sectorshaving major representation (number of sample companies in brackets):building (19), electricals (16), retail (15), engineering (13), textiles (11),breweries (10), motors (9), leisure (9) and household goods (8).
20 Three outlier companies were identified during a preliminary set ofdiagnostic procedures and have been excluded from the analysis (Belsley etal., 1980). All three companies (Brent Walker, Castle Mill and Signet) sufferedlarge losses for the accounting periods before and around 1994. As a result,they all underwent complete restructuring by selling off their loss makingactivities or by changing the focus of their business activities. Brent Walker's
1220 BEATTIE, GOODACRE AND THOMSON
ß Blackwell Publishers Ltd 2000
listing on the London Stock Exchange was eventually cancelled in 1997 whenits lenders proceeded with liquidation. Castle Mill subsequently changed itsname to BWL, and its activities from wholesale clothing distribution to aircraftservices through the purchase of an unquoted company. The Signet Group'sUK business was totally reorganised through major sell-offs before it returnedto running profitably. Two further major outlier companies (InternationalBusiness Communications, Upton and Southern) were identified duringdiagnostic testing of regression estimates; they consistently had very highinfluence (dffits and dfbetas) and distorted the underlying relationships ofthe rest of the sample. In particular, these two small companies had negativeequity and extreme values for both �S and �ROA, thereby exerting a highdegree of leverage on the results. On the basis of this information thesecompanies were considered sufficiently atypical of the sample, and of thepopulation it seeks to represent, to warrant exclusion from further analysis.
21 For large (TA > £1,000m), medium-sized and small (TA < £100m)companies in our sample the means for �ROA are respectively 0.025, 0.041and 0.065.
22 Alternative hypotheses are all uni-directional, so one-tail tests are reportedthroughout this study. This also facilitates compaison with Ely (1995a) whosimilarly reports one-tail critical t-values.
23 The theoretical structure proposed earlier is essentially linear inspecification, so a log-transformation of the dependent variable ��S�, withits implied exponential relationship, is not supportable. However, forcomparison with prior studies (Imhoff et al., 1993; and Gallery and Imhoff,1998), a natural log transformation of the dependent variable, ln��S;60;94�was investigated. Using this specification, the residuals are normal andheteroskedasticity disappears. The signs and significance of the coefficientsare essentially the same as those obtained without the log transformation.
REFERENCES
Amir, E. and A. Ziv (1997), `Recognition, Disclosure or Delay: Timing theAdoption of SFAS No. 106', Journal of Accounting Research, Vol. 35, No. 1(Spring), pp. 61±81.
Anderson, R.H. and M.J. Epstein (1996), The Usefulness of Corporate AnnualReports to Shareholders in Australia, New Zealand and the United States: AnInternational Comparison (JAI Press, Greenwich, CT).
Arnold, J., P. Moizer and E. Noreen (1984), `Investment Appraisal Methods ofFinancial Analysts: A Comparative Study of U.S. and U.K. Practices',International Journal of Accounting, Vol. 19, No. 2, pp. 1±18.
ASB (1999), Leases: Implementation of a New Approach, Discussion Paper(Accounting Standards Board, London).
ASC (1984), Accounting for Leases and Hire Purchase Contracts, Statement ofStandard Accounting Practice No. 21 (Accounting Standards Committee,London).
Axelson, K.S. (1971), `Needed: A Generally Accepted Method for MeasuringLease Commitments', Financial Executive (July), pp. 40±52.
Beattie, V.A., K. Edwards and A. Goodacre (1998), `The Impact of ConstructiveOperating Lease Capitalisation on Key Accounting Ratios', Accounting andBusiness Research, Vol. 28, No. 4, pp. 233±54.
RECOGNITION VS DISCLOSURE 1221
ß Blackwell Publishers Ltd 2000
Beattie, V.A., A. Goodacre and S. Thomson (2000), `Operating Leases and theAssessment of Lease-debt Substitutability', Journal of Banking and Finance,Vol. 24, No. 3, pp. 427±70.
Beaver, W., P. Kettler and M. Scholes (1970), `The Association Between MarketDetermined and Accounting Determined Risk Measures', The AccountingReview, Vol. 45, No. 4 (October), pp. 654±82.
Belsley, D.A., E. Kuh and R.E. Welsch (1980), Regression Diagnostics: IdentifyingInfluential Data and Sources of Collinearity (John Wiley & Sons, New York).
Bowman, R.G. (1979), `The Theoretical Relationship between Systematic Riskand Financial Accounting Variables', Journal of Finance, Vol. 34, No. 3(June), pp. 617±30.
________ (1980a), `The Debt Equivalence of Leases: An EmpiricalInvestigation', The Accounting Review, Vol. 55, No. 2 (April), pp. 237±53.
________ (1980b), `The Importance of a Market-Value Measurement of Debt inAssessing Leverage,' Journal of Accounting Research, Vol. 18, No. 1 (Spring),pp. 242±54.
Breton, G. and R.J. Taffler (1995), `Creative Accounting and Investment AnalystResponse', Accounting and Business Research, Vol. 25, No. 98, pp. 81±92.
Choi, B., D.W. Collins and W.B. Johnson (1997), `Valuation Implications ofReliability Differences: The Case of Nonpension PostretirementObligations', The Accounting Review, Vol. 72, No. 3 (July), pp. 351±83.
Davis-Friday, P.Y., L.B. Folami, C-S. Liu and H.F. Mittelstaedt (1999), `The ValueRelevance of Financial Statement Recognition vs. Disclosure: Evidencefrom SFAS 106', The Accounting Review, Vol. 74, No. 4 (October), pp. 403±23.
Day, J.F.S. (1986), `The Use of Annual Reports by UK Investment Analysts',Accounting and Business Research, Vol. 16, No. 64 (Autumn), pp. 295±307.
Dhaliwal, D.S. (1986), `Measurement of Financial Leverage in the Presence ofUnfunded Pension Obligations', The Accounting Review, Vol. 61, No. 4(October), pp. 651±61.
Dresdner Kleinwort Benson (1998), Operating Leases: The Retail House of Cards(Dresdner Kleinwort Benson Research, London).
Edwards, K. (1997), The Impact of Constructive Operating Lease Capitalisation on KeyAccounting Ratios, MSc Thesis (University of Stirling).
Ely, K.M. (1995a), `Operating Lease Accounting and the Market's Assessment ofEquity Risk', Journal of Accounting Research, Vol. 33, No. 2 (Autumn), pp.397±415.
________ (1995b), `Cross-Sectional Differences in the Relation between theAccounting Return on Assets and Equity Risk', Journal of Accounting,Auditing and Finance, Vol. 10, No. 3 (Summer), pp. 437±58.
Espahbodi, H., E. Strock and H. Tehranian (1991), `Impact on Equity Prices ofPronouncements Related to Non-Pension Post Retirement Benefits',Journal of Accounting and Economics, Vol. 14, No. 4 (December), pp. 323±46.
FASB (1984), Statement of Financial Accounting Standards No.5: Recognition andMeasurement in Financial Statements of Business Enterprises (FinancialAccounting Standards Board, Stamford, CT).
Finance and Leasing Association (1994), Annual Report 1994 (Finance andLeasing Association, London).
Gallery, G. and E.A. Imhoff (1998), `Disclosure versus Recognition: SomeEvidence from the Australian Capital Market Regarding Off-Balance SheetLeasing', Paper presented at the University of Melbourne, ResearchSeminar Series.
1222 BEATTIE, GOODACRE AND THOMSON
ß Blackwell Publishers Ltd 2000
Gopalakrishnan, V. and M. Parkash (1996), `The Debt-equivalency ofRecognized vs. Disclosed Obligations: An Examination of Borrower andLender Perceptions', Research in Accounting Regulation, Vol. 10, pp. 63±77.
Hamada, R.S. (1972), `The Effect of the Firm's Capital Structure on theSystematic Risk of Common Stocks', Journal of Finance, Vol. 27, No. 2 (May),pp. 435±52.
Harper, R.M., W.G. Mister and J.R. Strawser (1987), `The Impact of NewPension Disclosure Rules on Perceptions of Debt', Journal of AccountingResearch, Vol. 25, No. 2 (Autumn), pp. 327±30.
________ ________ ________ (1991), `The Effect of Recognition VersusDisclosure of Unfunded Postretirement Benefits on Lenders' Perceptionsof Debt', Accounting Horizons, Vol. 5, No. 3 (September), pp. 50±56.
Healy, P.M. and K.G. Palepu (1993), `The Effect of Firm's Financial DisclosureStrategies on Stock Prices', Accounting Horizons, Vol. 7, No. 1 (March), pp.1±11.
Houlihan, W.A. and A.C. Sondhi (1984), `De Facto Capitalization of OperatingLeases: The Effect on Debt Capacity', Corporate Accounting, Vol. 2, No. 3, pp.3±13.
Imhoff, E.A., R.C. Lipe and D.W. Wright (1991), `Operating Leases: Impact ofConstructive Capitalization', Accounting Horizons, Vol. 5, No. 1, pp. 51±63.
________ ________ ________ (1993), `The Effects of Recognition VersusDisclosure on Shareholder Risk and Executive Compensation', Journal ofAccounting, Auditing and Finance, Vol. 8, No. 4 (Fall), pp. 335±68.
________ ________ ________ (1995), `Is Footnote Disclosure an AdequateAlternative to Financial Statement Recognition?' Journal of FinancialStatement Analysis, Vol. 1, No. 1 (Fall), pp. 70±81.
Johnson, L.T. (1992), `Research on Disclosure', Accounting Horizons, Vol. 6, No 1(March), pp. 101±3.
McGregor, W. (1996), Accounting for Leases: A New Approach (FinancialAccounting Standards Board, Stamford, CT).
Modigliani, F. and M. Miller (1958), `The Cost of Capital, Corporation Financeand the Theory of Investment', American Economic Review, Vol. 48 (June),pp. 261±97.
________ ________ (1963), `Corporate Income Taxes and the Cost of Capital: ACorrection', American Economic Review, Vol. 53, No. 3 (June), pp. 433±43.
Munter, P. and T.A. Ratcliffe (1983), `An Assessment of User Reactions to LeaseAccounting Disclosure', Journal of Accounting, Auditing and Finance, Vol. 6,No. 2, pp. 108±14.
Narayanaswamy, R. (1994), `The Debt Equivalence of Leases in the UK: AnEmpirical Investigation', British Accounting Review, Vol. 26, No.4(December), pp. 337±51.
PricewaterhouseCoopers Leasing Team (1998), Tolley's Leasing in the UK (TolleyPublishing, Croydon).
Rajan, R.G. and L. Zingales (1995), `What Do We Know About CapitalStructure? Some Evidence from International Data', Journal of Finance, Vol.50, No. 5 (December), pp. 1421±60.
Schipper, K. (1994), `Academic Accounting Research and the Standard SettingProcess'. Accounting Horizons, Vol. 8, No. 4 (December), pp. 61±73.
SHAZAM (1997), SHAZAM User's Reference Manual Version 8.0 (McGraw-Hill,New York).
White, H. (1980), `A Heteroskedasticity-covariance Matrix Estimator and aDirect Test for Heteroskedasticity', Econometrica, Vol. 48, pp. 817±38.
RECOGNITION VS DISCLOSURE 1223
ß Blackwell Publishers Ltd 2000
Wilkins, T. (1984), `A Behavioural Investigation of Alternative Methods ofFinancing Capital Acquisitions and Lease Capitalization', Accounting andBusiness Research, Vol. 14, No. 56 (Autumn), pp. 359±66.
________ and I. Zimmer (1983a), `The Effect of Leasing and Different Methodsof Accounting for Leases on Credit Evaluations', The Accounting Review, Vol.58, No. 4, pp. 749±64.
________ ________ (1983b), `The Effect of Alternative Methods of Accountingfor Leases ± An Experimental Study', Abacus, Vol. 19, No. 1, pp. 64±75.
1224 BEATTIE, GOODACRE AND THOMSON
ß Blackwell Publishers Ltd 2000