Embed Size (px)
Citation preview

review
nature methods | VOL.10 NO.10 | OctOber 2013 | 949
EWAS have increasingly replaced targeted approaches focusing on individual candidate genes, and they hold great promise for systematically dissecting the role of epigenetic variation in health and disease. However, good practices and accepted standards for conduct-ing EWAS are only starting to emerge, and several key principles of conducting genome-wide associa-tion studies (GWAS) are problematic in the context of EWAS. In GWAS, standardization efforts were essential
Recommendations for the design and analysis of epigenome-wide association studiesKarin B Michels1,2, Alexandra M Binder2, Sarah Dedeurwaerder3, Charles B Epstein4, John M Greally5, Ivo Gut6, E Andres Houseman7, Benedetta Izzi8, Karl T Kelsey9,10, Alexander Meissner4,11, Aleksandar Milosavljevic12, Kimberly D Siegmund13, Christoph Bock14–16,18 & Rafael A Irizarry17,18
Epigenome-wide association studies (EWAS) hold promise for the detection of new regulatory mechanisms that may be susceptible to modification by environmental and lifestyle factors affecting susceptibility to disease. Epigenome-wide screening methods cover an increasing number of CpG sites, but the complexity of the data poses a challenge to separating robust signals from noise. Appropriate study design, a detailed a priori analysis plan and validation of results are essential to minimize the danger of false positive results and contribute to a unified approach. Epigenome-wide mapping studies in homogenous cell populations will inform our understanding of normal variation in the methylome that is not associated with disease or aging. Here we review concepts for conducting a stringent and powerful EWAS, including the choice of analyzed tissue, sources of variability and systematic biases, outline analytical solutions to EWAS-specific problems and highlight caveats in interpretation of data generated from samples with cellular heterogeneity.
for fostering the generation of reproducible results1. The EWAS field will benefit from similar standardiza-tion efforts. Members of international consortia that pursue the establishment of reference epigenomes for a large number of cell types and conditions—such as the US National Institutes of Health Roadmap Epigenomics Initiative2, the International Human Epigenome Consortium (IHEC)3 and BLUEPRINT (a BLUEPRINT of Hematopoietic Epigenomes)4—have
1Obstetrics and Gynecology Epidemiology Center, Department of Obstetrics and Gynecology, Brigham and Women’s Hospital, Harvard Medical School, Boston, Massachusetts, USA. 2Department of Epidemiology, Harvard School of Public Health, Boston, Massachusetts, USA. 3Laboratory of Cancer Epigenetics, Faculty of Medicine, Université Libre de Bruxelles, Brussels, Belgium. 4Epigenomics Program, The Broad Institute, Cambridge, Massachusetts, USA. 5Center for Epigenomics, Albert Einstein College of Medicine, Bronx, New York, USA. 6Centro Nacional de Analisis Genomico, Barcelona, Spain. 7School of Biological and Population Health Sciences, College of Public Health and Human Sciences, Corvallis, Oregon, USA. 8Institute for Prevention and Cancer Epidemiology, Freiburg Medical Center, University of Freiburg, Freiburg, Germany. 9Department of Epidemiology, Brown University School of Medicine, Providence, Rhode Island, USA. 10Department of Pathology and Laboratory Medicine, Brown University School of Medicine, Providence, Rhode Island, USA. 11Department of Stem Cell and Regenerative Biology, Harvard University, Cambridge, Massachusetts, USA. 12Bioinformatics Research Laboratory, Epigenome Center, Department of Molecular and Human Genetics, Baylor College of Medicine, Houston, Texas, USA. 13Department of Preventive Medicine, Keck School of Medicine, University of Southern California, Los Angeles, California, USA. 14CeMM Research Center for Molecular Medicine of the Austrian Academy of Sciences, Vienna, Austria. 15Department of Laboratory Medicine, Medical University of Vienna, Vienna, Austria. 16Max Planck Institute for Informatics, Saarbrücken, Germany. 17Department of Biostatistics, Johns Hopkins University, Baltimore, Maryland, USA. 18These authors contributed equally to this work. Correspondence should be addressed to K.B.M. ([email protected]).Received 13 JanuaRy; accepted 11 July; published online 27 septembeR 2013; doi:10.1038/nmeth.2632
npg
© 2
013
Nat
ure
Am
eric
a, In
c. A
ll rig
hts
rese
rved
.

950 | VOL.10 NO.10 | OctOber 2013 | nature methods
review
started to take on the challenge of stand-ardizing the experimental assays for epi-genome mapping, but they provide little guidance on the design, data analyses and interpretation of the results of an EWAS.
EWAS examine the epigenetic state at many different loci in a number of individuals and assess whether any of these loci are asso-ciated with a trait. EWAS typically focus on the association between DNA methylation in a specific tissue and the presence of disease or other characteristics such as environmental pollutants. EWAS linking chromatin or microRNAs are currently hindered by the complexity of appropriate biospecimen collection; hence we limit our discussion here to DNA methylation EWAS. These studies use microarray technology or high-throughput sequencing using a vari-ety of protocols, each of which comes with characteristic strengths and limitations5,6. Regardless of technology, as the number of loci covered by these methods increases and as we learn more about interdependence of genetic and epigenetic variation, the statistical analyses to interpret the large amounts of information generated have rapidly become more complex7. Moreover, the dynamic nature of epigenetic signatures, which are variable throughout the life course, renders the design and interpretation of EWAS conceptu-ally different (and arguably more difficult) than those of GWAS.
In the context of EWAS, DNA methylation measurements can be considered a quantitative measure. Although DNA methylation at the single-molecule level is a binary mark, measurement at the tissue level averages over thousands or even millions of copies of DNA. Therefore, what is measured for any given sample at any given CpG site is the percentage of cells that are methylated, which is different from the categorical character of genotype information in GWAS.
To account for biologic variability, GWAS necessitate collec-tion of sufficient samples to permit the parsing of real average differences between, say, cases and controls from those expected by chance given the within-population variability. EWAS focus on similar phenotypes and therefore face the same type of vari-ability and require biological replication. However, although the genomic outcome is fixed for GWAS (genotypes), this is not the case for EWAS as natural variation affects DNA methylation, mak-ing assessments variable owing to random measurement error and biological variability (which is not removed by improved mea-surement technology8 and is site-specific9).
To discuss the concepts for conducting stringent and power-ful EWAS for human diseases, a two-day workshop was held on 3–5 June 2012 at the Radcliffe Institute for Advanced Study at Harvard University in Cambridge, Massachusetts, USA, entitled “Challenges of Epigenome-wide Association Studies—Optimizing Analytic Methods to Identify Important DNA Methylation Marks.” Recommendations for a standardized EWAS methodol-ogy emerging from this workshop are provided below.
review of previously published ewasTo provide a robust foundation for making recommendations for the design and execution of epigenome-wide association stud-ies, we critically reviewed the vast majority of EWAS that have been published before 7 July 2013. We focused our review on the most commonly used methods to assess genome-wide DNA methylation, namely methylation DNA immunoprecipitation (MeDIP), reduced-representation bisulfite sequencing (RRBS) and the Illumina GoldenGate, Infinium 27K and 450K assays. We used the following query to identify such EWAS in PubMed: (Illumina OR HumanMethylation OR Infinium OR 27K OR 450K OR Goldengate OR “genome-wide”) and manually reviewed all papers. We retained studies if they focused on primary human samples, included data for at least five individuals and had a con-crete biological question (rather than focusing on methods devel-opment). The studies that met our inclusion criteria are listed in Supplementary Table 1 and summarized in Figure 1.
The earliest EWAS we included used the GoldenGate array10; the numbers of EWAS increased exponentially over time, with the majority of studies published in 2012 and 2013 (Fig. 1a). The primary analysis for nearly every study focused on the variable of interest (for example, cancer, smoking or aging) and site-specific DNA methylation, with ~30% adjusting for additional covariates. The majority of these studies applied some form of correction for multiple testing. Of 257 studies, about half explored the associa-tion between CpG-specific methylation level and tumor presence or progression (Fig. 1b). In these studies, almost all compari-sons were made with adjacent histologically ‘tumor-free’ tissue. The total number of individuals analyzed in each study ranged from 6 to 2,442, with a median of 46, indicating a highly skewed distribution of study sizes (Fig. 1c). In about one-third of these studies, findings were validated in an independent sample set using various techniques. Some validations were performed using a different technology, in which case the validation also guards against systematic errors and can thereby substitute for a techni-cal verification in the original cohort. Most of these investigators verified their findings in their original samples using a locus-specific methylation technique before embarking on validation in a different set of samples (Fig. 1d).
design of an ewasStarting with a good hypothesis substantially increases the chances of an EWAS providing biologically interpretable results. It is use-ful to sketch a hypothesized causality chain by which epigenetic
a b
c
80
Pub
licat
ions
Pub
licat
ions60
40
20
0
2006
2007
2008
2009
2010
2011
2012
2013
(Jan–Jun)
150
100
50
00 500 1,000 1,500
Cou
ntSample size
MethodGoldenGate27K450KRRBSMeDIP–chipMeDIP–seq
MethodGoldenGate27K450KRRBSMeDIP–chipMeDIP–seq
1007550250
Cance
r
Expos
ure
Other
disea
sePro
filing
d None (19%)
Expression (11%) Validation and expression (2%)
Verification and expression (19%)
Validation (6%)
Verification (17%)
Validation, verification and expression (13%)
Validation and verification (12%)
Figure 1 | Descriptive analysis of prior EWAS. (a) The number of EWAS published each year by technology. (b) Research question by technology; exposure includes environmental and behavioral predictors of DNA methylation level. (c) Distribution of the total number of individuals in each study. (d) Proportions of studies that included verification and/or validation, as defined in this Review.
npg
© 2
013
Nat
ure
Am
eric
a, In
c. A
ll rig
hts
rese
rved
.

nature methods | VOL.10 NO.10 | OctOber 2013 | 951
review
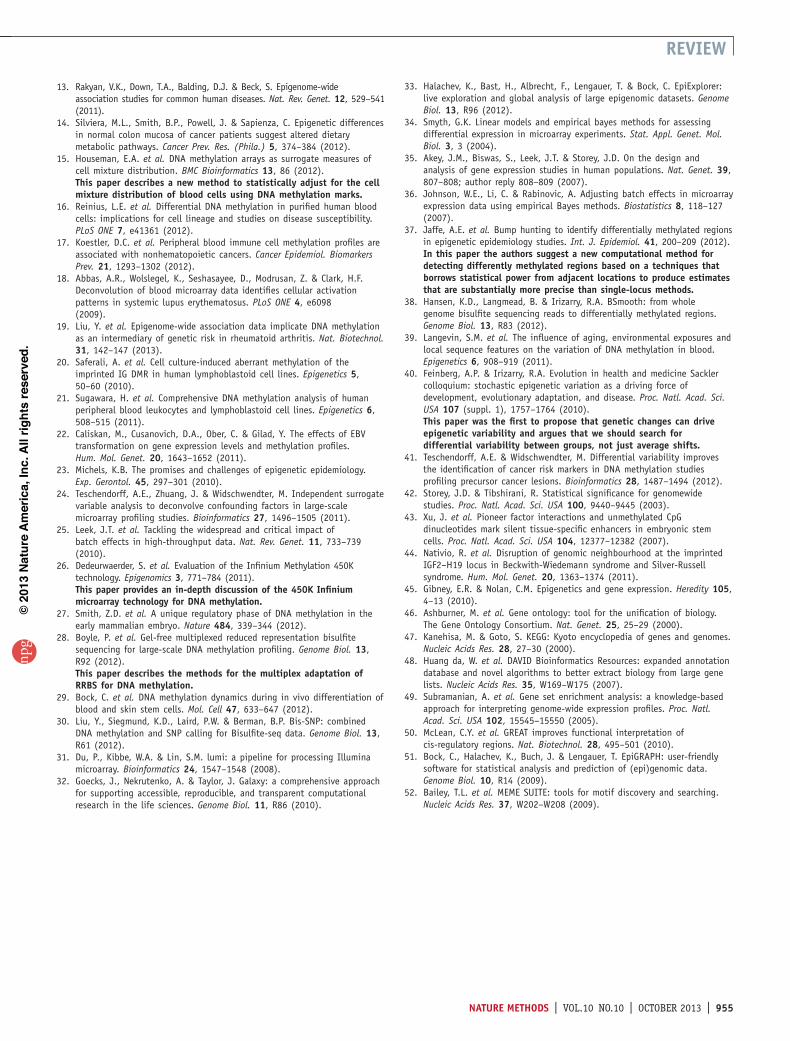
changes might be associated with a concrete disease phenotype, either through direct cause or direct consequence or by indirect causation via a third variable (for example, specific environmen-tal exposures that modulate both the epigenome and the risk for disease; Fig. 2). Study designs that rely merely on convenience, for example, the incidental availability of biospecimens, are less likely to generate meaningful results. The hypothesis will determine not only the choice of the overall study design, a topic that has been reviewed elsewhere11–13, but also the choice of the studied cohorts and cell types as outlined below.
Select appropriate tissue. The tissue specificity of the epigenomic pattern adds another challenge to the design of EWAS. Most cancer EWAS used primary tumor samples with adjacent tissues as controls (Supplementary Table 1). The purity of the tumor material should be confirmed by a pathology review, and laser microdissection may be required to obtain sufficiently pure sam-ples. Cancerous organs may exhibit epigenetic changes even in regions with histologically normal tissue, making organ tissue from healthy control subjects a preferable choice14. EWAS for other diseases often measured DNA methylation in blood sam-ples because disease-relevant tissues are difficult to obtain, but the biological relevance of blood DNA methylation patterns may not be apparent. The use of blood as surrogate tissue requires stringent validation and cautious interpretation of results. To establish a surrogate tissue in a statistically sound manner, it is not only necessary for interindividual epigenetic differences to correlate between the tissue of interest and the surrogate but also for the exposure to induce similar changes in both tissues. Currently, there is no clear evidence that, in general, epigenetic marks respond to environmental exposures in a similar way across tissues, which makes the identification of a surrogate tissue con-tentious and problematic.
Consider heterogeneity of cell population. The cell-specificity of DNA methylation and its implications have been ignored in almost all EWAS. Purified samples consisting only of a single cell type are preferable to mixed cell samples. Although this consid-eration applies to all tissues of the human body, it has been studied most extensively for blood, which is composed of a variety of dif-ferent cell subtypes with unique DNA-methylation profiles15,16. Differences in DNA methylation between cases and controls may be disease-related or may be due to changes in the propor-tional distribution of different cell types in the tissue of interest (for example, as a result of infection, inflammation or other conditions), which would confound the methylation-disease association17. Hence, differences in DNA methylation will often reflect immune cell activation rather than direct impact of dis-ease. Statistical deconvolution techniques exist to interpret DNA methylation data collected in mixed cell samples15. Similar to methods developed for mRNA18, statistical adjustments of DNA methylation data for cell distributions require the availability of reference epigenomes for the component cell types created by cell sorting. Linear models are used to select a small number (100–500) of differentially methylated regions (DMRs) representing distinct DNA methylation profiles for each cell type. For each DMR, the measured proportion of methylated DNA is assumed to increase as a linear mixture of the distinct cell-specific profiles; the mixing coefficients are assumed to represent the proportions
of each individual cell type in the target specimen. Hence, the availability of reference epigenomes for various cell types in popu-lation subgroups defined by age, sex and ethnicity will be invalu-able. However, neither the experimental cell purification nor the statistical correction for cell mixtures is perfect, and any results from studies assessing DNA methylation in heterogeneous cell types should be interpreted cautiously.
Diseased organ tissue generally displays a different spectrum of cellular heterogeneity than corresponding tissue from a healthy individual. Failure to account for cellular heterogeneity can create false positive results and false negative results. Few of the EWAS reviewed here made reference to the cellular heterogeneity or considered the possibility that the results were due to immune-defense mechanisms inducing shifts in cell subpopulations19. Finally, despite the utility of in vitro–cultured cell lines as renew-able source of DNA for genome-wide association studies, these cell lines (including Epstein-Barr virus–transformed lymphoblas-toid cell lines) tend to exhibit highly distorted epigenomes20–22, which diminishes their value as EWAS samples.
Control for population structure and biological variability. The epigenome varies according to characteristics of the study popu-lation. If any of these characteristics are associated with the dis-ease of interest, confounding may be introduced23. It is therefore essential to either select a population that is homogeneous with respect to these characteristics (for example, restrict the study population to individuals of a certain age range) or to identify a population large enough to permit stratification or statistical correction for these characteristics. The latter approach has the advantage of broader generalizability of the results.
Studies with sufficiently large sample sizes are essential for the internal and external validity and the reliability of results. The EWAS we reviewed here were mostly of limited samples size, and
Researchquestion
Studypopulation
Relevanttissue
Epigeneticvariation
Exogenousvariability
Measured genome-wide DNA methylationTechnicalvariability
Validation
Site-specific analysis Regional analysis Cluster analysis
VerificationInterpretation
Biological
Exp
osur
e Outcom
e
Variability
Figure 2 | Steps toward a successful EWAS. Exposure (e.g., smoking, drug exposure or aging) or outcome (e.g., diseases or onset of puberty) one chooses to study define the research question, the study population, the choice of the tissue and the biologic variability.
npg
© 2
013
Nat
ure
Am
eric
a, In
c. A
ll rig
hts
rese
rved
.

952 | VOL.10 NO.10 | OctOber 2013 | nature methods
review
power calculations were rarely presented. An understanding of the biological variability in DNA methylation, which is site-specific9, may inform power calculations for future studies. Longitudinal EWAS are needed to better characterize intraindividual variability over time. As natural variation affects DNA methylation, larger sample sizes will typically be required for EWAS than for GWAS for any given phenotype, even when the most technically sophisticated assays are used.
Choose an appropriate epigenome-wide DNA methylation protocol. Until cost considerations permit routine application of whole-genome bisulfite sequencing in large populations, other epigenome-wide methylation methods have to be used.
The Illumina Infinium HumanMethylation450 BeadChip (450K array) allows researchers to assess the DNA methylation levels of close to half a million CpG sites distributed across the genome, which corresponds to 2% of all CpG sites of the human genome. As the technology is high-throughput, hundreds of samples can be profiled in a short time period. Therefore, the Infinium 450K array is currently a good compromise of reagent costs, labor, sam-ple throughput and coverage. Because microarrays are suscep-tible to batch effects, they require careful experimental design and appropriate analytic approaches24,25. A shortcoming of the chip technology is the high amount (about 500 nanograms) of required input DNA. Moreover, in contrast to sequencing-based methods, this approach does not address allele-specific and sin-gle-nucleotide polymorphism (SNP)-specific methylation and does not allow the discovery of variation beyond the probed loci. The technical considerations of Infinium data analysis have been discussed elsewhere7,26.
RRBS provides more coverage than the 450K array, though it is biased toward (C+G)-rich regions. Its strengths are high sensitiv-ity27 and relatively high throughput28. In particular, the low input requirements enable an efficient use of highly purified samples29 and, as is the case with other sequencing-based approaches, enable integration of SNPs into the analysis using a bisulfite-sequencing variant caller30.
There are several other experimental protocols, including MeDIP with high-throughput sequencing (MeDIP-seq) and methyl-CpG binding domain protein sequencing (MBD-seq), which enrich DNA for either the methylated or unmethylated fractions but lack the benefit of an internal control. Because DNA methylation–specific enrichment reactions are quantitative (as compared to the binary character of the bisulfite conversion), they are susceptible to a large number of measured and unmea-sured sources of bias (for example, room temperature, humidity or operator influences). These technical variations are difficult to standardize and keep constant over extended time periods. Furthermore, for the enrichment-based protocols, any changes in the sequencing setup directly influence the DNA methylation readout, whereas in bisulfite-based protocols such changes influ-ence only the sequencing coverage but not the DNA methylation readout. Despite these drawbacks, MeDIP-seq and MBD-seq have been used in the context of EWAS (Supplementary Table 1) but at the cost of reduced robustness and the need for substantial investments into bioinformatic methods for normalization of data and removal of batch effects.
Batch effects are among the most common sources of spurious associations25, especially when using assays that involve reactions
sensitive to ambient conditions such as PCR. The negative conse-quences of batch effects can be avoided via careful study design. Balanced designs should be implemented: cases and controls should be equally distributed between chips, processing times and other known correlates of technical variation. Samples should be processed at the same time and under strictly standardized con-ditions; within this high-level stratification that ensures similar numbers of cases and controls per each batch, samples should be processed in random order to minimize the impact of unknown sources of batch effects.
Various quality-control criteria may be applied when generat-ing the data7. For DNA methylation techniques based on bisulfite-converted DNA, efficiency and completeness of conversion should be assessed. For arrays, we recommend setting aside ~10% of samples as internal control samples: duplicates or standards with known methylation (for example, 50% methylation; reproducibil-ity of 0% and 100% methylation is limited) within the same plate or batch to calculate coefficients of variation and across plates or batches to assess batch effects. Several analysis packages are available for quality assessment31.
With methods based on high-throughput sequencing, it is important to quantify the yield of reads, the percentage of reads aligning to the appropriate genome scaffold and the fold cover-age of the genome. With paired-end sequencing, we can deter-mine fragment-size distribution of the library, verify its intended range and assure sufficient homogeneity between samples. It is also important to account for SNPs during alignment.
Verify and validate results. Genome-wide assays are inherently imprecise and noisy. Standard technical verification procedures apply quantitative single locus–specific methylation techniques such as bisulfite (pyro)sequencing or mass spectrometry– based detection of bisulfite-treated DNA to the same samples used in the genome-wide assays. Conversely, biological valida-tion of EWAS findings is assessed by replicating the study results in comparable but distinct biological samples using a different technique, either a different epigenome-wide assay or a locus-specific methylation technique. Using a different technique in the validation study is essential because technical problems with the assay or inadequate statistical analysis methods may introduce the same bias in the original and in the validation sample set. If validation studies are successful, verification may not be nec-essary; however, before embarking in a time-consuming and expensive validation study, at least some verification is typically advisable to exclude technical errors such as cross-hybridizing probes or unrecognized SNPs.
Infer causation with caution. The goals of current EWAS are often exploratory, and the findings represent primarily associa-tion, not causation. When reporting an EWAS, the same rigorous standards of design, analysis and interpretation as for a GWAS need to be imposed to allow confidence in the results. Compared to GWAS, however, which are also association studies that do not readily infer causation, the hurdle is even higher for EWAS: although the germ-line genotype is typically unaltered by dis-ease, the epigenome can both affect and be affected by disease, often making the direction of causation obscure. A fundamental step toward inferences of causality is therefore the establishment of temporality.
npg
© 2
013
Nat
ure
Am
eric
a, In
c. A
ll rig
hts
rese
rved
.

nature methods | VOL.10 NO.10 | OctOber 2013 | 953
review
Establishing causation in EWAS will require the locus-specific introduction of epigenetic marks in combination with a func-tional readout, which remains technically challenging despite recent advances32,33. Alternatively, one can use pharmacological inhibition or genetic knowdown or knockout of epigenetic modi-fiers to dissect functional mechanisms, but the global nature of these interventions can make the results difficult to interpret.
Despite the inherent inability to conclusively prove causation, an EWAS design that excludes reverse causation, confounding, selection bias, misclassification and other types of biases will increase the likelihood of identifying causative associations. Validation in an independent data set will lend credence to any discoveries.
analysis and interpretation of ewas dataStatistical analysis: site-by-site analysis. The most elemen-tary analysis is to perform univariate tests of association, to identify sites where cytosine methylation varies with exposure and/or phenotype, followed by multiple-testing adjustments, for example, using the false discovery rate. In a typical analysis, mean levels of CpG methylation are compared across categories using, for example, linear regression34, which permits adjustment for possible confounders and batch effects35,36.
Statistical analysis: regional changes. Unlike the SNP data used in GWAS, DNA methylation levels are continuous when measured across a large number of cells. They are also more susceptible to measurement error, are more densely spaced across the genome and have more complicated correlation structures. Because the individual measurements from DNA methylation studies include more unwanted variability than in GWAS, application of standard GWAS techniques, including site-by-site analysis, may lead to underpowered analyses. Furthermore, analyses of single CpG sites are prone to SNP effects, errors resulting from bad microarray probes and outliers. However, as methylation levels are strongly correlated across the genome, power can be increased by ‘bor-rowing’ strength across adjacent measurements37. Furthermore, reported functionally relevant findings have generally been associated with genomic regions rather than single CpGs, either CpG islands, CpG island shores, genomic blocks or regions of 1,000 base pairs in length. Therefore, searches for association at the region level as opposed to the single-CpG-site level greatly
improve specificity. Researchers have proposed relevant analytic techniques for both microarray-based37 and sequencing-based38 methods. These techniques assume that true methylation pro-files are smooth; thus, biological events involving single CpG sites might not be detected using these procedures.
Statistical analysis: preclustering or grouping CpG sites. Langevin et al.39 have suggested the use of unsupervised clus-tering to create classes of CpG sites based on similarity of meth-ylation variation across specimens and to average methylation values within each class to construct data sets of radically reduced dimensionality, facilitating efficient tests of association between DNA methylation and phenotypes of interest. Unsupervised clus-tering approaches similar to those presented in Langevin et al.39 may be used to reduce the dimensionality of large data sets and take advantage of substantial biologically induced correlation. Although these methods may be helpful in providing efficient statistical tests of association between methylation patterns and phenotypes of interest, they will capture only crude associations and may miss specific CpG sites of interest.
Besides differences in mean methylation levels, differences in variation of DNA methylation across samples may also be biologi-cally meaningful40, motivating scans for differential variability between groups37,41.
Identifying relevant DMRs. DMR prioritization depends on a number of criteria (Table 1). The most widely used approach in GWAS to assessing statistical significance is computation of a P value for each SNP and control of the family-wise error rate, for which the Bonferroni correction is commonly used. This approach ignores effect sizes, which is particularly problematic in EWAS because tiny systematic biases can be introduced owing to, for example, technical batch effects or differences in tissue composi-tion. Another reason why an approach controlling the family-wise error rate is not the method of choice is our preference for using regions (regions or CpG clusters) as the unit for tests rather than single CpG sites. Because units are not defined a priori, the stand-ard GWAS approach is not applicable. Therefore, region-finding approaches define novel uncertainty assessments37. When one uses the regional or clustering approach to define tested units, the multiplicity problem does not necessarily grow with the number of measured CpG sites. Finally, the fact that EWAS are mostly
table 1 | Decision criteria for the identification of ‘driver’ methylation changes
Confidence that methylation difference mediates biological pathway
increase confidence decrease confidence
Statistical significance Reaches genome-wide significance Does not meet predefined significance threshold that takes into account multiple testing
Effect size (difference in methylation) Large (>10% difference) Small (<5% difference)Bias and confounding Bias and confounding are prevented by design or
controlled for in the analysesBias or uncontrolled confounding may exist and explain
the differences observedGenomic location Differential methylation is in a region that may
impact regulation of transcriptionCurrent knowledge cannot explain the influence of the
observed difference in methylation at that locus on regulation of transcription
Functional relevance Affects expression Does not affect expressionBiological relevance Gene codes for known biological function Biological relevance of DMR location unknown or
unrelated to phenotypeValidation Findings are replicated in an independent human
cohort or animal model using a different techniqueNo validation of results attempted or results are not
replicated in a validation study
npg
© 2
013
Nat
ure
Am
eric
a, In
c. A
ll rig
hts
rese
rved
.

954 | VOL.10 NO.10 | OctOber 2013 | nature methods
review
used as exploratory analyses, minimizing family-wise error rate is far too conservative because it minimizes the probability of any false positive result. But if we are interested in discovery, some false positives may be acceptable and using false discovery rates is more appropriate42.
Obtaining extremely small P values is possible even when effect sizes are small. Effect size should be evaluated in the context of functional and biological relevance. For example, is a methyla-tion difference of 1% large enough to have an impact on disease initiation or promotion?
A bias in the study design such as confounding has to be excluded as a possible explanation of any observed association. We recommend to record as many confounding variables as pos-sible (for example, age, sex or ethnic background but also aspects related to sample handling) and to account for these covariates in design or analysis.
The location within a CpG island or shore, within the promoter region, and distance from the transcription start site may be rel-evant, especially when we assume that DNA methylation associ-ated with a phenotype acts by regulating gene transcription.
Aberrant methylation affecting regions of CpG sites or one or few CpG sites can introduce functional changes at the gene regu-lation level (for example, through altering the specific binding of transcription factors or via more complex regulatory mecha-nisms such as insulation-chromosome looping events43–45). Hypermethylation more likely silences transcription, whereas hypomethylation is permissive of transcription; additionally, other mechanisms such as chromatic structure and nucleosome positioning affect expression. Even if a DMR does not impact transcription and gene expression, it may have some other yet unknown effect or serve as a marker of the exposure (for example, maintaining a memory of exposure over lifetime) or outcome (for example, biomarker of disease) of interest.
The biologic function of the gene may provide additional clues about the potential role of the DMR as a ‘driver’ or ‘passenger’ change. Replicating findings in an independent sample set may move discoveries from the exploratory to a confirmatory stage.
How these individual criteria are combined into a single con-sensus ranking may depend on how much weight a researcher assigns to each dimension. However, it is of utmost importance that selection criteria and their ranking are stipulated up front in an analysis plan, rather than in the form of a post hoc analysis.
Functional and gene set enrichment analyses. The statistical assessment of enrichment or depletion of functional properties can help identify relevant biological mechanisms. In gene expres-sion analysis, an enrichment analysis is typically performed based on manually curated ontologies of gene function (such as Gene Ontology46), pathways (such as Kyoto Encyclopedia of Genes and Genomes47) and increasingly also based on gene sets that have been collected using large-scale experiments. Numerous bioinformatics tools have been developed for performing such enrichment analyses48,49. To apply these tools to DMR data, it is necessary to map regions to genes, which is often performed using hard-wired thresholds, for example, by specifying the maximum distance between the DMR and a gene promoter that is potentially regulated by this DMR. Such basic methods work well for small distances, but for larger distances a more sophisticated approach has been implemented in the GREAT tool50. Independent of the
mapping strategy, gene-based enrichment analysis typically gives rise to much weaker (and often insignificant) enrichment scores compared to a gene expression analysis in a study of phenotypic differences29. Enrichment analysis based on genomic region has thus been suggested as a complementary approach and confers substantial interpretive potential even when a gene-based enrich-ment analysis does not yield any relevant results29. DMRs are compared to a catalog of genomic regions including, for example, sites enriched for specific chromatin modifications or transcrip-tion factor binding sites. Furthermore, tools have been developed for assessing differences in the genomic composition, evolution-ary conservation and distribution of predicted regulatory regions (EpiGRAPH51) as well as for discovering significantly enriched binding motifs (MEME52) and exploring such differences on a genome-wide scale (EpiExplorer33). It is essential that an appro-priate control group is used, comprising all genes or genomic regions that would have had the chance to be detected as DMRs but were not, which can be highly dependent on the DNA meth-ylation assay that is used.
Note: Any Supplementary Information and Source Data files are available in the online version of the paper.
aCknowledgmentsWe are grateful to the Radcliffe Institute for Advanced Study at Harvard University for providing support for the workshop “Challenges of Epigenome-wide Association Studies—Optimizing Analytic Methods to Identify Important DNA Methylation Marks” held in Cambridge, Massachusetts, USA, on 3–5 June, 2012.
ComPeting FinanCial interestsThe authors declare competing financial interests: details are available in the online version of the paper.
reprints and permissions information is available online at http://www.nature.com/reprints/index.html.
1. McCarthy, M.I. et al. Genome-wide association studies for complex traits: consensus, uncertainty and challenges. Nat. Rev. Genet. 9, 356–369 (2008).
2. Bernstein, B.E. et al. The NIH Roadmap Epigenomics Mapping Consortium. Nat. Biotechnol. 28, 1045–1048 (2010).
3. Satterlee, J.S., Schubeler, D. & Ng, H.H. Tackling the epigenome: challenges and opportunities for collaboration. Nat. Biotechnol. 28, 1039–1044 (2010).
4. Adams, D. et al. BLUEPRINT to decode the epigenetic signature written in blood. Nat. Biotechnol. 30, 224–226 (2012).
5. Bock, C. et al. Quantitative comparison of genome-wide DNA methylation mapping technologies. Nat. Biotechnol. 28, 1106–1114 (2010).
6. Harris, R.A. et al. Comparison of sequencing-based methods to profile DNA methylation and identification of monoallelic epigenetic modifications. Nat. Biotechnol. 28, 1097–1105 (2010).
7. Bock, C. Analysing and interpreting DNA methylation data. Nat. Rev. Genet. 13, 705–719 (2012). this paper provides a comprehensive review of the computational methods and available software tools for the analysis of dna methylation data.
8. Hansen, K.D., Wu, Z., Irizarry, R.A. & Leek, J.T. Sequencing technology does not eliminate biological variability. Nat. Biotechnol. 29, 572–573 (2011).
9. Jaffe, A.E., Feinberg, A.P., Irizarry, R.A. & Leek, J.T. Significance analysis and statistical dissection of variably methylated regions. Biostatistics 13, 166–178 (2012).
10. Bibikova, M. et al. High-throughput DNA methylation profiling using universal bead arrays. Genome Res. 16, 383–393 (2006).
11. Michels, K.B. Epigenetic Epidemiology (Springer, 2012). this is the first textbook on epigenetic epidemiology providing guidance to epidemiologists and epigeneticists alike how to design, conduct and analyze an epigenetic epidemiology study.
12. Mill, J. & Heijmans, B.T. From promises to practical strategies in epigenetic epidemiology. Nat. Rev. Genet. 14, 585–594 (2013).
npg
© 2
013
Nat
ure
Am
eric
a, In
c. A
ll rig
hts
rese
rved
.
nature methods | VOL.10 NO.10 | OctOber 2013 | 955
review
13. Rakyan, V.K., Down, T.A., Balding, D.J. & Beck, S. Epigenome-wide association studies for common human diseases. Nat. Rev. Genet. 12, 529–541 (2011).
14. Silviera, M.L., Smith, B.P., Powell, J. & Sapienza, C. Epigenetic differences in normal colon mucosa of cancer patients suggest altered dietary metabolic pathways. Cancer Prev. Res. (Phila.) 5, 374–384 (2012).
15. Houseman, E.A. et al. DNA methylation arrays as surrogate measures of cell mixture distribution. BMC Bioinformatics 13, 86 (2012). this paper describes a new method to statistically adjust for the cell mixture distribution of blood cells using dna methylation marks.
16. Reinius, L.E. et al. Differential DNA methylation in purified human blood cells: implications for cell lineage and studies on disease susceptibility. PLoS ONE 7, e41361 (2012).
17. Koestler, D.C. et al. Peripheral blood immune cell methylation profiles are associated with nonhematopoietic cancers. Cancer Epidemiol. Biomarkers Prev. 21, 1293–1302 (2012).
18. Abbas, A.R., Wolslegel, K., Seshasayee, D., Modrusan, Z. & Clark, H.F. Deconvolution of blood microarray data identifies cellular activation patterns in systemic lupus erythematosus. PLoS ONE 4, e6098 (2009).
19. Liu, Y. et al. Epigenome-wide association data implicate DNA methylation as an intermediary of genetic risk in rheumatoid arthritis. Nat. Biotechnol. 31, 142–147 (2013).
20. Saferali, A. et al. Cell culture-induced aberrant methylation of the imprinted IG DMR in human lymphoblastoid cell lines. Epigenetics 5, 50–60 (2010).
21. Sugawara, H. et al. Comprehensive DNA methylation analysis of human peripheral blood leukocytes and lymphoblastoid cell lines. Epigenetics 6, 508–515 (2011).
22. Caliskan, M., Cusanovich, D.A., Ober, C. & Gilad, Y. The effects of EBV transformation on gene expression levels and methylation profiles. Hum. Mol. Genet. 20, 1643–1652 (2011).
23. Michels, K.B. The promises and challenges of epigenetic epidemiology. Exp. Gerontol. 45, 297–301 (2010).
24. Teschendorff, A.E., Zhuang, J. & Widschwendter, M. Independent surrogate variable analysis to deconvolve confounding factors in large-scale microarray profiling studies. Bioinformatics 27, 1496–1505 (2011).
25. Leek, J.T. et al. Tackling the widespread and critical impact of batch effects in high-throughput data. Nat. Rev. Genet. 11, 733–739 (2010).
26. Dedeurwaerder, S. et al. Evaluation of the Infinium Methylation 450K technology. Epigenomics 3, 771–784 (2011). this paper provides an in-depth discussion of the 450k infinium microarray technology for dna methylation.
27. Smith, Z.D. et al. A unique regulatory phase of DNA methylation in the early mammalian embryo. Nature 484, 339–344 (2012).
28. Boyle, P. et al. Gel-free multiplexed reduced representation bisulfite sequencing for large-scale DNA methylation profiling. Genome Biol. 13, R92 (2012). this paper describes the methods for the multiplex adaptation of rrBs for dna methylation.
29. Bock, C. et al. DNA methylation dynamics during in vivo differentiation of blood and skin stem cells. Mol. Cell 47, 633–647 (2012).
30. Liu, Y., Siegmund, K.D., Laird, P.W. & Berman, B.P. Bis-SNP: combined DNA methylation and SNP calling for Bisulfite-seq data. Genome Biol. 13, R61 (2012).
31. Du, P., Kibbe, W.A. & Lin, S.M. lumi: a pipeline for processing Illumina microarray. Bioinformatics 24, 1547–1548 (2008).
32. Goecks, J., Nekrutenko, A. & Taylor, J. Galaxy: a comprehensive approach for supporting accessible, reproducible, and transparent computational research in the life sciences. Genome Biol. 11, R86 (2010).
33. Halachev, K., Bast, H., Albrecht, F., Lengauer, T. & Bock, C. EpiExplorer: live exploration and global analysis of large epigenomic datasets. Genome Biol. 13, R96 (2012).
34. Smyth, G.K. Linear models and empirical bayes methods for assessing differential expression in microarray experiments. Stat. Appl. Genet. Mol. Biol. 3, 3 (2004).
35. Akey, J.M., Biswas, S., Leek, J.T. & Storey, J.D. On the design and analysis of gene expression studies in human populations. Nat. Genet. 39, 807–808; author reply 808–809 (2007).
36. Johnson, W.E., Li, C. & Rabinovic, A. Adjusting batch effects in microarray expression data using empirical Bayes methods. Biostatistics 8, 118–127 (2007).
37. Jaffe, A.E. et al. Bump hunting to identify differentially methylated regions in epigenetic epidemiology studies. Int. J. Epidemiol. 41, 200–209 (2012). in this paper the authors suggest a new computational method for detecting differently methylated regions based on a techniques that borrows statistical power from adjacent locations to produce estimates that are substantially more precise than single-locus methods.
38. Hansen, K.D., Langmead, B. & Irizarry, R.A. BSmooth: from whole genome bisulfite sequencing reads to differentially methylated regions. Genome Biol. 13, R83 (2012).
39. Langevin, S.M. et al. The influence of aging, environmental exposures and local sequence features on the variation of DNA methylation in blood. Epigenetics 6, 908–919 (2011).
40. Feinberg, A.P. & Irizarry, R.A. Evolution in health and medicine Sackler colloquium: stochastic epigenetic variation as a driving force of development, evolutionary adaptation, and disease. Proc. Natl. Acad. Sci. USA 107 (suppl. 1), 1757–1764 (2010). this paper was the first to propose that genetic changes can drive epigenetic variability and argues that we should search for differential variability between groups, not just average shifts.
41. Teschendorff, A.E. & Widschwendter, M. Differential variability improves the identification of cancer risk markers in DNA methylation studies profiling precursor cancer lesions. Bioinformatics 28, 1487–1494 (2012).
42. Storey, J.D. & Tibshirani, R. Statistical significance for genomewide studies. Proc. Natl. Acad. Sci. USA 100, 9440–9445 (2003).
43. Xu, J. et al. Pioneer factor interactions and unmethylated CpG dinucleotides mark silent tissue-specific enhancers in embryonic stem cells. Proc. Natl. Acad. Sci. USA 104, 12377–12382 (2007).
44. Nativio, R. et al. Disruption of genomic neighbourhood at the imprinted IGF2–H19 locus in Beckwith-Wiedemann syndrome and Silver-Russell syndrome. Hum. Mol. Genet. 20, 1363–1374 (2011).
45. Gibney, E.R. & Nolan, C.M. Epigenetics and gene expression. Heredity 105, 4–13 (2010).
46. Ashburner, M. et al. Gene ontology: tool for the unification of biology. The Gene Ontology Consortium. Nat. Genet. 25, 25–29 (2000).
47. Kanehisa, M. & Goto, S. KEGG: Kyoto encyclopedia of genes and genomes. Nucleic Acids Res. 28, 27–30 (2000).
48. Huang da, W. et al. DAVID Bioinformatics Resources: expanded annotation database and novel algorithms to better extract biology from large gene lists. Nucleic Acids Res. 35, W169–W175 (2007).
49. Subramanian, A. et al. Gene set enrichment analysis: a knowledge-based approach for interpreting genome-wide expression profiles. Proc. Natl. Acad. Sci. USA 102, 15545–15550 (2005).
50. McLean, C.Y. et al. GREAT improves functional interpretation of cis-regulatory regions. Nat. Biotechnol. 28, 495–501 (2010).
51. Bock, C., Halachev, K., Buch, J. & Lengauer, T. EpiGRAPH: user-friendly software for statistical analysis and prediction of (epi)genomic data. Genome Biol. 10, R14 (2009).
52. Bailey, T.L. et al. MEME SUITE: tools for motif discovery and searching. Nucleic Acids Res. 37, W202–W208 (2009).
npg
© 2
013
Nat
ure
Am
eric
a, In
c. A
ll rig
hts
rese
rved
.