Embed Size (px)
Citation preview

Recommended Standards and Guidance forPerformance, Application, Design, and Operation &
Maintenance
Proprietary Distribution Technologies For Trenches, Seepage Beds, At-grades and Mounds
December 12, 2008 Technical Advisory Panel Meeting
Dick Bachelder, ADS/HancorBen Berteau, Ring Industrial GroupPeder Larson, Larkin Hoffman Daly & Lindgren Ltd.Carl Thompson, P.E., Infiltrator Systems, Inc.
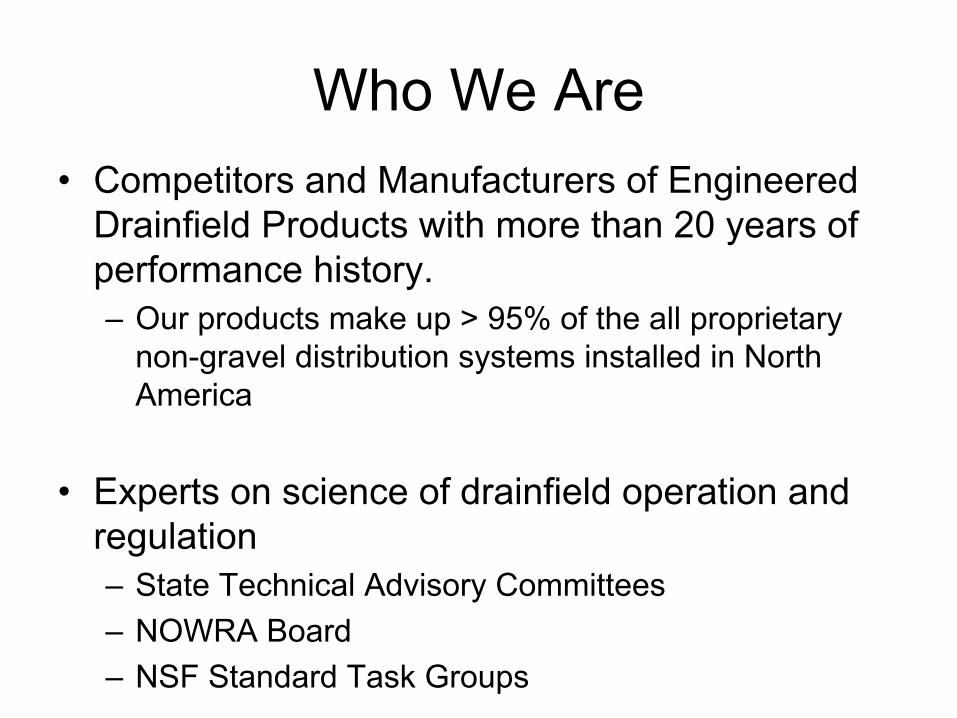
Who We Are•
Competitors and Manufacturers of Engineered Drainfield Products with more than 20 years of performance history.–
Our products make up > 95% of the all proprietary non-gravel distribution systems installed in North America
•
Experts on science of drainfield operation and regulation–
State Technical Advisory Committees
–
NOWRA Board–
NSF Standard Task Groups
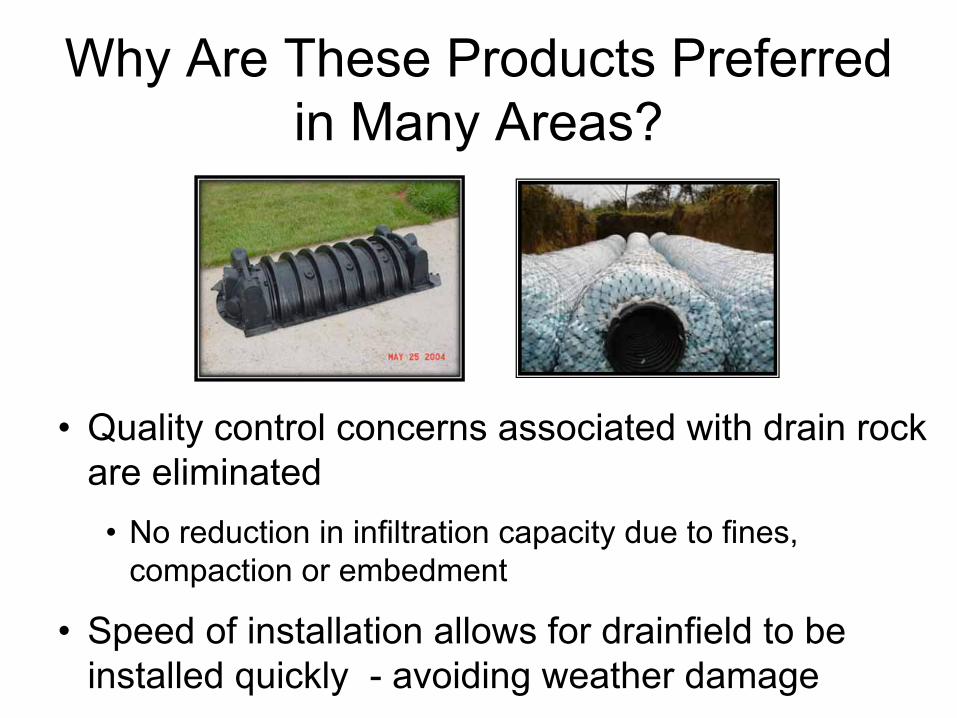
Why Are These Products Preferred in Many Areas?
•
Quality control concerns associated with drain rock are eliminated
•
No reduction in infiltration capacity due to fines, compaction or embedment
•
Speed of installation allows for drainfield
to be installed quickly -
avoiding weather damage
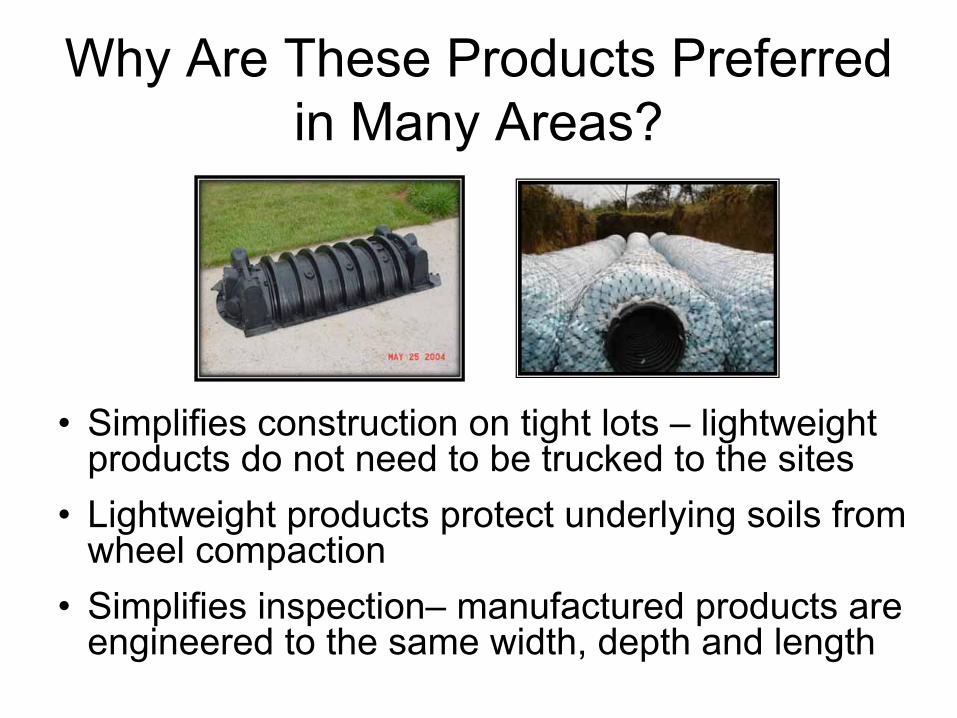
Why Are These Products Preferred in Many Areas?
•
Simplifies construction on tight lots –
lightweight products do not need to be trucked to the sites
•
Lightweight products protect underlying soils from wheel compaction
•
Simplifies inspection–
manufactured products are engineered to the same width, depth and length
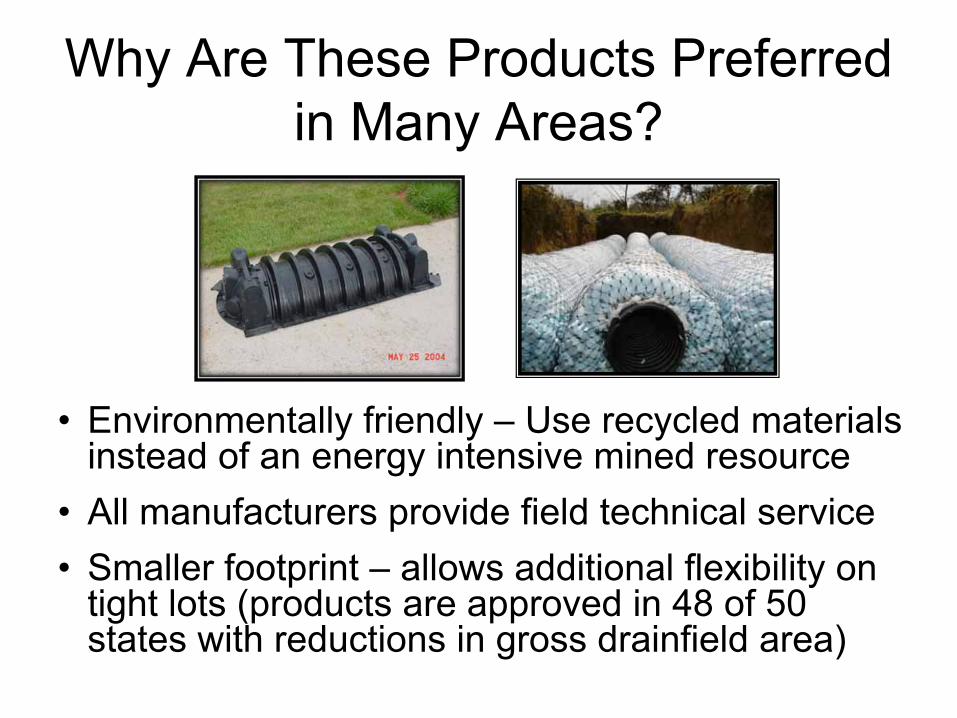
Why Are These Products Preferred in Many Areas?
•
Environmentally friendly –
Use recycled materials instead of an energy intensive mined resource
•
All manufacturers provide field technical service•
Smaller footprint –
allows additional flexibility on
tight lots (products are approved in 48 of 50 states with reductions in gross drainfield
area)
[Drain Rock] Installation and Quality Control Considerations
These are eliminated when a non-gravel system is used
•
When placing drain rock into an excavation, the installer shall ensure that drainfield rock is of suitable quality and placed into the excavation in a fashion that maintains the infiltrative surface of the soil.
•
The installer shall verify the quality of drainfield rock at the
pit and/or when delivered to the site to ensure it meets required specifications.
•
If the quality of the gravel washing process is poor, the silt particles remaining on the surface of the drain rock will likely washed when the system is loaded with effluent. This could result in a layer of fines (clay and silt) that would accumulate at the infiltrative surface, thereby reducing infiltrative capacity.
[Drain Rock] Installation and Quality Control Considerations
These are eliminated when a non-gravel system is used
•
If the drainfield rock is ‘mishandled’ on site, it can become contaminated with grass, soil and other materials and debris when drainfield rock is moved with heavy equipment.
•
The pit operator and installer can follow some simple Best Management Practices when loading and moving the drainfield rock so it remains clean and will not become contaminated with fines, silt and clay clods, and other undesirable materials.
[Drain Rock] Installation and Quality Control Considerations
These are eliminated when a non-gravel system is used
•
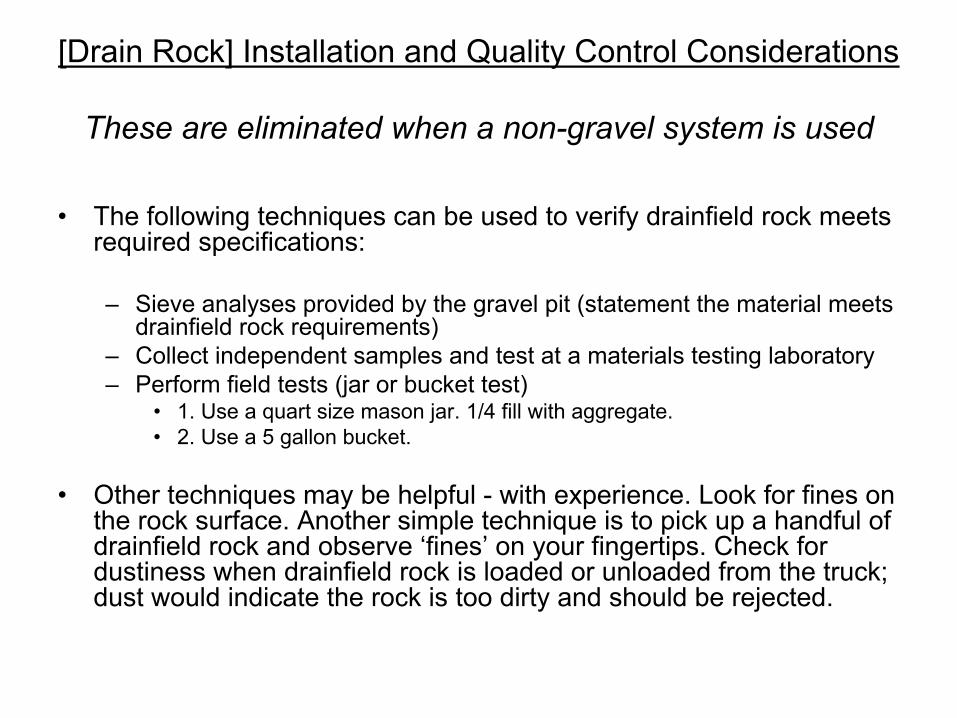
The following techniques can be used to verify drainfield rock meets required specifications:
–
Sieve analyses provided by the gravel pit (statement the material meets drainfield rock requirements)
–
Collect independent samples and test at a materials testing laboratory–
Perform field tests (jar or bucket test) •
1. Use a quart size mason jar. 1/4 fill with aggregate. •
2. Use a 5 gallon bucket.
•
Other techniques may be helpful -
with experience. Look for fines on the rock surface. Another simple technique is to pick up a handful of drainfield rock and observe ‘fines’ on your fingertips. Check for dustiness when drainfield rock is loaded or unloaded from the truck; dust would indicate the rock is too dirty and should be rejected.
How Our Products Are Used
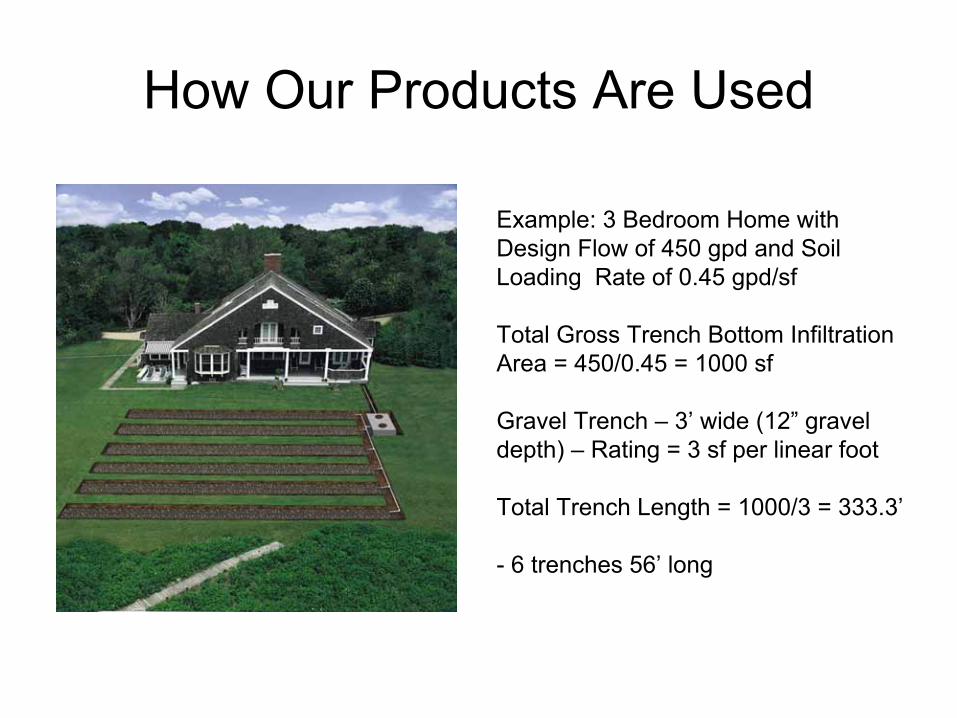
Example: 3 Bedroom Home with Design Flow of 450 gpd and Soil Loading Rate of 0.45 gpd/sf
Total Gross Trench Bottom Infiltration Area = 450/0.45 = 1000 sf
Gravel Trench –
3’ wide (12” gravel depth) –
Rating = 3 sf per linear foot
Total Trench Length = 1000/3 = 333.3’
-
6 trenches 56’ long
How Our Products Are Used
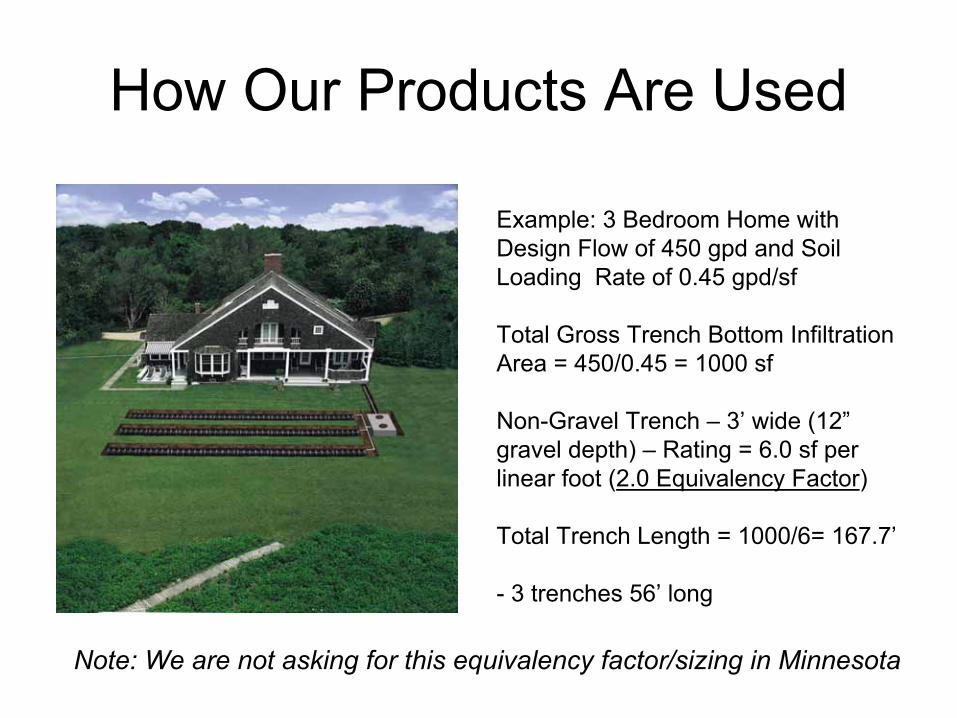
Example: 3 Bedroom Home with Design Flow of 450 gpd and Soil Loading Rate of 0.45 gpd/sf
Total Gross Trench Bottom Infiltration Area = 450/0.45 = 1000 sf
Non-Gravel Trench –
3’ wide (12” gravel depth) –
Rating = 6.0 sf per linear foot (2.0 Equivalency Factor)
Total Trench Length = 1000/6= 167.7’
-
3 trenches 56’ long
Note: We are not asking for this equivalency factor/sizing in Minnesota
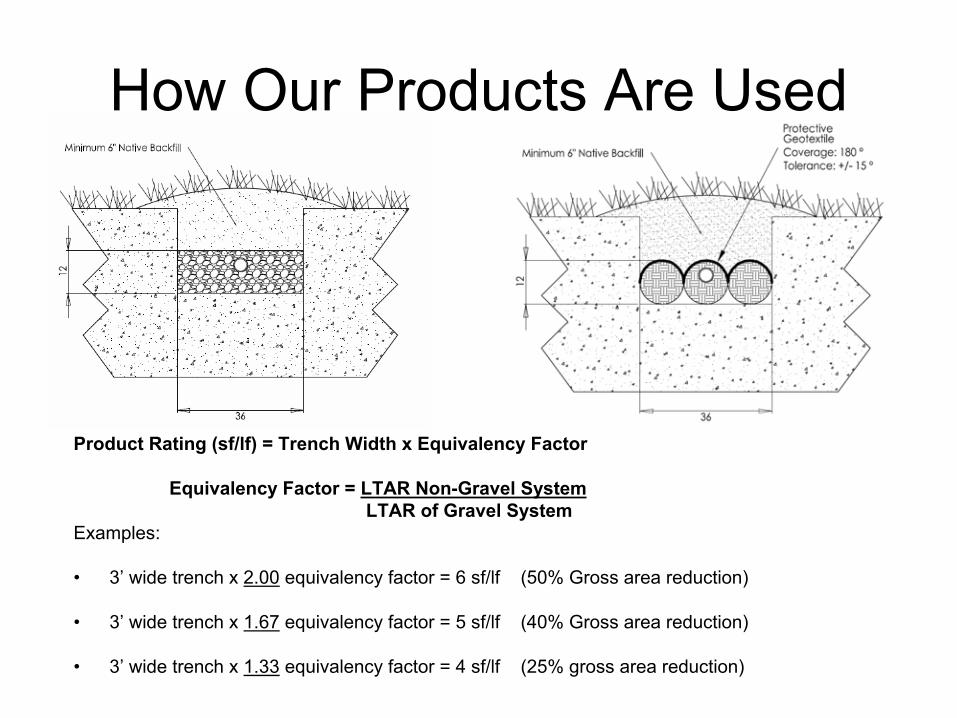
Product Rating (sf/lf) = Trench Width x Equivalency Factor
Equivalency Factor = LTAR Non-Gravel SystemLTAR of Gravel System
Examples:
•
3’ wide trench x 2.00
equivalency factor = 6 sf/lf (50% Gross area reduction)
•
3’ wide trench x 1.67
equivalency factor = 5 sf/lf (40% Gross area reduction)
•
3’ wide trench x 1.33
equivalency factor = 4 sf/lf (25% gross area reduction)
How Our Products Are Used
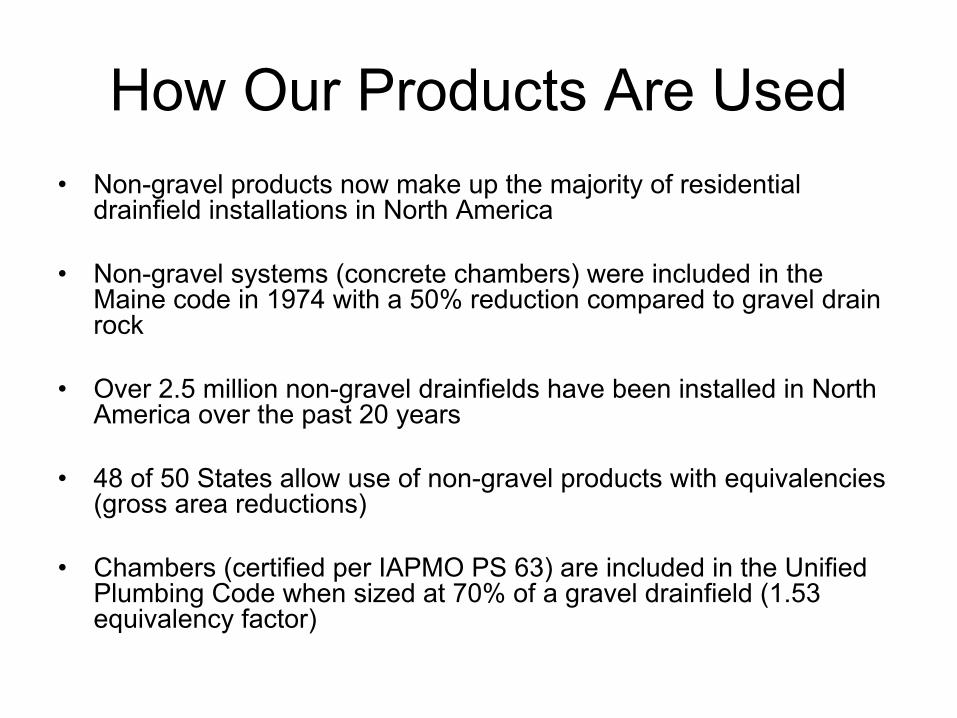
How Our Products Are Used•
Non-gravel products now make up the majority of residential drainfield installations in North America
•
Non-gravel systems (concrete chambers) were included in the Maine code in 1974 with a 50% reduction compared to gravel drain
rock
•
Over 2.5 million non-gravel drainfields have been installed in North America over the past 20 years
•
48 of 50 States allow use of non-gravel products with equivalencies (gross area reductions)
•
Chambers (certified per IAPMO PS 63) are included in the Unified
Plumbing Code when sized at 70% of a gravel drainfield (1.53 equivalency factor)
MN History
•
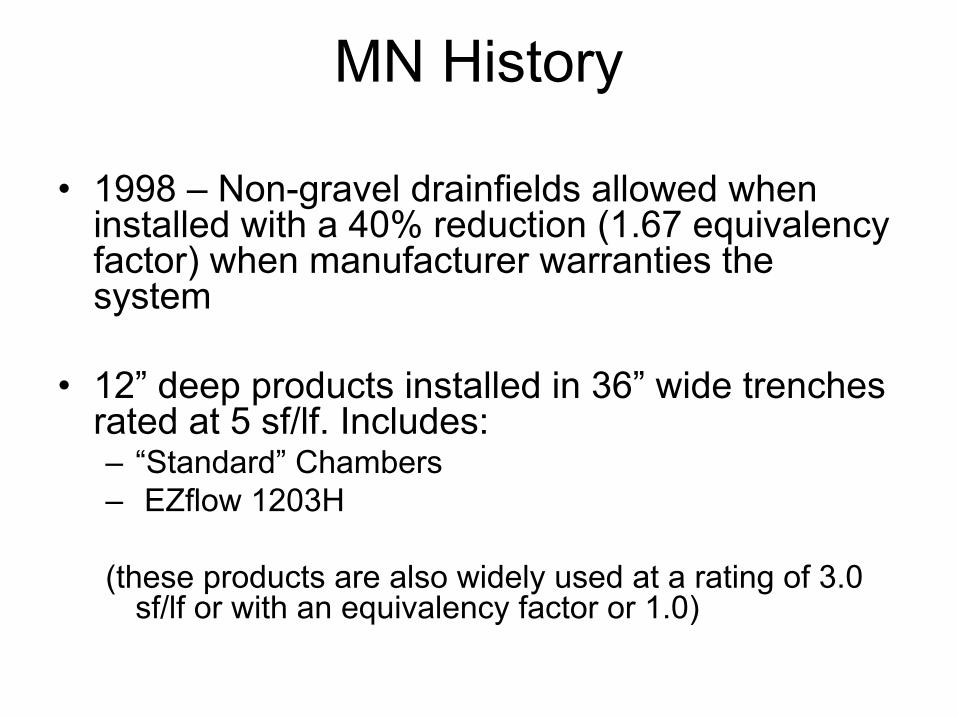
1998 –
Non-gravel drainfields allowed when installed with a 40% reduction (1.67 equivalency factor) when manufacturer warranties the system
•
12” deep products installed in 36” wide trenches rated at 5 sf/lf. Includes:–
“Standard” Chambers
–
EZflow 1203H
(these products are also widely used at a rating of 3.0 sf/lf or with an equivalency factor or 1.0)
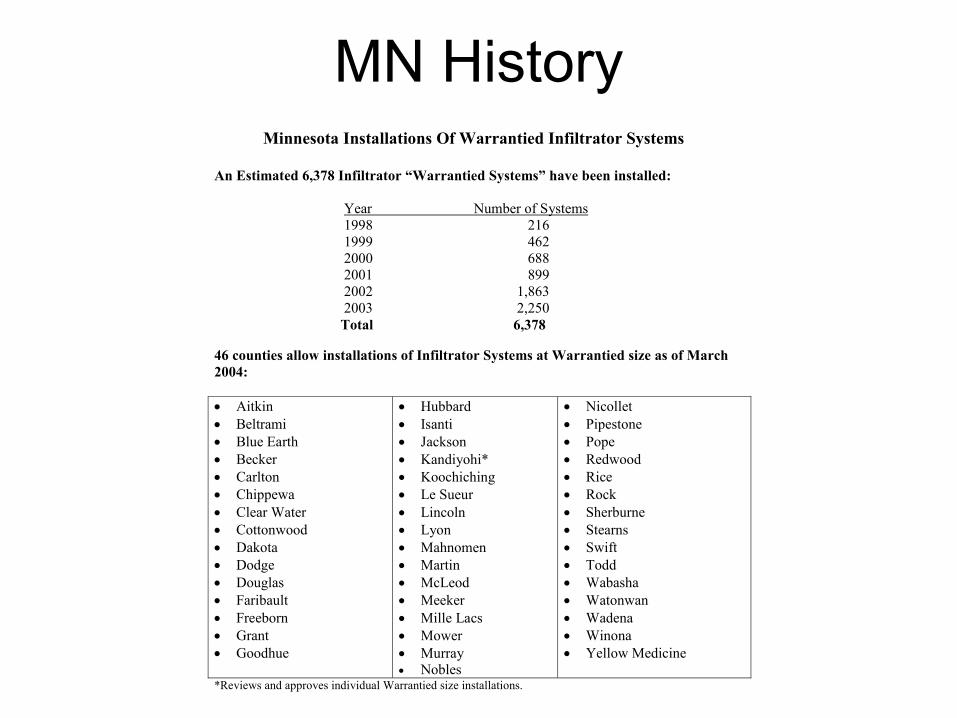
MN HistoryMinnesota Installations Of Warrantied Infiltrator Systems
An Estimated 6,378 Infiltrator “Warrantied Systems” have been installed:
Year Number of Systems 1998 216 1999 462 2000 688 2001 899 2002 1,863 2003 2,250
Total 6,378 46 counties allow installations of Infiltrator Systems at Warrantied size as of March 2004: • Aitkin • Beltrami • Blue Earth • Becker • Carlton • Chippewa • Clear Water • Cottonwood • Dakota • Dodge • Douglas • Faribault • Freeborn • Grant • Goodhue
• Hubbard • Isanti • Jackson • Kandiyohi* • Koochiching • Le Sueur • Lincoln • Lyon • Mahnomen • Martin • McLeod • Meeker • Mille Lacs • Mower • Murray • Nobles
• Nicollet • Pipestone • Pope • Redwood • Rice • Rock • Sherburne • Stearns • Swift • Todd • Wabasha • Watonwan • Wadena • Winona • Yellow Medicine
*Reviews and approves individual Warrantied size installations.
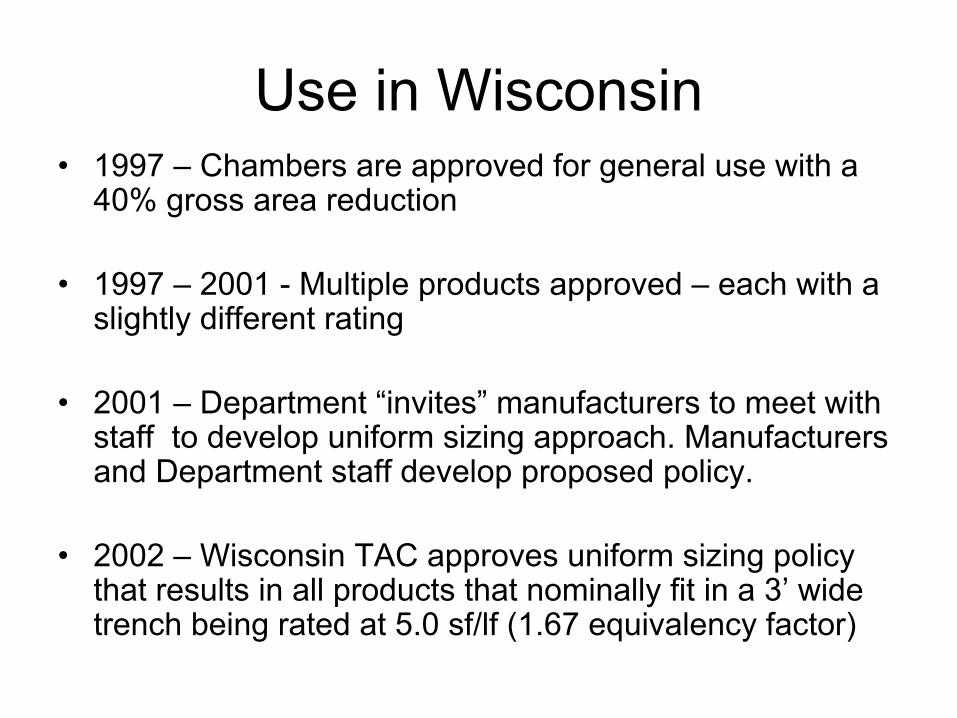
Use in Wisconsin•
1997 –
Chambers are approved for general use with a
40% gross area reduction
•
1997 –
2001 -
Multiple products approved –
each with a slightly different rating
•
2001 –
Department “invites” manufacturers to meet with staff to develop uniform sizing approach. Manufacturers and Department staff develop proposed policy.
•
2002 –
Wisconsin TAC approves uniform sizing policy that results in all products that nominally fit in a 3’ wide trench being rated at 5.0 sf/lf (1.67 equivalency factor)
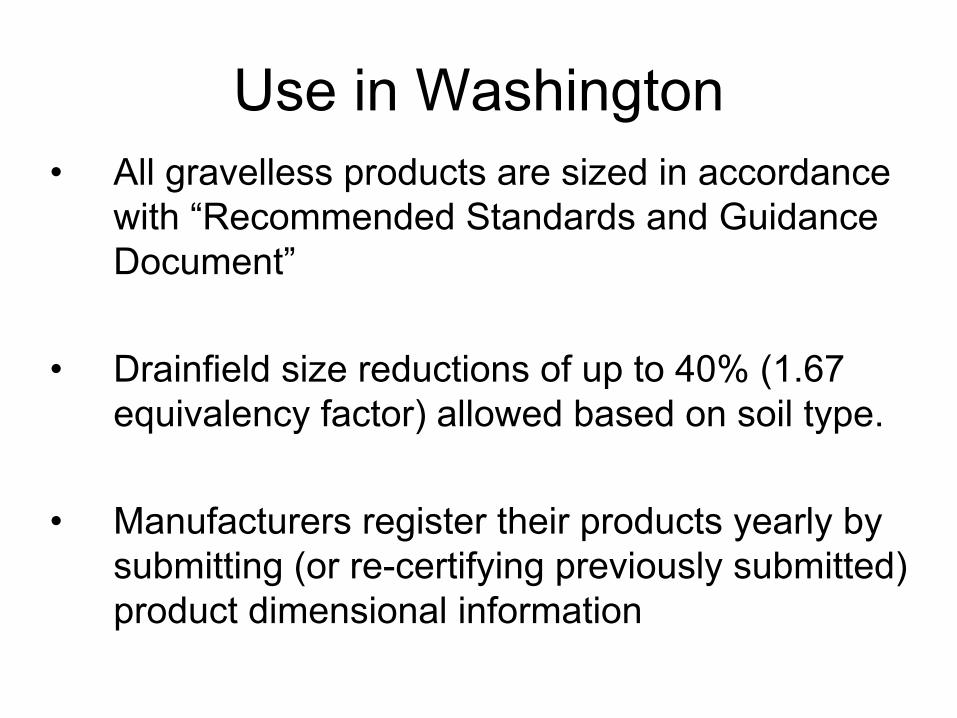
Use in Washington•
All gravelless products are sized in accordance with “Recommended Standards and Guidance Document”
• Drainfield size reductions of up to 40% (1.67 equivalency factor) allowed based on soil type.
• Manufacturers register their products yearly by submitting (or re-certifying previously submitted) product dimensional information
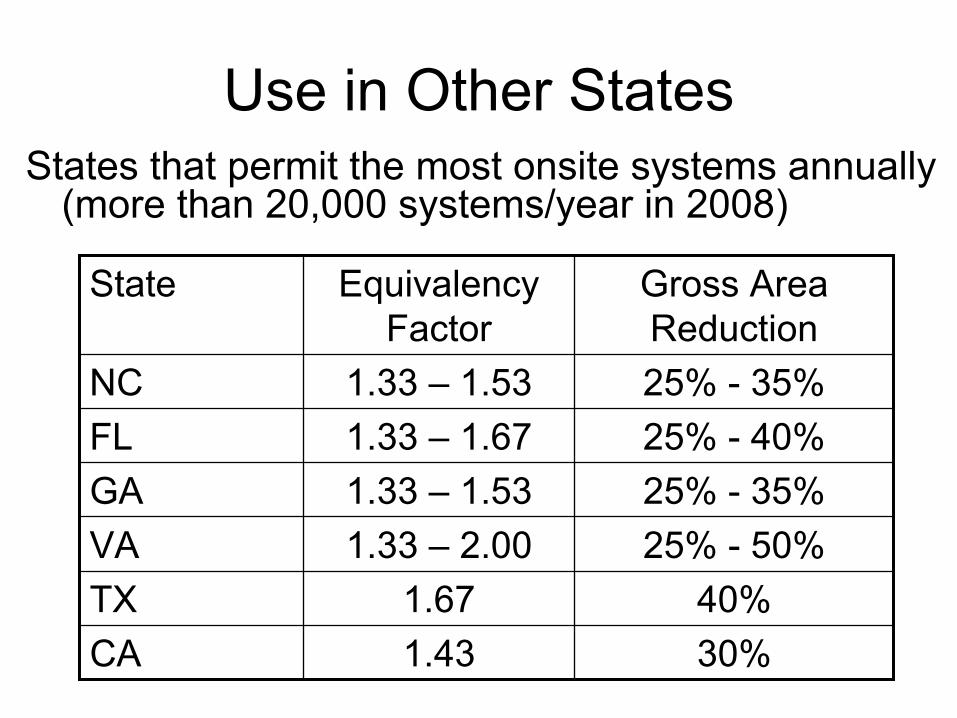
Use in Other StatesStates that permit the most onsite systems annually
(more than 20,000 systems/year in 2008)
State Equivalency Factor
Gross Area Reduction
NC 1.33 –
1.53 25% -
35%FL 1.33 –
1.67 25% -
40%
GA 1.33 –
1.53 25% -
35%VA 1.33 –
2.00 25% -
50%
TX 1.67 40%CA 1.43 30%
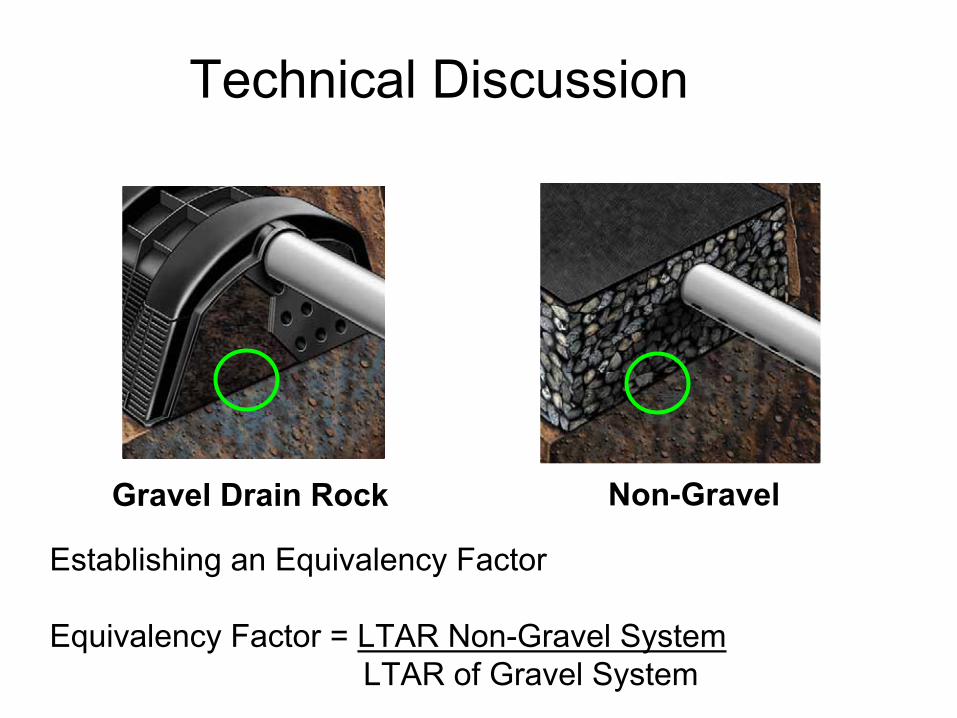
Gravel Drain Rock Non-Gravel
Technical Discussion
Establishing an Equivalency Factor
Equivalency Factor = LTAR Non-Gravel SystemLTAR of Gravel System
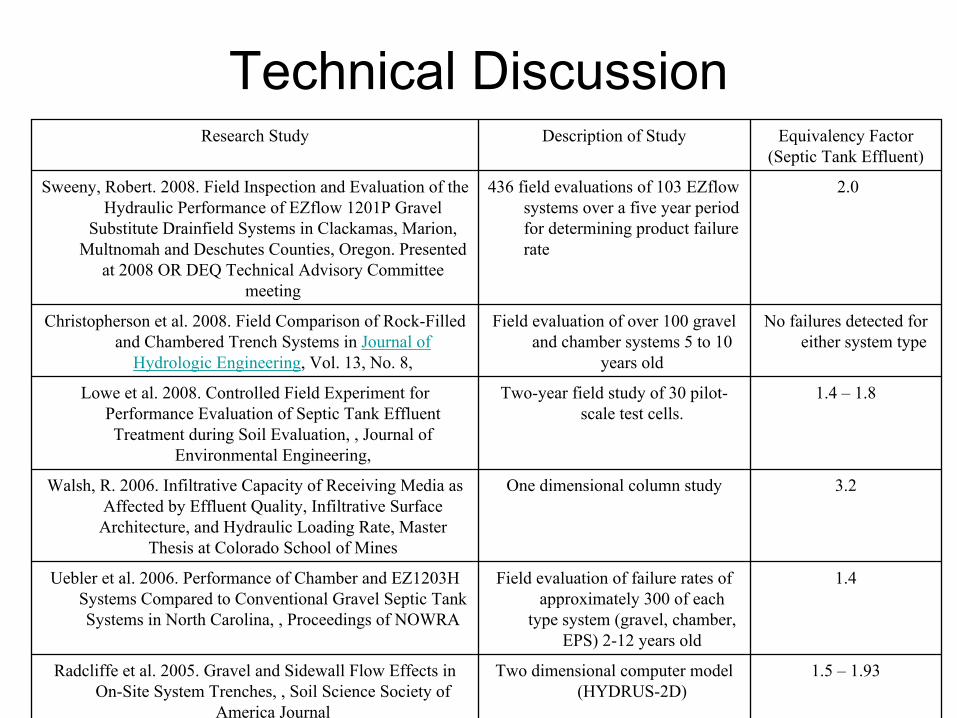
Technical DiscussionResearch Study Description of Study Equivalency Factor
(Septic Tank Effluent)
Sweeny, Robert. 2008. Field Inspection and Evaluation of the Hydraulic Performance of EZflow 1201P Gravel
Substitute Drainfield Systems in Clackamas, Marion, Multnomah and Deschutes Counties, Oregon. Presented
at 2008 OR DEQ Technical Advisory Committee meeting
436 field evaluations of 103 EZflow systems over a five year period for determining product failure rate
2.0
Christopherson et al. 2008. Field Comparison of Rock-Filled and Chambered Trench Systems in Journal of
Hydrologic Engineering, Vol. 13, No. 8,
Field evaluation of over 100 gravel and chamber systems 5 to 10
years old
No failures detected for either system type
Lowe et al. 2008. Controlled Field Experiment for Performance Evaluation of Septic Tank Effluent Treatment during Soil Evaluation, , Journal of
Environmental Engineering,
Two-year field study of 30 pilot-
scale test cells.
1.4 –
1.8
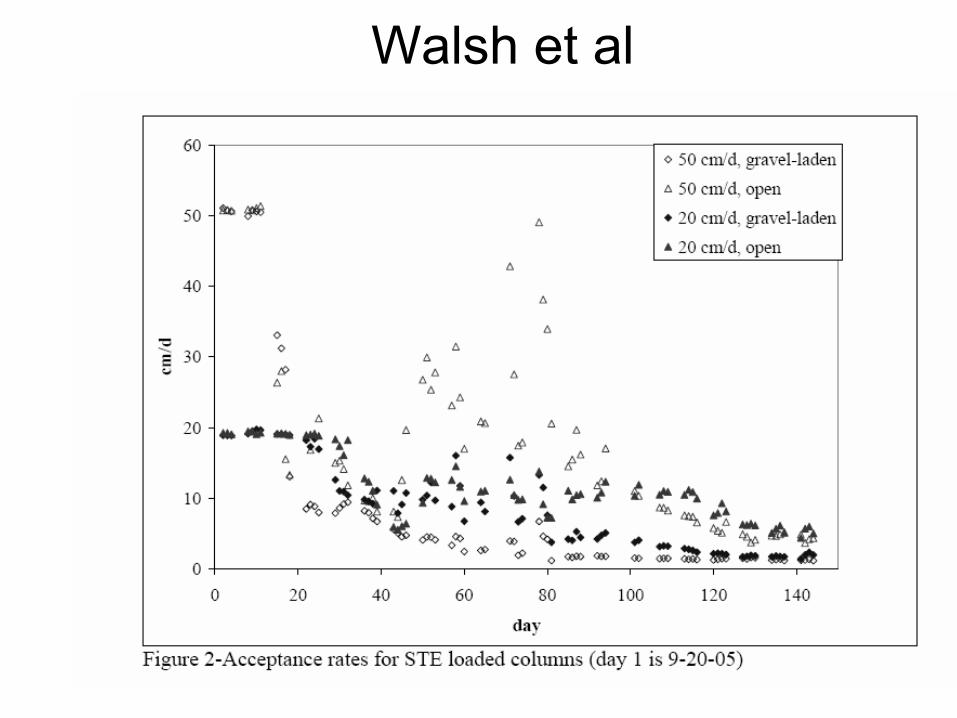
Walsh, R. 2006. Infiltrative Capacity of Receiving Media as Affected by Effluent Quality, Infiltrative Surface Architecture, and Hydraulic Loading Rate, Master
Thesis at Colorado School of Mines
One dimensional column study 3.2
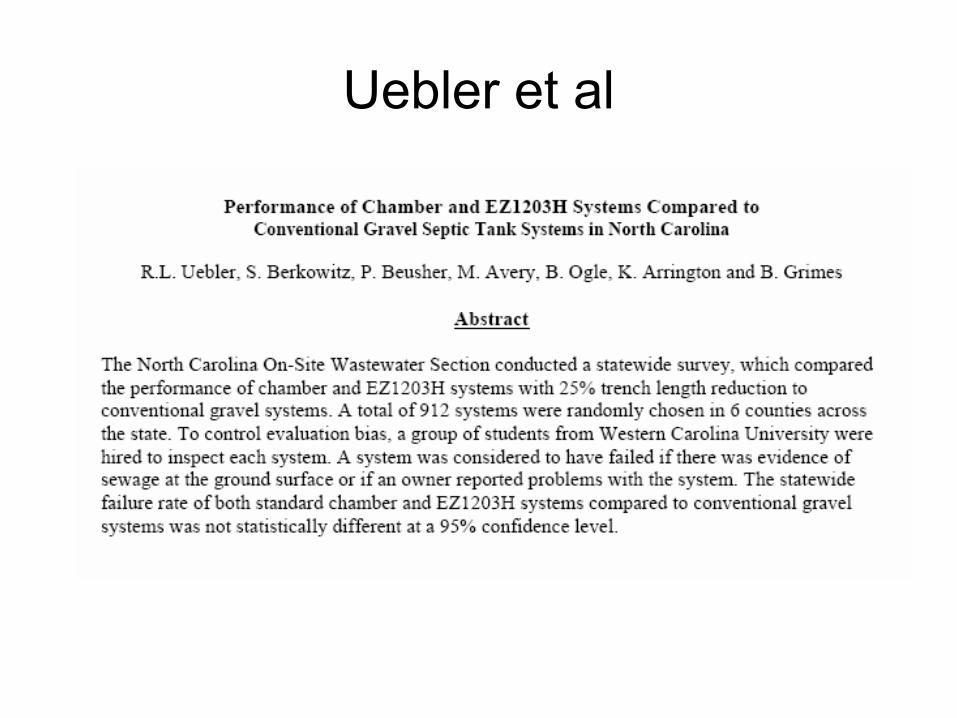
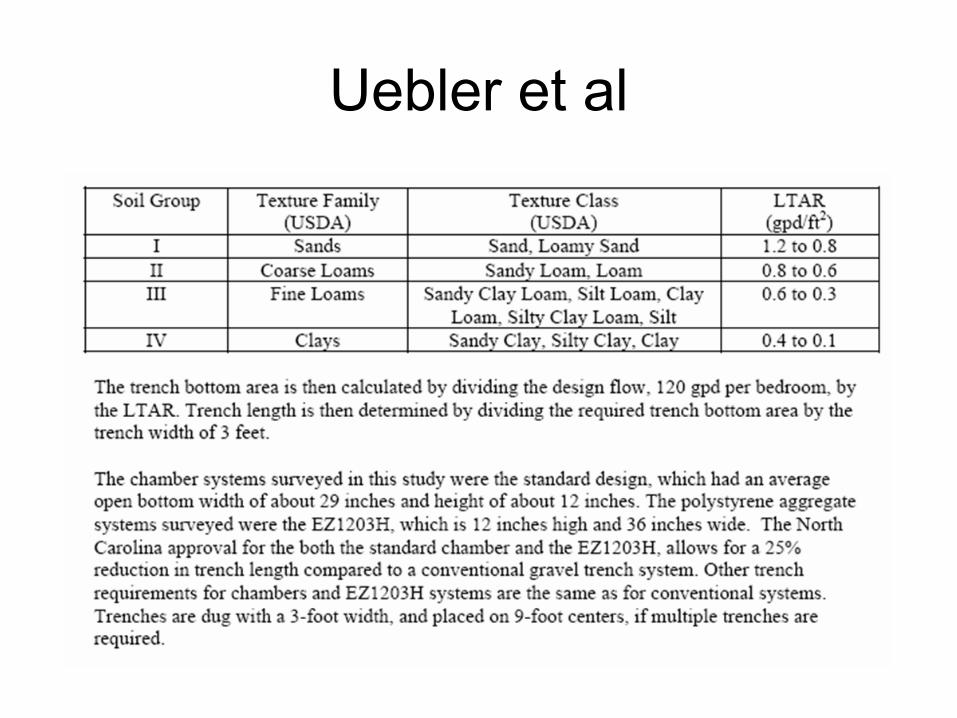
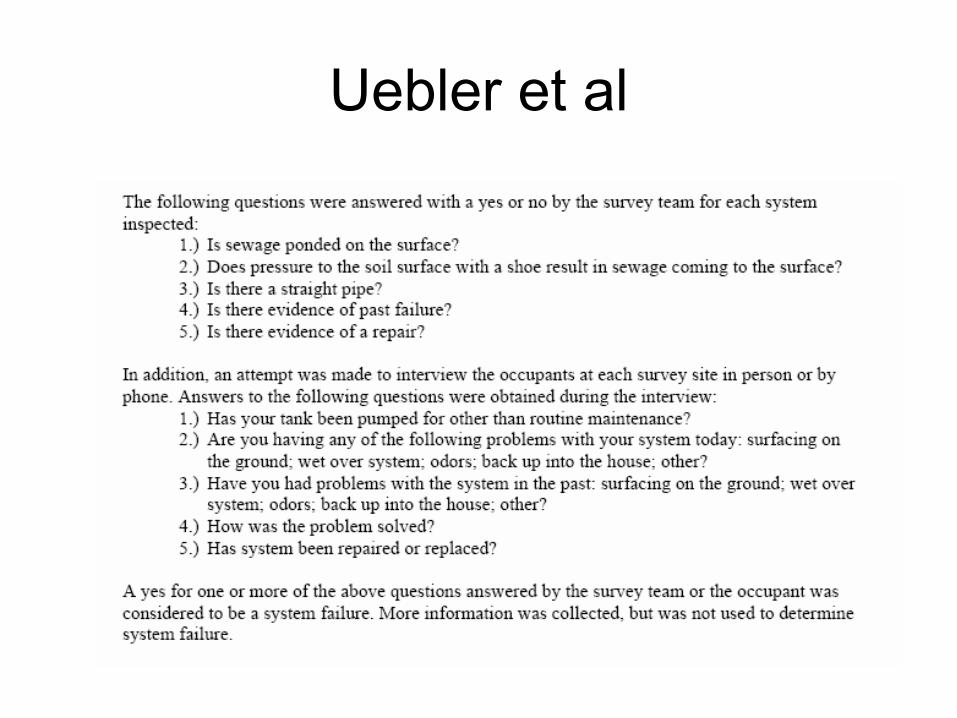
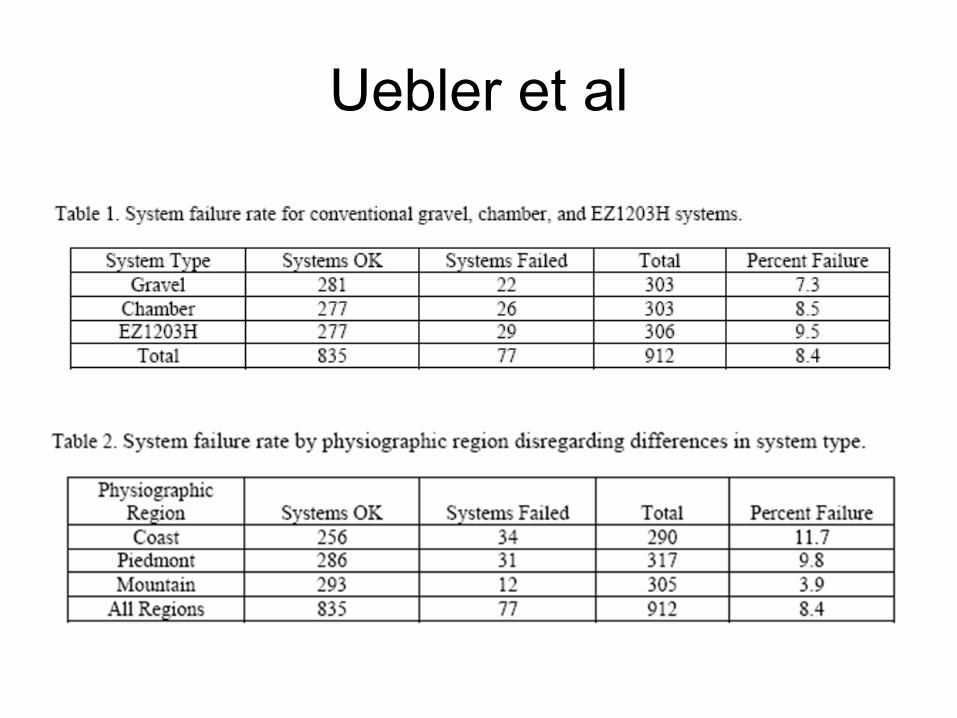
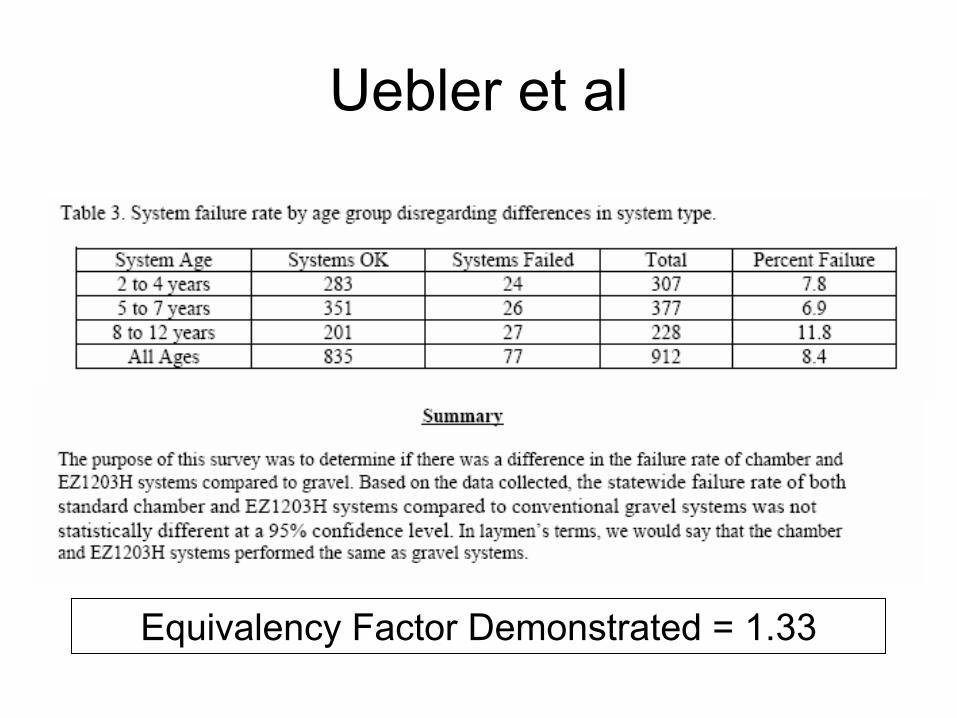
Uebler et al. 2006. Performance of Chamber and EZ1203H Systems Compared to Conventional Gravel Septic Tank Systems in North Carolina, , Proceedings of NOWRA
Field evaluation of failure rates of approximately 300 of each
type system (gravel, chamber, EPS) 2-12 years old
1.4
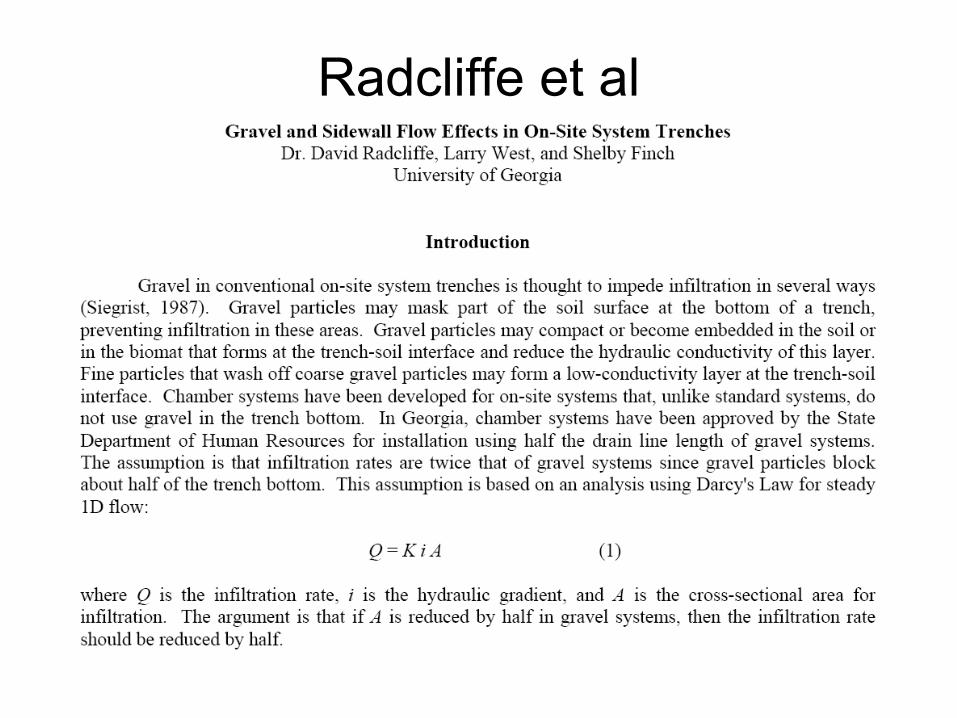
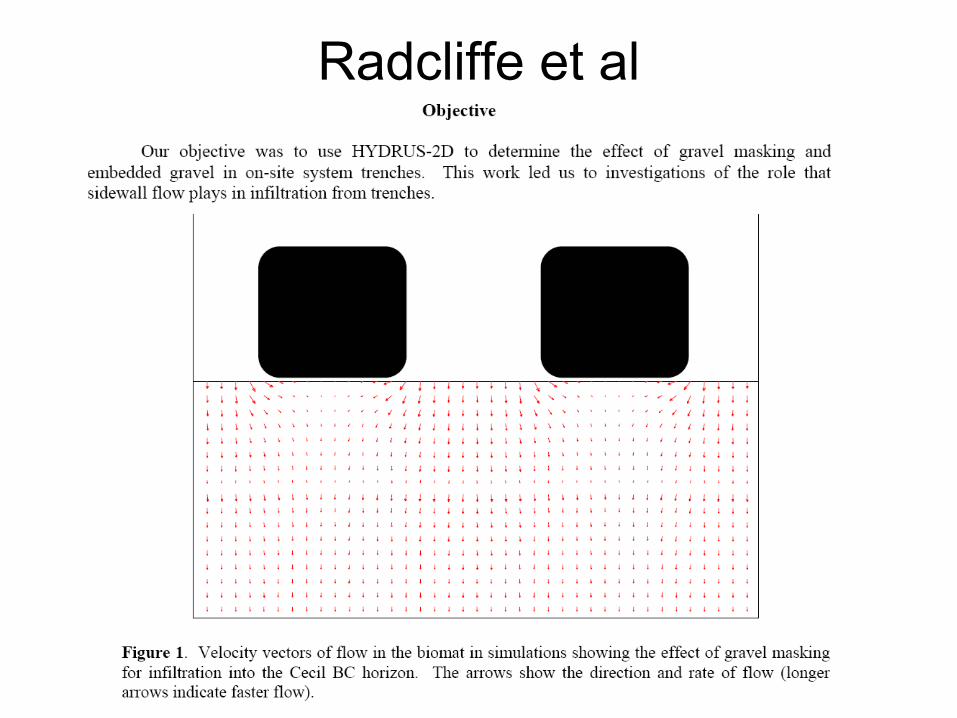
Radcliffe et al. 2005. Gravel and Sidewall Flow Effects in On-Site System Trenches, , Soil Science Society of
America Journal
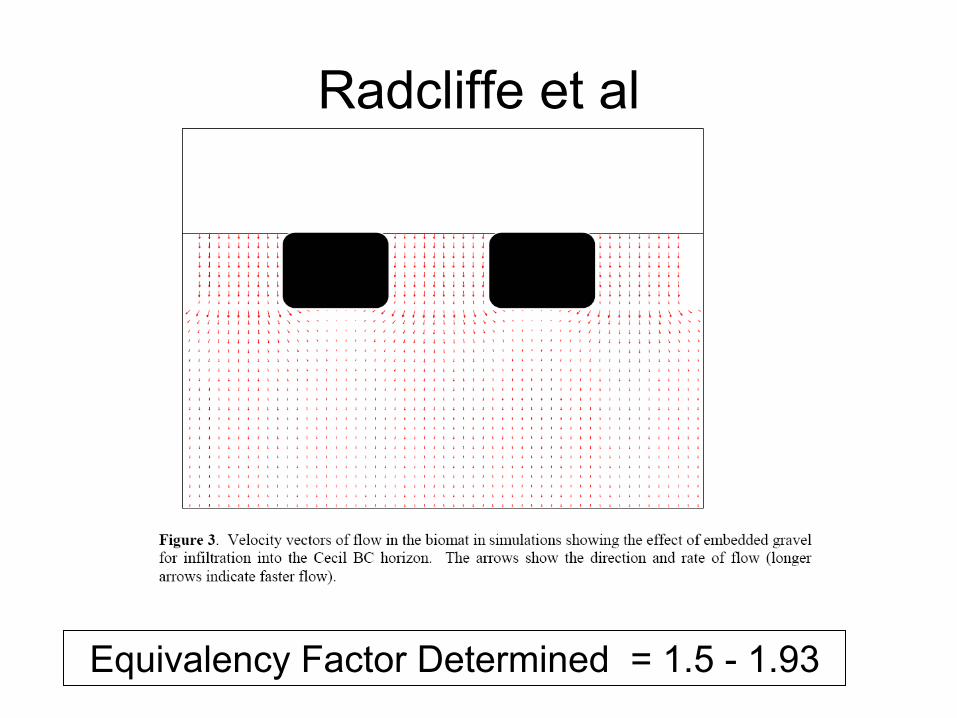
Two dimensional computer model (HYDRUS-2D)
1.5 –
1.93
Radcliffe et al
Radcliffe et al
Radcliffe et al
Equivalency Factor Determined = 1.5 -
1.93
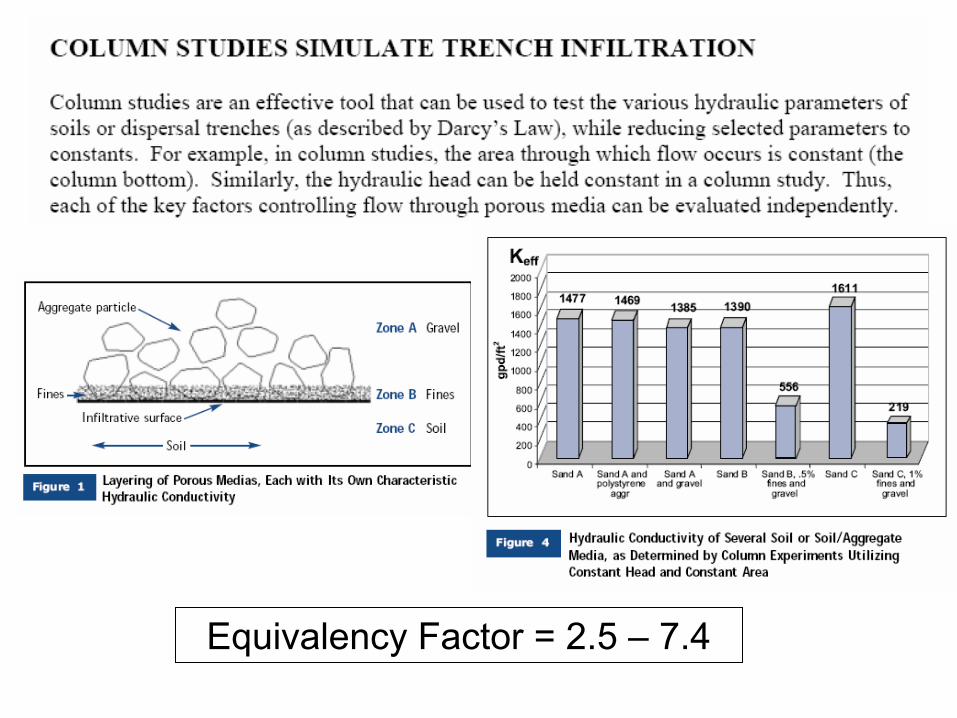
Equivalency Factor = 2.5 –
7.4
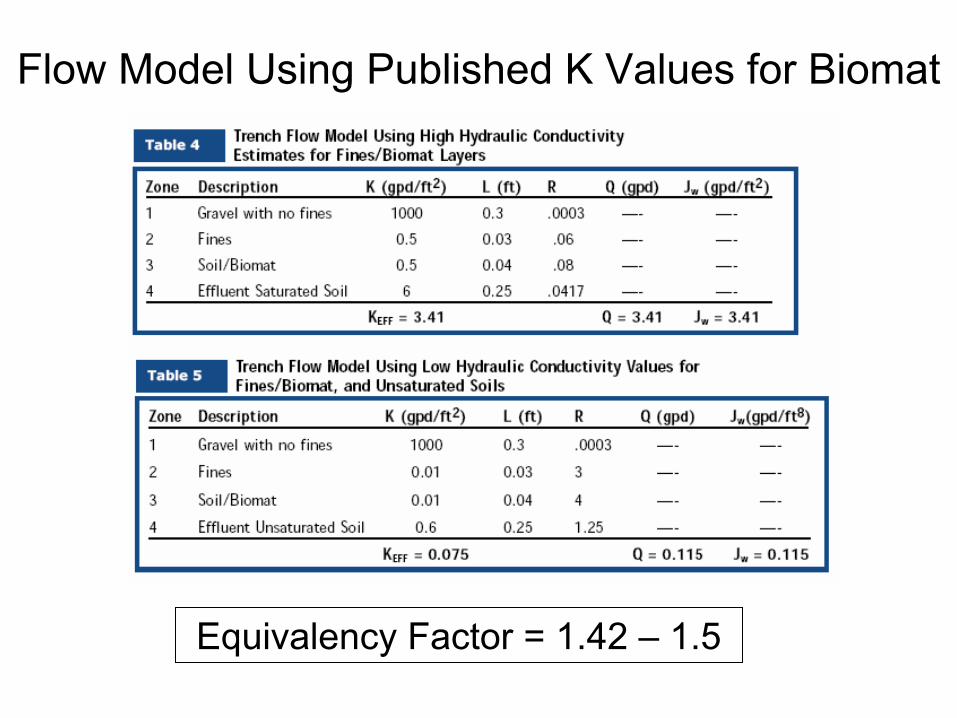
Flow Model Using Published K Values for Biomat
Equivalency Factor = 1.42 –
1.5
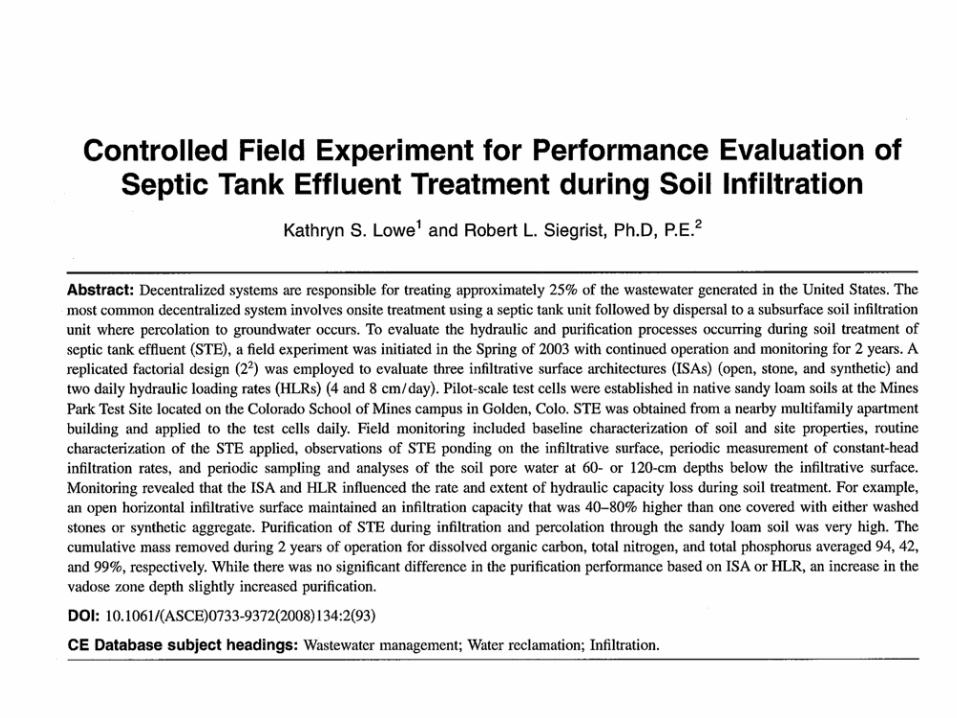
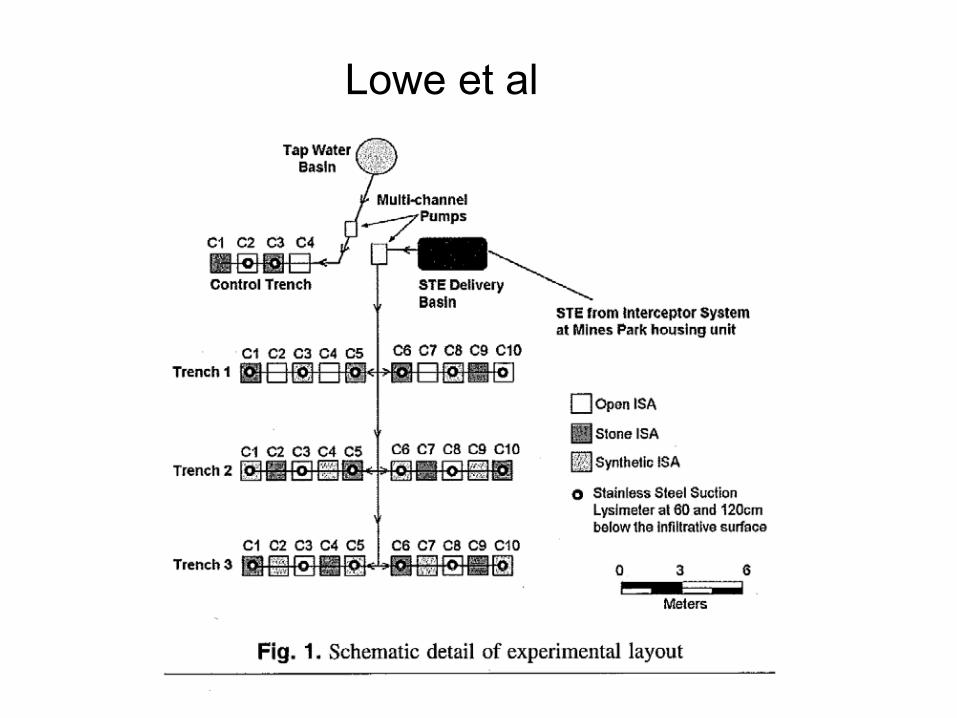
Lowe et al
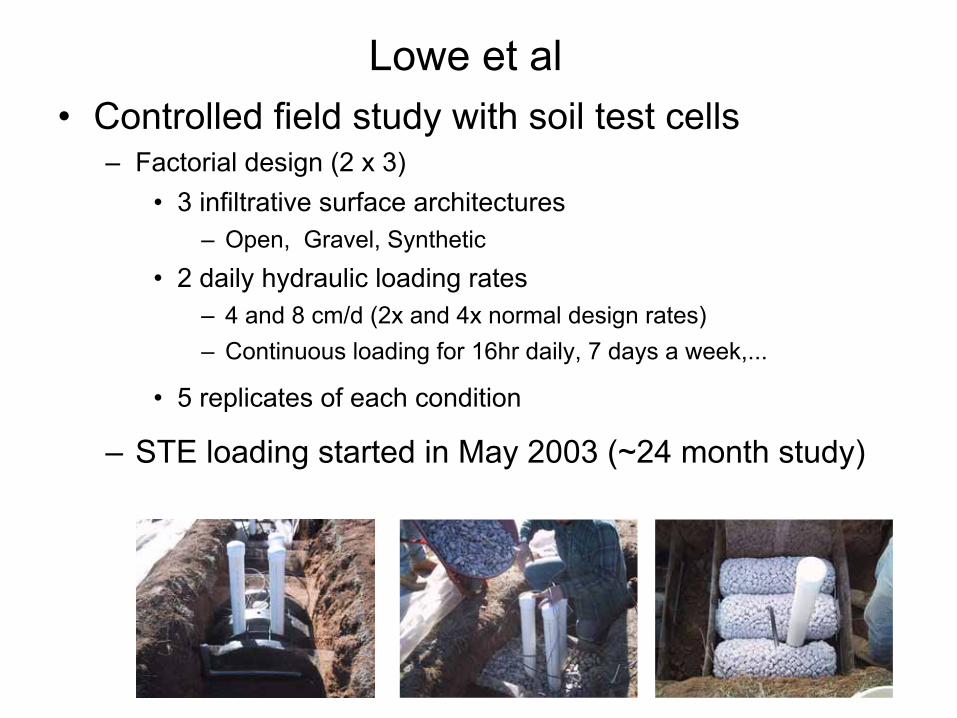
•
Controlled field study with soil test cells–
Factorial design (2 x 3)•
3 infiltrative surface architectures –
Open, Gravel, Synthetic•
2 daily hydraulic loading rates –
4 and 8 cm/d (2x and 4x normal design rates)–
Continuous loading for 16hr daily, 7 days a week,...
•
5 replicates of each condition
–
STE loading started in May 2003 (~24 month study)
Lowe et al
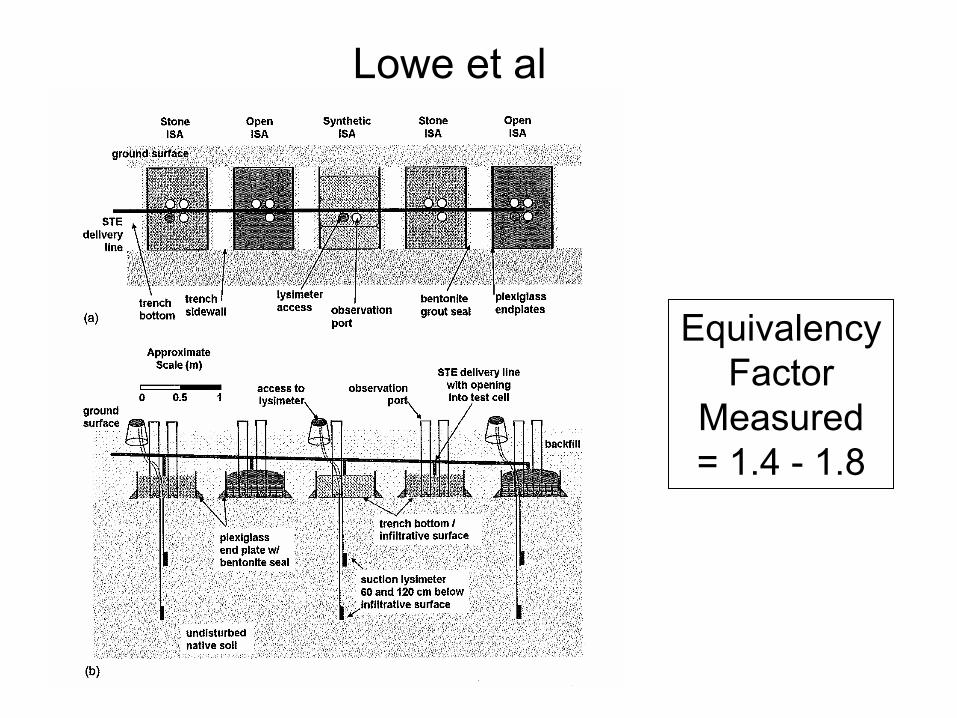
Equivalency Factor
Measured = 1.4 -
1.8
Lowe et al
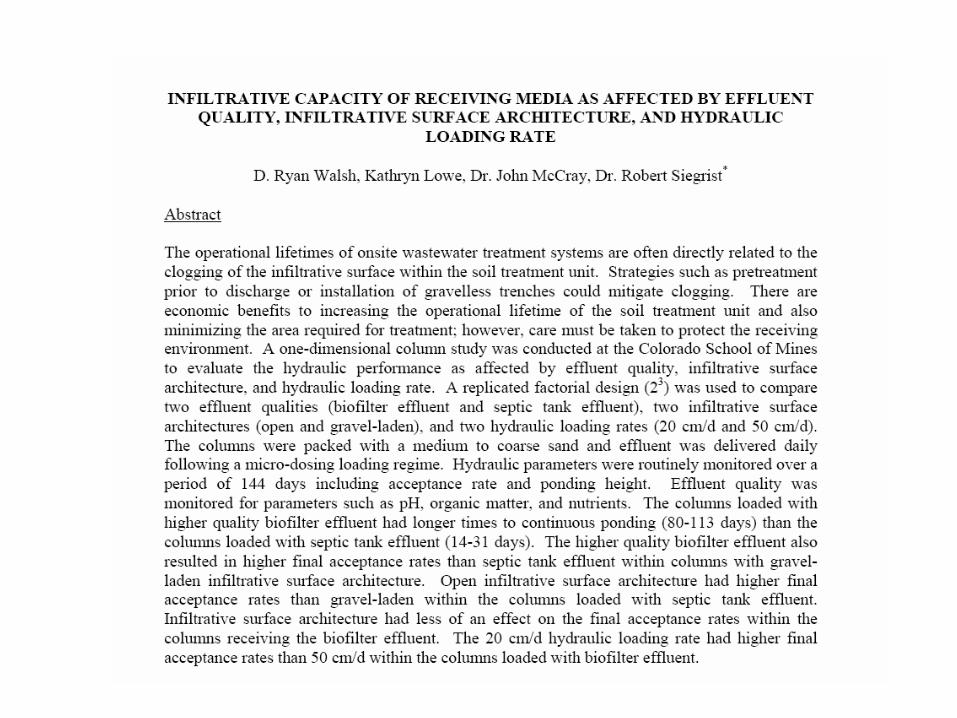
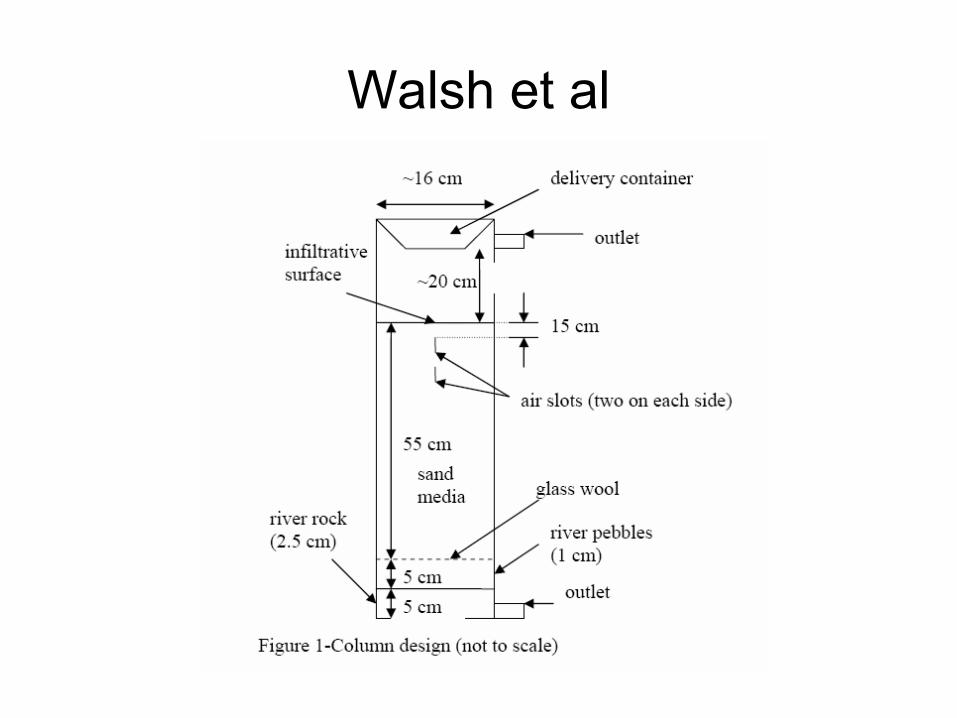
Walsh et al
Walsh et al
Walsh et al
Walsh et al
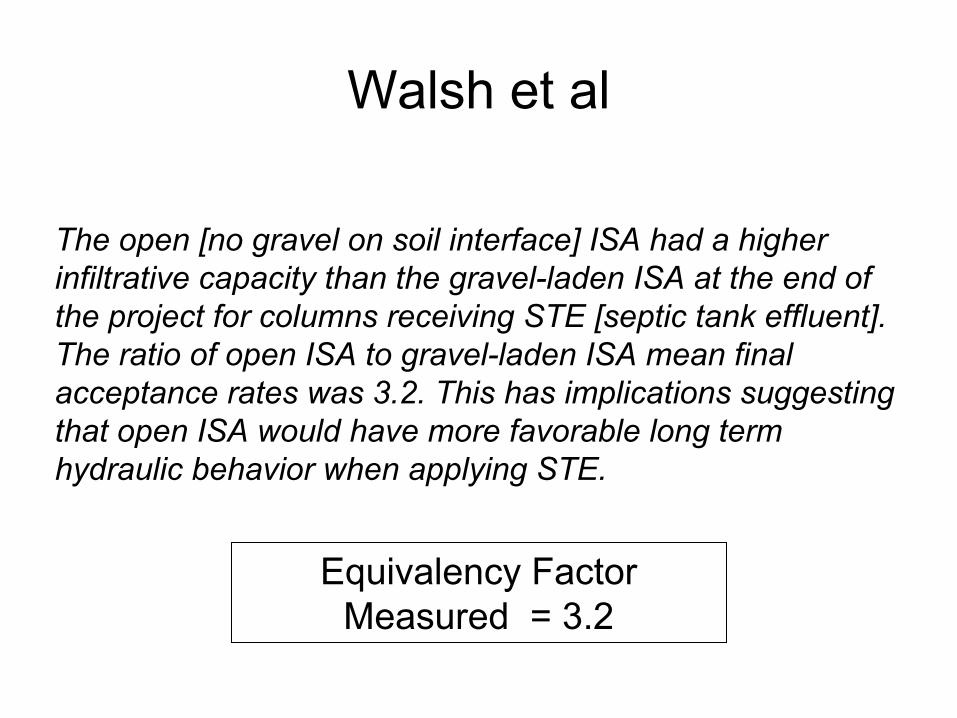
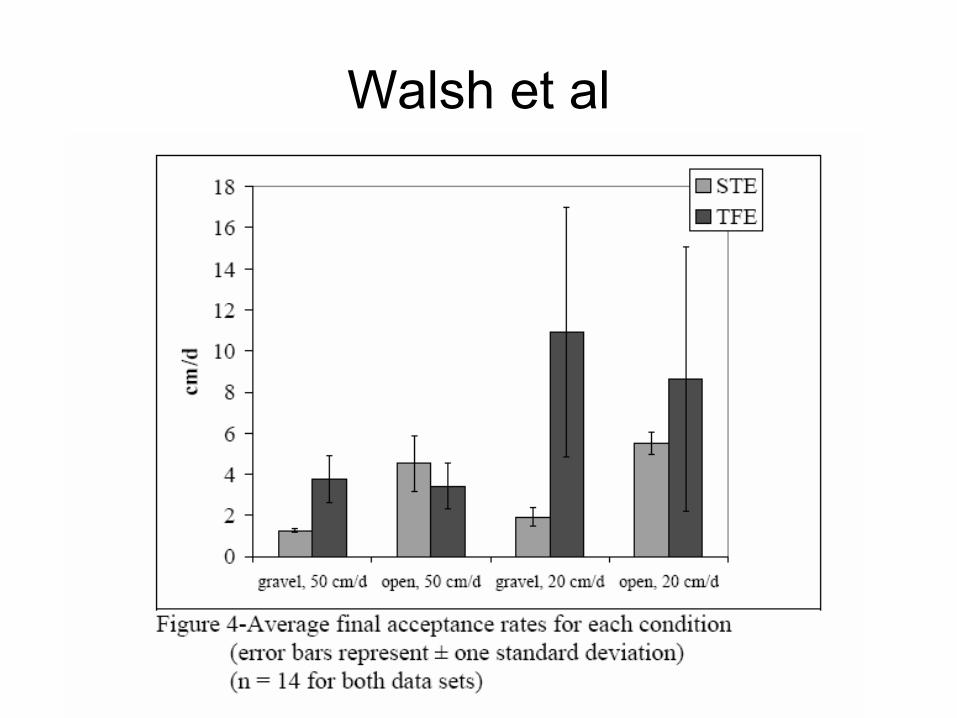
The open [no gravel on soil interface] ISA had a higher infiltrative capacity than the gravel-laden ISA at the end of the project for columns receiving STE [septic tank effluent]. The ratio of open ISA to gravel-laden ISA mean final acceptance rates was 3.2. This has implications suggesting that open ISA would have more favorable long term hydraulic behavior when applying STE.
Walsh et al
Equivalency Factor Measured = 3.2
Uebler et al
Uebler et al
Uebler et al
Uebler et al
Uebler et al
Equivalency Factor Demonstrated = 1.33
Technical Summary
Demonstrated Equivalency Factor Range:
1.33 –
3.2
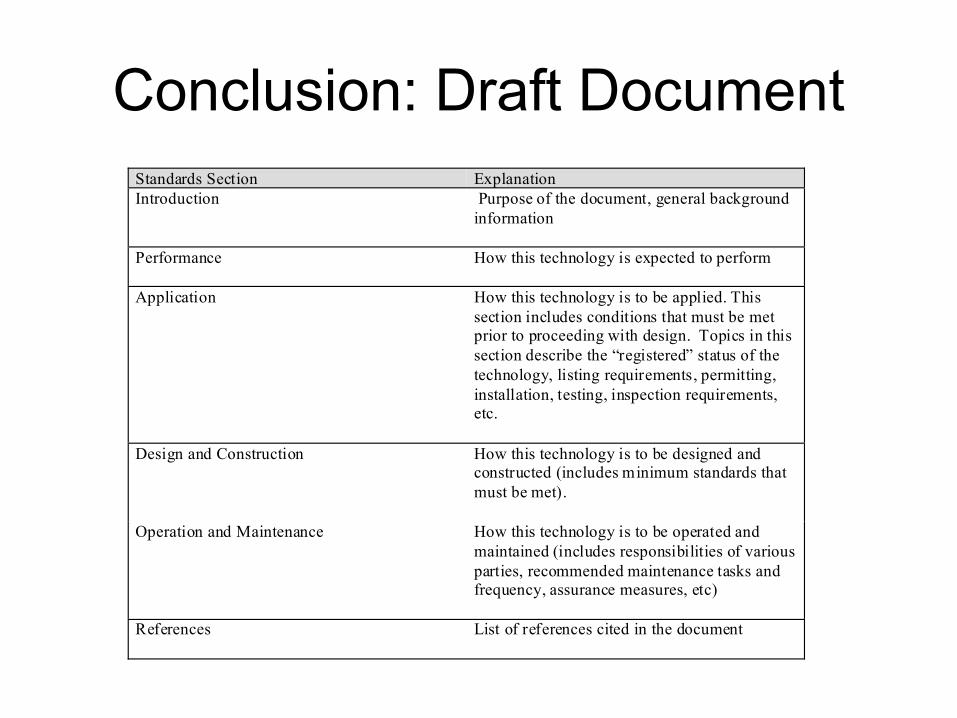
Conclusion: Draft DocumentStandards Section Explanation Introduction Purpose of the document, general background
information
Performance How this technology is expected to perform
Application How this technology is to be applied. This section includes conditions that must be met prior to proceeding with design. Topics in this section describe the “registered” status of the technology, listing requirements, permitting, installation, testing, inspection requirements, etc.
Design and Construction How this technology is to be designed and constructed (includes minimum standards that must be met).
Operation and Maintenance How this technology is to be operated and maintained (includes responsibilities of various parties, recommended maintenance tasks and frequency, assurance measures, etc)
References List of references cited in the document
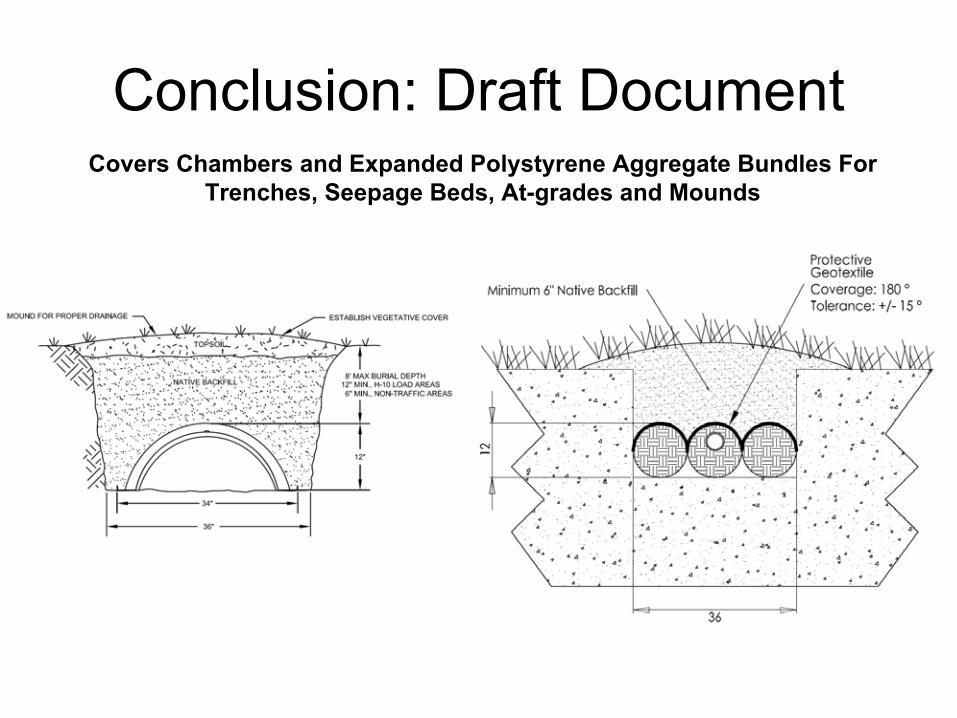
Conclusion: Draft DocumentCovers Chambers and Expanded Polystyrene Aggregate Bundles For
Trenches, Seepage Beds, At-grades and Mounds
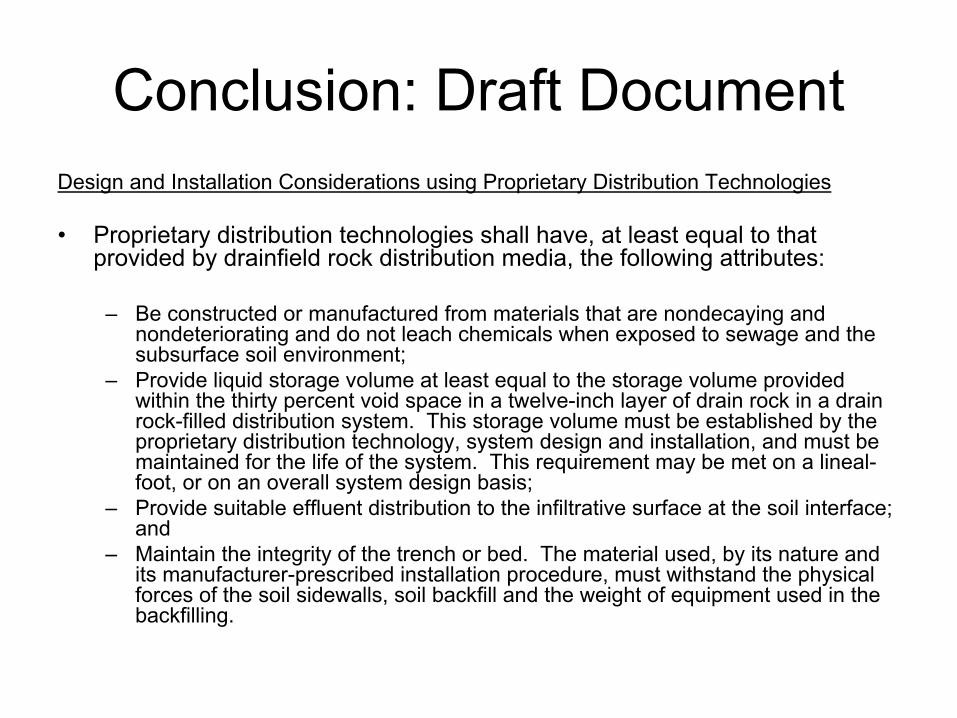
Conclusion: Draft DocumentDesign and Installation Considerations using Proprietary Distribution Technologies
•
Proprietary distribution technologies shall have, at least equal
to that provided by drainfield rock distribution media, the following attributes:
–
Be constructed or manufactured from materials that are nondecaying and nondeteriorating and do not leach chemicals when exposed to sewage and the subsurface soil environment;
–
Provide liquid storage volume at least equal to the storage volume provided within the thirty percent void space in a twelve-inch layer of drain rock in a drain rock-filled distribution system. This storage volume must be established by the proprietary distribution technology, system design and installation, and must be maintained for the life of the system. This requirement may be met on a lineal-
foot, or on an overall system design basis;
–
Provide suitable effluent distribution to the infiltrative surface at the soil interface; and
–
Maintain the integrity of the trench or bed. The material used,
by its nature and its manufacturer-prescribed installation procedure, must withstand the physical forces of the soil sidewalls, soil backfill and the weight of equipment used in the backfilling.
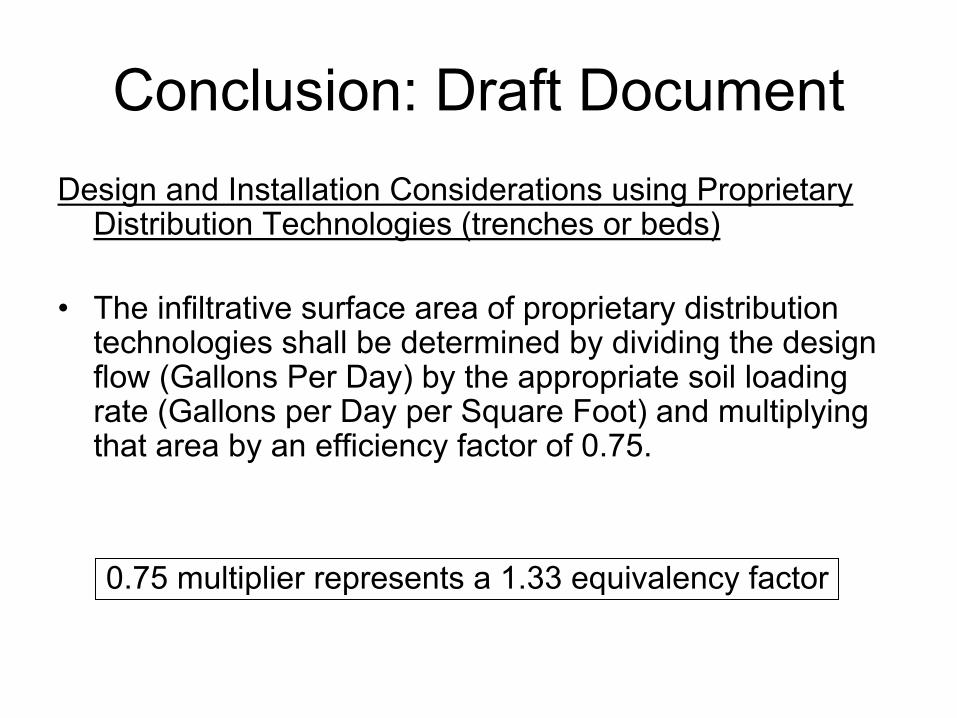
Conclusion: Draft DocumentDesign and Installation Considerations using Proprietary
Distribution Technologies (trenches or beds)
•
The infiltrative surface area of proprietary distribution technologies shall be determined by dividing the design flow (Gallons Per Day) by the appropriate soil loading rate (Gallons per Day per Square Foot) and multiplying that area by an efficiency factor of 0.75.
0.75 multiplier represents a 1.33 equivalency factor
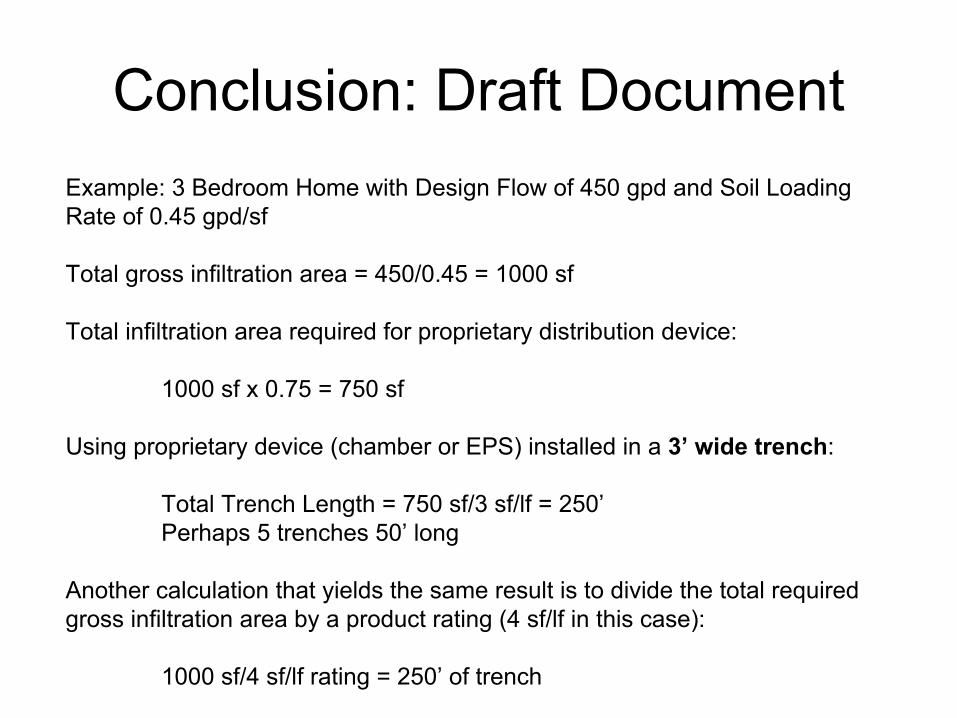
Conclusion: Draft DocumentExample: 3 Bedroom Home with Design Flow of 450 gpd and Soil Loading Rate of 0.45 gpd/sf
Total gross infiltration area = 450/0.45 = 1000 sf
Total infiltration area required for proprietary distribution device:
1000 sf x 0.75 = 750 sf
Using proprietary device (chamber or EPS) installed in a 3’ wide trench:
Total Trench Length = 750 sf/3 sf/lf = 250’Perhaps 5 trenches 50’ long
Another calculation that yields the same result is to divide the
total required gross infiltration area by a product rating (4 sf/lf in this case):
1000 sf/4 sf/lf rating = 250’ of trench
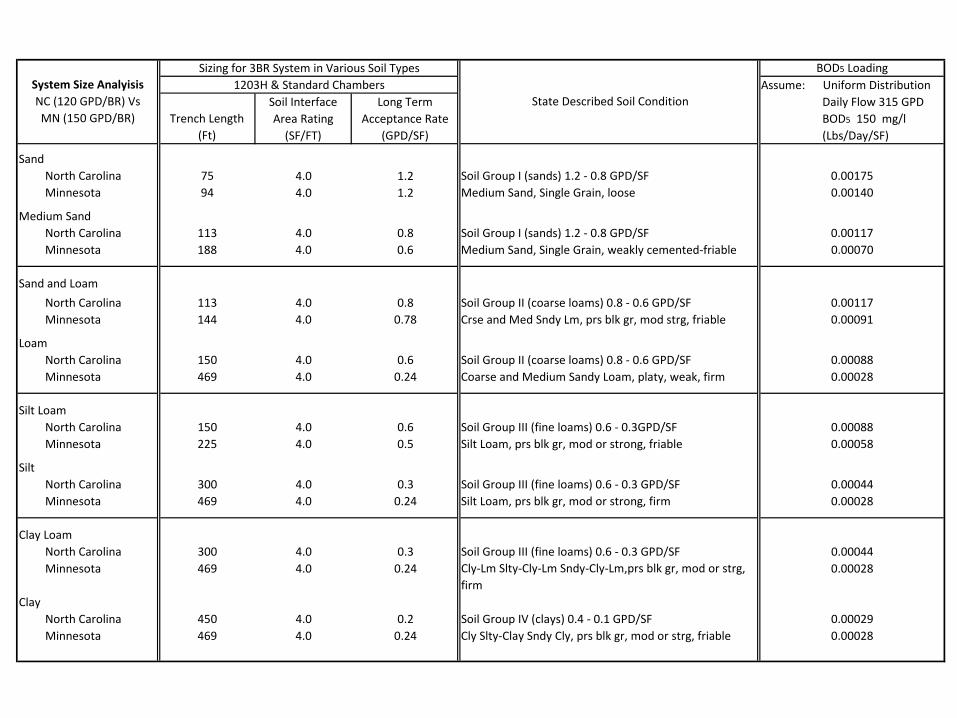
BOD5 LoadingAssume: Uniform Distribution
Trench Length (Ft)
Soil Interface Area Rating
(SF/FT)
Long Term Acceptance Rate
(GPD/SF)
Daily Flow 315 GPD BOD5 150 mg/l (Lbs/Day/SF)
SandNorth Carolina 75 4.0 1.2 Soil Group I (sands) 1.2 - 0.8 GPD/SF 0.00175Minnesota 94 4.0 1.2 Medium Sand, Single Grain, loose 0.00140
Medium SandNorth Carolina 113 4.0 0.8 Soil Group I (sands) 1.2 - 0.8 GPD/SF 0.00117Minnesota 188 4.0 0.6 Medium Sand, Single Grain, weakly cemented-friable 0.00070
Sand and Loam
North Carolina 113 4.0 0.8 Soil Group II (coarse loams) 0.8 - 0.6 GPD/SF 0.00117Minnesota 144 4.0 0.78 Crse and Med Sndy Lm, prs blk gr, mod strg, friable 0.00091
LoamNorth Carolina 150 4.0 0.6 Soil Group II (coarse loams) 0.8 - 0.6 GPD/SF 0.00088Minnesota 469 4.0 0.24 Coarse and Medium Sandy Loam, platy, weak, firm 0.00028
Silt LoamNorth Carolina 150 4.0 0.6 Soil Group III (fine loams) 0.6 - 0.3GPD/SF 0.00088Minnesota 225 4.0 0.5 Silt Loam, prs blk gr, mod or strong, friable 0.00058
SiltNorth Carolina 300 4.0 0.3 Soil Group III (fine loams) 0.6 - 0.3 GPD/SF 0.00044Minnesota 469 4.0 0.24 Silt Loam, prs blk gr, mod or strong, firm 0.00028
Clay LoamNorth Carolina 300 4.0 0.3 Soil Group III (fine loams) 0.6 - 0.3 GPD/SF 0.00044Minnesota 469 4.0 0.24 Cly-Lm Slty-Cly-Lm Sndy-Cly-Lm,prs blk gr, mod or strg,
firm0.00028
ClayNorth Carolina 450 4.0 0.2 Soil Group IV (clays) 0.4 - 0.1 GPD/SF 0.00029Minnesota 469 4.0 0.24 Cly Slty-Clay Sndy Cly, prs blk gr, mod or strg, friable 0.00028
System Size Analyisis NC (120 GPD/BR) Vs MN (150 GPD/BR)
State Described Soil Condition1203H & Standard Chambers
Sizing for 3BR System in Various Soil Types
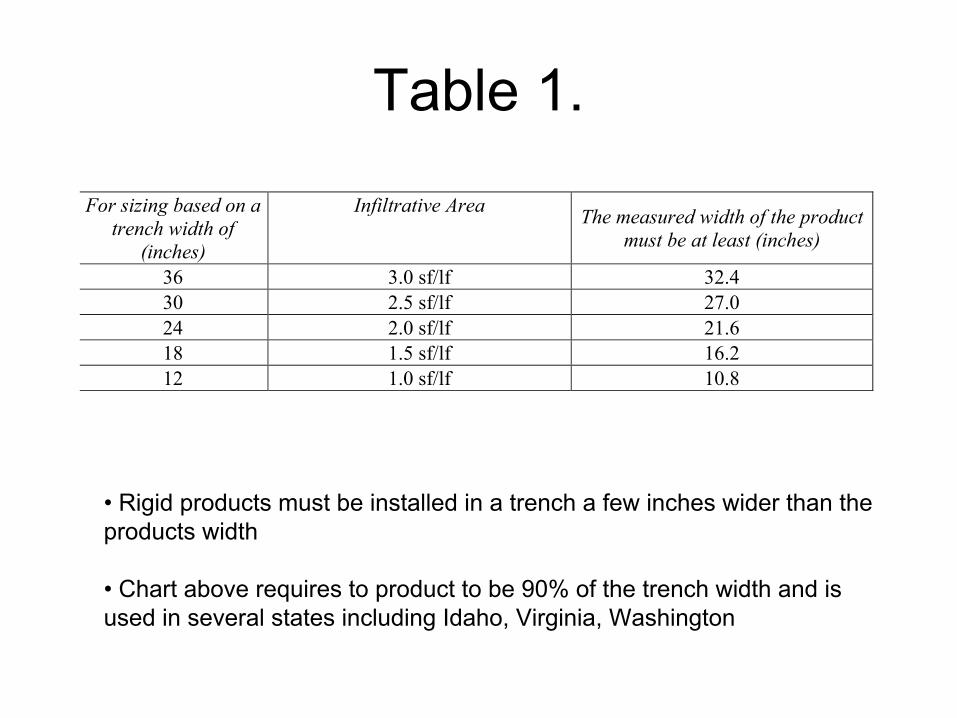
Table 1.
For sizing based on a trench width of
(inches)
Infiltrative Area The measured width of the product must be at least (inches)
36 3.0 sf/lf 32.4 30 2.5 sf/lf 27.0 24 2.0 sf/lf 21.6 18 1.5 sf/lf 16.2 12 1.0 sf/lf 10.8
•
Rigid products must be installed in a trench a few inches wider
than the products width
•
Chart above requires to product to be 90% of the trench width and is used in several states including Idaho, Virginia, Washington
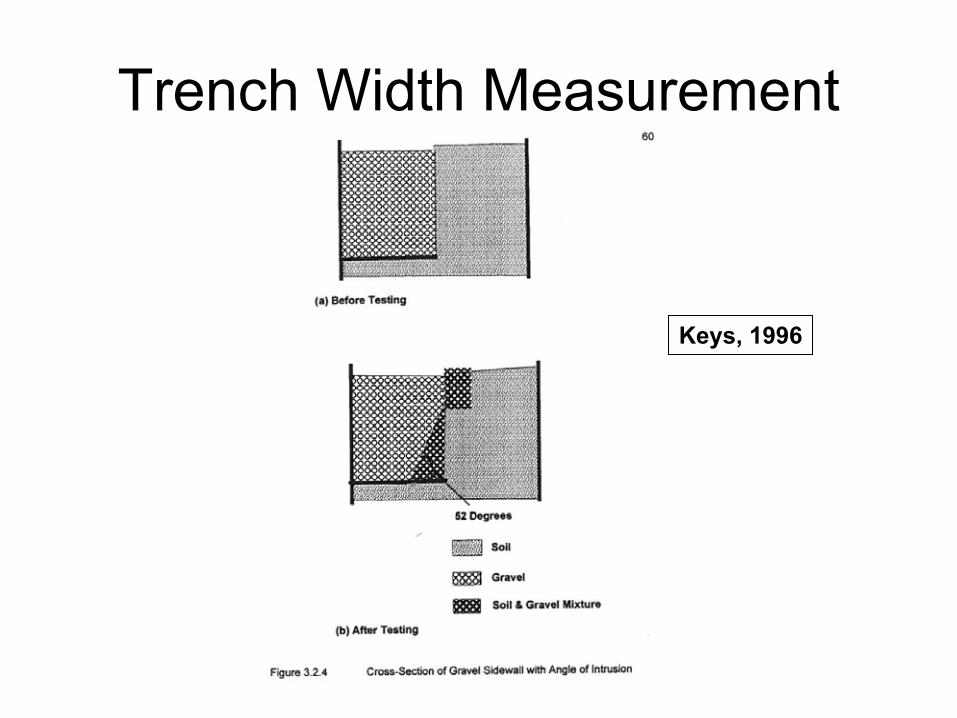
Trench Width Measurement
Keys, 1996
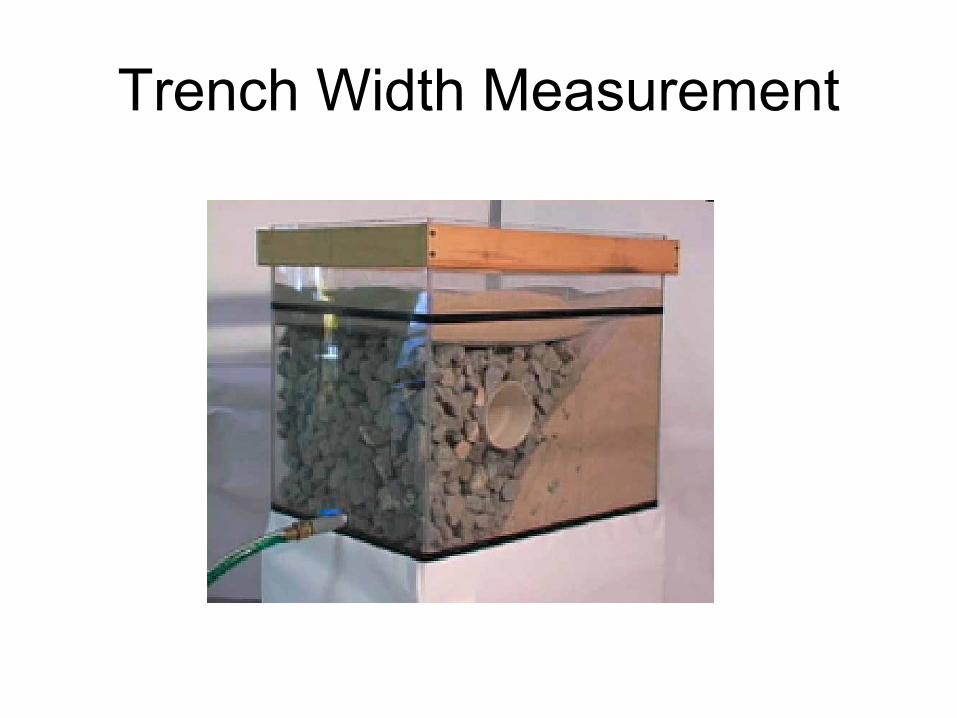
Trench Width Measurement
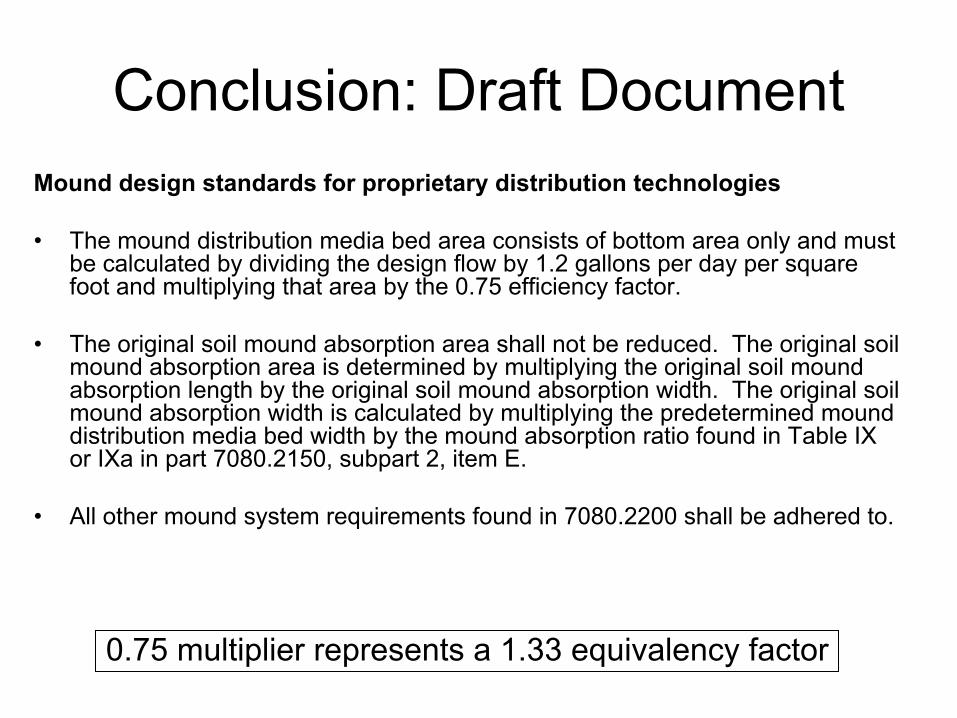
Conclusion: Draft DocumentMound design standards for proprietary distribution technologies
•
The mound distribution media bed area consists of bottom area only and must be calculated by dividing the design flow by 1.2 gallons per day
per square foot and multiplying that area by the 0.75 efficiency factor.
•
The original soil mound absorption area shall not be reduced. The original soil mound absorption area is determined by multiplying the original soil mound absorption length by the original soil mound absorption width. The original soil mound absorption width is calculated by multiplying the predetermined mound distribution media bed width by the mound absorption ratio found
in Table IX or IXa in part 7080.2150, subpart 2, item E.
•
All other mound system requirements found in 7080.2200 shall be adhered to.
0.75 multiplier represents a 1.33 equivalency factor
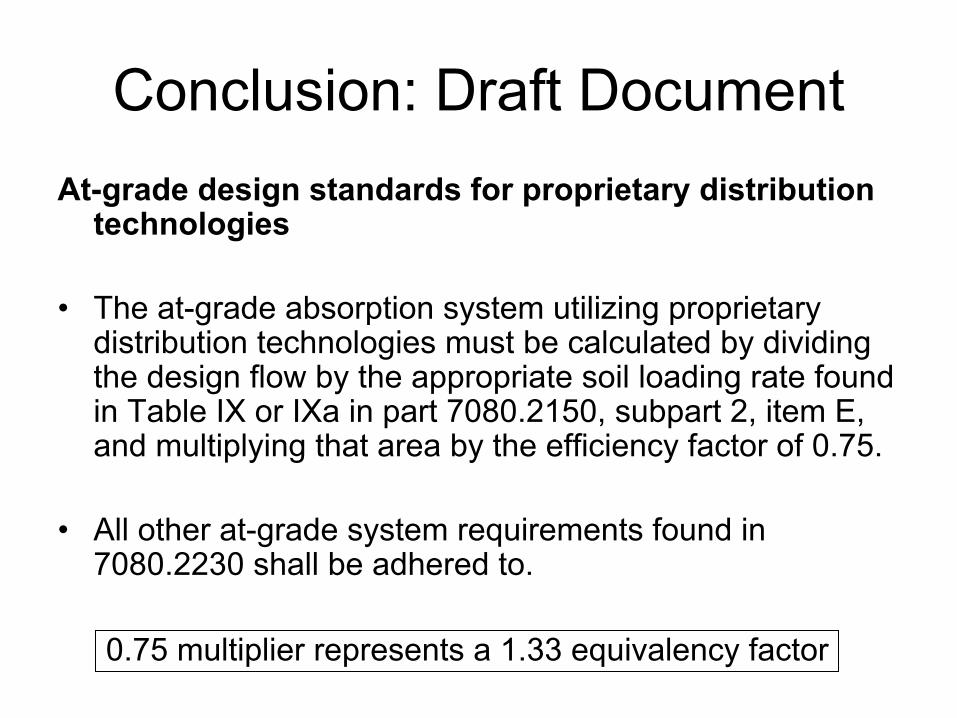
Conclusion: Draft DocumentAt-grade design standards for proprietary distribution
technologies
•
The at-grade absorption system utilizing proprietary distribution technologies must be calculated by dividing the design flow by the appropriate soil loading rate found in Table IX or IXa in part 7080.2150, subpart 2, item E, and multiplying that area by the efficiency factor of 0.75.
•
All other at-grade system requirements found in 7080.2230 shall be adhered to.
0.75 multiplier represents a 1.33 equivalency factor
Going Forward
•
Develop guidance document to cover these proprietary distribution devices–
once adopted we see no need for the for the “warranty” system sizing –
1.67 multiplier (40%
reduction)•
With a general guidance document in place, individual submittals are relatively simple–
Dimensions of products
–
Installation instructions

Our Commitment
We’re in this for the long term.
Thank you.
Dick Bachelder, ADS/HancorBen Berteau, Ring Industrial GroupPeder Larson, Larkin Hoffman Daly & Lindgren Ltd.Carl Thompson, P.E., Infiltrator Systems, Inc.